Charts and Graphs PowerPoint Templates
-
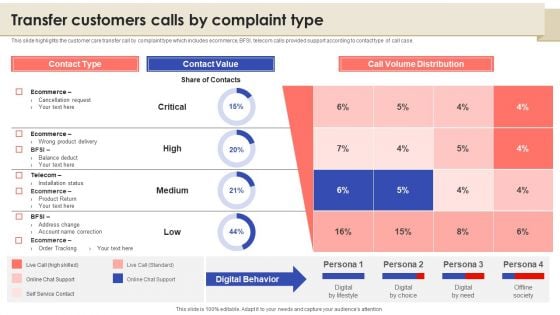
Call Center Quality Enhancement Plan Transfer Customers Calls By Complaint Type Guidelines PDF
This slide highlights the customer care transfer call by complaint type which includes ecommerce, BFSI, telecom calls provided support according to contact type of call case. From laying roadmaps to briefing everything in detail, our templates are perfect for you. You can set the stage with your presentation slides. All you have to do is download these easy to edit and customizable templates. Call Center Quality Enhancement Plan Transfer Customers Calls By Complaint Type Guidelines PDF will help you deliver an outstanding performance that everyone would remember and praise you for. Do download this presentation today.
-
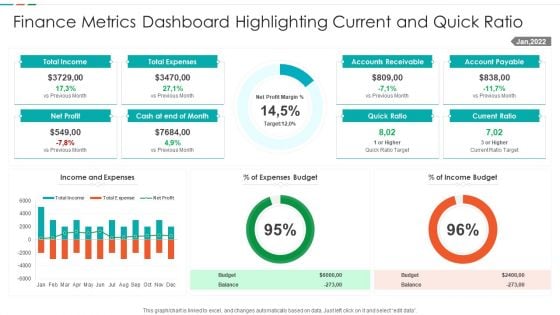
Finance Metrics Dashboard Highlighting Current And Quick Ratio Template PDF
This graph or chart is linked to excel, and changes automatically based on data. Just left click on it and select edit data. Showcasing this set of slides titled Finance Metrics Dashboard Highlighting Current And Quick Ratio Template PDF. The topics addressed in these templates are Total Income Budget, Total Expenses Balance, Net Profit Quick, Ratio Current Ratio. All the content presented in this PPT design is completely editable. Download it and make adjustments in color, background, font etc. as per your unique business setting.
-
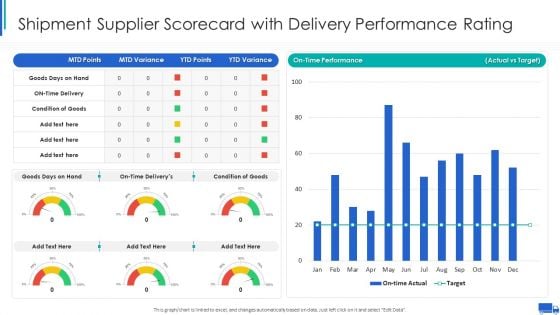
Shipment Supplier Scorecard With Delivery Performance Rating Ppt Ideas Graphic Tips PDF
This graph or chart is linked to excel, and changes automatically based on data. Just left click on it and select Edit Data. Deliver an awe inspiring pitch with this creative Shipment Supplier Scorecard With Delivery Performance Rating Ppt Ideas Graphic Tips PDF bundle. Topics like On Time Performance, Actual Vs Target, Goods Days Hand can be discussed with this completely editable template. It is available for immediate download depending on the needs and requirements of the user.
-

Financial Dashboard For Month Closing Income And Expenses Ideas PDF
This slide illustrates facts and figures related to month end financials of a corporation. It includes income statement graph, profit margin, income and expenditure graph etc.Showcasing this set of slides titled Financial Dashboard For Month Closing Income And Expenses Ideas PDF The topics addressed in these templates are Accounts Receivable, Income Statement, Expenditure All the content presented in this PPT design is completely editable. Download it and make adjustments in color, background, font etc. as per your unique business setting.
-
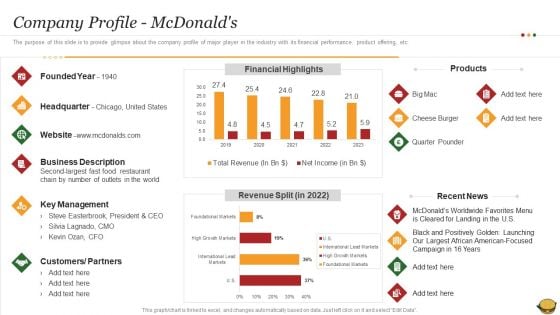
Hamburger Commerce Company Analysis Company Profile Mcdonalds Professional PDF
The purpose of this slide is to provide glimpse about the company profile of major player in the industry with its financial performance, product offering, etc Deliver an awe inspiring pitch with this creative Hamburger Commerce Company Analysis Company Profile Mcdonalds Professional PDF bundle. Topics like Business Description, Customers Or Partners, Key Management can be discussed with this completely editable template. It is available for immediate download depending on the needs and requirements of the user.
-
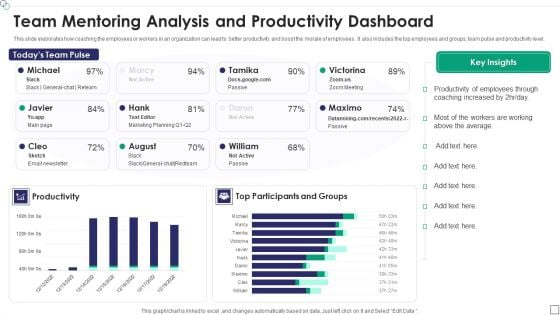
Team Mentoring Analysis And Productivity Dashboard Template PDF
This slide elaborates how coaching the employees or workers in an organization can lead to better productivity and boost the morale of employees . It also includes the top employees and groups, team pulse and productivity level.Showcasing this set of slides titled Team Mentoring Analysis And Productivity Dashboard Template PDF The topics addressed in these templates are Productivity Of Employees, Coaching Increased, Productivity All the content presented in this PPT design is completely editable. Download it and make adjustments in color, background, font etc. as per your unique business setting.
-
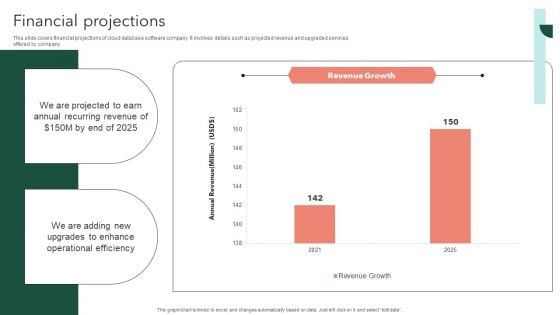
Airtable Capital Funding Pitch Deck Financial Projections Introduction PDF
This slide covers financial projections of cloud database software company. It involves details such as projected revenue and upgraded services offered by company. Get a simple yet stunning designed Airtable Capital Funding Pitch Deck Financial Projections Introduction PDF. It is the best one to establish the tone in your meetings. It is an excellent way to make your presentations highly effective. So, download this PPT today from Slidegeeks and see the positive impacts. Our easy to edit Airtable Capital Funding Pitch Deck Financial Projections Introduction PDF can be your go to option for all upcoming conferences and meetings. So, what are you waiting for Grab this template today.
-
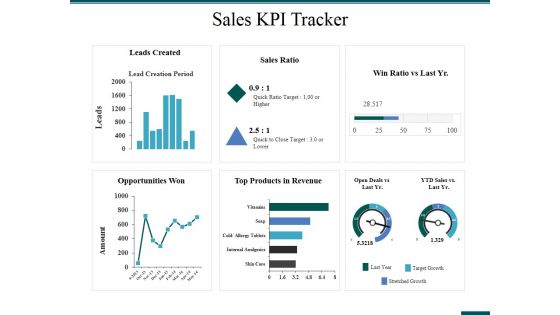
Sales Kpi Tracker Ppt PowerPoint Presentation Pictures Designs
This is a sales kpi tracker ppt powerpoint presentation pictures designs. This is a two stage process. The stages in this process are leads created, sales ratio, opportunities won, top products in revenue, win ratio vs last yr.
-
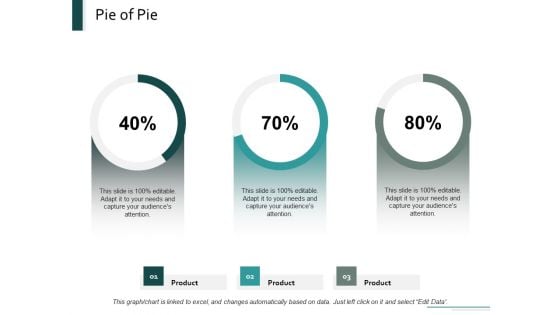
Pie Of Pie Marketing Ppt Powerpoint Presentation Inspiration Designs
This is a pie of pie marketing ppt powerpoint presentation inspiration designs. This is a three stage process. The stages in this process are finance, pie chart, product, marketing, percentage.
-
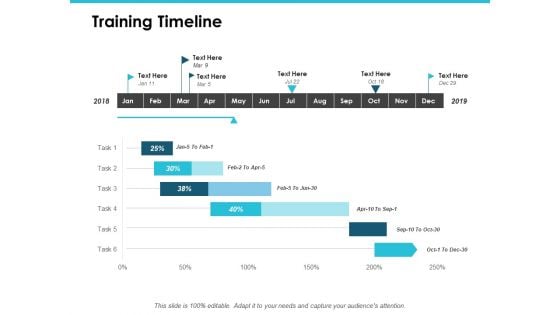
Training Timeline Ppt PowerPoint Presentation Outline Templates
This is a training timeline ppt powerpoint presentation outline templates. This is a five stage process. The stages in this process are finance, marketing, management, investment, analysis.
-
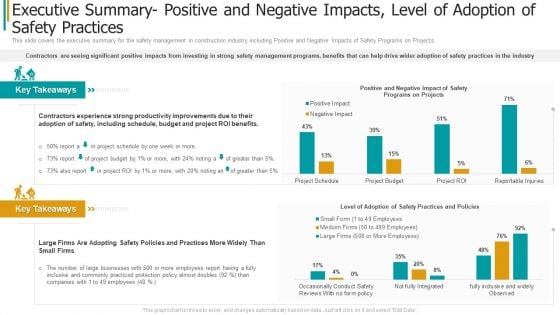
Construction Sector Project Risk Management Executive Summary Positive And Negative Impacts Level Of Adoption Of Safety Practices Graphics PDF
This slide covers the executive summary for the safety management in construction industry including Positive and Negative Impacts of Safety Programs on Projects. Deliver and pitch your topic in the best possible manner with this construction sector project risk management executive summary positive and negative impacts level of adoption of safety practices graphics pdf. Use them to share invaluable insights on improvements, policies, businesses, budget and impress your audience. This template can be altered and modified as per your expectations. So, grab it now.
-
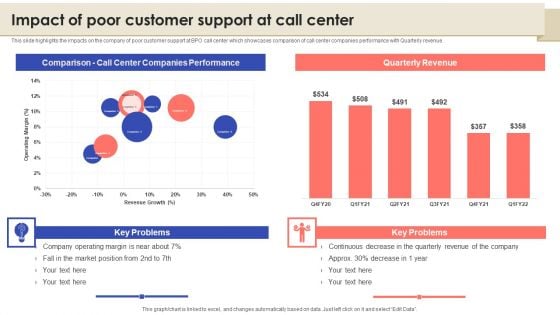
Call Center Quality Enhancement Plan Impact Of Poor Customer Support At Call Center Diagrams PDF
This slide highlights the impacts on the company of poor customer support at BPO call center which showcases comparison of call center companies performance with Quarterly revenue. This Call Center Quality Enhancement Plan Impact Of Poor Customer Support At Call Center Diagrams PDF from Slidegeeks makes it easy to present information on your topic with precision. It provides customization options, so you can make changes to the colors, design, graphics, or any other component to create a unique layout. It is also available for immediate download, so you can begin using it right away. Slidegeeks has done good research to ensure that you have everything you need to make your presentation stand out. Make a name out there for a brilliant performance.
-
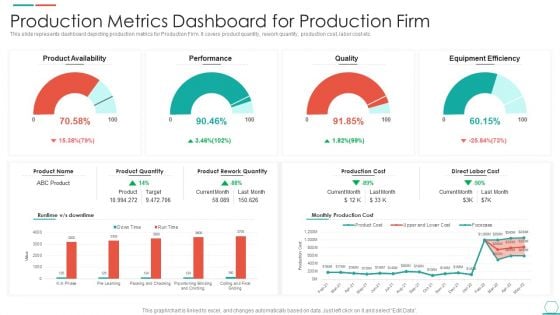
Production Metrics Dashboard For Production Firm Rules PDF
This slide represents dashboard depicting production metrics for Production Firm. It covers product quantity, rework quantity, production cost, labor cost etc. Showcasing this set of slides titled Production Metrics Dashboard For Production Firm Rules PDF. The topics addressed in these templates are Equipment Efficiency, Product Availability, Production Cost. All the content presented in this PPT design is completely editable. Download it and make adjustments in color, background, font etc. as per your unique business setting.
-

Summary Financial Accounting Statement Profit And Loss Analysis Dashboard Elements PDF
This graph or chart is linked to excel, and changes automatically based on data. Just left click on it and select Edit Data. Deliver an awe inspiring pitch with this creative Summary Financial Accounting Statement Profit And Loss Analysis Dashboard Elements PDF bundle. Topics like P And L Structure Dynamics, Dupont Rations, Debt Coverage Ratios, Creditworthiness Assessment can be discussed with this completely editable template. It is available for immediate download depending on the needs and requirements of the user.
-
Business Diagram Laptop With Data Driven Area Chart PowerPoint Slide
This diagram has been designed with laptop and data driven area chart. Download this diagram to give your presentations more effective look. It helps in clearly conveying your message to clients and audience.
-
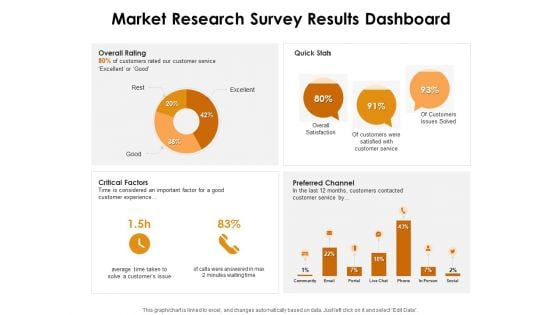
KPI Dashboards Per Industry Market Research Survey Results Dashboard Ppt PowerPoint Presentation Infographic Template Layout Ideas PDF
Deliver and pitch your topic in the best possible manner with this kpi dashboards per industry market research survey results dashboard ppt powerpoint presentation infographic template layout ideas pdf. Use them to share invaluable insights on overall rating, quick stats, critical factors, preferred channel and impress your audience. This template can be altered and modified as per your expectations. So, grab it now.
-
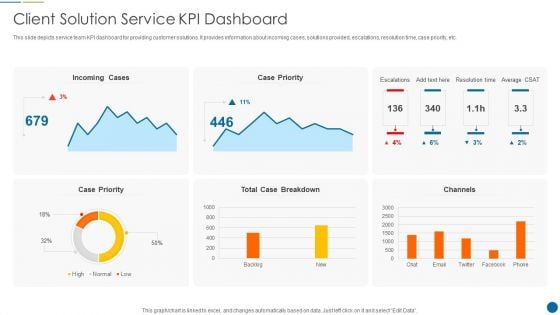
Client Solution Service Kpi Dashboard Sample PDF
This slide depicts service team KPI dashboard for providing customer solutions. It provides information about incoming cases, solutions provided, escalations, resolution time, case priority, etc. Showcasing this set of slides titled Client Solution Service Kpi Dashboard Sample PDF. The topics addressed in these templates are Client Solution Service KPI Dashboard. All the content presented in this PPT design is completely editable. Download it and make adjustments in color, background, font etc. as per your unique business setting
-
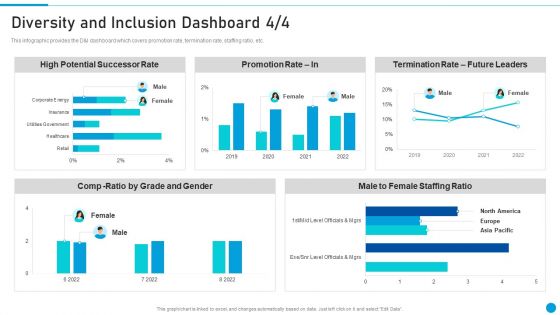
Embed Diversity And Inclusion Diversity And Inclusion Dashboard Introduction PDF
This infographic provides the D And I dashboard which covers promotion rate, termination rate, staffing ratio, etc. Deliver and pitch your topic in the best possible manner with this Embed Diversity And Inclusion Diversity And Inclusion Dashboard Introduction PDF. Use them to share invaluable insights on High Potential Successor Rate, Promotion Rate In, Termination Rate Future Leaders, Male To Female Staffing Ratio and impress your audience. This template can be altered and modified as per your expectations. So, grab it now.
-
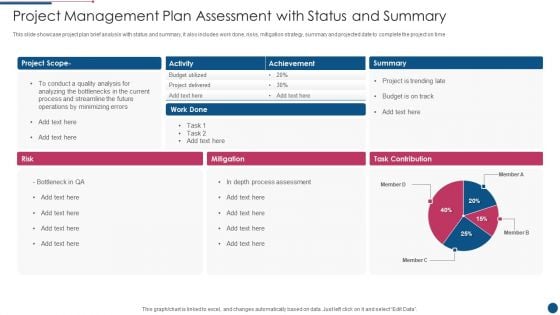
Project Management Plan Assessment With Status And Summary Download PDF
This slide showcase project plan brief analysis with status and summary, it also includes work done, risks, mitigation strategy, summary and projected date to complete the project on time. Showcasing this set of slides titled Project Management Plan Assessment With Status And Summary Download PDF. The topics addressed in these templates are Analysis, Budget Utilized, Achievement. All the content presented in this PPT design is completely editable. Download it and make adjustments in color, background, font etc. as per your unique business setting.
-
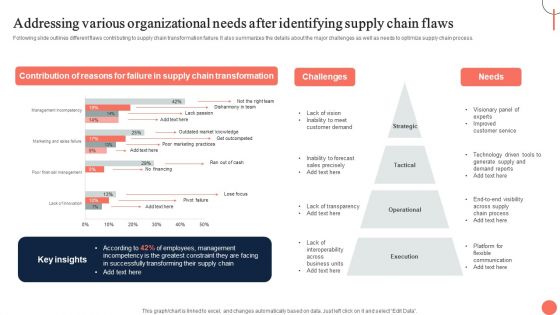
Strategies For Dynamic Supply Chain Agility Addressing Various Organizational Needs After Identifying Formats PDF
Following slide outlines different flaws contributing to supply chain transformation failure. It also summarizes the details about the major challenges as well as needs to optimize supply chain process. Find a pre designed and impeccable Strategies For Dynamic Supply Chain Agility Addressing Various Organizational Needs After Identifying Formats PDF. The templates can ace your presentation without additional effort. You can download these easy to edit presentation templates to make your presentation stand out from others. So, what are you waiting for Download the template from Slidegeeks today and give a unique touch to your presentation.
-
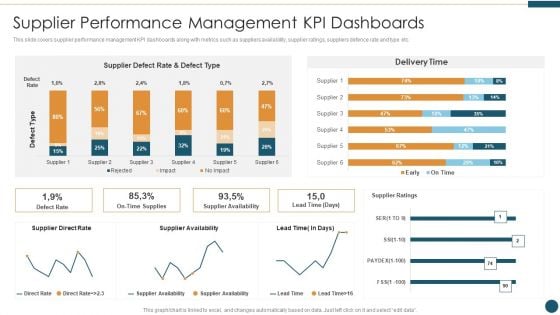
Supplier Relationship Management Supplier Performance Management KPI Dashboards Information PDF
This slide covers supplier performance management KPI dashboards along with metrics such as suppliers availability, supplier ratings, suppliers defence rate and type etc. Deliver an awe inspiring pitch with this creative Supplier Relationship Management Supplier Performance Management KPI Dashboards Information PDF bundle. Topics like Supplier Performance Management Kpi Dashboards can be discussed with this completely editable template. It is available for immediate download depending on the needs and requirements of the user.
-
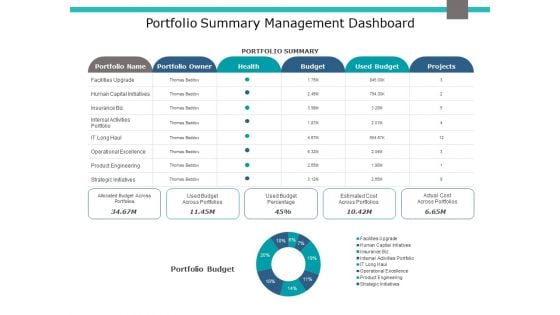
Portfolio Summary Management Dashboard Ppt PowerPoint Presentation Pictures Visuals
This is a portfolio summary management dashboard ppt powerpoint presentation pictures visuals. This is a six stage process. The stages in this process are finance, marketing, management, investment.
-
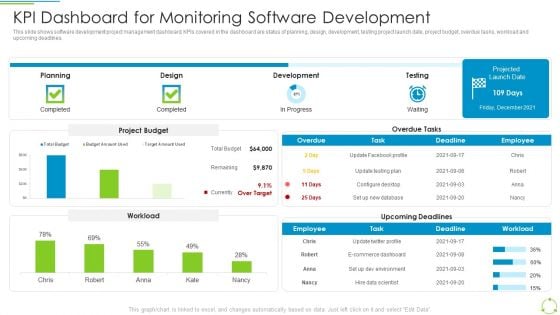
Executing Devops Framework KPI Dashboard For Monitoring Software Development Portrait PDF
This slide shows software development project management dashboard. KPIs covered in the dashboard are status of planning, design, development, testing project launch date, project budget, overdue tasks, workload and upcoming deadlines. Deliver an awe inspiring pitch with this creative Executing Devops Framework KPI Dashboard For Monitoring Software Development Portrait PDF bundle. Topics like Planning, Design, Development, Testing can be discussed with this completely editable template. It is available for immediate download depending on the needs and requirements of the user.
-
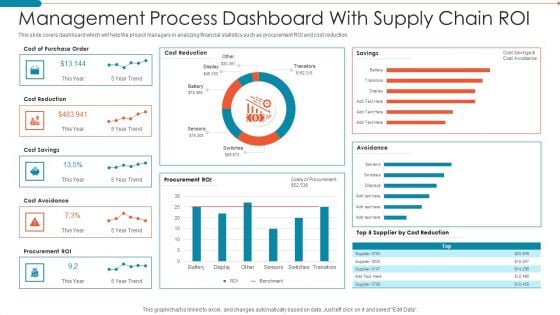
Management Process Dashboard With Supply Chain Roi Professional PDF
This slide covers dashboard which will help the project managers in analyzing financial statistics such as procurement ROI and cost reduction.Pitch your topic with ease and precision using this Management Process Dashboard With Supply Chain Roi Professional PDF. This layout presents information on Management Process Dashboard With Supply Chain Roi. It is also available for immediate download and adjustment. So, changes can be made in the color, design, graphics or any other component to create a unique layout.
-
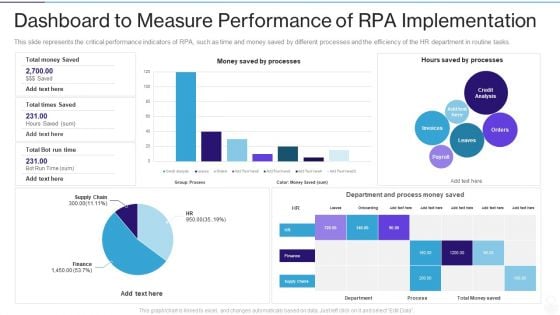
RPA IT Dashboard To Measure Performance Of RPA Implementation Ppt Professional Pictures PDF
This slide represents the critical performance indicators of RPA, such as time and money saved by different processes and the efficiency of the HR department in routine tasks. Deliver an awe inspiring pitch with this creative rpa it dashboard to measure performance of rpa implementation ppt professional pictures pdf bundle. Topics like processes, finance, supply chain, analysis, payroll can be discussed with this completely editable template. It is available for immediate download depending on the needs and requirements of the user.
-
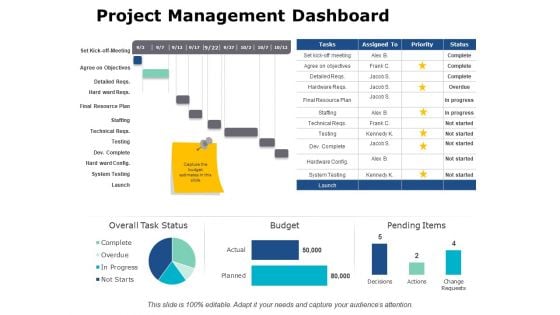
Project Management Dashboard Ppt PowerPoint Presentation Outline Designs
This is a project management dashboard ppt powerpoint presentation outline designs. This is a four stage process. The stages in this process are finance, analysis, business, investment, marketing.
-
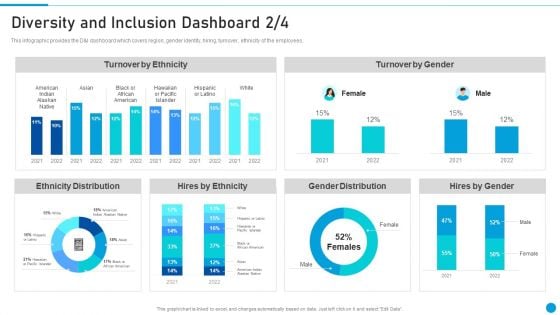
Embed Diversity And Inclusion Diversity And Inclusion Dashboard Download PDF
This infographic provides the D And I dashboard which covers region, gender identity, hiring, turnover, ethnicity of the employees. Deliver an awe inspiring pitch with this creative Embed Diversity And Inclusion Diversity And Inclusion Dashboard Download PDF bundle. Topics like Turnover By Ethnicity, Turnover By Gender, Ethnicity Distribution, Hires By Ethnicity, Gender Distribution, Hires By Gender can be discussed with this completely editable template. It is available for immediate download depending on the needs and requirements of the user.
-
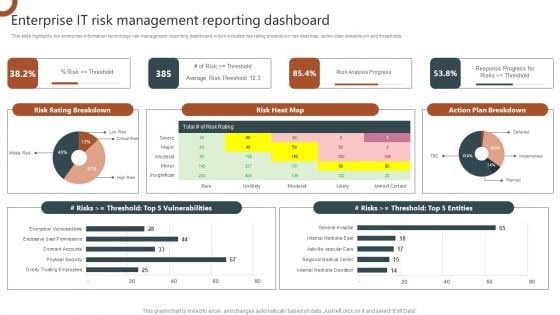
Organizations Risk Management And IT Security Enterprise IT Risk Management Reporting Dashboard Diagrams PDF
This slide highlights the enterprise information technology risk management reporting dashboard which includes risk rating breakdown risk heat map, action plan breakdown and thresholds. This Organizations Risk Management And IT Security Enterprise IT Risk Management Reporting Dashboard Diagrams PDF is perfect for any presentation, be it in front of clients or colleagues. It is a versatile and stylish solution for organizing your meetings. The Organizations Risk Management And IT Security Enterprise IT Risk Management Reporting Dashboard Diagrams PDF features a modern design for your presentation meetings. The adjustable and customizable slides provide unlimited possibilities for acing up your presentation. Slidegeeks has done all the homework before launching the product for you. So, do not wait, grab the presentation templates today.
-
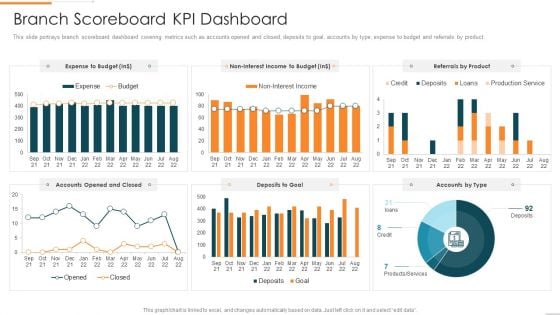
Enhanced Customer Banking Experience With Mobile Branch Scoreboard KPI Dashboard Graphics PDF
This slide portrays branch scoreboard dashboard covering metrics such as accounts opened and closed, deposits to goal, accounts by type, expense to budget and referrals by product.Deliver an awe inspiring pitch with this creative Enhanced Customer Banking Experience With Mobile Branch Scoreboard KPI Dashboard Graphics PDF bundle. Topics like Branch Scoreboard KPI Dashboard can be discussed with this completely editable template. It is available for immediate download depending on the needs and requirements of the user.
-
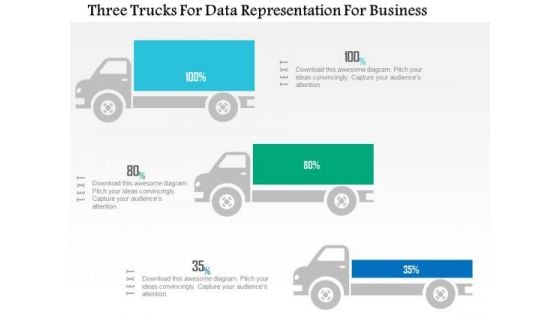
Business Diagram Three Trucks For Data Representation For Business PowerPoint Slide
This business diagram displays three trucks graphic. This diagram contains trucks for percentage value growth. Use this diagram to display business growth over a period of time.
-
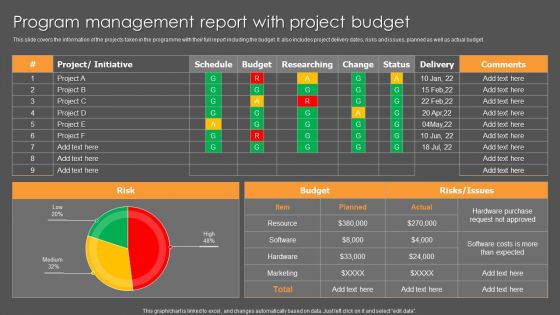
Program Management Report With Project Budget Ppt Model Designs PDF
This slide covers the information of the projects taken in the programme with their full report including the budget. It also includes project delivery dates, risks and issues, planned as well as actual budget. Pitch your topic with ease and precision using this Program Management Report With Project Budget Ppt Model Designs PDF. This layout presents information on Project, Initiative, Risk, Budget. It is also available for immediate download and adjustment. So, changes can be made in the color, design, graphics or any other component to create a unique layout.
-

Saas Metrics Dashboard Illustrating Revenue Growth Rate Demonstration PDF
Showcasing this set of slides titled Saas Metrics Dashboard Illustrating Revenue Growth Rate Demonstration PDF The topics addressed in these templates are Saas Metrics Dashboard Illustrating Revenue Growth Rate All the content presented in this PPT design is completely editable. Download it and make adjustments in color, background, font etc. as per your unique business setting.
-
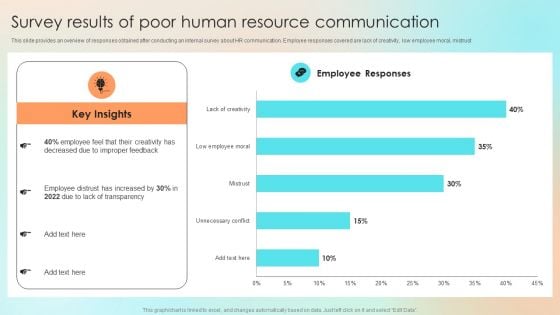
Survey Results Of Poor Human Resource Communication Diagrams PDF
This slide provides an overview of responses obtained after conducting an internal survey about HR communication. Employee responses covered are lack of creativity, low employee moral, mistrust. Get a simple yet stunning designed Survey Results Of Poor Human Resource Communication Diagrams PDF. It is the best one to establish the tone in your meetings. It is an excellent way to make your presentations highly effective. So, download this PPT today from Slidegeeks and see the positive impacts. Our easy to edit Survey Results Of Poor Human Resource Communication Diagrams PDF can be your go to option for all upcoming conferences and meetings. So, what are you waiting for Grab this template today.
-
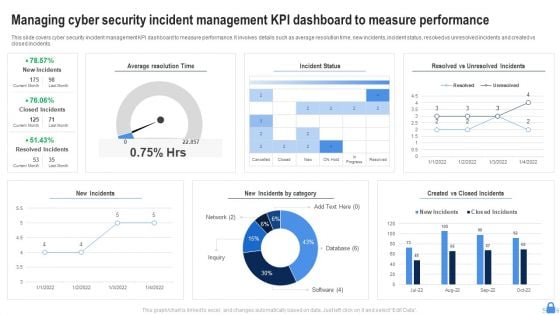
Managing Cyber Security Incident Management KPI Dashboard To Measure Performance Download PDF
This slide covers cyber security incident management KPI dashboard to measure performance. It involves details such as average resolution time, new incidents, incident status, resolved vs unresolved incidents and created vs closed incidents. Showcasing this set of slides titled Managing Cyber Security Incident Management KPI Dashboard To Measure Performance Download PDF. The topics addressed in these templates are Average Resolution Time, Incident Status, New Incidents. All the content presented in this PPT design is completely editable. Download it and make adjustments in color, background, font etc. as per your unique business setting.
-
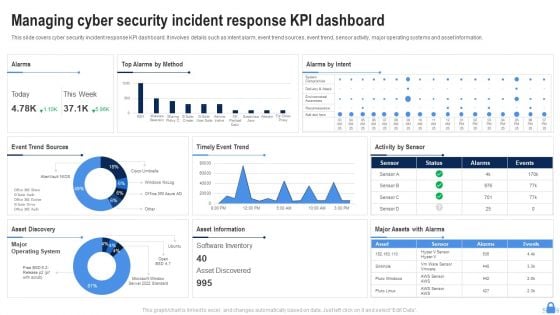
Managing Cyber Security Incident Response KPI Dashboard Ppt Layouts Shapes PDF
This slide covers cyber security incident response KPI dashboard. It involves details such as intent alarm, event trend sources, event trend, sensor activity, major operating systems and asset information. Pitch your topic with ease and precision using this Managing Cyber Security Incident Response KPI Dashboard Ppt Layouts Shapes PDF. This layout presents information on Top Alarms Method, Alarms Intent, Timely Event Trend. It is also available for immediate download and adjustment. So, changes can be made in the color, design, graphics or any other component to create a unique layout.
-
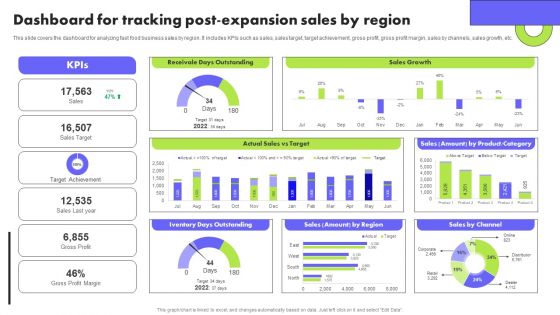
Planning Transnational Technique To Improve International Scope Dashboard For Tracking Post Expansion Sales Introduction PDF
This slide covers the dashboard for analyzing fast food business sales by region. It includes KPIs such as sales, sales target, target achievement, gross profit, gross profit margin, sales by channels, sales growth, etc. Find highly impressive Planning Transnational Technique To Improve International Scope Dashboard For Tracking Post Expansion Sales Introduction PDF on Slidegeeks to deliver a meaningful presentation. You can save an ample amount of time using these presentation templates. No need to worry to prepare everything from scratch because Slidegeeks experts have already done a huge research and work for you. You need to download Planning Transnational Technique To Improve International Scope Dashboard For Tracking Post Expansion Sales Introduction PDF for your upcoming presentation. All the presentation templates are 100 percent editable and you can change the color and personalize the content accordingly. Download now.
-
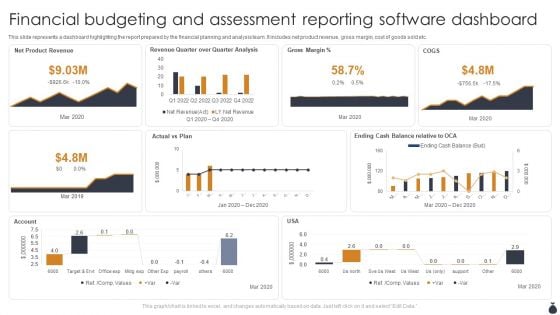
Financial Budgeting And Assessment Reporting Software Dashboard Template PDF
This slide represents a dashboard highlighting the report prepared by the financial planning and analysis team. It includes net product revenue, gross margin, cost of goods sold etc. Showcasing this set of slides titled Financial Budgeting And Assessment Reporting Software Dashboard Template PDF. The topics addressed in these templates are Net Product Revenue, Actual Vs Plan, Account. All the content presented in this PPT design is completely editable. Download it and make adjustments in color, background, font etc. as per your unique business setting.
-
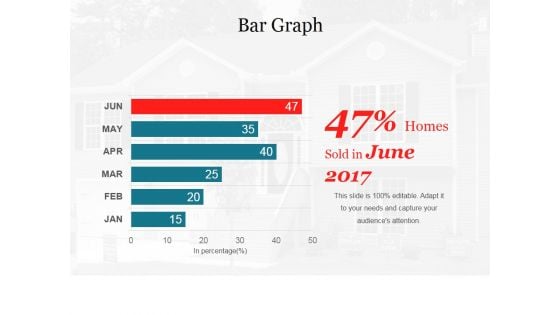
Bar Graph Ppt PowerPoint Presentation File Picture
This is a bar graph ppt powerpoint presentation file picture. This is a six stage process. The stages in this process are management, planning, marketing, business, strategy.
-
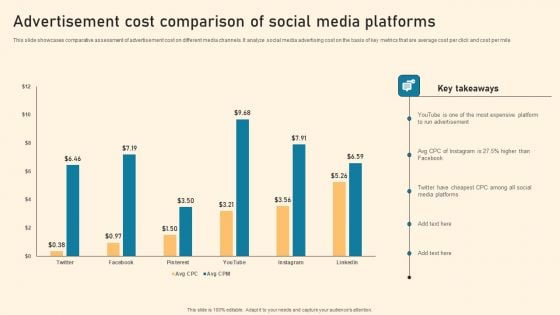
Advertisement Cost Comparison Of Social Media Platforms Ppt PowerPoint Presentation File Example File PDF
This slide showcases comparative assessment of advertisement cost on different media channels. It analyze social media advertising cost on the basis of key metrics that are average cost per click and cost per mile Boost your pitch with our creative Advertisement Cost Comparison Of Social Media Platforms Ppt PowerPoint Presentation File Example File PDF. Deliver an awe-inspiring pitch that will mesmerize everyone. Using these presentation templates you will surely catch everyones attention. You can browse the ppts collection on our website. We have researchers who are experts at creating the right content for the templates. So you do not have to invest time in any additional work. Just grab the template now and use them.
-
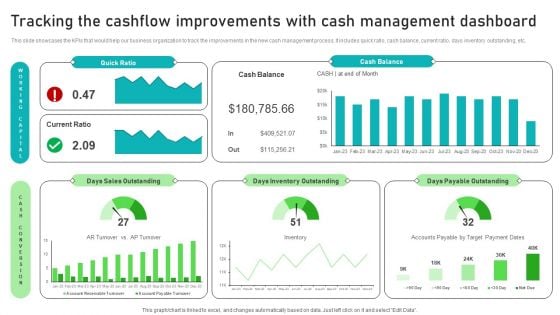
Adjusting Financial Strategies And Planning Tracking The Cashflow Improvements With Cash Management Diagrams PDF
This slide showcases the KPIs that would help our business organization to track the improvements in the new cash management process. It includes quick ratio, cash balance, current ratio, days inventory outstanding, etc. Retrieve professionally designed Adjusting Financial Strategies And Planning Tracking The Cashflow Improvements With Cash Management Diagrams PDF to effectively convey your message and captivate your listeners. Save time by selecting pre made slideshows that are appropriate for various topics, from business to educational purposes. These themes come in many different styles, from creative to corporate, and all of them are easily adjustable and can be edited quickly. Access them as PowerPoint templates or as Google Slides themes. You do not have to go on a hunt for the perfect presentation because Slidegeeks got you covered from everywhere.
-

Internal Promotion Strategy To Enhance Brand Awareness KPI Dashboard To Track PR Marketing Performance Ideas PDF
This slide shows dashboard which can be used by organizations to measure the results of public relation strategy. It includes metrics such as media coverage rate, social media engagement rate, share of voice and brand mentions. This modern and well arranged Internal Promotion Strategy To Enhance Brand Awareness KPI Dashboard To Track PR Marketing Performance Ideas PDF provides lots of creative possibilities. It is very simple to customize and edit with the Powerpoint Software. Just drag and drop your pictures into the shapes. All facets of this template can be edited with Powerpoint no extra software is necessary. Add your own material, put your images in the places assigned for them, adjust the colors, and then you can show your slides to the world, with an animated slide included.
-
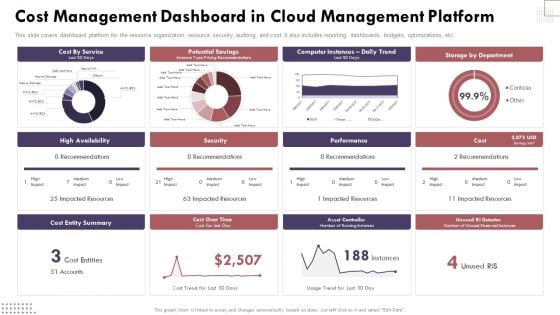
Cost Management Dashboard In Cloud Management Platform Cloud Computing Complexities And Solutions Ideas PDF
This slide covers dashboard platform for the resource organization, resource security, auditing, and cost. It also includes reporting, dashboards, budgets, optimizations, etc. Presenting this PowerPoint presentation, titled Cost Management Dashboard In Cloud Management Platform Cloud Computing Complexities And Solutions Ideas PDF, with topics curated by our researchers after extensive research. This editable presentation is available for immediate download and provides attractive features when used. Download now and captivate your audience. Presenting this Cost Management Dashboard In Cloud Management Platform Cloud Computing Complexities And Solutions Ideas PDF. Our researchers have carefully researched and created these slides with all aspects taken into consideration. This is a completely customizable Cost Management Dashboard In Cloud Management Platform Cloud Computing Complexities And Solutions Ideas PDF that is available for immediate downloading. Download now and make an impact on your audience. Highlight the attractive features available with our PPTs.
-
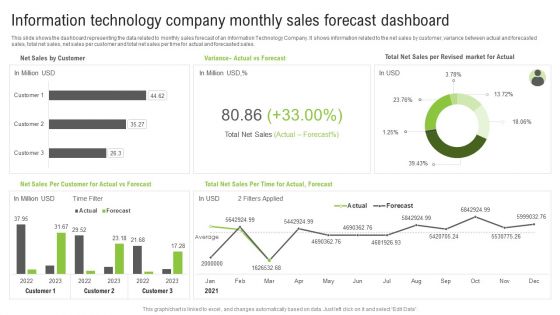
Information Technology Company Monthly Sales Forecast Dashboard Ppt Portfolio Images PDF
This slide shows the dashboard representing the data related to monthly sales forecast of an Information Technology Company. It shows information related to the net sales by customer, variance between actual and forecasted sales, total net sales, net sales per customer and total net sales per time for actual and forecasted sales. Pitch your topic with ease and precision using this Information Technology Company Monthly Sales Forecast Dashboard Ppt Portfolio Images PDF. This layout presents information on Total Net Sales, Actual vs Forecast, Net Sales Customer. It is also available for immediate download and adjustment. So, changes can be made in the color, design, graphics or any other component to create a unique layout.
-
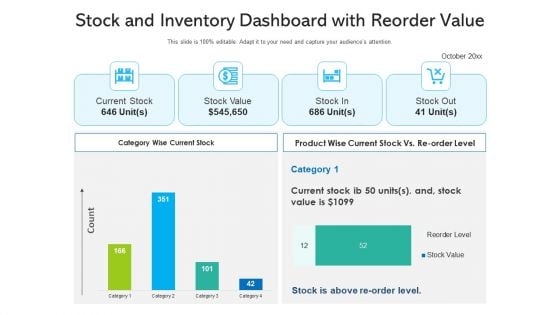
Stock And Inventory Dashboard With Reorder Value Ppt PowerPoint Presentation File Slide Portrait PDF
Showcasing this set of slides titled stock and inventory dashboard with reorder value ppt powerpoint presentation file slide portrait pdf. The topics addressed in these templates are stock and inventory dashboard with reorder value. All the content presented in this PPT design is completely editable. Download it and make adjustments in color, background, font etc. as per your unique business setting.
-
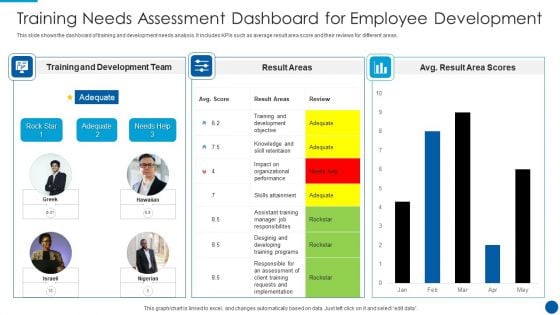
Training Needs Assessment Dashboard For Employee Development Demonstration PDF
This slide shows the dashboard of training and development needs analysis. It includes KPIs such as average result area score and their reviews for different areas. Showcasing this set of slides titled training needs assessment dashboard for employee development demonstration pdf. The topics addressed in these templates are development, team, implementation. All the content presented in this PPT design is completely editable. Download it and make adjustments in color, background, font etc. as per your unique business setting.
-
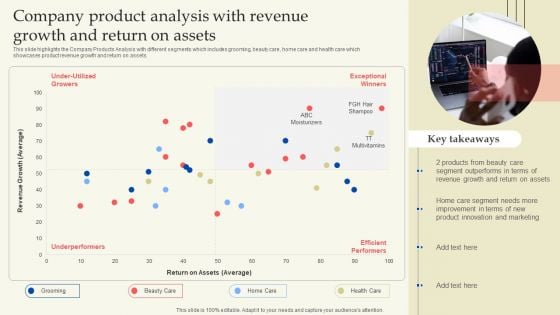
Company Product Analysis With Revenue Growth And Return On Assets Portrait PDF
This slide highlights the Company Products Analysis with different segments which includes grooming, beauty care, home care and health care which showcases product revenue growth and return on assets. Here you can discover an assortment of the finest PowerPoint and Google Slides templates. With these templates, you can create presentations for a variety of purposes while simultaneously providing your audience with an eye catching visual experience. Download Company Product Analysis With Revenue Growth And Return On Assets Portrait PDF to deliver an impeccable presentation. These templates will make your job of preparing presentations much quicker, yet still, maintain a high level of quality. Slidegeeks has experienced researchers who prepare these templates and write high quality content for you. Later on, you can personalize the content by editing the Company Product Analysis With Revenue Growth And Return On Assets Portrait PDF.
-
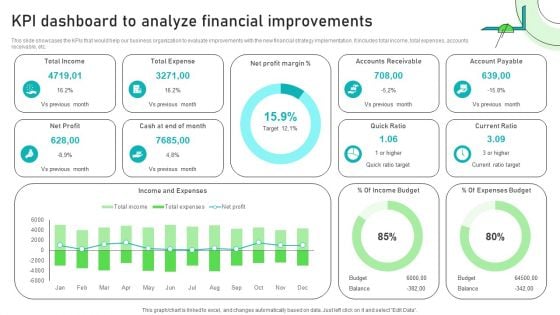
Adjusting Financial Strategies And Planning KPI Dashboard To Analyze Financial Improvements Inspiration PDF
This slide showcases the KPIs that would help our business organization to evaluate improvements with the new financial strategy implementation. It includes total income, total expenses, accounts receivable, etc. The best PPT templates are a great way to save time, energy, and resources. Slidegeeks have 100 percent editable powerpoint slides making them incredibly versatile. With these quality presentation templates, you can create a captivating and memorable presentation by combining visually appealing slides and effectively communicating your message. Download Adjusting Financial Strategies And Planning KPI Dashboard To Analyze Financial Improvements Inspiration PDF from Slidegeeks and deliver a wonderful presentation.
-
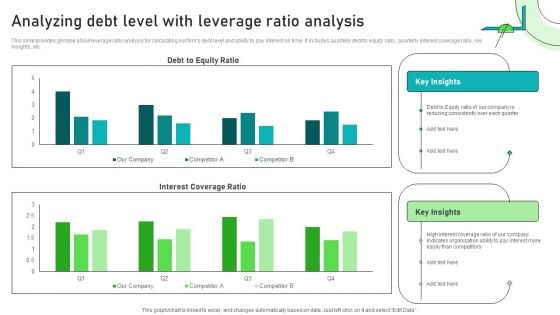
Adjusting Financial Strategies And Planning Analyzing Debt Level With Leverage Ratio Analysis Designs PDF
This slide provides glimpse about leverage ratio analysis for calculating our firms debt level and ability to pay interest on time. It includes quarterly debt to equity ratio, quarterly interest coverage ratio, key insights, etc. Crafting an eye catching presentation has never been more straightforward. Let your presentation shine with this tasteful yet straightforward Adjusting Financial Strategies And Planning Analyzing Debt Level With Leverage Ratio Analysis Designs PDF template. It offers a minimalistic and classy look that is great for making a statement. The colors have been employed intelligently to add a bit of playfulness while still remaining professional. Construct the ideal Adjusting Financial Strategies And Planning Analyzing Debt Level With Leverage Ratio Analysis Designs PDF that effortlessly grabs the attention of your audience. Begin now and be certain to wow your customers.
-
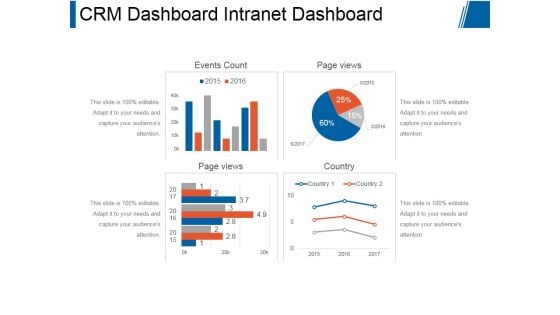
Crm Dashboard Intranet Dashboard Ppt PowerPoint Presentation Model
This is a crm dashboard intranet dashboard ppt powerpoint presentation model. This is a four stage process. The stages in this process are events count, page views, page views, country.
-
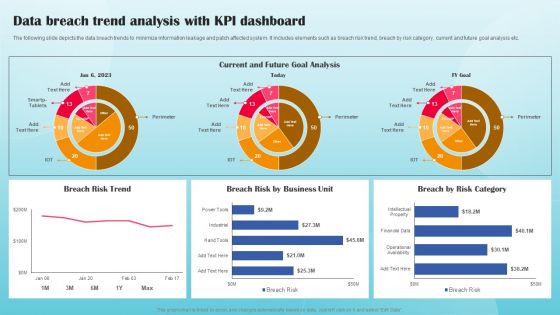
Data Breach Trend Analysis With KPI Dashboard Ppt PowerPoint Presentation File Portfolio PDF
The following slide depicts the data breach trends to minimize information leakage and patch affected system. It includes elements such as breach risk trend, breach by risk category, current and future goal analysis etc. This modern and well arranged Data Breach Trend Analysis With KPI Dashboard Ppt PowerPoint Presentation File Portfolio PDF provides lots of creative possibilities. It is very simple to customize and edit with the Powerpoint Software. Just drag and drop your pictures into the shapes. All facets of this template can be edited with Powerpoint no extra software is necessary. Add your own material, put your images in the places assigned for them, adjust the colors, and then you can show your slides to the world, with an animated slide included.
-
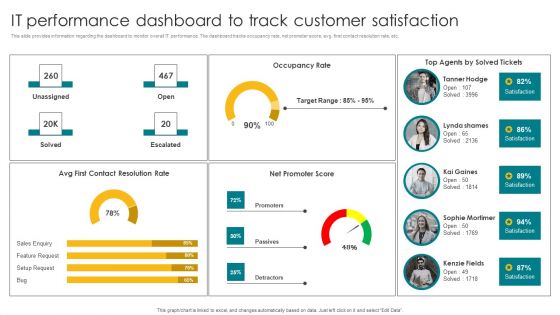
IT Performance Dashboard To Track Customer Satisfaction Elements PDF
This slide provides information regarding the dashboard to monitor overall IT performance. The dashboard tracks occupancy rate, net promoter score, avg. first contact resolution rate, etc. Boost your pitch with our creative IT Performance Dashboard To Track Customer Satisfaction Elements PDF. Deliver an awe inspiring pitch that will mesmerize everyone. Using these presentation templates you will surely catch everyones attention. You can browse the ppts collection on our website. We have researchers who are experts at creating the right content for the templates. So you do not have to invest time in any additional work. Just grab the template now and use them.
-
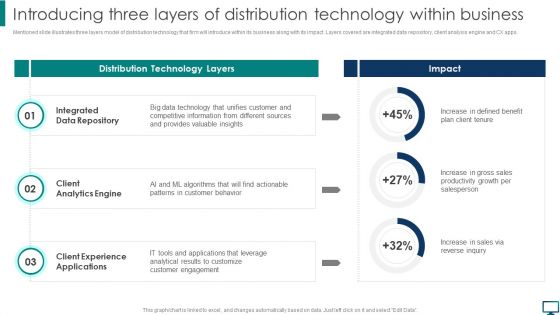
Introducing Three Layers Of Distribution Technology Within Business Structure PDF
Mentioned slide illustrates three layers model of distribution technology that firm will introduce within its business along with its impact. Layers covered are integrated data repository, client analysis engine and CX apps. Do you know about Slidesgeeks Introducing Three Layers Of Distribution Technology Within Business Structure PDF These are perfect for delivering any kind od presentation. Using it, create PowerPoint presentations that communicate your ideas and engage audiences. Save time and effort by using our pre designed presentation templates that are perfect for a wide range of topic. Our vast selection of designs covers a range of styles, from creative to business, and are all highly customizable and easy to edit. Download as a PowerPoint template or use them as Google Slides themes.
-
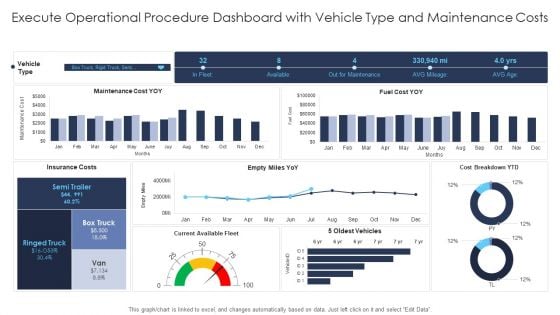
Execute Operational Procedure Dashboard With Vehicle Type And Maintenance Costs Introduction PDF
Deliver and pitch your topic in the best possible manner with this execute operational procedure dashboard with vehicle type and maintenance costs introduction pdf. Use them to share invaluable insights on execute operational procedure dashboard with raci chart and action timeline 2 or 2 and impress your audience. This template can be altered and modified as per your expectations. So, grab it now.
-
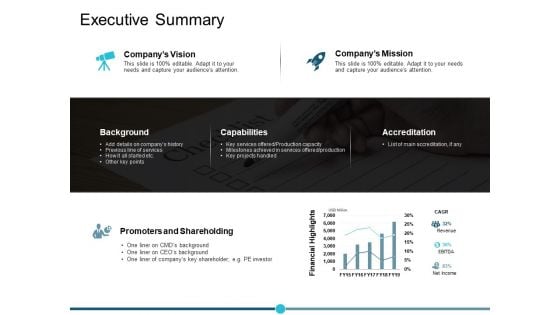
Executive Summary Ppt PowerPoint Presentation Model
This is a executive summary ppt powerpoint presentation model. This is a three stage process. The stages in this process are percentage, product, business, management, marketing.
-
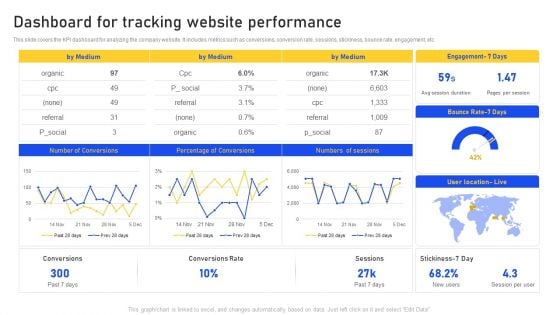
Dashboard For Tracking Website Performance Professional PDF
This slide covers the KPI dashboard for analyzing the company website. It includes metrics such as conversions, conversion rate, sessions, stickiness, bounce rate, engagement, etc. Deliver and pitch your topic in the best possible manner with this Dashboard For Tracking Website Performance Professional PDF. Use them to share invaluable insights on Dashboard For Tracking, Website Performance and impress your audience. This template can be altered and modified as per your expectations. So, grab it now.
-
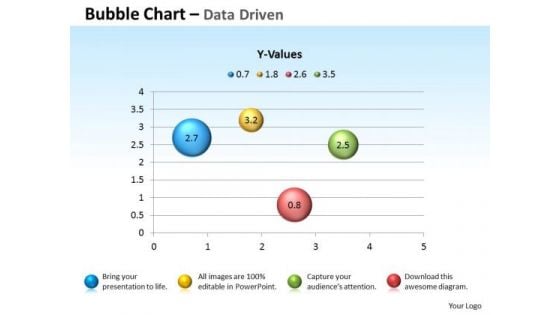
Excel Data Analysis Data Tools Data Methods Statistical Chart For Process PowerPoint Templates
Blend Your Views With Our excel data analysis data tools data methods statistical chart for process Powerpoint Templates . They Are Made For Each Other.
-
Performance Analysis Bar Graph Powerpoint Shapes
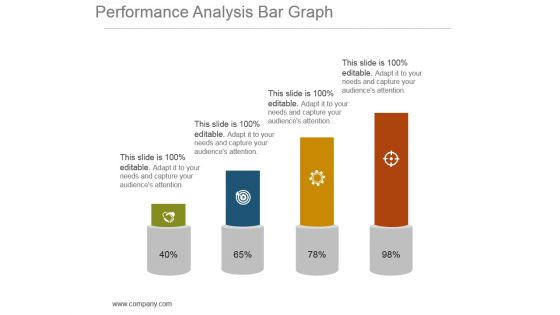
This is a performance analysis bar graph powerpoint shapes. This is a four stage process. The stages in this process are growth, finance, strategy, management, marketing.
-
Overview Of Fast Moving Consumer Goods Kpi Dashboard Ppt PowerPoint Presentation Show Visual Aids PDF
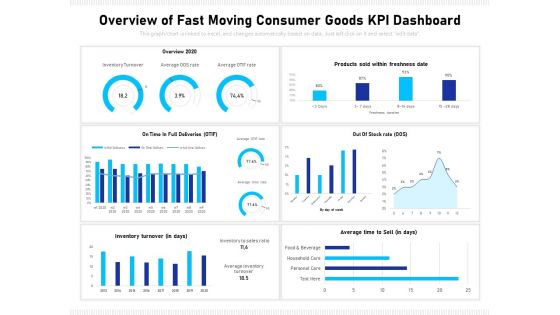
Showcasing this set of slides titled overview of fast moving consumer goods kpi dashboard ppt powerpoint presentation show visual aids pdf. The topics addressed in these templates are overview 2020, on time in full deliveries otif, out of stock rate oos, inventory turnover in days, average time to sell in days. All the content presented in this PPT design is completely editable. Download it and make adjustments in color, background, font etc. as per your unique business setting.
-
Project Capabilities Actual Vs Planned Budget Ppt Summary Gridlines PDF
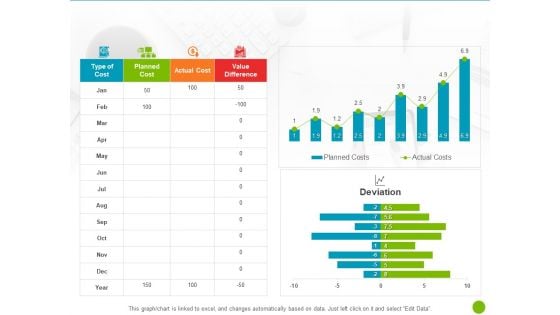
Presenting this set of slides with name project capabilities actual vs planned budget ppt summary gridlines pdf. The topics discussed in these slides are type of cost, planned cost, actual cost, value difference. This is a completely editable PowerPoint presentation and is available for immediate download. Download now and impress your audience.
-
Developing Market Positioning Strategy Marketing Dashboard Template Microsoft PDF
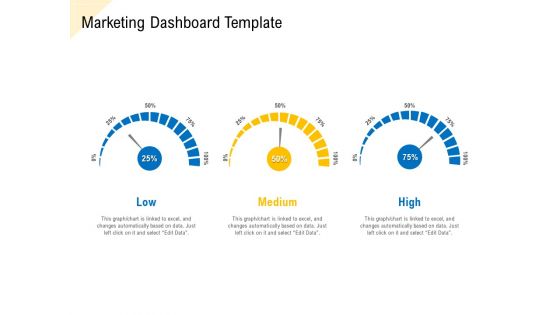
Presenting this set of slides with name developing market positioning strategy marketing dashboard template microsoft pdf. The topics discussed in these slide is marketing dashboard template. This is a completely editable PowerPoint presentation and is available for immediate download. Download now and impress your audience.

 Home
Home 

