Charts and Graphs PowerPoint Templates
-
Professional Scrum Master Training IT Software Development Progress Tracking Dashboard Mockup PDF
This slide portrays software development project management dashboard with KPIs namely status of planning, design, development, testing project launch date, project budget, overdue tasks, workload and upcoming deadlines. Deliver and pitch your topic in the best possible manner with this professional scrum master training it software development progress tracking dashboard mockup pdf. Use them to share invaluable insights on financial risk, people risk, governance risk, competitive risk, system or technology and impress your audience. This template can be altered and modified as per your expectations. So, grab it now.
-
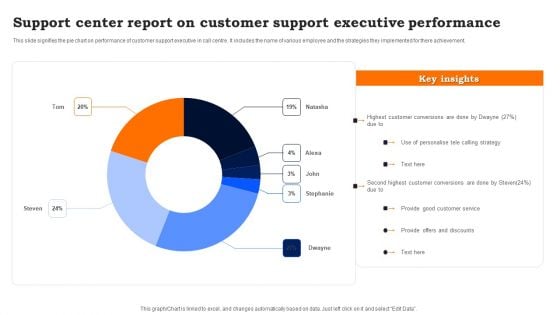
Support Center Report On Customer Support Executive Performance Sample PDF
This slide signifies the pie chart on performance of customer support executive in call centre. It includes the name of various employee and the strategies they implemented for there achievement. Showcasing this set of slides titled Support Center Report On Customer Support Executive Performance Sample PDF. The topics addressed in these templates are Use Of Personalise Telecalling, Provide Good Customer Service, Provide Offers And Discounts. All the content presented in this PPT design is completely editable. Download it and make adjustments in color, background, font etc. as per your unique business setting.
-
Project Tracking Tracker Status Report Structure PDF
The following slide represents the status report for project tracking to assess key aspects of projects. It includes kpis such as schedule, budget, resources, risks, issues and quality etc. Showcasing this set of slides titled Project Tracking Tracker Status Report Structure PDF. The topics addressed in these templates are Budget, Quality, Risk And Issues. All the content presented in this PPT design is completely editable. Download it and make adjustments in color, background, font etc. as per your unique business setting.
-
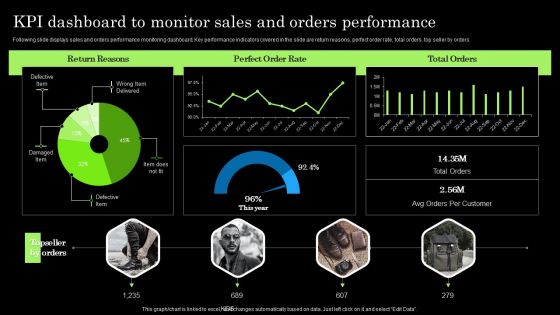
Tactical Brand Extension Launching Kpi Dashboard To Monitor Sales And Orders Formats PDF
Following slide displays sales and orders performance monitoring dashboard. Key performance indicators covered in the slide are return reasons, perfect order rate, total orders, top seller by orders. From laying roadmaps to briefing everything in detail, our templates are perfect for you. You can set the stage with your presentation slides. All you have to do is download these easy-to-edit and customizable templates. Tactical Brand Extension Launching Kpi Dashboard To Monitor Sales And Orders Formats PDF will help you deliver an outstanding performance that everyone would remember and praise you for. Do download this presentation today.
-
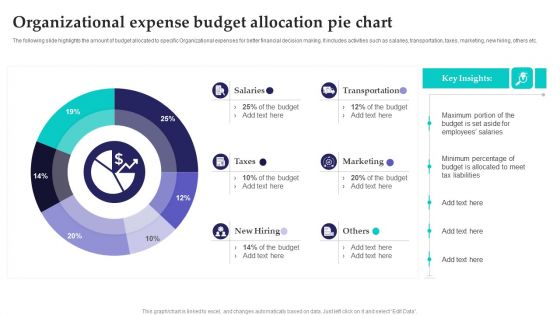
Organizational Expense Budget Allocation Pie Chart Inspiration PDF
The following slide highlights the amount of budget allocated to specific Organizational expenses for better financial decision making. It includes activities such as salaries, transportation, taxes, marketing, new hiring, others etc. Pitch your topic with ease and precision using this Organizational Expense Budget Allocation Pie Chart Inspiration PDF. This layout presents information on Transportation, Marketing, Budget. It is also available for immediate download and adjustment. So, changes can be made in the color, design, graphics or any other component to create a unique layout.
-
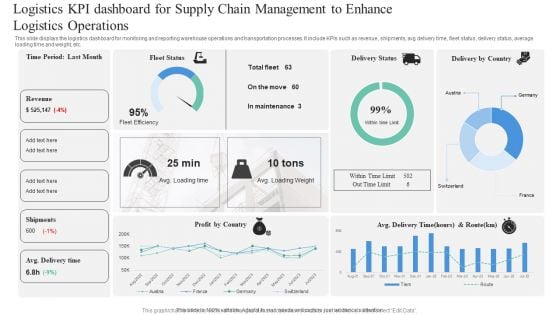
Logistics KPI Dashboard For Supply Chain Management To Enhance Logistics Operations Professional PDF
This slide displays the logistics dashboard for monitoring and reporting warehouse operations and transportation processes. It include KPIs such as revenue, shipments, avg delivery time, fleet status, delivery status, average loading time and weight, etc. Pitch your topic with ease and precision using this Logistics KPI Dashboard For Supply Chain Management To Enhance Logistics Operations Professional PDF. This layout presents information on Logistics KPI, Dashboard For Supply Chain, Management To Enhance, Logistics Operations. It is also available for immediate download and adjustment. So, changes can be made in the color, design, graphics or any other component to create a unique layout.
-
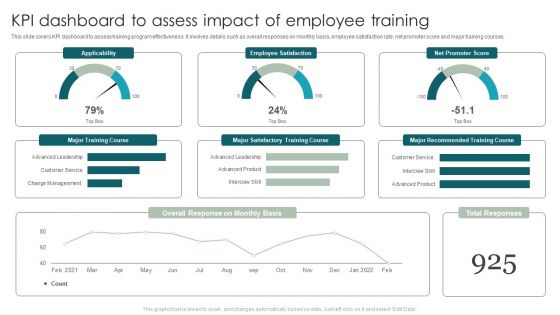
KPI Dashboard To Assess Impact Of Employee Training Brochure PDF
This slide covers KPI dashboard to assess training program effectiveness. It involves details such as overall responses on monthly basis, employee satisfaction rate, net promoter score and major training courses. Showcasing this set of slides titled KPI Dashboard To Assess Impact Of Employee Training Brochure PDF. The topics addressed in these templates are Major Training Course, Major Satisfactory Training Course, Major Recommended Training Course . All the content presented in this PPT design is completely editable. Download it and make adjustments in color, background, font etc. as per your unique business setting.
-
Developing Appealing Persona Customer Satisfaction Kpi Dashboard Microsoft PDF
This graph or chart is linked to excel, and changes automatically based on data. Just left click on it and select Edit Data. Do you have an important presentation coming up Are you looking for something that will make your presentation stand out from the rest Look no further than Developing Appealing Persona Customer Satisfaction Kpi Dashboard Microsoft PDF. With our professional designs, you can trust that your presentation will pop and make delivering it a smooth process. And with Slidegeeks, you can trust that your presentation will be unique and memorable. So why wait Grab Developing Appealing Persona Customer Satisfaction Kpi Dashboard Microsoft PDF today and make your presentation stand out from the rest
-
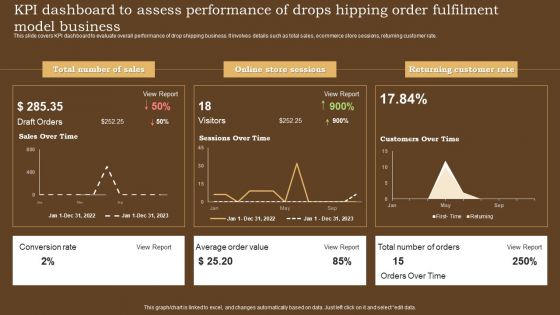
KPI Dashboard To Assess Performance Of Drops Hipping Order Fulfilment Model Business Themes PDF
This slide covers KPI dashboard to evaluate overall performance of drop shipping business. It involves details such as total sales, ecommerce store sessions, returning customer rate. Showcasing this set of slides titled KPI Dashboard To Assess Performance Of Drops Hipping Order Fulfilment Model Business Themes PDF. The topics addressed in these templates are Total Number Of Sales, Online Store Sessions, Returning Customer Rate. All the content presented in this PPT design is completely editable. Download it and make adjustments in color, background, font etc. as per your unique business setting.
-
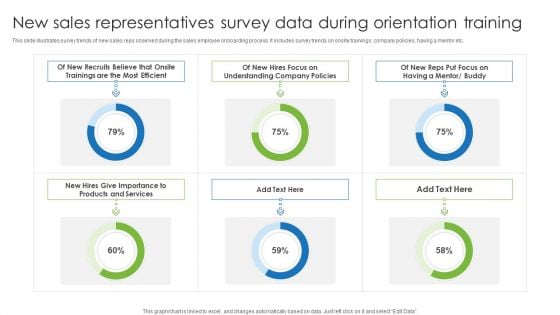
New Sales Representatives Survey Data During Orientation Training Themes PDF
This slide illustrates survey trends of new sales reps observed during the sales employee onboarding process. It includes survey trends on onsite trainings, company policies, having a mentor etc. Showcasing this set of slides titled New Sales Representatives Survey Data During Orientation Training Themes PDF. The topics addressed in these templates are New Sales Representatives Survey, Data During Orientation Training. All the content presented in this PPT design is completely editable. Download it and make adjustments in color, background, font etc. as per your unique business setting.
-
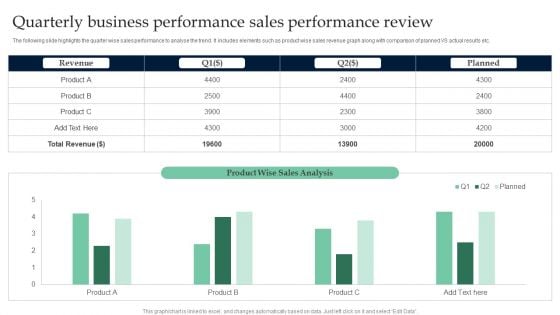
Quarterly Business Performance Sales Performance Review Clipart PDF
The following slide highlights the quarter wise sales performance to analyse the trend. It includes elements such as product wise sales revenue graph along with comparison of planned VS actual results etc. Showcasing this set of slides titled Quarterly Business Performance Sales Performance Review Clipart PDF. The topics addressed in these templates are Quarterly Business, Performance Sales Performance. All the content presented in this PPT design is completely editable. Download it and make adjustments in color, background, font etc. as per your unique business setting.
-
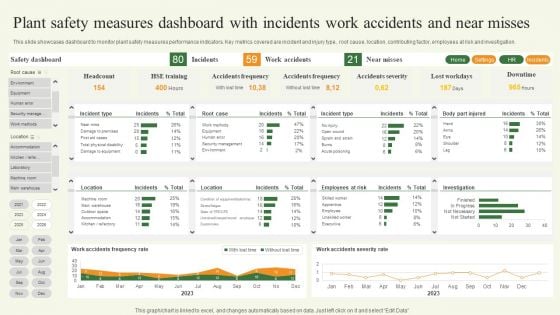
Plant Safety Measures Dashboard With Incidents Work Accidents And Near Misses Template PDF
This slide showcases dashboard to monitor plant safety measures performance indicators. Key metrics covered are incident and injury type, root cause, location, contributing factor, employees at risk and investigation. Pitch your topic with ease and precision using this Plant Safety Measures Dashboard With Incidents Work Accidents And Near Misses Template PDF. This layout presents information on Plant Safety Measures Dashboard, Incidents Work Accidents. It is also available for immediate download and adjustment. So, changes can be made in the color, design, graphics or any other component to create a unique layout.
-
Employee Performance Assessment Survey Conclusion Portrait PDF
This slide illustrates the statistical results of a survey conducted by an organization to assess an employee on the basis of their soft skills to make required improvements. The skills include communication, organization, teamwork, and so on. Showcasing this set of slides titled Employee Performance Assessment Survey Conclusion Portrait PDF. The topics addressed in these templates are Teamwork, Organization, Communication All the content presented in this PPT design is completely editable. Download it and make adjustments in color, background, font etc. as per your unique business setting.
-
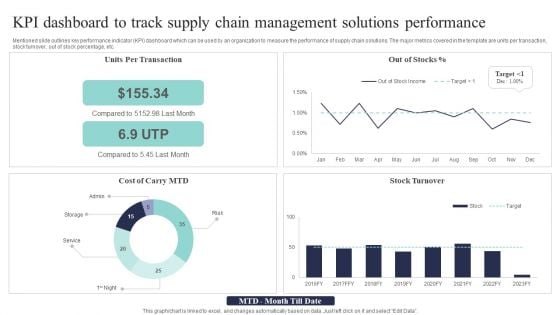
KPI Dashboard To Track Supply Chain Management Solutions Performance Background PDF
Mentioned slide outlines key performance indicator KPI dashboard which can be used by an organization to measure the performance of supply chain solutions. The major metrics covered in the template are units per transaction, stock turnover, out of stock percentage, etc. Pitch your topic with ease and precision using this KPI Dashboard To Track Supply Chain Management Solutions Performance Background PDF. This layout presents information on Per Transaction, Compared Last, Stock Turnover. It is also available for immediate download and adjustment. So, changes can be made in the color, design, graphics or any other component to create a unique layout.
-
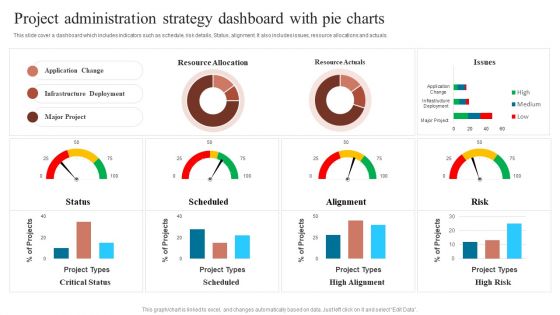
Project Administration Strategy Dashboard With Pie Charts Sample PDF
This slide cover a dashboard which includes indicators such as schedule, risk details, Status, alignment. It also includes issues, resource allocations and actuals. Pitch your topic with ease and precision using this Project Administration Strategy Dashboard With Pie Charts Sample PDF. This layout presents information on Communication Goal, Communication Tool, Increase Revenue. It is also available for immediate download and adjustment. So, changes can be made in the color, design, graphics or any other component to create a unique layout.
-
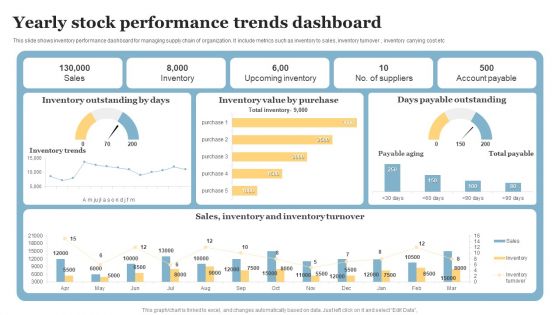
Yearly Stock Performance Trends Dashboard Designs PDF
This slide shows inventory performance dashboard for managing supply chain of organization. It include metrics such as inventory to sales, inventory turnover , inventory carrying cost etc. Showcasing this set of slides titled Yearly Stock Performance Trends Dashboard Designs PDF. The topics addressed in these templates are Inventory Outstanding Days, Days Payable Outstanding, Inventory Value Purchase. All the content presented in this PPT design is completely editable. Download it and make adjustments in color, background, font etc. as per your unique business setting.
-
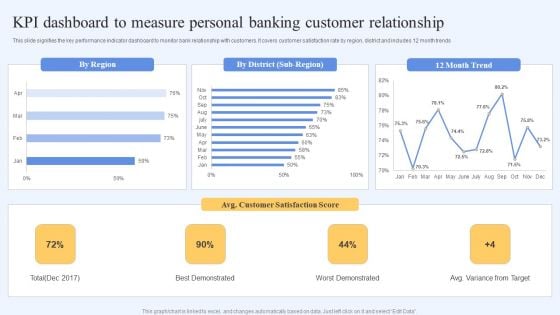
Kpi Dashboard To Measure Personal Banking Customer Relationship Themes PDF
This slide signifies the key performance indicator dashboard to monitor bank relationship with customers. It covers customer satisfaction rate by region, district and includes 12 month trends. Pitch your topic with ease and precision using this Kpi Dashboard To Measure Personal Banking Customer Relationship Themes PDF. This layout presents information on Customer Satisfaction, Best Demonstrated, Worst Demonstrated. It is also available for immediate download and adjustment. So, changes can be made in the color, design, graphics or any other component to create a unique layout.
-
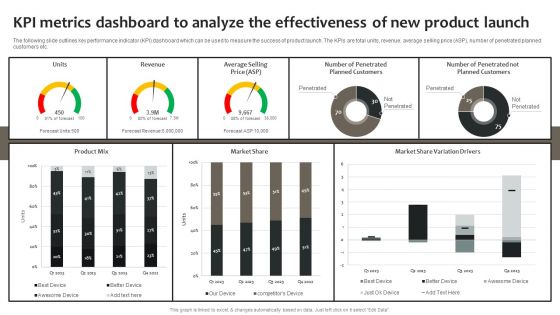
Effective Online And Offline Promotional Kpi Metrics Dashboard To Analyze The Effectiveness Of New Portrait PDF
The following slide outlines key performance indicator KPI dashboard which can be used to measure the success of product launch. The KPIs are total units, revenue, average selling price ASP, number of penetrated planned customers etc. From laying roadmaps to briefing everything in detail, our templates are perfect for you. You can set the stage with your presentation slides. All you have to do is download these easy-to-edit and customizable templates. Effective Online And Offline Promotional Kpi Metrics Dashboard To Analyze The Effectiveness Of New Portrait PDF will help you deliver an outstanding performance that everyone would remember and praise you for. Do download this presentation today.
-
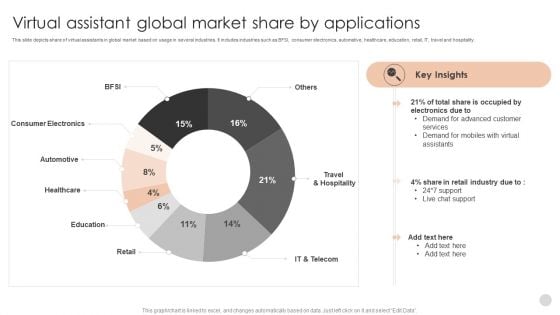
Virtual Assistant Global Market Share By Applications Infographics PDF
This slide depicts share of virtual assistants in global market based on usage in several industries. It includes industries such as BFSI, consumer electronics, automative, healthcare, education, retail, IT, travel and hospitality. Showcasing this set of slides titled Virtual Assistant Global Market Share By Applications Infographics PDF. The topics addressed in these templates are Consumer Electronics, Automotive, Demand Advanced. All the content presented in this PPT design is completely editable. Download it and make adjustments in color, background, font etc. as per your unique business setting.
-
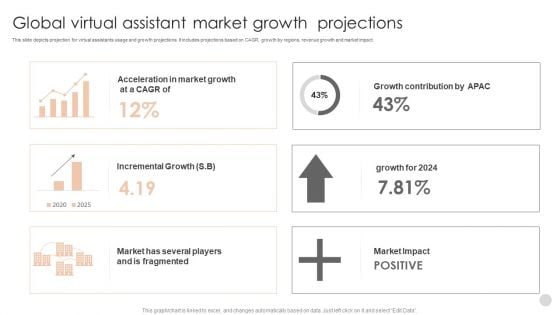
Global Virtual Assistant Market Growth Projections Graphics PDF
This slide depicts projection for virtual assistants usage and growth projections. It includes projections based on CAGR, growth by regions, revenue growth and market impact. Showcasing this set of slides titled Global Virtual Assistant Market Growth Projections Graphics PDF. The topics addressed in these templates are Acceleration Market, Incremental Growth, Players Fragmented. All the content presented in this PPT design is completely editable. Download it and make adjustments in color, background, font etc. as per your unique business setting.
-
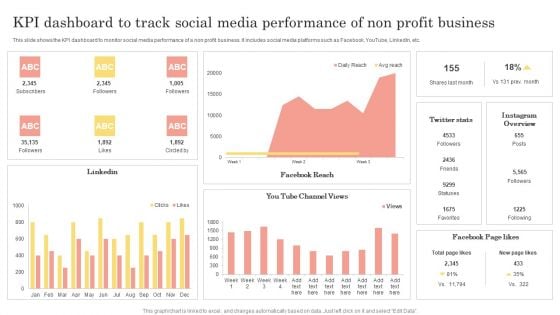
Kpi Dashboard To Track Social Media Performance Of Non Profit Business Portrait PDF
This slide shows the KPI dashboard to monitor social media performance of a non profit business. It includes social media platforms such as Facebook, YouTube, LinkedIn, etc. Showcasing this set of slides titled Kpi Dashboard To Track Social Media Performance Of Non Profit Business Portrait PDF. The topics addressed in these templates are Channel Views, Instagram Overview, Favorites. All the content presented in this PPT design is completely editable. Download it and make adjustments in color, background, font etc. as per your unique business setting.
-
IT Cost Assessment With KPI Dashboard To Gain Competitive Advantage Icons PDF
Showcasing this set of slides titled IT Cost Assessment With KPI Dashboard To Gain Competitive Advantage Icons PDF. The topics addressed in these templates are Actual Cost, Yearly Analysis, Breakdown Chart. All the content presented in this PPT design is completely editable. Download it and make adjustments in color, background, font etc. as per your unique business setting.
-
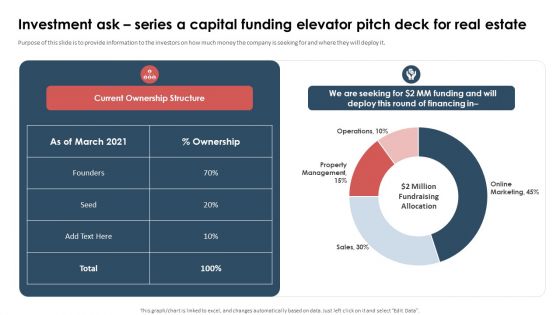
Investment Ask Series A Capital Funding Elevator Pitch Deck For Real Estate Slides PDF
Purpose of this slide is to provide information to the investors on how much money the company is seeking for and where they will deploy it. Presenting this PowerPoint presentation, titled Investment Ask Series A Capital Funding Elevator Pitch Deck For Real Estate Slides PDF, with topics curated by our researchers after extensive research. This editable presentation is available for immediate download and provides attractive features when used. Download now and captivate your audience. Presenting this Investment Ask Series A Capital Funding Elevator Pitch Deck For Real Estate Slides PDF. Our researchers have carefully researched and created these slides with all aspects taken into consideration. This is a completely customizable Investment Ask Series A Capital Funding Elevator Pitch Deck For Real Estate Slides PDF that is available for immediate downloading. Download now and make an impact on your audience. Highlight the attractive features available with our PPTs.
-
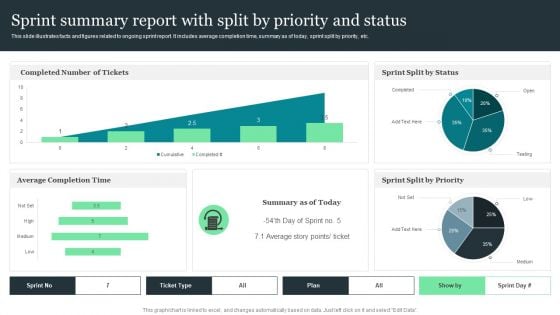
Sprint Summary Report With Split By Priority And Status Brochure PDF
This slide illustrates facts and figures related to ongoing sprint report. It includes average completion time, summary as of today, sprint split by priority, etc. Showcasing this set of slides titled Sprint Summary Report With Split By Priority And Status Brochure PDF. The topics addressed in these templates are Average Completion Time, Sprint Split By Priority, Sprint Split By Status. All the content presented in this PPT design is completely editable. Download it and make adjustments in color, background, font etc. as per your unique business setting.
-
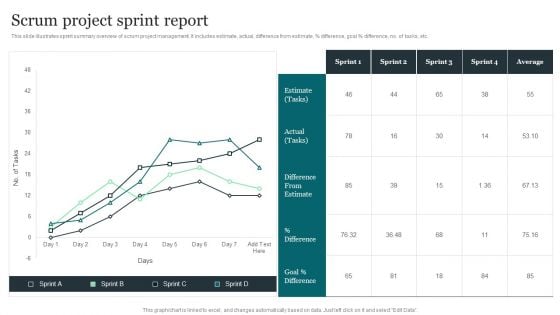
Scrum Project Sprint Report Guidelines PDF
This slide illustrates sprint summary overview of scrum project management. It includes estimate, actual, difference from estimate, percent difference, goal percent difference, no. of tasks, etc. Pitch your topic with ease and precision using this Scrum Project Sprint Report Guidelines PDF. This layout presents information on Scrum Project, Sprint Report. It is also available for immediate download and adjustment. So, changes can be made in the color, design, graphics or any other component to create a unique layout.
-
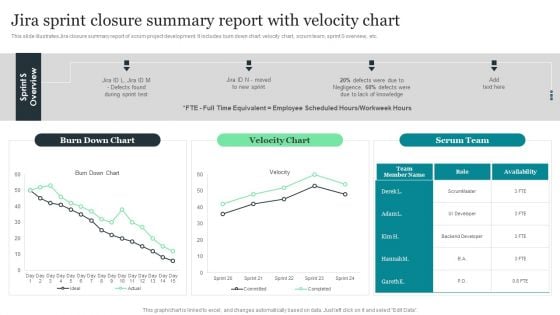
Jira Sprint Closure Summary Report With Velocity Chart Designs PDF
This slide illustrates Jira closure summary report of scrum project development. It includes burn down chart, velocity chart, scrum team, sprint S overview, etc. Pitch your topic with ease and precision using this Jira Sprint Closure Summary Report With Velocity Chart Designs PDF. This layout presents information on Jira Sprint Closure, Summary Report, Velocity Chart. It is also available for immediate download and adjustment. So, changes can be made in the color, design, graphics or any other component to create a unique layout.
-
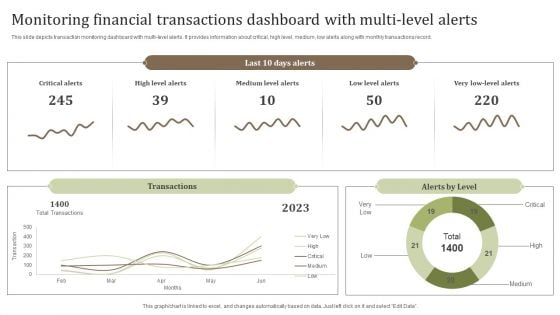
Monitoring Financial Transactions Dashboard With Multi Level Alerts Background PDF
This slide depicts transaction monitoring dashboard with multi-level alerts. It provides information about critical, high level, medium, low alerts along with monthly transactions record. Pitch your topic with ease and precision using this Monitoring Financial Transactions Dashboard With Multi Level Alerts Background PDF. This layout presents information on Critical Alerts, Medium Level Alerts, Total Transactions. It is also available for immediate download and adjustment. So, changes can be made in the color, design, graphics or any other component to create a unique layout.
-
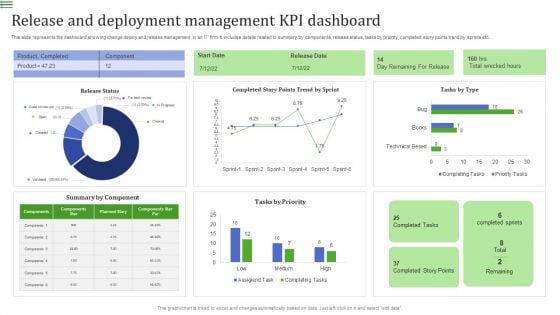
Release And Deployment Management KPI Dashboard Summary PDF
This slide represents the dashboard showing change deploy and release management in an IT firm. It includes details related to summary by components, release status, tasks by priority, completed story points trend by sprints etc.Showcasing this set of slides titled Release And Deployment Management KPI Dashboard Summary PDF. The topics addressed in these templates are Product Completed, Summary Component, Completed Story. All the content presented in this PPT design is completely editable. Download it and make adjustments in color, background, font etc. as per your unique business setting.
-
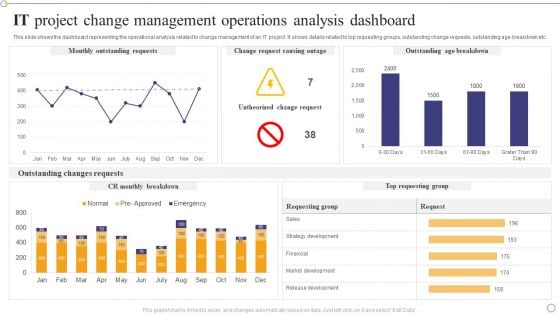
IT Project Change Management Operations Analysis Dashboard Infographics PDF
This slide shows the dashboard representing the operational analysis related to change management of an IT project. It shows details related to top requesting groups, outstanding change requests, outstanding age breakdown etc.Pitch your topic with ease and precision using this IT Project Change Management Operations Analysis Dashboard Infographics PDF. This layout presents information on Outstanding Requests, Outstanding Breakdown, Outstanding Changes. It is also available for immediate download and adjustment. So, changes can be made in the color, design, graphics or any other component to create a unique layout.
-
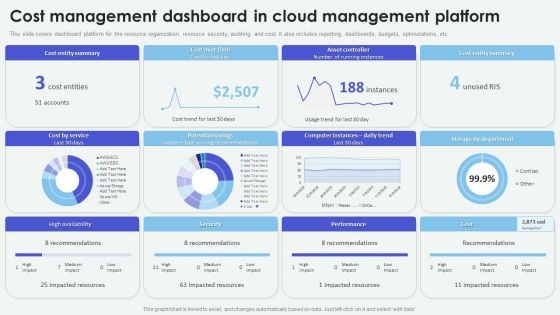
Cloud Based Computing Analysis Cost Management Dashboard In Cloud Management Formats PDF
Slidegeeks is here to make your presentations a breeze with Cloud Based Computing Analysis Cost Management Dashboard In Cloud Management Formats PDF With our easy-to-use and customizable templates, you can focus on delivering your ideas rather than worrying about formatting. With a variety of designs to choose from, youre sure to find one that suits your needs. And with animations and unique photos, illustrations, and fonts, you can make your presentation pop. So whether youre giving a sales pitch or presenting to the board, make sure to check out Slidegeeks first
-
Robotic Process Automation Metrics Tracker With Work Item Statistics Information PDF
This slide covers the RPA dashboard for analysing process data status. It also includes process details such as run success rate, inputs, processing, fail, output, robotic run minutes, total value generated, work items processed. Pitch your topic with ease and precision using this Robotic Process Automation Metrics Tracker With Work Item Statistics Information PDF. This layout presents information on Robotic Process Automation, Metrics Tracker, Work Item Statistics. It is also available for immediate download and adjustment. So, changes can be made in the color, design, graphics or any other component to create a unique layout.
-
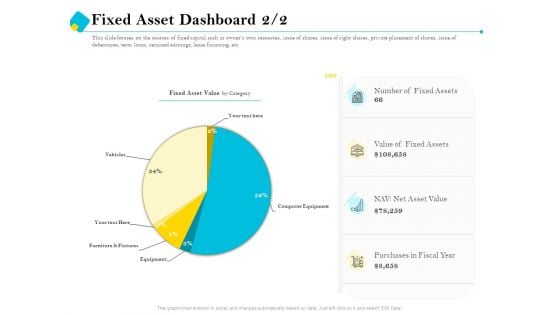
Assessment Of Fixed Assets Fixed Asset Dashboard Download PDF
Presenting this set of slides with name assessment of fixed assets fixed asset dashboard download pdf. The topics discussed in these slides are cost, value, original, fixed asset. This is a completely editable PowerPoint presentation and is available for immediate download. Download now and impress your audience.
-
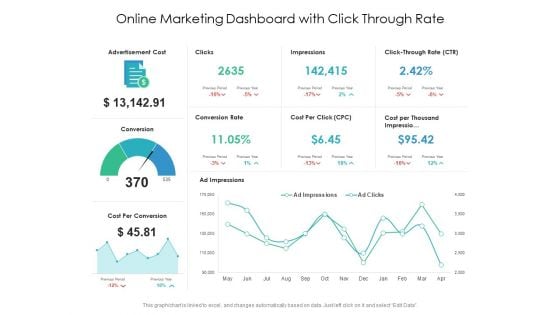
Online Marketing Dashboard With Click Through Rate Ppt PowerPoint Presentation Professional Graphics Tutorials PDF
Presenting this set of slides with name online marketing dashboard with click through rate ppt powerpoint presentation professional graphics tutorials pdf. The topics discussed in these slides are advertisement cost, clicks impressions, conversion rate, cost per click, cost per thousand impressions. This is a completely editable PowerPoint presentation and is available for immediate download. Download now and impress your audience.
-
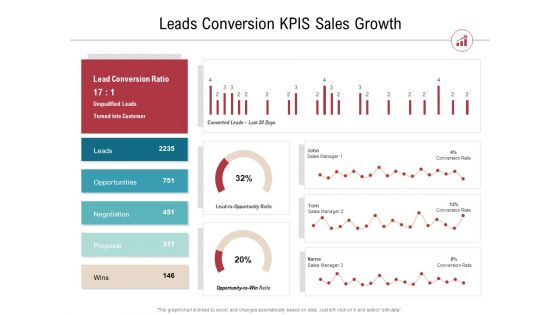
Leads Conversion Kpis Sales Growth Ppt PowerPoint Presentation Gallery Microsoft PDF
Presenting this set of slides with name leads conversion kpis sales growth ppt powerpoint presentation gallery microsoft pdf. The topics discussed in these slides are lead conversion ratio, leads, opportunities, negotiation, proposal. This is a completely editable PowerPoint presentation and is available for immediate download. Download now and impress your audience.
-
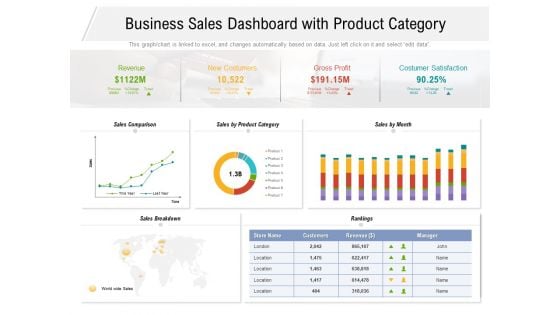
Business Sales Dashboard With Product Category Ppt PowerPoint Presentation Model Objects PDF
Presenting this set of slides with name business sales dashboard with product category ppt powerpoint presentation model objects pdf. The topics discussed in these slides are revenue, new costumers, gross profit, costumer satisfaction, sales comparison, sales product category, sales month. This is a completely editable PowerPoint presentation and is available for immediate download. Download now and impress your audience.
-
Project Quality Management Plan Dashboard Tracking Quality Ppt Summary Rules PDF
Presenting this set of slides with name project quality management plan dashboard tracking quality ppt summary rules pdf. The topics discussed in these slide is dashboard tracking quality. This is a completely editable PowerPoint presentation and is available for immediate download. Download now and impress your audience.
-
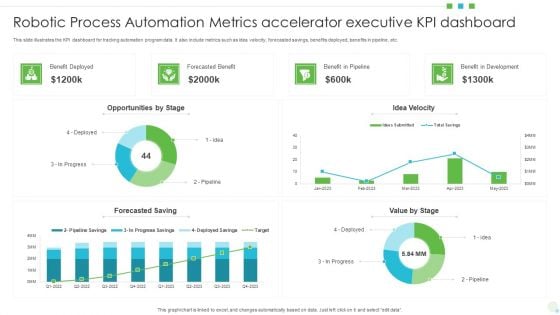
Robotic Process Automation Metrics Accelerator Executive KPI Dashboard Formats PDF
This slide illustrates the KPI dashboard for tracking automation program data. It also include metrics such as idea velocity, forecasted savings, benefits deployed, benefits in pipeline, etc. Showcasing this set of slides titled Robotic Process Automation Metrics Accelerator Executive KPI Dashboard Formats PDF. The topics addressed in these templates are Opportunities, Benefit In Development, Value. All the content presented in this PPT design is completely editable. Download it and make adjustments in color, background, font etc. as per your unique business setting.
-
Robotic Process Automation Dashboard With Monthly Test Execution KPI Icons PDF
This slide covers RPA metrics for analyzing test execution on automated platforms. It also includes test execution metrics such as total test executed, test status, tests executed daily for different operation systems, etc. Pitch your topic with ease and precision using this Robotic Process Automation Dashboard With Monthly Test Execution KPI Icons PDF. This layout presents information on Robotic Process Automation Dashboard, Monthly Test Execution Kpi. It is also available for immediate download and adjustment. So, changes can be made in the color, design, graphics or any other component to create a unique layout.
-
Total Account Payable And Receivable Metrics Ppt PowerPoint Presentation Icon Diagrams PDF
Presenting this set of slides with name total account payable and receivable metrics ppt powerpoint presentation icon diagrams pdf. The topics discussed in these slides are total accounts receivables, current ratio, total accounts payable, equity ratio, debt equity, total accounts receivable and payable aging. This is a completely editable PowerPoint presentation and is available for immediate download. Download now and impress your audience.
-
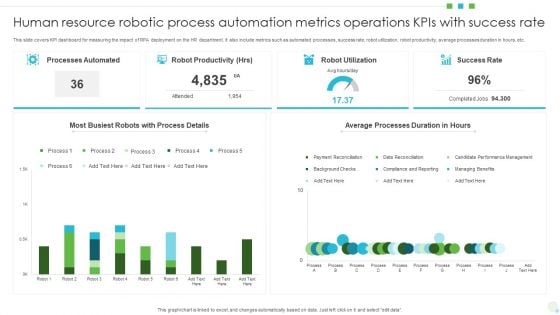
Human Resource Robotic Process Automation Metrics Operations Kpis With Success Rate Themes PDF
This slide covers KPI dashboard for measuring the impact of RPA deployment on the HR department. It also include metrics such as automated processes, success rate, robot utilization, robot productivity, average processes duration in hours, etc. Showcasing this set of slides titled Human Resource Robotic Process Automation Metrics Operations Kpis With Success Rate Themes PDF. The topics addressed in these templates are Processes Automated, Robot Productivity, Robot Utilization. All the content presented in this PPT design is completely editable. Download it and make adjustments in color, background, font etc. as per your unique business setting.
-
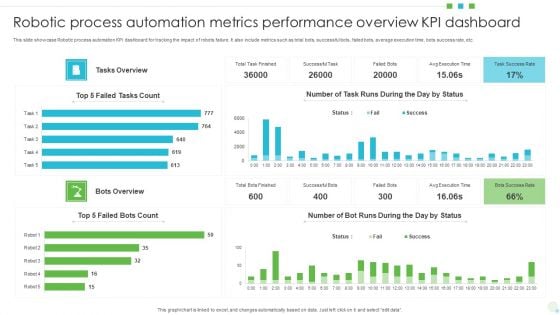
Robotic Process Automation Metrics Performance Overview KPI Dashboard Download PDF
This slide showcase Robotic process automation KPI dashboard for tracking the impact of robots failure. It also include metrics such as total bots, successful bots, failed bots, average execution time, bots success rate, etc. Showcasing this set of slides titled Robotic Process Automation Metrics Performance Overview KPI Dashboard Download PDF. The topics addressed in these templates are Robotic Process Automation, Metrics Performance Overview, Kpi Dashboard. All the content presented in this PPT design is completely editable. Download it and make adjustments in color, background, font etc. as per your unique business setting.
-
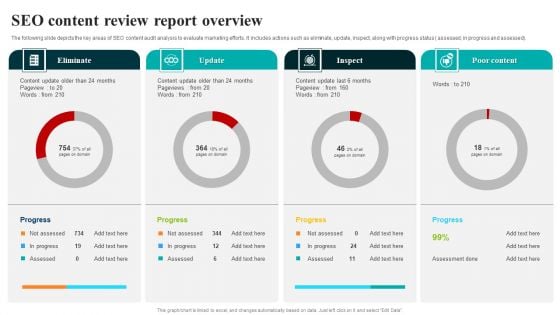
SEO Content Review Report Overview Formats PDF
The following slide depicts the key areas of SEO content audit analysis to evaluate marketing efforts. It includes actions such as eliminate, update, inspect, along with progress status assessed, in progress and assessed. Showcasing this set of slides titled SEO Content Review Report Overview Formats PDF. The topics addressed in these templates are Content Review, Report Overview. All the content presented in this PPT design is completely editable. Download it and make adjustments in color, background, font etc. as per your unique business setting.
-
AI Machine Learning Presentations Artificial Intelligence Ppt Professional Infographics PDF
Presenting this set of slides with name ai machine learning presentations artificial intelligence ppt professional infographics pdf. The topics discussed in these slides are artificial intelligence. This is a completely editable PowerPoint presentation and is available for immediate download. Download now and impress your audience.
-
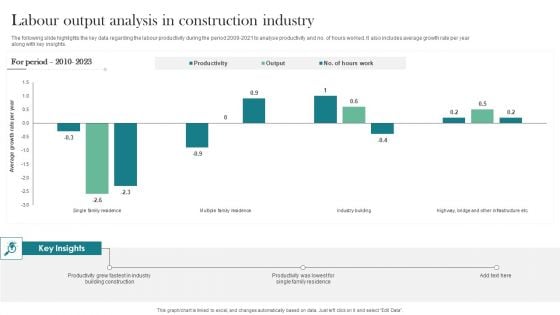
Labour Output Analysis In Construction Industry Information PDF
The following slide highlights the key data regarding the labour productivity during the period 2009 2021 to analyse productivity and no. of hours worked. It also includes average growth rate per year along with key insights. Showcasing this set of slides titled Labour Output Analysis In Construction Industry Information PDF. The topics addressed in these templates are Labour Construction, Output Analysis Icon. All the content presented in this PPT design is completely editable. Download it and make adjustments in color, background, font etc. as per your unique business setting.
-
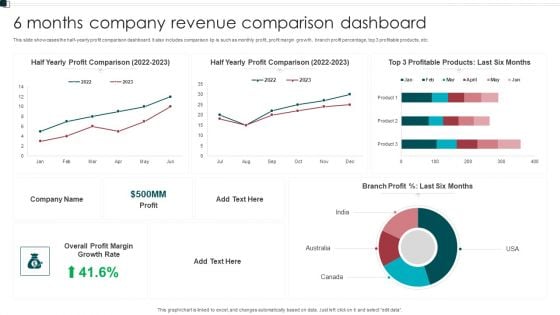
6 Months Company Revenue Comparison Dashboard Graphics PDF
This slide showcases the half yearly profit comparison dashboard. It also includes comparison kp is such as monthly profit, profit margin growth, branch profit percentage, top 3 profitable products, etc. Showcasing this set of slides titled 6 Months Company Revenue Comparison Dashboard Graphics PDF. The topics addressed in these templates are Growth Rate, Overall Profit Margin, Branch Profit. All the content presented in this PPT design is completely editable. Download it and make adjustments in color, background, font etc. as per your unique business setting.
-
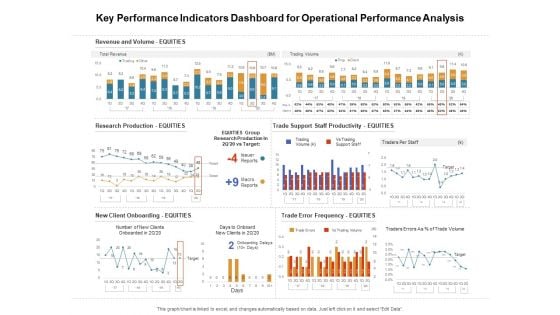
Venture Capitalist Control Board Key Performance Indicators Dashboard For Operational Performance Analysis Formats PDF
Presenting this set of slides with name venture capitalist control board key performance indicators dashboard for operational performance analysis formats pdf. The topics discussed in these slides are revenue and volume, research production, new client onboarding, trade support staff productivity, trade error frequency. This is a completely editable PowerPoint presentation and is available for immediate download. Download now and impress your audience.
-
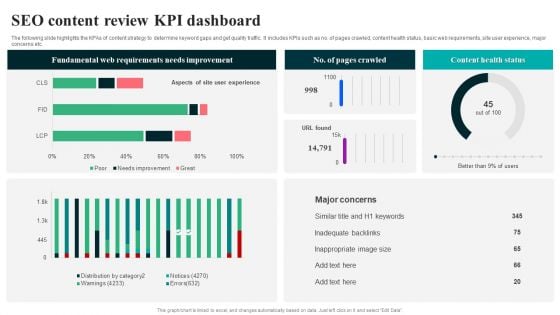
SEO Content Review KPI Dashboard Summary PDF
The following slide highlights the KPAs of content strategy to determine keyword gaps and get quality traffic. It includes KPIs such as no. of pages crawled, content health status, basic web requirements, site user experience, major concerns etc. Pitch your topic with ease and precision using this SEO Content Review KPI Dashboard Summary PDF. This layout presents information on Fundamental Web Requirements, Needs Improvement. It is also available for immediate download and adjustment. So, changes can be made in the color, design, graphics or any other component to create a unique layout.
-
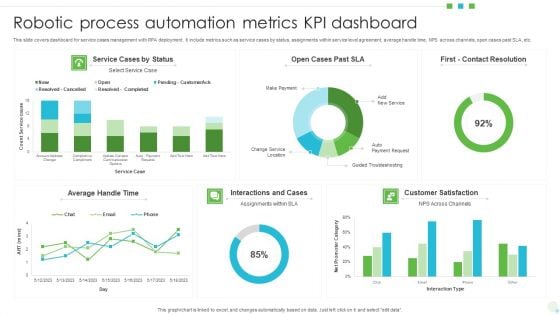
Robotic Process Automation Metrics KPI Dashboard Themes PDF
This slide covers dashboard for service cases management with RPA deployment. It include metrics such as service cases by status, assignments within service level agreement, average handle time, NPS across channels, open cases past SLA, etc. Showcasing this set of slides titled Robotic Process Automation Metrics KPI Dashboard Themes PDF. The topics addressed in these templates are Average, Service Cases, Customer Satisfaction. All the content presented in this PPT design is completely editable. Download it and make adjustments in color, background, font etc. as per your unique business setting.
-
Two Consecutive Years Revenue Comparison Topics PDF
This slide showcases profitability comparison with the help of a trend chart. It represents revenue, cost of goods sold, gross profit, net profit, etc. Pitch your topic with ease and precision using this Two Consecutive Years Revenue Comparison Topics PDF. This layout presents information on Revenue, Gross Profit, Net Income. It is also available for immediate download and adjustment. So, changes can be made in the color, design, graphics or any other component to create a unique layout.
-
Quarterly Comparison Of Security For Cloud Based Systems Threats Infographics PDF
This slide shows the various types of cloud security threats occurred during four quarters. It includes phishing, malware, IoT and password attacks. Pitch your topic with ease and precision using this Quarterly Comparison Of Security For Cloud Based Systems Threats Infographics PDF. This layout presents information on Quarterly Comparison Of Security, Cloud Based Systems Threats. It is also available for immediate download and adjustment. So, changes can be made in the color, design, graphics or any other component to create a unique layout.
-
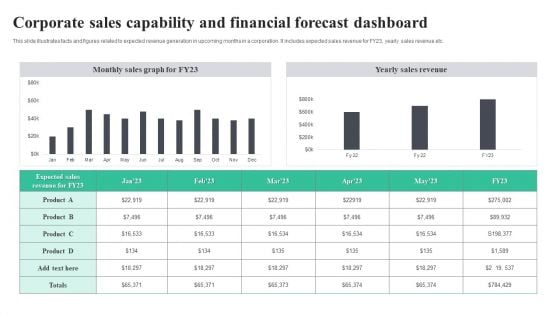
Corporate Sales Capability And Financial Forecast Dashboard Download PDF
This slide illustrates facts and figures related to expected revenue generation in upcoming months in a corporation. It includes expected sales revenue for FY23, yearly sales revenue etc. Showcasing this set of slides titled Corporate Sales Capability And Financial Forecast Dashboard Download PDF. The topics addressed in these templates are Corporate Sales, Capability And Financial, Forecast Dashboard. All the content presented in this PPT design is completely editable. Download it and make adjustments in color, background, font etc. as per your unique business setting
-
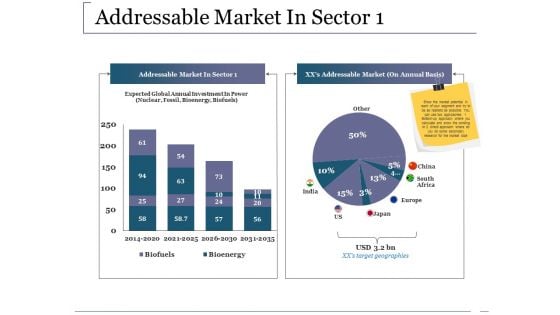
Addressable Market In Sector Ppt PowerPoint Presentation Ideas
This is a addressable market in sector ppt powerpoint presentation ideas. This is a two stage process. The stages in this process are business, addressable market in sector addressable market, south africa, europe.
-
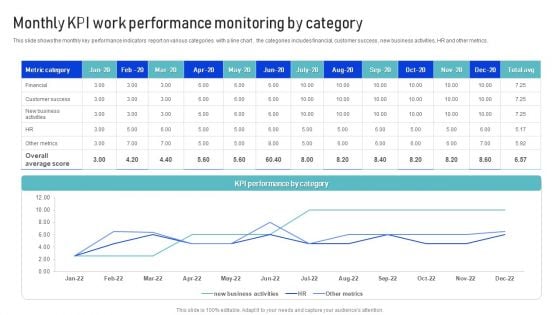
Monthly KPI Work Performance Monitoring By Category Microsoft PDF
This slide shows the monthly key performance indicators report on various categories with a line chart . the categories includes financial, customer success , new business activities, HR and other metrics. Pitch your topic with ease and precision using this Monthly KPI Work Performance Monitoring By Category Microsoft PDF. This layout presents information on Metrics, Financial, Customer Success. It is also available for immediate download and adjustment. So, changes can be made in the color, design, graphics or any other component to create a unique layout.
-
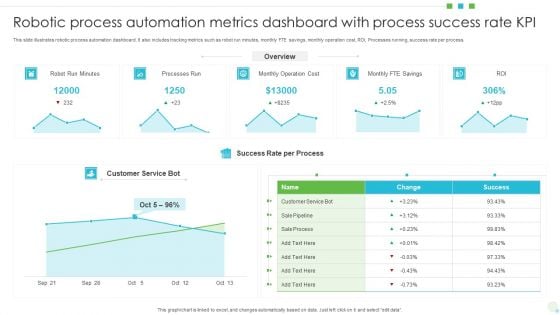
Robotic Process Automation Metrics Dashboard With Process Success Rate KPI Professional PDF
This slide illustrates robotic process automation dashboard. It also includes tracking metrics such as robot run minutes, monthly FTE savings, monthly operation cost, ROI, Processes running, success rate per process. Showcasing this set of slides titled Robotic Process Automation Metrics Dashboard With Process Success Rate KPI Professional PDF The topics addressed in these templates are Processes Run, Monthly Operation Cost, Customer Service Bot. All the content presented in this PPT design is completely editable. Download it and make adjustments in color, background, font etc. as per your unique business setting.
-
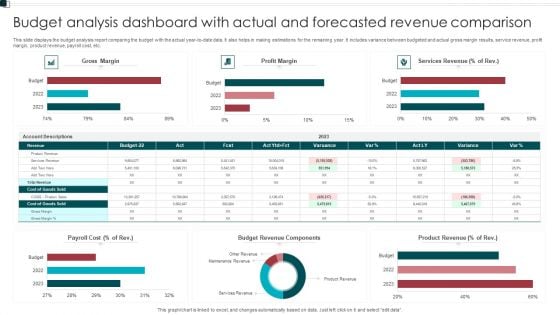
Budget Analysis Dashboard With Actual And Forecasted Revenue Comparison Structure PDF
This slide displays the budget analysis report comparing the budget with the actual year to date data. It also helps in making estimations for the remaining year. It includes variance between budgeted and actual gross margin results, service revenue, profit margin, product revenue, payroll cost, etc. Pitch your topic with ease and precision using this Budget Analysis Dashboard With Actual And Forecasted Revenue Comparison Structure PDF. This layout presents information on Payroll Cost, Budget Revenue Components, Product Revenue. It is also available for immediate download and adjustment. So, changes can be made in the color, design, graphics or any other component to create a unique layout.
-
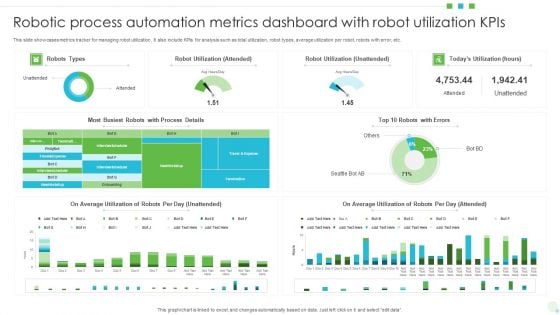
Robotic Process Automation Metrics Dashboard With Robot Utilization Kpis Background PDF
This slide showcases metrics tracker for managing robot utilization. It also include KPIs for analysis such as total utilization, robot types, average utilization per robot, robots with error, etc. Pitch your topic with ease and precision using this Robotic Process Automation Metrics Dashboard With Robot Utilization Kpis Background PDF. This layout presents information on Average Utilization, Robot Utilization, Automation Metrics Dashboard. It is also available for immediate download and adjustment. So, changes can be made in the color, design, graphics or any other component to create a unique layout.
-
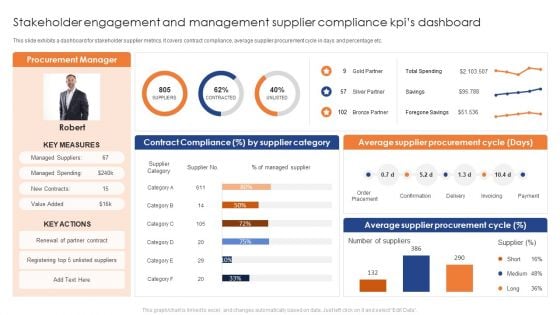
Stakeholder Engagement And Management Supplier Compliance Kpis Dashboard Pictures PDF
This slide exhibits a dashboard for stakeholder supplier metrics. It covers contract compliance, average supplier procurement cycle in days and percentage etc. Showcasing this set of slides titled Stakeholder Engagement And Management Supplier Compliance Kpis Dashboard Pictures PDF. The topics addressed in these templates are Average Supplier Procurement Cycle, Average Supplier Procurement Cycle . All the content presented in this PPT design is completely editable. Download it and make adjustments in color, background, font etc. as per your unique business setting.
-
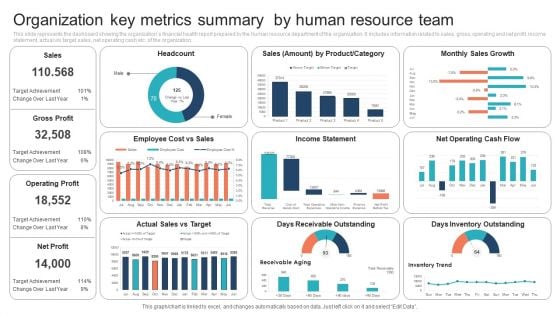
Organization Key Metrics Summary By Human Resource Team Information PDF
This slide represents the dashboard showing the organizations financial health report prepared by the human resource department of the organization. It includes information related to sales, gross, operating and net profit, income statement, actual vs target sales, net operating cash etc. of the organization.Showcasing this set of slides titled Organization Key Metrics Summary By Human Resource Team Information PDF. The topics addressed in these templates are Organization Key Metrics Summary, Human Resource Team. All the content presented in this PPT design is completely editable. Download it and make adjustments in color, background, font etc. as per your unique business setting.
-
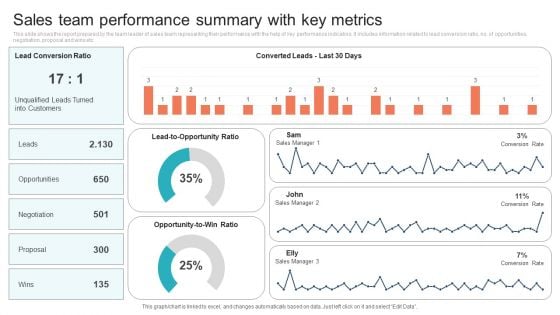
Sales Team Performance Summary With Key Metrics Background PDF
This slide shows the report prepared by the team leader of sales team representing their performance with the help of key performance indicators. It includes information related to lead conversion ratio, no. of opportunities, negotiation, proposal and wins etc. Showcasing this set of slides titled Sales Team Performance Summary With Key Metrics Background PDF. The topics addressed in these templates are Opportunities, Negotiation, Proposal. All the content presented in this PPT design is completely editable. Download it and make adjustments in color, background, font etc. as per your unique business setting.
-
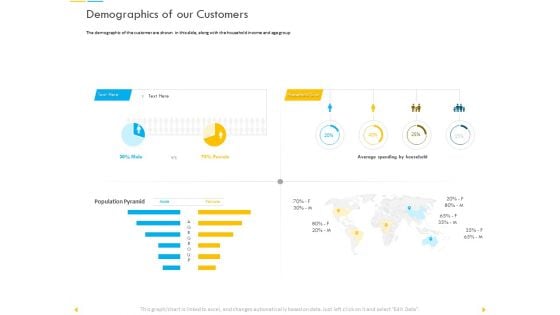
Customer Churn Prediction And Prevention Demographics Of Our Customers Brochure PDF
Presenting this set of slides with name customer churn prediction and prevention demographics of our customers brochure pdf. The topics discussed in these slide is demographics of our customers. This is a completely editable PowerPoint presentation and is available for immediate download. Download now and impress your audience.
-
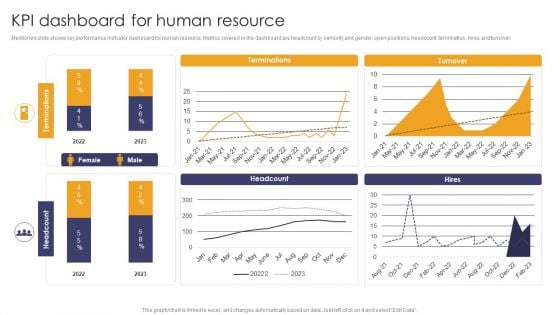
Internal Employee Succession KPI Dashboard For Human Resource Information PDF
Mentioned slide shows key performance indicator dashboard for human resource. Metrics covered in the dashboard are headcount by seniority and gender, open positions, headcount, termination, hires and turnover. If you are looking for a format to display your unique thoughts, then the professionally designed Internal Employee Succession KPI Dashboard For Human Resource Information PDF is the one for you. You can use it as a Google Slides template or a PowerPoint template. Incorporate impressive visuals, symbols, images, and other charts. Modify or reorganize the text boxes as you desire. Experiment with shade schemes and font pairings. Alter, share or cooperate with other people on your work. Download Internal Employee Succession KPI Dashboard For Human Resource Information PDF and find out how to give a successful presentation. Present a perfect display to your team and make your presentation unforgettable.
-
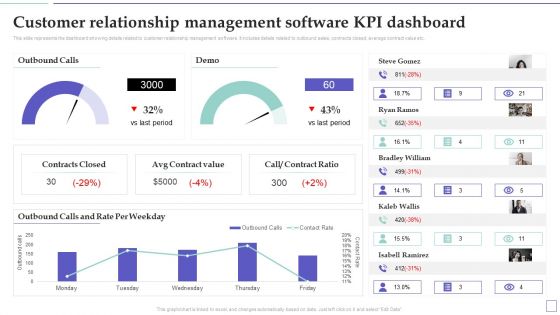
System Deployment Project Customer Relationship Management Software Kpi Dashboard Rules PDF
This slide represents the dashboard showing details related to customer relationship management software. It includes details related to outbound sales, contracts closed, average contract value etc. Present like a pro with System Deployment Project Customer Relationship Management Software Kpi Dashboard Rules PDF Create beautiful presentations together with your team, using our easy-to-use presentation slides. Share your ideas in real-time and make changes on the fly by downloading our templates. So whether youre in the office, on the go, or in a remote location, you can stay in sync with your team and present your ideas with confidence. With Slidegeeks presentation got a whole lot easier. Grab these presentations today.
-
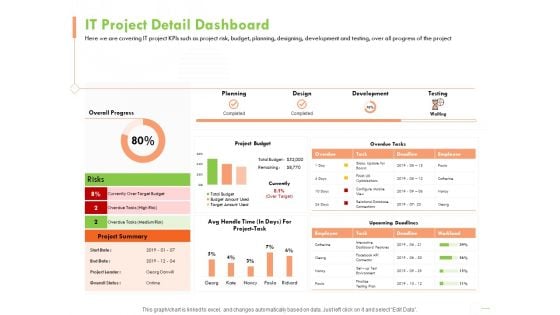
Welfare Work Value IT Project Detail Dashboard Ppt Model Clipart Images PDF
Presenting this set of slides with name welfare work value it project detail dashboard ppt model clipart images pdf. The topics discussed in these slides are planning, design, development, testing. This is a completely editable PowerPoint presentation and is available for immediate download. Download now and impress your audience.
-
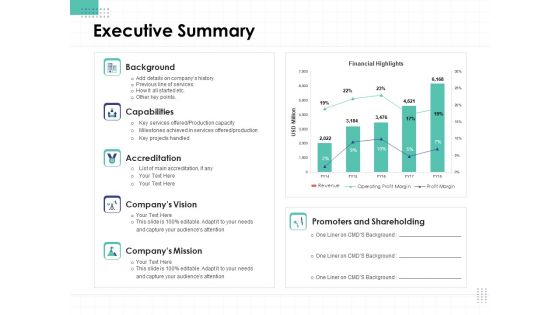
Performance Assessment Executive Summary Ppt Show Ideas PDF
Presenting this set of slides with name performance assessment executive summary ppt show ideas pdf. The topics discussed in these slides are background, capabilities, accreditation, companys vision, companys mission. This is a completely editable PowerPoint presentation and is available for immediate download. Download now and impress your audience.
-
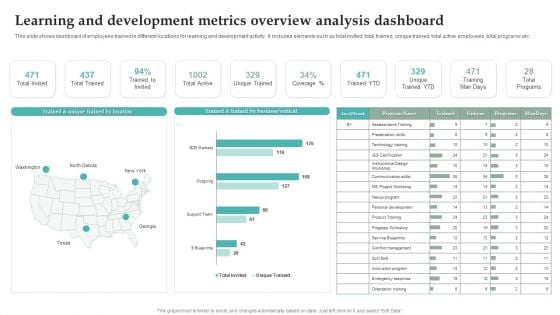
Learning And Development Metrics Overview Analysis Dashboard Graphics PDF
This slide shows dashboard of employees trained in different locations for learning and development activity. It includes elements such as total invited, total trained, unique trained, total active employees, total programs etc. Pitch your topic with ease and precision using this Learning And Development Metrics Overview Analysis Dashboard Graphics PDF. This layout presents information on Unique Trained YTD, Training Man Days, Total Programs. It is also available for immediate download and adjustment. So, changes can be made in the color, design, graphics or any other component to create a unique layout.
-
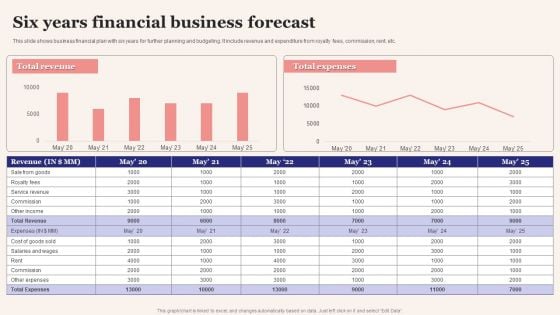
Six Years Financial Business Forecast Infographics PDF
This slide shows business financial plan with six years for further planning and budgeting. It include revenue and expenditure from royalty fees, commission, rent, etc. Showcasing this set of slides titled Six Years Financial Business Forecast Infographics PDF. The topics addressed in these templates are Six Years Financial, Business Forecast. All the content presented in this PPT design is completely editable. Download it and make adjustments in color, background, font etc. as per your unique business setting.
-
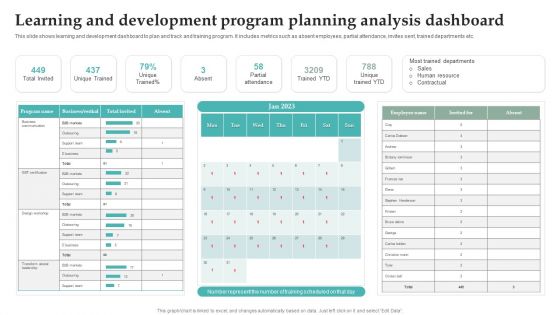
Learning And Development Program Planning Analysis Dashboard Information PDF
This slide shows learning and development dashboard to plan and track and training program. It includes metrics such as absent employees, partial attendance, invites sent, trained departments etc. Showcasing this set of slides titled Learning And Development Program Planning Analysis Dashboard Information PDF. The topics addressed in these templates are Partial Attendance, Trained YTD, Unique Trained YTD. All the content presented in this PPT design is completely editable. Download it and make adjustments in color, background, font etc. as per your unique business setting.
-
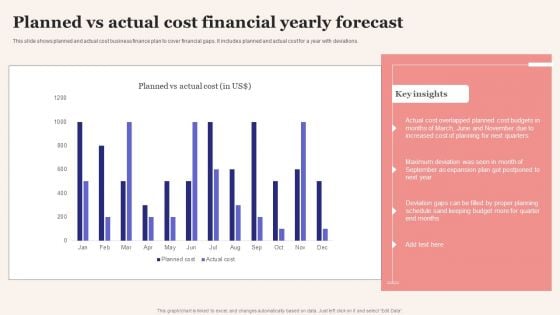
Planned Vs Actual Cost Financial Yearly Forecast Portrait PDF
This slide shows planned and actual cost business finance plan to cover financial gaps. It includes planned and actual cost for a year with deviations. Pitch your topic with ease and precision using this Planned Vs Actual Cost Financial Yearly Forecast Portrait PDF. This layout presents information on Planned Vs Actual Cost, Financial Yearly Forecast. It is also available for immediate download and adjustment. So, changes can be made in the color, design, graphics or any other component to create a unique layout.
-
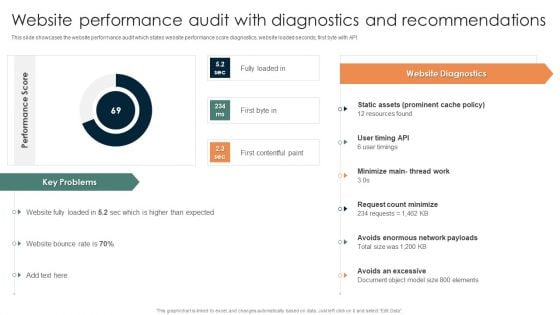
Online Mechanism For Site Website Performance Audit With Diagnostics Background PDF
This slide showcases the website performance audit which states website performance score diagnostics, website loaded seconds, first byte with API. Are you in need of a template that can accommodate all of your creative concepts This one is crafted professionally and can be altered to fit any style. Use it with Google Slides or PowerPoint. Include striking photographs, symbols, depictions, and other visuals. Fill, move around, or remove text boxes as desired. Test out color palettes and font mixtures. Edit and save your work, or work with colleagues. Download Online Mechanism For Site Website Performance Audit With Diagnostics Background PDF and observe how to make your presentation outstanding. Give an impeccable presentation to your group and make your presentation unforgettable.
-
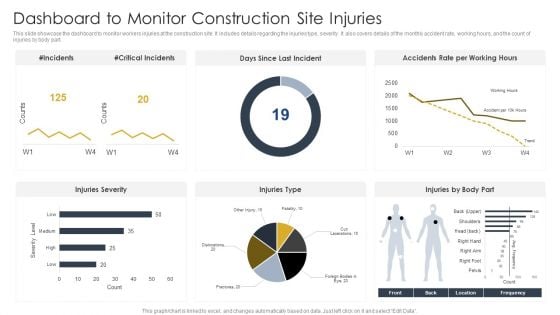
Dashboard To Monitor Construction Site Injuries Construction Site Safety Plan Elements PDF
This slide showcase the dashboard to monitor workers injuries at the construction site. It includes details regarding the injuries type, severity. It also covers details of the monthly accident rate, working hours, and the count of injuries by body part. Coming up with a presentation necessitates that the majority of the effort goes into the content and the message you intend to convey. The visuals of a PowerPoint presentation can only be effective if it supplements and supports the story that is being told. Keeping this in mind our experts created Dashboard To Monitor Construction Site Injuries Construction Site Safety Plan Elements PDF to reduce the time that goes into designing the presentation. This way, you can concentrate on the message while our designers take care of providing you with the right template for the situation.
-
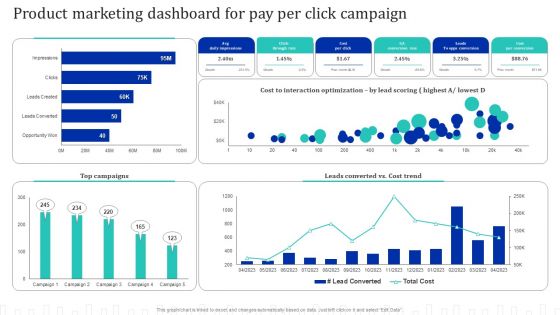
Approach Optimization For Brand Promotion Strategy Product Marketing Dashboard For Pay Per Click Campaign Brochure PDF
Coming up with a presentation necessitates that the majority of the effort goes into the content and the message you intend to convey. The visuals of a PowerPoint presentation can only be effective if it supplements and supports the story that is being told. Keeping this in mind our experts created Approach Optimization For Brand Promotion Strategy Product Marketing Dashboard For Pay Per Click Campaign Brochure PDF to reduce the time that goes into designing the presentation. This way, you can concentrate on the message while our designers take care of providing you with the right template for the situation.
-
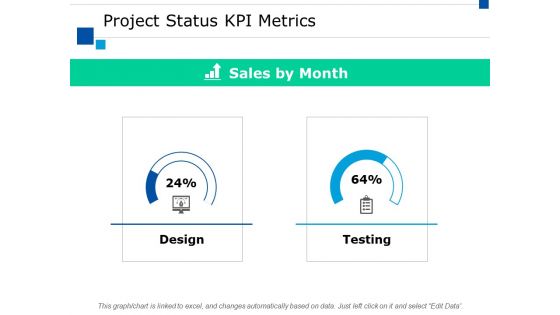
Project Status Kpi Metrics Ppt PowerPoint Presentation Show Format Ideas
This is a project status kpi metrics ppt powerpoint presentation show format ideas. This is a three stage process. The stages in this process are finance, marketing, management, investment, analysis.
-
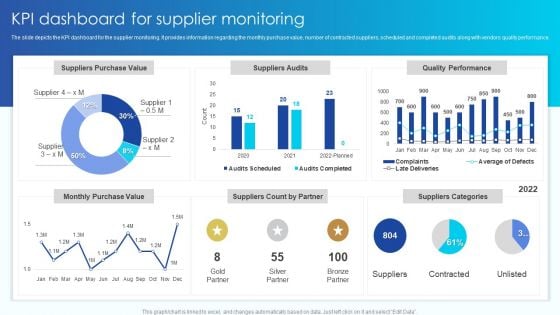
KPI Dashboard For Supplier Monitoring Vendor Management Program For Supplier Growth And Development Background PDF
The slide depicts the KPI dashboard for the supplier monitoring. It provides information regarding the monthly purchase value, number of contracted suppliers, scheduled and completed audits along with vendors quality performance.Do you have to make sure that everyone on your team knows about any specific topic I yes, then you should give KPI Dashboard For Supplier Monitoring Vendor Management Program For Supplier Growth And Development Background PDF a try. Our experts have put a lot of knowledge and effort into creating this impeccable KPI Dashboard For Supplier Monitoring Vendor Management Program For Supplier Growth And Development Background PDF. You can use this template for your upcoming presentations, as the slides are perfect to represent even the tiniest detail. You can download these templates from the Slidegeeks website and these are easy to edit. So grab these today.
-
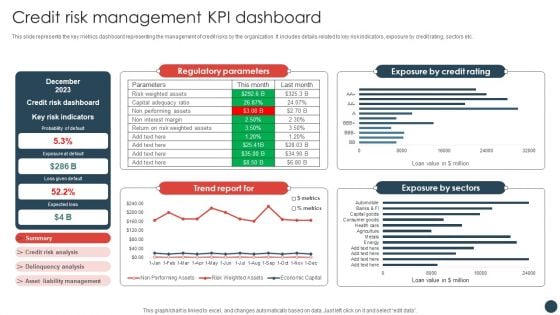
Strategic Risk Management Plan Credit Risk Management KPI Dashboard Information PDF
This slide represents the key metrics dashboard representing the management of credit risks by the organization. It includes details related to key risk indicators, exposure by credit rating, sectors etc.Coming up with a presentation necessitates that the majority of the effort goes into the content and the message you intend to convey. The visuals of a PowerPoint presentation can only be effective if it supplements and supports the story that is being told. Keeping this in mind our experts created Strategic Risk Management Plan Credit Risk Management KPI Dashboard Information PDF to reduce the time that goes into designing the presentation. This way, you can concentrate on the message while our designers take care of providing you with the right template for the situation.
-
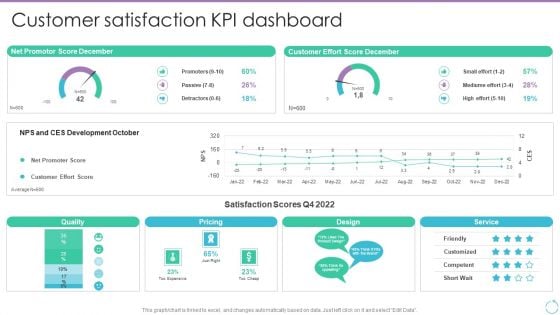
Personal Branding Plan For Executives Customer Satisfaction KPI Dashboard Graphics PDF
This graph or chart is linked to excel, and changes automatically based on data. Just left click on it and select Edit Data. Whether you have daily or monthly meetings, a brilliant presentation is necessary. Personal Branding Plan For Executives Customer Satisfaction KPI Dashboard Graphics PDF can be your best option for delivering a presentation. Represent everything in detail using Personal Branding Plan For Executives Customer Satisfaction KPI Dashboard Graphics PDF and make yourself stand out in meetings. The template is versatile and follows a structure that will cater to your requirements. All the templates prepared by Slidegeeks are easy to download and edit. Our research experts have taken care of the corporate themes as well. So, give it a try and see the results.
-
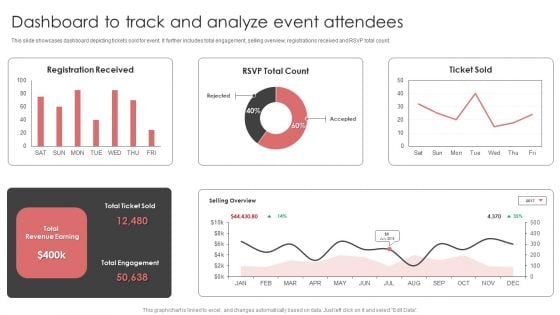
New Product Launch Event Management Activities Dashboard To Track And Analyze Event Attendees Rules PDF
This slide showcases dashboard depicting tickets sold for event. It further includes total engagement, selling overview, registrations received and RSVP total count.Get a simple yet stunning designed New Product Launch Event Management Activities Dashboard To Track And Analyze Event Attendees Rules PDF. It is the best one to establish the tone in your meetings. It is an excellent way to make your presentations highly effective. So, download this PPT today from Slidegeeks and see the positive impacts. Our easy-to-edit New Product Launch Event Management Activities Dashboard To Track And Analyze Event Attendees Rules PDF can be your go-to option for all upcoming conferences and meetings. So, what are you waiting for Grab this template today.
-
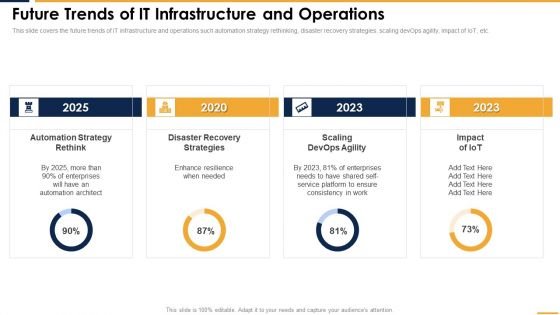
Future Trends Of IT Infrastructure And Operations Professional PDF
This slide covers the future trends of IT infrastructure and operations such automation strategy rethinking, disaster recovery strategies, scaling devOps agility, impact of IoT, etc. Crafting an eye catching presentation has never been more straightforward. Let your presentation shine with this tasteful yet straightforward Future Trends Of IT Infrastructure And Operations Professional PDF template. It offers a minimalistic and classy look that is great for making a statement. The colors have been employed intelligently to add a bit of playfulness while still remaining professional. Construct the ideal Future Trends Of IT Infrastructure And Operations Professional PDF that effortlessly grabs the attention of your audience Begin now and be certain to wow your customers.
-
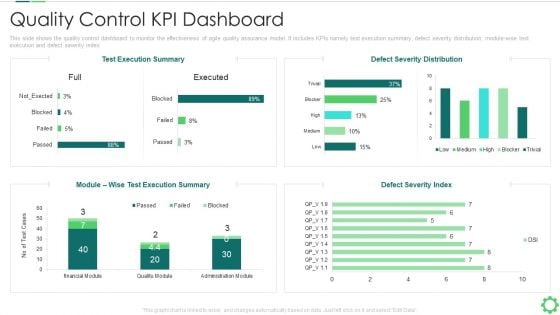
Agile Quality Control Framework IT Quality Control KPI Dashboard Template PDF
This slide shows the quality control dashboard to monitor the effectiveness of agile quality assurance model. It includes KPIs namely test execution summary, defect severity distribution, module wise text execution and defect severity index. Deliver and pitch your topic in the best possible manner with this agile quality control framework it quality control kpi dashboard template pdf. Use them to share invaluable insights on quality control kpi dashboard and impress your audience. This template can be altered and modified as per your expectations. So, grab it now.
-
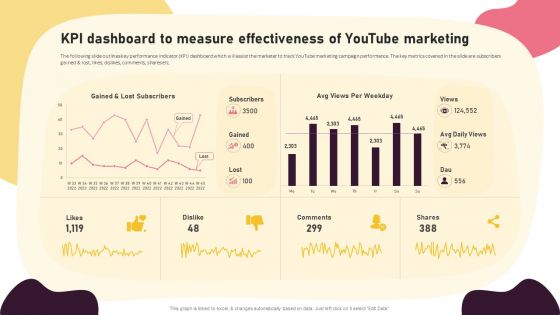
Video Promotion Techniques KPI Dashboard To Measure Effectiveness Of Youtube Pictures PDF
The following slide outlines key performance indicator KPI dashboard which will assist the marketer to track YouTube marketing campaign performance. The key metrics covered in the slide are subscribers gained and lost, likes, dislikes, comments, shares etc. Explore a selection of the finest Video Promotion Techniques KPI Dashboard To Measure Effectiveness Of Youtube Pictures PDF here. With a plethora of professionally designed and pre-made slide templates, you can quickly and easily find the right one for your upcoming presentation. You can use our Video Promotion Techniques KPI Dashboard To Measure Effectiveness Of Youtube Pictures PDF to effectively convey your message to a wider audience. Slidegeeks has done a lot of research before preparing these presentation templates. The content can be personalized and the slides are highly editable. Grab templates today from Slidegeeks.
-
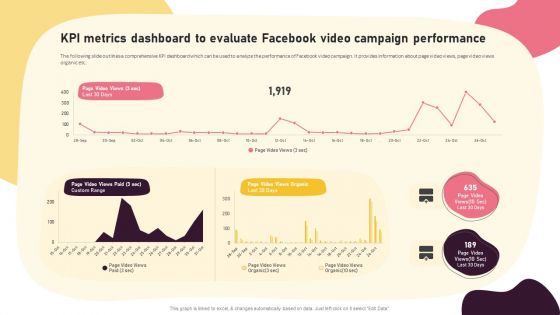
Video Promotion Techniques KPI Metrics Dashboard To Evaluate Facebook Video Introduction PDF
The following slide outlines a comprehensive KPI dashboard which can be used to analyze the performance of Facebook video campaign. It provides information about page video views, page video views organic etc. The best PPT templates are a great way to save time, energy, and resources. Slidegeeks have 100 percent editable powerpoint slides making them incredibly versatile. With these quality presentation templates, you can create a captivating and memorable presentation by combining visually appealing slides and effectively communicating your message. Download Video Promotion Techniques KPI Metrics Dashboard To Evaluate Facebook Video Introduction PDF from Slidegeeks and deliver a wonderful presentation.
-
Annual Business Financial Summary Dashboard Themes PDF
This slide shows annual financial report dashboard of company to monitor yearly business performance. It includes various indicators such as revenue, net profits, costs and breakdown of cost. Showcasing this set of slides titled Annual Business Financial Summary Dashboard Themes PDF. The topics addressed in these templates are Revenue, Costs, Net Profit. All the content presented in this PPT design is completely editable. Download it and make adjustments in color, background, font etc. as per your unique business setting.
-
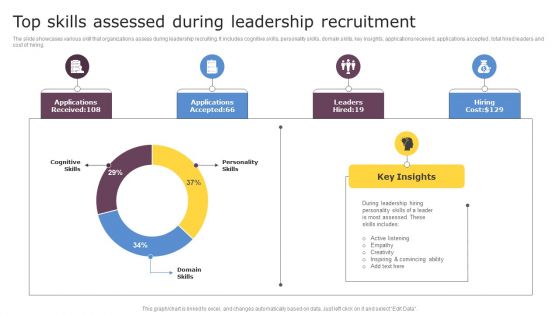
Top Skills Assessed During Leadership Recruitment Infographics PDF
The slide showcases various skill that organizations assess during leadership recruiting. It includes cognitive skills, personality skills, domain skills, key insights, applications received, applications accepted , total hired leaders and cost of hiring. Showcasing this set of slides titled Top Skills Assessed During Leadership Recruitment Infographics PDF. The topics addressed in these templates are Cognitive Skills, Personality Skills, Domain Skills. All the content presented in this PPT design is completely editable. Download it and make adjustments in color, background, font etc. as per your unique business setting.
-
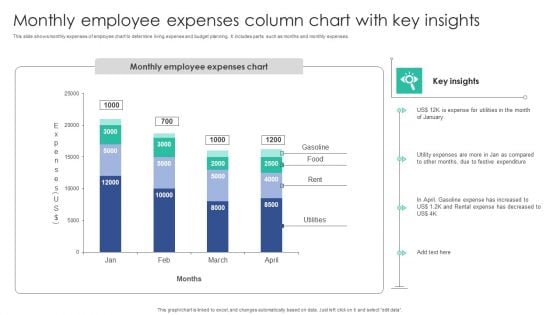
Monthly Employee Expenses Column Chart With Key Insights Download PDF
This slide shows monthly expenses of employee chart to determine living expense and budget planning. It includes parts such as months and monthly expenses.Showcasing this set of slides titled Monthly Employee Expenses Column Chart With Key Insights Download PDF. The topics addressed in these templates are Expense Utilities, Festive Expenditure, Gasoline Expense. All the content presented in this PPT design is completely editable. Download it and make adjustments in color, background, font etc. as per your unique business setting.
-
Online Transformation With Agile Software Methodology IT Tracking Agile Project Management Activities Dashboard Introduction PDF
This slide provides information regarding essential Agile Project management activities tracking dashboard in terms of project health, tasks, progress, time, cost, workload. Deliver an awe inspiring pitch with this creative online transformation with agile software methodology it tracking agile project management activities dashboard introduction pdf bundle. Topics like health, tasks, progress, workload, cost can be discussed with this completely editable template. It is available for immediate download depending on the needs and requirements of the user.
-
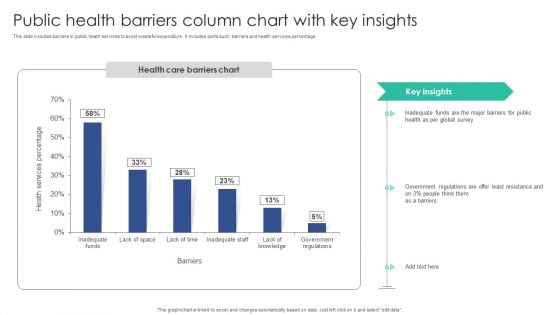
Public Health Barriers Column Chart With Key Insights Portrait PDF
This slide includes barriers in public heath services to avoid wasteful expenditure . It includes parts such barriers and health services percentage.Pitch your topic with ease and precision using this Public Health Barriers Column Chart With Key Insights Portrait PDF. This layout presents information on Inadequate Funds, Global Survey, Government Regulations. It is also available for immediate download and adjustment. So, changes can be made in the color, design, graphics or any other component to create a unique layout.
-
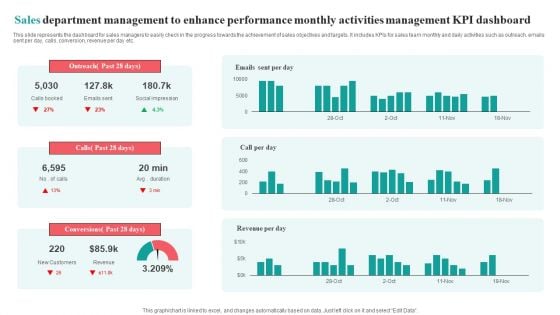
Sales Department Management To Enhance Performance Monthly Activities Management KPI Dashboard Brochure PDF
This slide represents the dashboard for sales managers to easily check in the progress towards the achievement of sales objectives and targets. It includes KPIs for sales team monthly and daily activities such as outreach, emails sent per day, calls, conversion, revenue per day etc.Pitch your topic with ease and precision using this Sales Department Management To Enhance Performance Monthly Activities Management KPI Dashboard Brochure PDF. This layout presents information on Social Impression, Conversions Past, Outreach Past. It is also available for immediate download and adjustment. So, changes can be made in the color, design, graphics or any other component to create a unique layout.
-
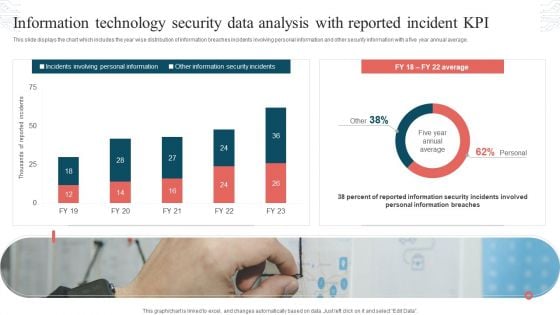
Information Technology Security Data Analysis With Reported Incident KPI Download PDF
This slide displays the chart which includes the year wise distribution of information breaches incidents involving personal information and other security information with a five year annual average. Showcasing this set of slides titled Information Technology Security Data Analysis With Reported Incident KPI Download PDF. The topics addressed in these templates are Incidents Involving, Personal Information, Other Information, Security Incidents. All the content presented in this PPT design is completely editable. Download it and make adjustments in color, background, font etc. as per your unique business setting.
-
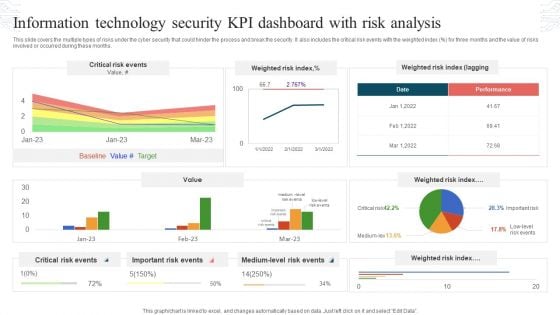
Information Technology Security KPI Dashboard With Risk Analysis Topics PDF
This slide covers the multiple types of risks under the cyber security that could hinder the process and break the security. It also includes the critical risk events with the weighted index percent for three months and the value of risks involved or occurred during these months. Showcasing this set of slides titled Information Technology Security KPI Dashboard With Risk Analysis Topics PDF. The topics addressed in these templates are Critical Risk Events, Weighted Risk Index, Important Risk Events. All the content presented in this PPT design is completely editable. Download it and make adjustments in color, background, font etc. as per your unique business setting.
-
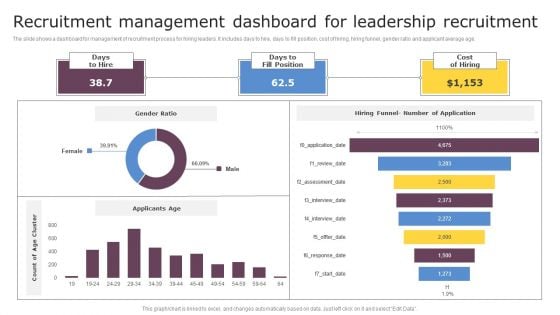
Recruitment Management Dashboard For Leadership Recruitment Graphics PDF
The slide shows a dashboard for management of recruitment process for hiring leaders. It includes days to hire, days to fill position, cost of hiring, hiring funnel, gender ratio and applicant average age. Showcasing this set of slides titled Recruitment Management Dashboard For Leadership Recruitment Graphics PDF. The topics addressed in these templates are Recruitment Management, Dashboard For Leadership. All the content presented in this PPT design is completely editable. Download it and make adjustments in color, background, font etc. as per your unique business setting.
-
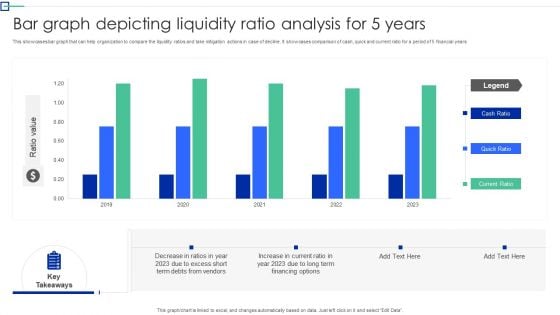
Bar Graph Depicting Liquidity Ratio Analysis For 5 Years Graphics PDF
This showcases bar graph that can help organization to compare the liquidity ratios and take mitigation actions in case of decline. It showcases comparison of cash, quick and current ratio for a period of 5 financial years. Showcasing this set of slides titled Bar Graph Depicting Liquidity Ratio Analysis For 5 Years Graphics PDF. The topics addressed in these templates are Organization To Compare, The Liquidity Ratios, Mitigation Action Decline. All the content presented in this PPT design is completely editable. Download it and make adjustments in color, background, font etc. as per your unique business setting.
-
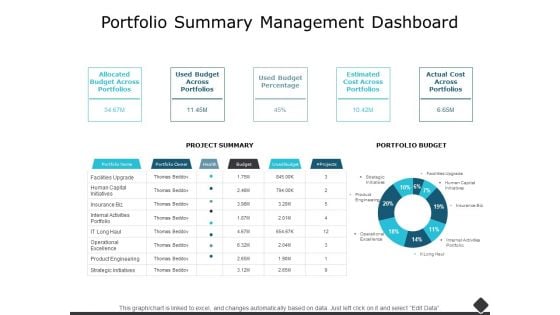
Portfolio Summary Management Dashboard Ppt PowerPoint Presentation Ideas Deck
This is a portfolio summary management dashboard ppt powerpoint presentation ideas deck. The topics discussed in this diagram are finance, marketing, management, investment, analysis. This is a completely editable PowerPoint presentation, and is available for immediate download.
-
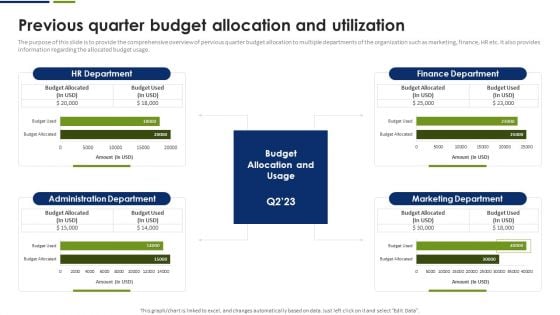
Strategic Plan To Effectively Manage Marketing Department Expenditures Previous Quarter Budget Allocation And Utilization Introduction PDF
The purpose of this slide is to provide the comprehensive overview of pervious quarter budget allocation to multiple departments of the organization such as marketing, finance, HR etc. It also provides information regarding the allocated budget usage. Slidegeeks is here to make your presentations a breeze with Strategic Plan To Effectively Manage Marketing Department Expenditures Previous Quarter Budget Allocation And Utilization Introduction PDF With our easy to use and customizable templates, you can focus on delivering your ideas rather than worrying about formatting. With a variety of designs to choose from, you are sure to find one that suits your needs. And with animations and unique photos, illustrations, and fonts, you can make your presentation pop. So whether you are giving a sales pitch or presenting to the board, make sure to check out Slidegeeks first.
-
Implementing Succession Planning KPI Dashboard For Human Resource Template PDF
Mentioned slide shows key performance indicator dashboard for human resource. Metrics covered in the dashboard are headcount by seniority and gender, open positions, headcount, termination, hires and turnover. If you are looking for a format to display your unique thoughts, then the professionally designed Implementing Succession Planning KPI Dashboard For Human Resource Template PDF is the one for you. You can use it as a Google Slides template or a PowerPoint template. Incorporate impressive visuals, symbols, images, and other charts. Modify or reorganize the text boxes as you desire. Experiment with shade schemes and font pairings. Alter, share or cooperate with other people on your work. Download Implementing Succession Planning KPI Dashboard For Human Resource Template PDF and find out how to give a successful presentation. Present a perfect display to your team and make your presentation unforgettable.
-
Implementing Succession Planning HR Performance Management Dashboard Microsoft PDF
This graph or chart is linked to excel, and changes automatically based on data. Just left click on it and select Edit Data. Find highly impressive Implementing Succession Planning HR Performance Management Dashboard Microsoft PDF on Slidegeeks to deliver a meaningful presentation. You can save an ample amount of time using these presentation templates. No need to worry to prepare everything from scratch because Slidegeeks experts have already done a huge research and work for you. You need to download Implementing Succession Planning HR Performance Management Dashboard Microsoft PDF for your upcoming presentation. All the presentation templates are 100 percent editable and you can change the color and personalize the content accordingly. Download now.
-
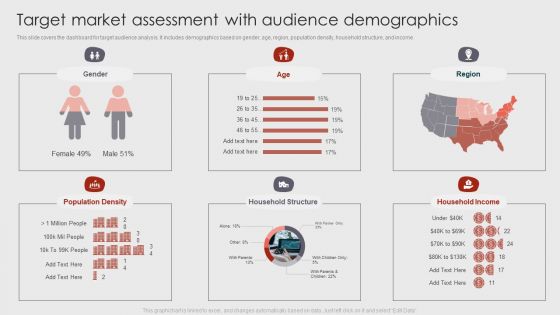
Target Market Assessment With Audience Demographics Inspiration PDF
This slide covers the dashboard for target audience analysis. It includes demographics based on gender, age, region, population density, household structure, and income. Pitch your topic with ease and precision using this Target Market Assessment With Audience Demographics Inspiration PDF. This layout presents information on Target Market Assessment, Audience Demographics . It is also available for immediate download and adjustment. So, changes can be made in the color, design, graphics or any other component to create a unique layout.
-
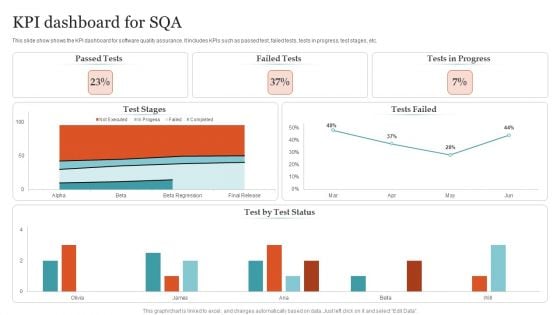
KPI Dashboard For SQA Ppt PowerPoint Presentation Gallery Structure PDF
This slide show shows the KPI dashboard for software quality assurance. It includes KPIs such as passed test, failed tests, tests in progress, test stages, etc. Pitch your topic with ease and precision using this KPI Dashboard For SQA Ppt PowerPoint Presentation Gallery Structure PDF. This layout presents information on Passed Tests, Failed Tests, Tests Progress . It is also available for immediate download and adjustment. So, changes can be made in the color, design, graphics or any other component to create a unique layout.
-
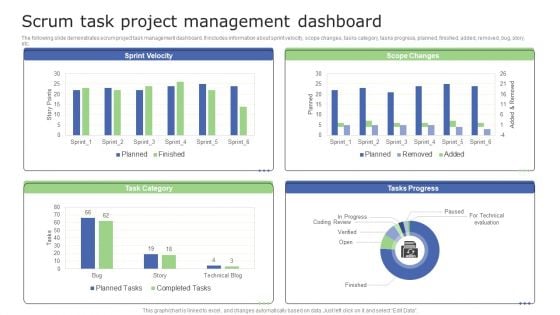
Scrum Task Project Management Dashboard Information PDF
The following slide demonstrates scrum project task management dashboard. It includes information about sprint velocity, scope changes, tasks category, tasks progress, planned, finished, added, removed, bug, story, etc. Pitch your topic with ease and precision using this Scrum Task Project Management Dashboard Information PDF. This layout presents information on Scrum Task Project, Management Dashboard. It is also available for immediate download and adjustment. So, changes can be made in the color, design, graphics or any other component to create a unique layout.
-
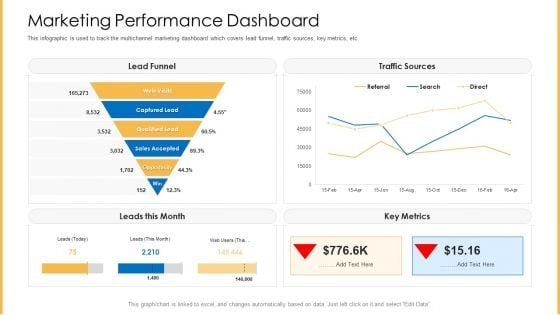
Amalgamation Marketing Pitch Deck Marketing Performance Dashboard Slides PDF
This infographic is used to track the multichannel marketing dashboard which covers lead funnel, traffic sources, key metrics, etc. Deliver an awe inspiring pitch with this creative amalgamation marketing pitch deck marketing performance dashboard slides pdf bundle. Topics like web visits, captured lead, qualified lead, sales accepted, opportunity can be discussed with this completely editable template. It is available for immediate download depending on the needs and requirements of the user.
-
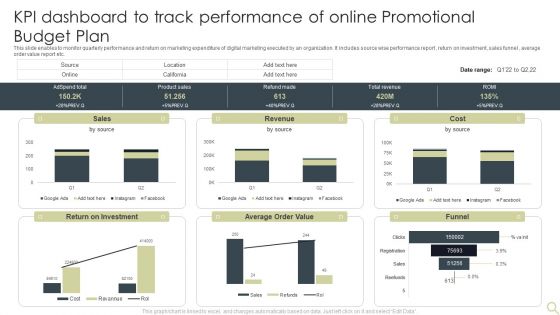
KPI Dashboard To Track Performance Of Online Promotional Budget Plan Inspiration PDF
This slide enables to monitor quarterly performance and return on marketing expenditure of digital marketing executed by an organization. It includes source wise performance report , return on investment, sales funnel , average order value report etc. Pitch your topic with ease and precision using this KPI Dashboard To Track Performance Of Online Promotional Budget Plan Inspiration PDF. This layout presents information on Average Order Value, Return On Investment, Sales. It is also available for immediate download and adjustment. So, changes can be made in the color, design, graphics or any other component to create a unique layout.
-
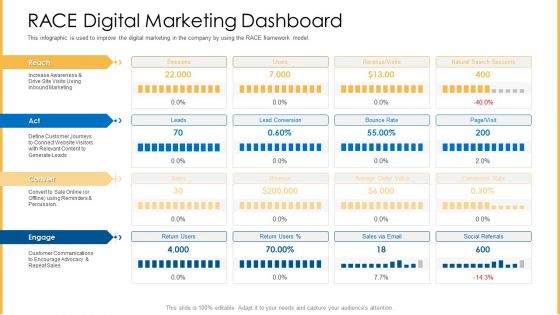
Amalgamation Marketing Pitch Deck RACE Digital Marketing Dashboard Graphics PDF
This infographic is used to improve the digital marketing in the company by using the RACE framework model. Deliver an awe inspiring pitch with this creative amalgamation marketing pitch deck race digital marketing dashboard graphics pdf bundle. Topics like reach, act, convert, engage can be discussed with this completely editable template. It is available for immediate download depending on the needs and requirements of the user.
-
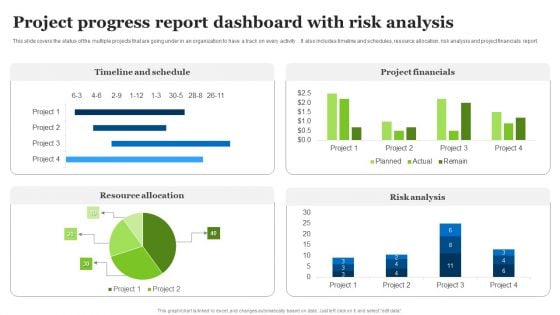
Project Progress Report Dashboard With Risk Analysis Ppt Examples PDF
This slide covers the status of the multiple projects that are going under in an organization to have a track on every activity . It also includes timeline and schedules, resource allocation, risk analysis and project financials report. Pitch your topic with ease and precision using this Project Progress Report Dashboard With Risk Analysis Ppt Examples PDF. This layout presents information on Timeline And Schedule, Project Financials, Risk Analysis. It is also available for immediate download and adjustment. So, changes can be made in the color, design, graphics or any other component to create a unique layout.
-
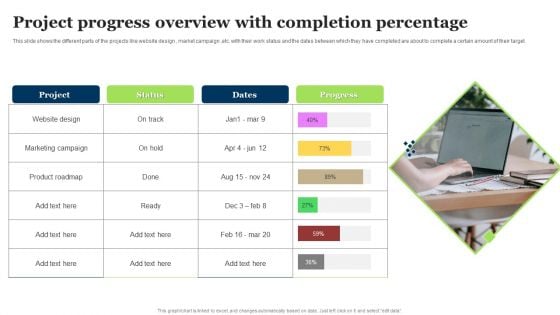
Project Progress Overview With Completion Percentage Ppt Inspiration Format Ideas PDF
This slide covers the month wise status of multiple projects for better management without any chaos or confusion. It also shows the status category that means whether there are new projects, in progress, completed , on hold or cancelled. Showcasing this set of slides titled Project Progress Overview With Completion Percentage Ppt Inspiration Format Ideas PDF. The topics addressed in these templates are Project, Marketing Campaign, Product Roadmap. All the content presented in this PPT design is completely editable. Download it and make adjustments in color, background, font etc. as per your unique business setting.
-
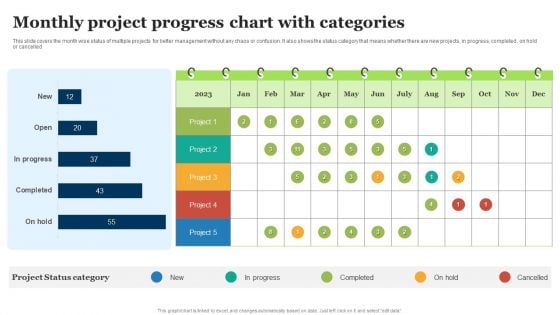
Monthly Project Progress Chart With Categories Ppt Professional Outfit PDF
This slide covers the month wise status of multiple projects for better management without any chaos or confusion. It also shows the status category that means whether there are new projects, in progress, completed , on hold or cancelled. Pitch your topic with ease and precision using this Monthly Project Progress Chart With Categories Ppt Professional Outfit PDF. This layout presents information on Project Status Category, Completed, Progress. It is also available for immediate download and adjustment. So, changes can be made in the color, design, graphics or any other component to create a unique layout.
-
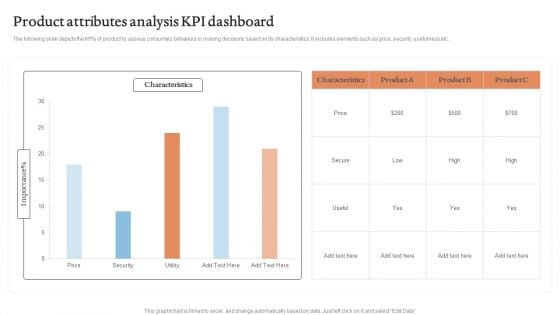
Product Attributes Analysis KPI Dashboard Graphics PDF
The following slide depicts the KPIs of product to assess consumers behaviour in making decisions based on its characteristics. It includes elements such as price, security, usefulness etc.Showcasing this set of slides titled Product Attributes Analysis KPI Dashboard Graphics PDF. The topics addressed in these templates are Characteristics, Product Attributes, Analysis KPI Dashboard. All the content presented in this PPT design is completely editable. Download it and make adjustments in color, background, font etc. as per your unique business setting.
-
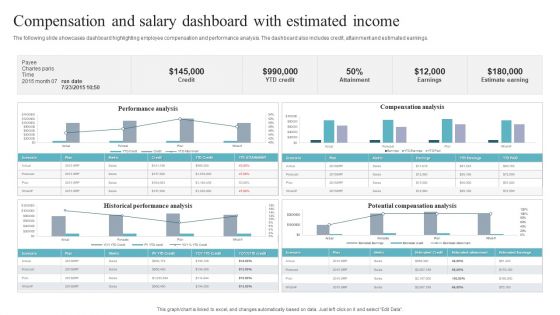
Compensation And Salary Dashboard With Estimated Income Ideas PDF
The following slide showcases dashboard highlighting employee compensation and performance analysis. The dashboard also includes credit, attainment and estimated earnings. Showcasing this set of slides titled Compensation And Salary Dashboard With Estimated Income Ideas PDF. The topics addressed in these templates are Performance Analysis, Compensation Analysis, Historical Performance Analysis. All the content presented in this PPT design is completely editable. Download it and make adjustments in color, background, font etc. as per your unique business setting.
-
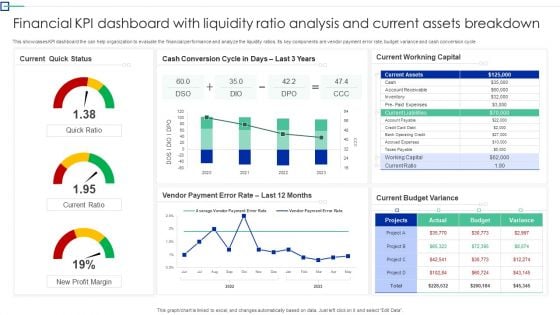
Financial KPI Dashboard With Liquidity Ratio Analysis And Current Assets Breakdown Ideas PDF
This showcases KPI dashboard the can help organization to evaluate the financial performance and analyze the liquidity ratios. Its key components are vendor payment error rate, budget variance and cash conversion cycle. Showcasing this set of slides titled. The topics addressed in these templates are Quick Status, Workning Capital, Budget Variance. All the content presented in this PPT design is completely editable. Download it and make adjustments in color, background, font etc. as per your unique business setting.
-
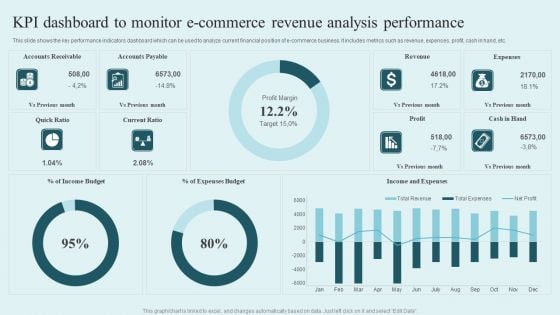
KPI Dashboard To Monitor E Commerce Revenue Analysis Performance Mockup PDF
This slide shows the key performance indicators dashboard which can be used to analyze current financial position of e-commerce business. It includes metrics such as revenue, expenses, profit, cash in hand, etc. Showcasing this set of slides titled KPI Dashboard To Monitor E Commerce Revenue Analysis Performance Mockup PDF. The topics addressed in these templates are Accounts Receivable, Accounts Payable, Revenue, Expenses. All the content presented in this PPT design is completely editable. Download it and make adjustments in color, background, font etc. as per your unique business setting.
-
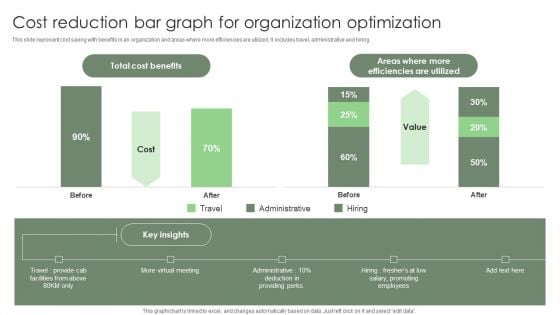
Cost Reduction Bar Graph For Organization Optimization Ppt Inspiration Vector PDF
This slide represent cost saving with benefits in an organization and areas where more efficiencies are utilized. It includes travel, administrative and hiring. Pitch your topic with ease and precision using this Cost Reduction Bar Graph For Organization Optimization Ppt Inspiration Vector PDF. This layout presents information on Total Cost Benefits, Promoting Employees, Providing Perks. It is also available for immediate download and adjustment. So, changes can be made in the color, design, graphics or any other component to create a unique layout.
-
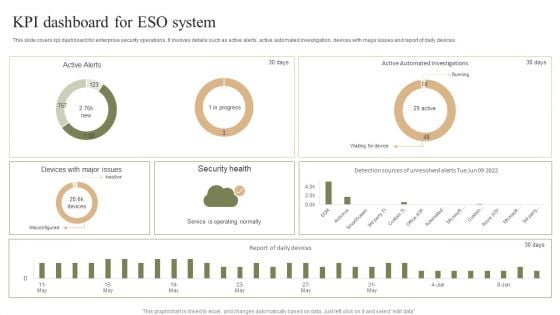
KPI Dashboard For ESO System Ppt PowerPoint Presentation File Template PDF
This slide covers kpi dashboard for enterprise security operations. It involves details such as active alerts, active automated investigation, devices with major issues and report of daily devices. Pitch your topic with ease and precision using this KPI Dashboard For ESO System Ppt PowerPoint Presentation File Template PDF. This layout presents information on Security Health, Misconfigured, Service Operating Normally. It is also available for immediate download and adjustment. So, changes can be made in the color, design, graphics or any other component to create a unique layout.
-
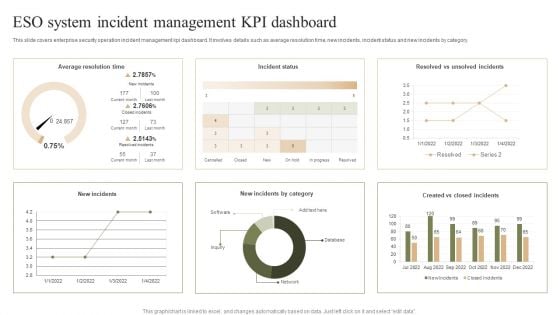
ESO System Incident Management KPI Dashboard Ppt PowerPoint Presentation File Graphic Images PDF
This slide covers enterprise security operation incident management kpi dashboard. It involves details such as average resolution time, new incidents, incident status and new incidents by category. Pitch your topic with ease and precision using this ESO System Incident Management KPI Dashboard Ppt PowerPoint Presentation File Graphic Images PDF. This layout presents information on Average Resolution Time, Incident Status, New Incidents. It is also available for immediate download and adjustment. So, changes can be made in the color, design, graphics or any other component to create a unique layout.
-
HR Manager KPI Dashboard With Employee Attrition Tracking Report Brochure PDF
This slide covers performance key indicators for HR manager. It also indicates employee turnover count, new recruitment, retention, training and development of new employees. Showcasing this set of slides titled HR Manager KPI Dashboard With Employee Attrition Tracking Report Brochure PDF. The topics addressed in these templates are Recruitment, Employee Turnover, Development. All the content presented in this PPT design is completely editable. Download it and make adjustments in color, background, font etc. as per your unique business setting.
-
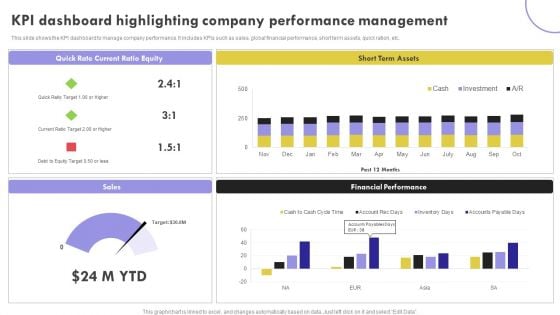
KPI Dashboard Highlighting Company Performance Management Inspiration PDF
This slide shows the KPI dashboard to manage company performance. It includes KPIs such as sales, global financial performance, short term assets, quick ration, etc.Showcasing this set of slides titled KPI Dashboard Highlighting Company Performance Management Inspiration PDF. The topics addressed in these templates are Current Ratio, Term Assets, Financial Performance. All the content presented in this PPT design is completely editable. Download it and make adjustments in color, background, font etc. as per your unique business setting.
-
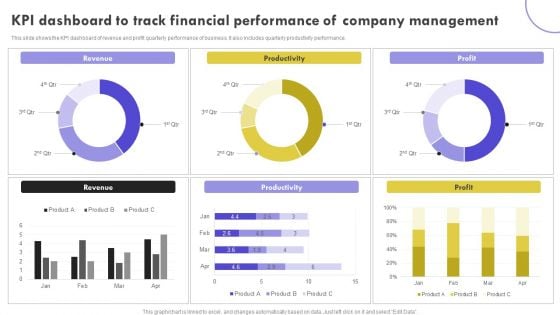
KPI Dashboard To Track Financial Performance Of Company Management Clipart PDF
This slide shows the KPI dashboard of revenue and profit quarterly performance of business. It also includes quarterly productivity performance. Pitch your topic with ease and precision using this KPI Dashboard To Track Financial Performance Of Company Management Clipart PDF. This layout presents information on Revenue, Productivity, Profit. It is also available for immediate download and adjustment. So, changes can be made in the color, design, graphics or any other component to create a unique layout.
-
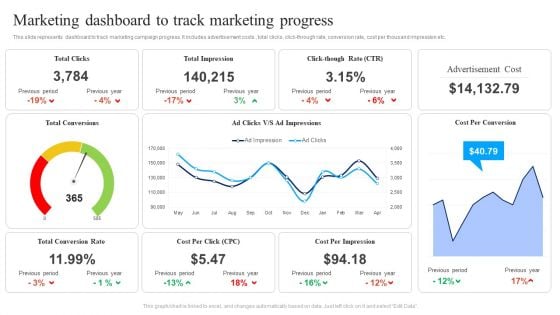
Marketing Dashboard To Track Marketing Progress Ppt Tips PDF
This slide represents dashboard to track marketing campaign progress. It includes advertisement costs , total clicks, click-through rate, conversion rate, cost per thousand impression etc. Pitch your topic with ease and precision using this Marketing Dashboard To Track Marketing Progress Ppt Tips PDF. This layout presents information on Total Clicks, Total Impression, Total Conversion Rate, Cost Per Click. It is also available for immediate download and adjustment. So, changes can be made in the color, design, graphics or any other component to create a unique layout.
-
KPI Dashboard Of Customer And Product Sales Performance Comparison Information PDF
This slide shows the KPI dashboard of client and product sales comparison. It also includes sales by location and total sales. Pitch your topic with ease and precision using this KPI Dashboard Of Customer And Product Sales Performance Comparison Information PDF. This layout presents information on Product Sales, Client Sales, Tim Santana. It is also available for immediate download and adjustment. So, changes can be made in the color, design, graphics or any other component to create a unique layout.
-
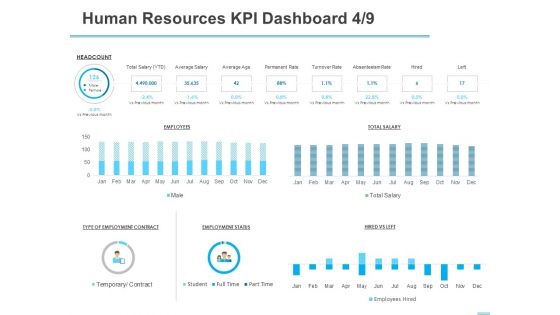
All About HRM Human Resources KPI Dashboard Permanent Ppt Information PDF
Presenting this set of slides with name all about hrm human resources kpi dashboard permanent ppt information pdf. The topics discussed in these slides are average salary, permanent rate. This is a completely editable PowerPoint presentation and is available for immediate download. Download now and impress your audience.
-
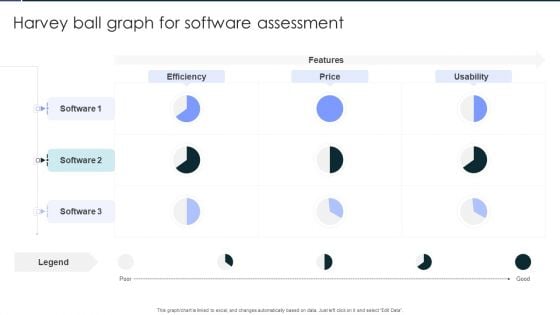
Harvey Ball Graph For Software Assessment Clipart PDF
Pitch your topic with ease and precision using this Harvey Ball Graph For Software Assessment Clipart PDF. This layout presents information on Harvey Ball Graph, For Software, Assessment. It is also available for immediate download and adjustment. So, changes can be made in the color, design, graphics or any other component to create a unique layout.
-
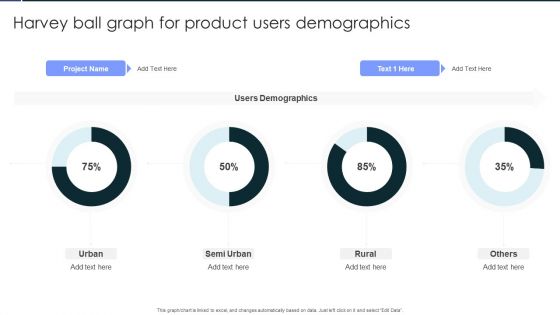
Harvey Ball Graph For Product Users Demographics Portrait PDF
Pitch your topic with ease and precision using this Harvey Ball Graph For Product Users Demographics Portrait PDF. This layout presents information on Harvey Ball Graph, For Product, Users Demographics. It is also available for immediate download and adjustment. So, changes can be made in the color, design, graphics or any other component to create a unique layout.
-
Customer Service Delivery And Management Dashboard With Revenue Brochure PDF
The purpose of this slide is to monitor and evaluate service delivery KPIs to improve the customer support process. The major KPIs included are total requests, percentage of requests answered, total revenue, and support cost. Pitch your topic with ease and precision using this Customer Service Delivery And Management Dashboard With Revenue Brochure PDF. This layout presents information on Customer Service Delivery, Management Dashboard With Revenue. It is also available for immediate download and adjustment. So, changes can be made in the color, design, graphics or any other component to create a unique layout.
-
All About HRM Human Resources KPI Dashboard With Employee Count Ppt Diagram Templates PDF
Presenting this set of slides with name all about hrm human resources kpi dashboard with employee count ppt diagram templates pdf. The topics discussed in these slides are costs, acceptance rate, process satisfaction rate. This is a completely editable PowerPoint presentation and is available for immediate download. Download now and impress your audience.

 Home
Home 


