Charts and Graphs PowerPoint Templates
-
Digital Health Interventions Global Market Size And Digital Health Project Investment Of Dtx Information PDF
This slide represents the global market size and digital health project investment summary of digital therapeutics solutions from 2013 to 2023 by covering the details of gross project funding and the total number of deals. It also includes the projected amount for the DTx market by the year 2025. Explore a selection of the finest Digital Health Interventions Global Market Size And Digital Health Project Investment Of Dtx Information PDF here. With a plethora of professionally designed and pre made slide templates, you can quickly and easily find the right one for your upcoming presentation. You can use our Digital Health Interventions Global Market Size And Digital Health Project Investment Of Dtx Information PDF to effectively convey your message to a wider audience. Slidegeeks has done a lot of research before preparing these presentation templates. The content can be personalized and the slides are highly editable. Grab templates today from Slidegeeks.
-
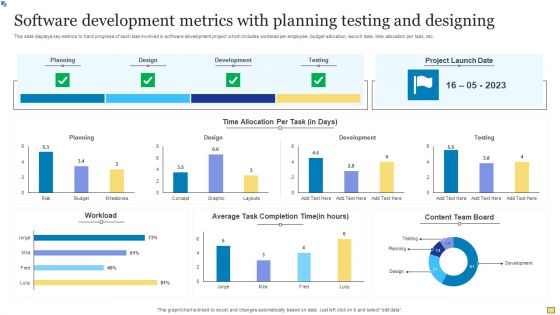
Software Development Metrics With Planning Testing And Designing Introduction PDF
This slide displays key metrics to track progress of each task involved in software development project which includes workload per employee, budget allocation, launch date, time allocation per task, etc. Showcasing this set of slides titled Software Development Metrics With Planning Testing And Designing Introduction PDF. The topics addressed in these templates are Planning, Workload, Development. All the content presented in this PPT design is completely editable. Download it and make adjustments in color, background, font etc. as per your unique business setting.
-
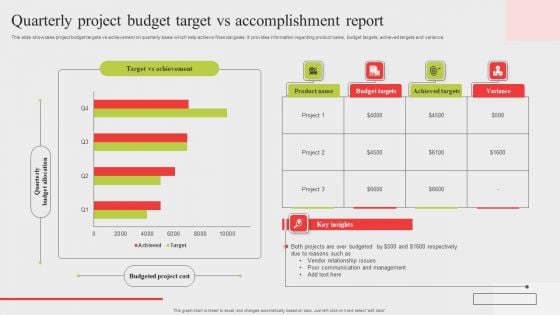
Quarterly Project Budget Target Vs Accomplishment Report Mockup PDF
This slide showcase project budget targets vs achievement on quarterly basis which help achieve financial goals. It provides information regarding product name, budget targets, achieved targets and variance. Showcasing this set of slides titled Quarterly Project Budget Target Vs Accomplishment Report Mockup PDF. The topics addressed in these templates are Product Name, Budget Targets, Achieved Targets. All the content presented in this PPT design is completely editable. Download it and make adjustments in color, background, font etc. as per your unique business setting.
-
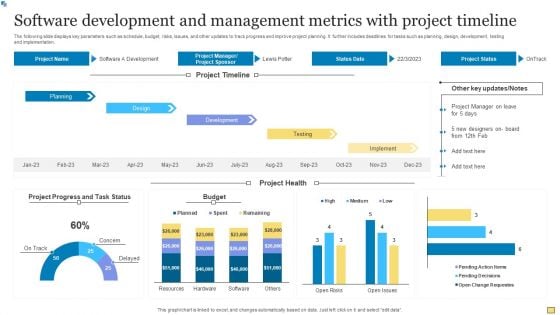
Software Development And Management Metrics With Project Timeline Slides PDF
The following slide displays key parameters such as schedule, budget, risks, issues, and other updates to track progress and improve project planning. It further includes deadlines for tasks such as planning, design, development, testing and implementation. Showcasing this set of slides titled Software Development And Management Metrics With Project Timeline Slides PDF. The topics addressed in these templates are Planning, Development, Design. All the content presented in this PPT design is completely editable. Download it and make adjustments in color, background, font etc. as per your unique business setting.
-
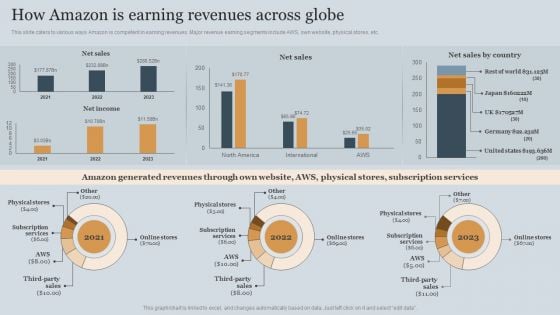
Amazons Business Success Story Strategic Plan How Amazon Is Earning Revenues Across Globe Template PDF
This slide caters to various ways Amazon is competent in earning revenues. Major revenue earning segments include AWS, own website, physical stores, etc. Boost your pitch with our creative Amazons Business Success Story Strategic Plan How Amazon Is Earning Revenues Across Globe Template PDF. Deliver an awe-inspiring pitch that will mesmerize everyone. Using these presentation templates you will surely catch everyones attention. You can browse the ppts collection on our website. We have researchers who are experts at creating the right content for the templates. So you do not have to invest time in any additional work. Just grab the template now and use them.
-
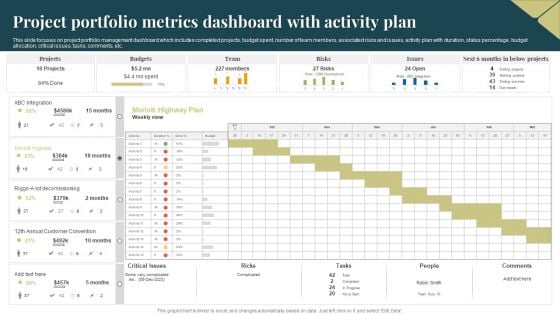
Project Portfolio Metrics Dashboard With Activity Plan Clipart PDF
This slide focuses on project portfolio management dashboard which includes completed projects, budget spent, number of team members, associated risks and issues, activity plan with duration, status percentage, budget allocation, critical issues, tasks, comments, etc. Pitch your topic with ease and precision using this Project Portfolio Metrics Dashboard With Activity Plan Clipart PDF. This layout presents information on Budgets, Team, Risks. It is also available for immediate download and adjustment. So, changes can be made in the color, design, graphics or any other component to create a unique layout.
-
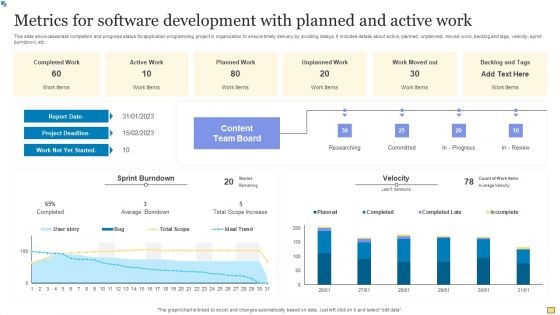
Metrics For Software Development With Planned And Active Work Structure PDF
This slide showcases task completion and progress status for application programming project in organization to ensure timely delivery by avoiding delays. It includes details about active, planned, unplanned, moved work, backlog and tags, velocity, sprint burndown, etc. Pitch your topic with ease and precision using this Metrics For Software Development With Planned And Active Work Structure PDF. This layout presents information on Metrics For Software Development With Planned And Active Work Structure PDF. It is also available for immediate download and adjustment. So, changes can be made in the color, design, graphics or any other component to create a unique layout.
-
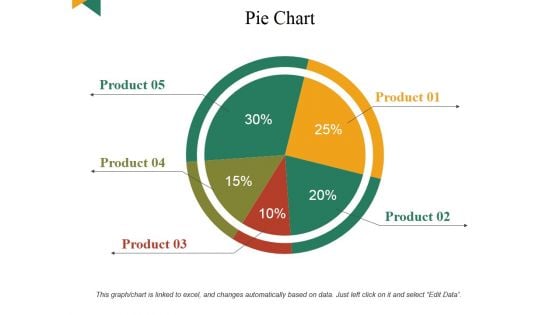
Pie Chart Ppt PowerPoint Presentation Inspiration Images
This is a pie chart ppt powerpoint presentation inspiration images. This is a five stage process. The stages in this process are business, marketing, finance, pie, planning.
-
Ultimate Guide To Improve Customer Support And Services Kpi Dashboard For Tracking Customer Retention Guidelines PDF
This slide covers the dashboard for analyzing customer loyalty with metrics such as NPS, loyal customer rate, premium users, CLV, customer churn, revenue churn, net retention, MRR growth, etc. Welcome to our selection of the Ultimate Guide To Improve Customer Support And Services Kpi Dashboard For Tracking Customer Retention Guidelines PDF. These are designed to help you showcase your creativity and bring your sphere to life. Planning and Innovation are essential for any business that is just starting out. This collection contains the designs that you need for your everyday presentations. All of our PowerPoints are 100 percent editable, so you can customize them to suit your needs. This multi purpose template can be used in various situations. Grab these presentation templates today.
-
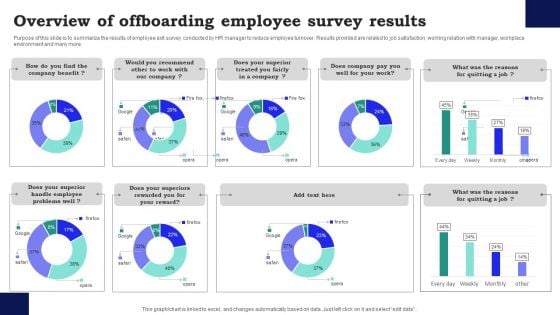
Overview Of Offboarding Employee Survey Results Survey SS
Purpose of this slide is to summarize the results of employee exit survey conducted by HR manager to reduce employee turnover. Results provided are related to job satisfaction, working relation with manager, workplace environment and many more. Showcasing this set of slides titled Overview Of Offboarding Employee Survey Results Survey SS. The topics addressed in these templates are Overview Of Offboarding, Employee Survey Results. All the content presented in this PPT design is completely editable. Download it and make adjustments in color, background, font etc. as per your unique business setting.
-
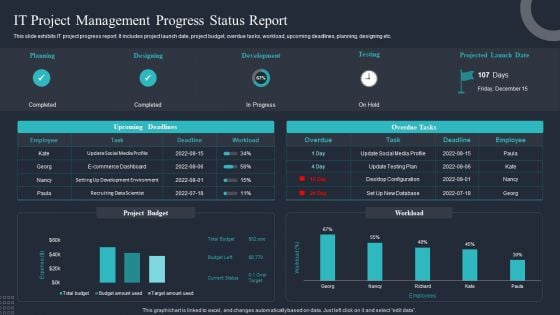
IT Project Management Progress Status Report Ppt Layouts Slideshow PDF
This slide exhibits IT project progress report. It includes project launch date, project budget, overdue tasks, workload, upcoming deadlines, planning, designing etc. Showcasing this set of slides titled IT Project Management Progress Status Report Ppt Layouts Slideshow PDF. The topics addressed in these templates are Designing, Development, Testing, Planning. All the content presented in this PPT design is completely editable. Download it and make adjustments in color, background, font etc. as per your unique business setting.
-
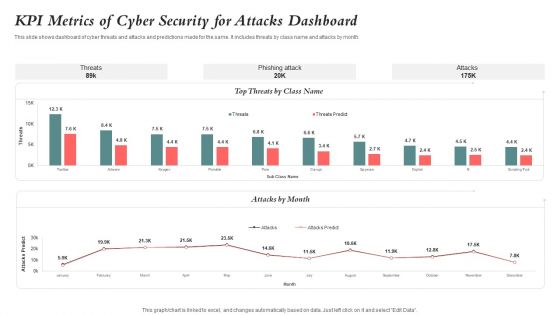
KPI Metrics Of Cyber Security For Attacks Dashboard Guidelines PDF
This slide shows dashboard of cyber threats and attacks and predictions made for the same. It includes threats by class name and attacks by month. Showcasing this set of slides titled KPI Metrics Of Cyber Security For Attacks Dashboard Guidelines PDF. The topics addressed in these templates are Kpi Metrics, Cyber Security, Attacks Dashboard. All the content presented in this PPT design is completely editable. Download it and make adjustments in color, background, font etc. as per your unique business setting.
-
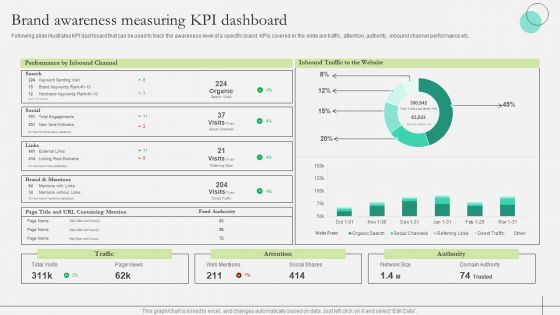
Comprehensive Guide To Strengthen Brand Equity Brand Awareness Measuring KPI Dashboard Rules PDF
Following slide illustrates KPI dashboard that can be used to track the awareness level of a specific brand. KPIs covered in the slide are traffic, attention, authority, inbound channel performance etc. Are you searching for a Comprehensive Guide To Strengthen Brand Equity Brand Awareness Measuring KPI Dashboard Rules PDF that is uncluttered, straightforward, and original Its easy to edit, and you can change the colors to suit your personal or business branding. For a presentation that expresses how much effort you have put in, this template is ideal With all of its features, including tables, diagrams, statistics, and lists, its perfect for a business plan presentation. Make your ideas more appealing with these professional slides. Download Comprehensive Guide To Strengthen Brand Equity Brand Awareness Measuring KPI Dashboard Rules PDF from Slidegeeks today.
-
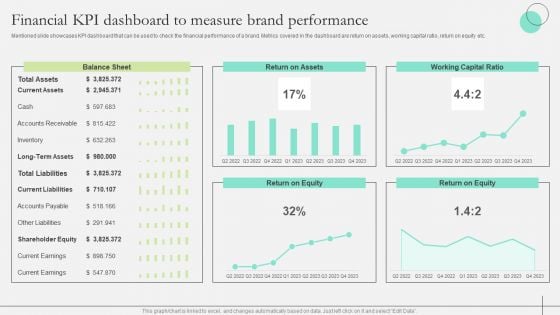
Comprehensive Guide To Strengthen Brand Equity Financial KPI Dashboard Measure Brand Structure PDF
Mentioned slide showcases KPI dashboard that can be used to check the financial performance of a brand. Metrics covered in the dashboard are return on assets, working capital ratio, return on equity etc. Take your projects to the next level with our ultimate collection of Comprehensive Guide To Strengthen Brand Equity Financial KPI Dashboard Measure Brand Structure PDF. Slidegeeks has designed a range of layouts that are perfect for representing task or activity duration, keeping track of all your deadlines at a glance. Tailor these designs to your exact needs and give them a truly corporate look with your own brand colors they will make your projects stand out from the rest
-
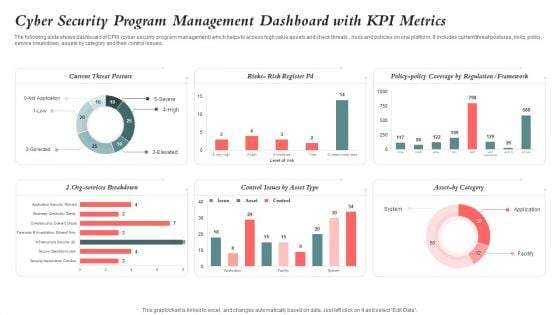
Cyber Security Program Management Dashboard With KPI Metrics Ideas PDF
The following slide shows dashboard of CPM cyber security program management which helps to access high value assets and check threats , risks and policies on one platform. It includes current threat postures, risks, policy, service breakdown, assets by category and their control issues. Pitch your topic with ease and precision using this Cyber Security Program Management Dashboard With KPI Metrics Ideas PDF. This layout presents information on Cyber Security, Program Management Dashboard, Kpi Metrics. It is also available for immediate download and adjustment. So, changes can be made in the color, design, graphics or any other component to create a unique layout.
-
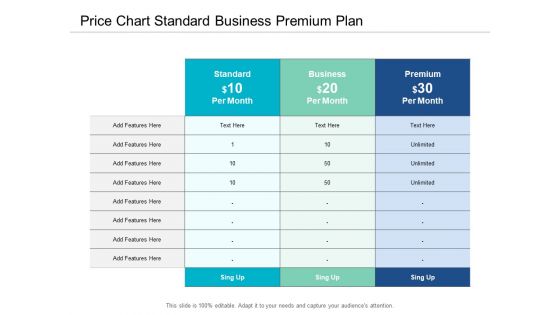
Price Chart Standard Business Premium Plan Ppt Powerpoint Presentation Visual Aids Infographic Template
This is a price chart standard business premium plan ppt powerpoint presentation visual aids infographic template. This is a three stage process. The stages in this process are comparison chart, comparison table, comparison matrix.
-
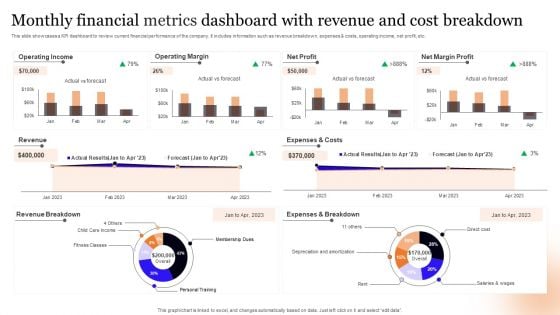
Monthly Financial Metrics Dashboard With Revenue And Cost Breakdown Information PDF
This slide showcases a KPI dashboard to review current financial performance of the company. It includes information such as revenue breakdown, expenses and costs, operating income, net profit, etc. Pitch your topic with ease and precision using this Monthly Financial Metrics Dashboard With Revenue And Cost Breakdown Information PDF. This layout presents information on Operating Income, Operating Margin, Net Profit. It is also available for immediate download and adjustment. So, changes can be made in the color, design, graphics or any other component to create a unique layout.
-
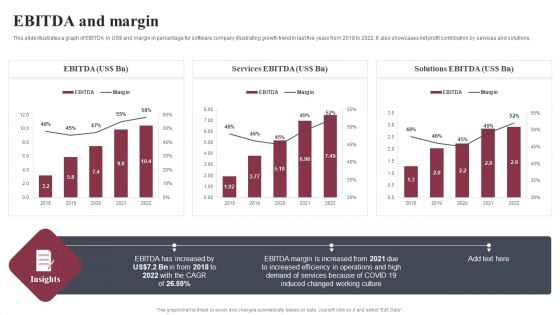
Business Software Development Company Profile EBITDA And Margin Summary PDF
This slide illustrates a graph of EBITDA in US dollar and margin in percentage for software company illustrating growth trend in last five years from 2018 to 2022. It also showcases net profit contribution by services and solutions. Deliver an awe inspiring pitch with this creative Business Software Development Company Profile EBITDA And Margin Summary PDF bundle. Topics like EBITDA, Services EBITDA, Solutions EBITDA can be discussed with this completely editable template. It is available for immediate download depending on the needs and requirements of the user.
-
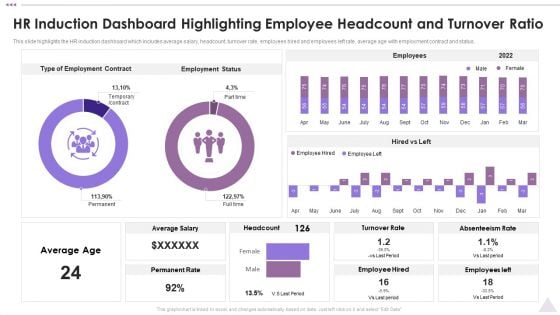
New Staff Orientation Session HR Induction Dashboard Highlighting Employee Headcount Background PDF
This slide highlights the HR induction dashboard which includes average salary, headcount, turnover rate, employees hired and employees left rate, average age with employment contract and status. Deliver an awe inspiring pitch with this creative New Staff Orientation Session HR Induction Dashboard Highlighting Employee Headcount Background PDF bundle. Topics like Employment Status, Employees, Average Salary can be discussed with this completely editable template. It is available for immediate download depending on the needs and requirements of the user.
-
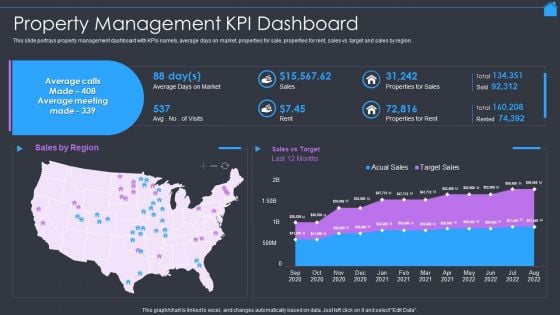
Marketing Strategy To Enhance Real Estate Sales Property Management Kpi Dashboard Slides PDF
This slide portrays property management dashboard with KPIs namely, average days on market, properties for sale, properties for rent, sales vs. target and sales by region. Deliver and pitch your topic in the best possible manner with this Marketing Strategy To Enhance Real Estate Sales Property Management Kpi Dashboard Slides PDF. Use them to share invaluable insights on Average, Market, Sales and impress your audience. This template can be altered and modified as per your expectations. So, grab it now.
-
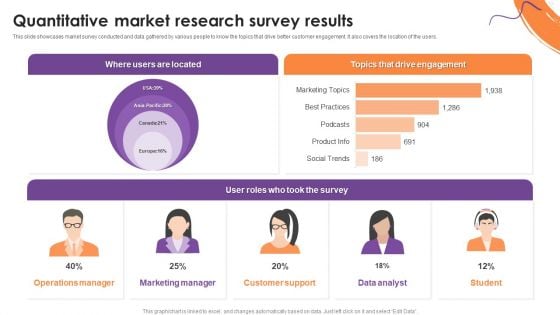
Quantitative Market Research Survey Results Structure PDF
This slide showcases market survey conducted and data gathered by various people to know the topics that drive better customer engagement. It also covers the location of the users. Pitch your topic with ease and precision using this Quantitative Market Research Survey Results Structure PDF. This layout presents information on Marketing Manager, Customer Support, Data Analyst. It is also available for immediate download and adjustment. So, changes can be made in the color, design, graphics or any other component to create a unique layout.
-
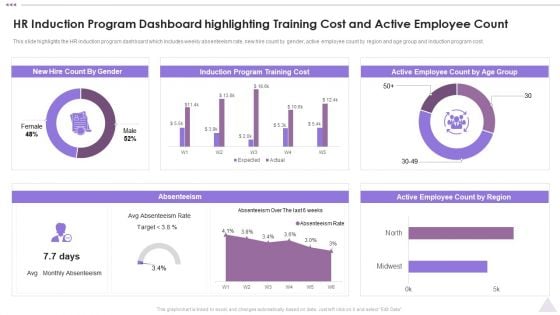
New Staff Orientation Session HR Induction Program Dashboard Highlighting Training Cost Template PDF
This slide highlights the HR induction program dashboard which includes weekly absenteeism rate, new hire count by gender, active employee count by region and age group and induction program cost. Deliver and pitch your topic in the best possible manner with this New Staff Orientation Session HR Induction Program Dashboard Highlighting Training Cost Template PDF. Use them to share invaluable insights on Induction Program, Training Cost, Absenteeism, Active Employee and impress your audience. This template can be altered and modified as per your expectations. So, grab it now.
-
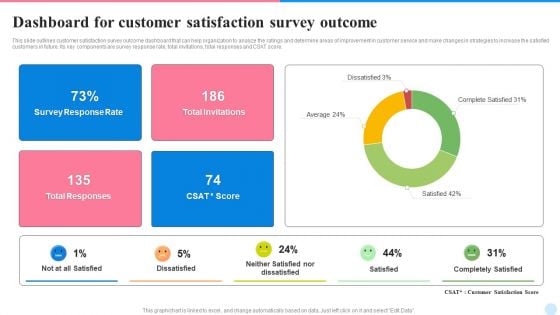
Dashboard For Customer Satisfaction Survey Outcome Demonstration PDF
This slide outlines customer satisfaction survey outcome dashboard that can help organization to analyze the ratings and determine areas of improvement in customer service and make changes in strategies to increase the satisfied customers in future. Its key components are survey response rate, total invitations, total responses and CSAT score. Showcasing this set of slides titled Dashboard For Customer Satisfaction Survey Outcome Demonstration PDF. The topics addressed in these templates are Total Invitations, Survey Response Rate, Total Responses. All the content presented in this PPT design is completely editable. Download it and make adjustments in color, background, font etc. as per your unique business setting.
-
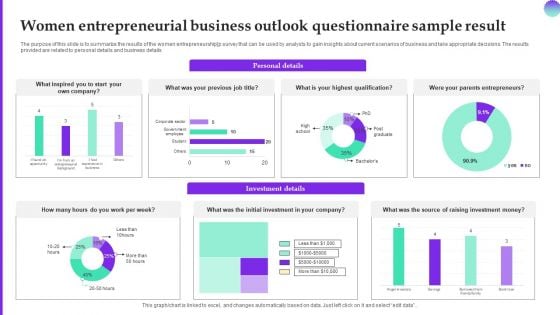
Women Entrepreneurial Business Outlook Questionnaire Sample Result Survey SS
The purpose of this slide is to summarize the results of the women entrepreneurship survey that can be used by analysts to gain insights about current scenarios of business and take appropriate decisions. The results provided are related to personal details and business details. Showcasing this set of slides titled Women Entrepreneurial Business Outlook Questionnaire Sample Result Survey SS. The topics addressed in these templates are Entrepreneurial Business, Questionnaire Sample Result. All the content presented in this PPT design is completely editable. Download it and make adjustments in color, background, font etc. as per your unique business setting.
-
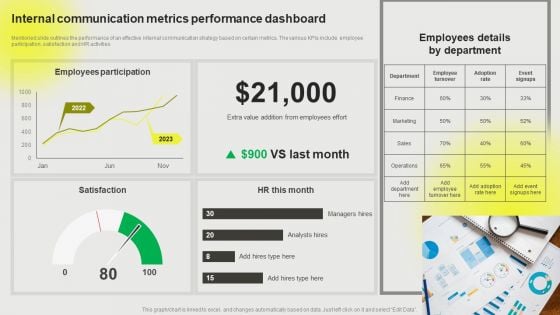
Developing A Successful Business Communication Plan Internal Communication Metrics Inspiration PDF
Mentioned slide outlines the performance of an effective internal communication strategy based on certain metrics. The various KPIs include employee participation, satisfaction and HR activities Coming up with a presentation necessitates that the majority of the effort goes into the content and the message you intend to convey. The visuals of a PowerPoint presentation can only be effective if it supplements and supports the story that is being told. Keeping this in mind our experts created Developing A Successful Business Communication Plan Internal Communication Metrics Inspiration PDF to reduce the time that goes into designing the presentation. This way, you can concentrate on the message while our designers take care of providing you with the right template for the situation.
-
Company Marketing Analysis Report Ppt PowerPoint Presentation Complete Deck With Slides
This is a company marketing analysis report ppt powerpoint presentation complete deck with slides. This is a one stage process. The stages in this process are marketing, business, hand, report, financial.
-
Dashboard Of Net Promoter Score Survey Response Results KPI Portrait PDF
Pitch your topic with ease and precision using this Dashboard Of Net Promoter Score Survey Response Results KPI Portrait PDF. This layout presents information on Product Average, Promoter Score, Product Experience. It is also available for immediate download and adjustment. So, changes can be made in the color, design, graphics or any other component to create a unique layout.
-
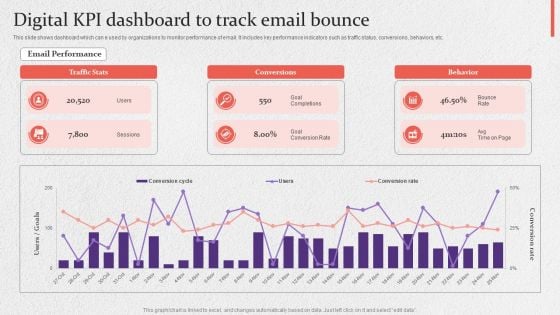
Digital KPI Dashboard To Track Email Bounce Slides PDF
This slide shows dashboard which can e used by organizations to monitor performance of email. It includes key performance indicators such as traffic status, conversions, behaviors, etc. Pitch your topic with ease and precision using this Digital KPI Dashboard To Track Email Bounce Slides PDF. This layout presents information on Digital Kpi Dashboard, Track Email Bounce. It is also available for immediate download and adjustment. So, changes can be made in the color, design, graphics or any other component to create a unique layout.
-
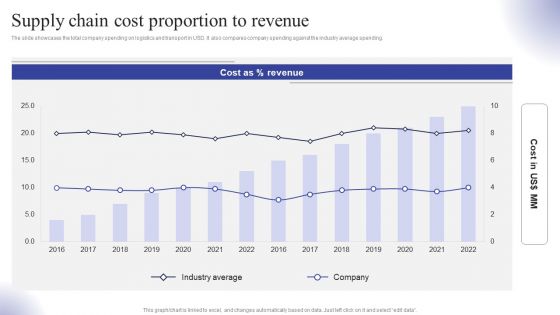
Supply Chain Cost Proportion To Revenue Ppt Pictures Outline PDF
The slide showcases the total company spending on logistics and transport in USD. It also compares company spending against the industry average spending. Find highly impressive Supply Chain Cost Proportion To Revenue Ppt Pictures Outline PDF on Slidegeeks to deliver a meaningful presentation. You can save an ample amount of time using these presentation templates. No need to worry to prepare everything from scratch because Slidegeeks experts have already done a huge research and work for you. You need to download Supply Chain Cost Proportion To Revenue Ppt Pictures Outline PDF for your upcoming presentation. All the presentation templates are 100 percent editable and you can change the color and personalize the content accordingly. Download now
-
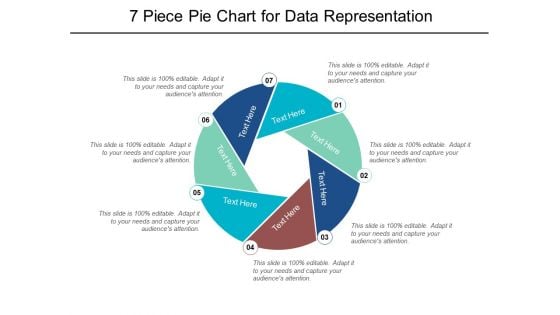
7 Piece Pie Chart For Data Representation Ppt PowerPoint Presentation Portfolio Graphics
This is a 7 piece pie chart for data representation ppt powerpoint presentation portfolio graphics. This is a seven stage process. The stages in this process are 6 piece pie chart, 6 segment pie chart, 6 parts pie chart.
-
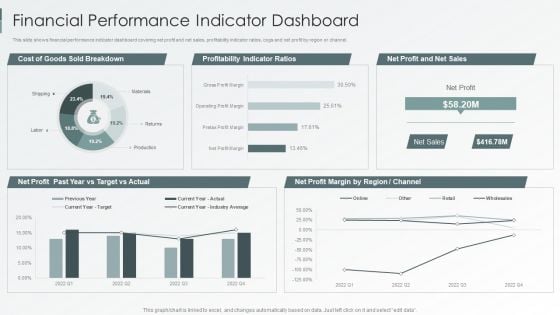
Enterprise Sustainability Performance Metrics Financial Performance Indicator Dashboard Themes PDF
This slide shows financial performance indicator dashboard covering net profit and net sales, profitability indicator ratios, cogs and net profit by region or channel.Deliver an awe inspiring pitch with this creative Enterprise Sustainability Performance Metrics Financial Performance Indicator Dashboard Themes PDF bundle. Topics like Profitability Indicator, Sold Breakdown, Target Actual can be discussed with this completely editable template. It is available for immediate download depending on the needs and requirements of the user.
-
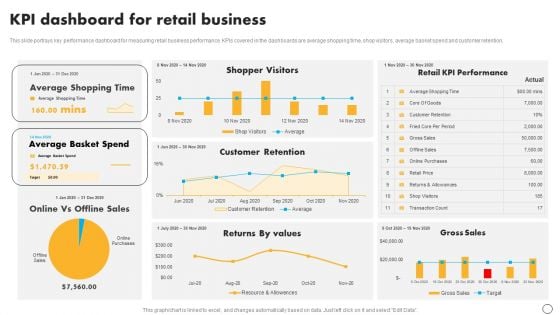
Retail Business Optimization Through Operational Excellence Strategy KPI Dashboard For Retail Business Mockup PDF
This slide portrays key performance dashboard for measuring retail business performance. KPIs covered in the dashboards are average shopping time, shop visitors, average basket spend and customer retention. Boost your pitch with our creative Retail Business Optimization Through Operational Excellence Strategy KPI Dashboard For Retail Business Mockup PDF. Deliver an awe-inspiring pitch that will mesmerize everyone. Using these presentation templates you will surely catch everyones attention. You can browse the ppts collection on our website. We have researchers who are experts at creating the right content for the templates. So you do not have to invest time in any additional work. Just grab the template now and use them.
-
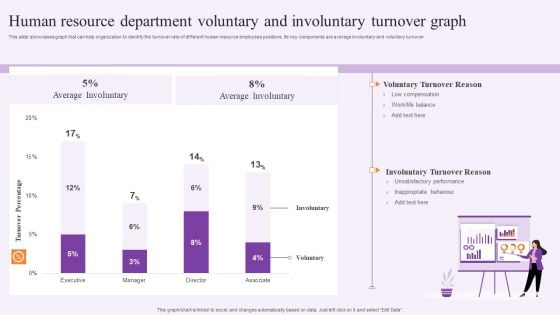
Human Resource Department Voluntary And Involuntary Turnover Graph Summary PDF
This slide showcases graph that can help organization to identify the turnover rate of different human resource employees positions. Its key components are average involuntary and voluntary turnover. Pitch your topic with ease and precision using this Human Resource Department Voluntary And Involuntary Turnover Graph Summary PDF. This layout presents information on Executive, Voluntary Turnover Reason, Average Involuntary. It is also available for immediate download and adjustment. So, changes can be made in the color, design, graphics or any other component to create a unique layout.
-
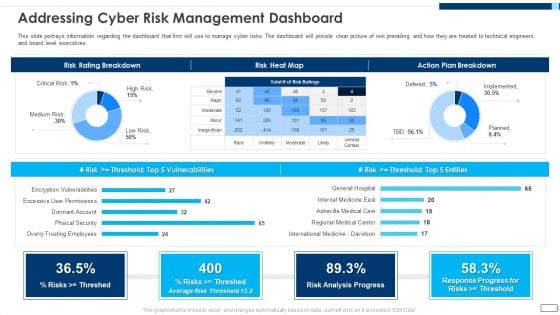
Evolving BI Infrastructure Addressing Cyber Risk Management Dashboard Background PDF
This slide portrays information regarding the dashboard that firm will use to manage cyber risks. The dashboard will provide clear picture of risk prevailing and how they are treated to technical engineers and board level executives. Deliver an awe inspiring pitch with this creative evolving bi infrastructure addressing cyber risk management dashboard background pdf bundle. Topics like risk rating breakdown, risk heat map, action plan breakdown, risk analysis progress can be discussed with this completely editable template. It is available for immediate download depending on the needs and requirements of the user.
-
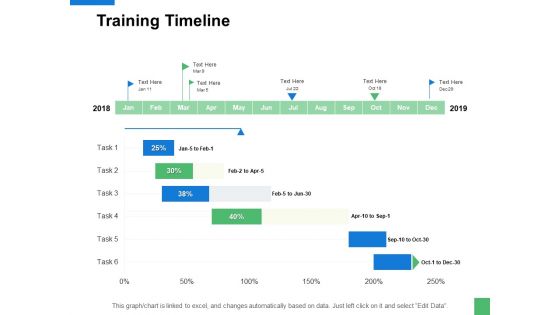
Training Timeline Process Ppt PowerPoint Presentation Portfolio Clipart Images
Presenting this set of slides with name training timeline process ppt powerpoint presentation portfolio clipart images. The topics discussed in these slides are finance, marketing, management, investment, analysis. This is a completely editable PowerPoint presentation and is available for immediate download. Download now and impress your audience.
-
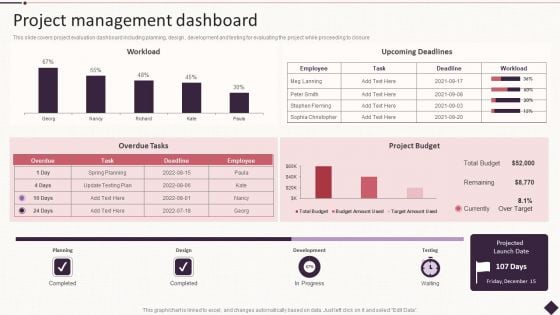
IT Project Development Planning Project Management Dashboard Inspiration PDF
This slide covers project evaluation dashboard including planning, design , development and testing for evaluating the project while proceeding to closure .Deliver and pitch your topic in the best possible manner with this IT Project Development Planning Project Management Dashboard Inspiration PDF. Use them to share invaluable insights on Spring Planning, Remaining, Completed and impress your audience. This template can be altered and modified as per your expectations. So, grab it now.
-
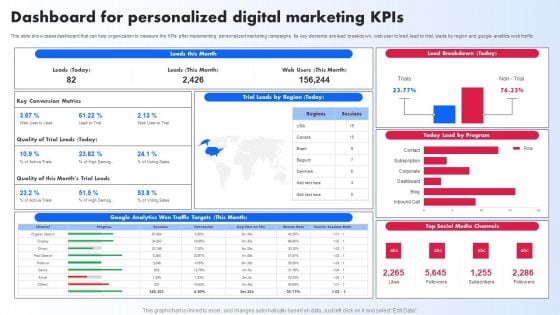
Dashboard For Personalized Digital Marketing Kpis Ppt PowerPoint Presentation File Backgrounds PDF
This slide showcases dashboard that can help organization to measure the KPIs after implementing personalized marketing campaigns. Its key elements are lead breakdown, web user to lead, lead to trial, leads by region and google analtics web traffic Are you in need of a template that can accommodate all of your creative concepts This one is crafted professionally and can be altered to fit any style. Use it with Google Slides or PowerPoint. Include striking photographs, symbols, depictions, and other visuals. Fill, move around, or remove text boxes as desired. Test out color palettes and font mixtures. Edit and save your work, or work with colleagues. Download Dashboard For Personalized Digital Marketing Kpis Ppt PowerPoint Presentation File Backgrounds PDF and observe how to make your presentation outstanding. Give an impeccable presentation to your group and make your presentation unforgettable.
-
Business Diagram 3d Capsule With Multiple Icons For Business Data Flow PowerPoint Slide
This diagram has been designed with 3d graphic of capsule with multiple icons. This data driven PowerPoint slide can be used to give your presentations more effective look. It helps in clearly conveying your message to clients and audience.
-
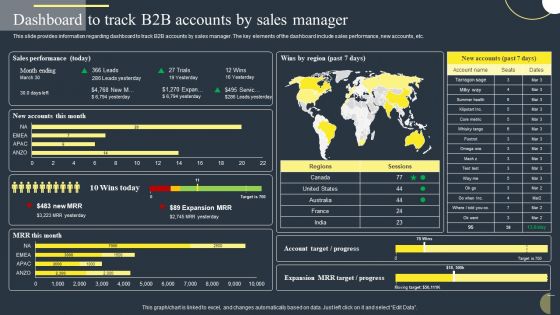
Dashboard To Track B2B Accounts By Sales Manager Portrait PDF
This slide provides information regarding dashboard to track B2B accounts by sales manager. The key elements of the dashboard include sales performance, new accounts, etc. Slidegeeks has constructed Dashboard To Track B2B Accounts By Sales Manager Portrait PDF after conducting extensive research and examination. These presentation templates are constantly being generated and modified based on user preferences and critiques from editors. Here, you will find the most attractive templates for a range of purposes while taking into account ratings and remarks from users regarding the content. This is an excellent jumping-off point to explore our content and will give new users an insight into our top-notch PowerPoint Templates.
-
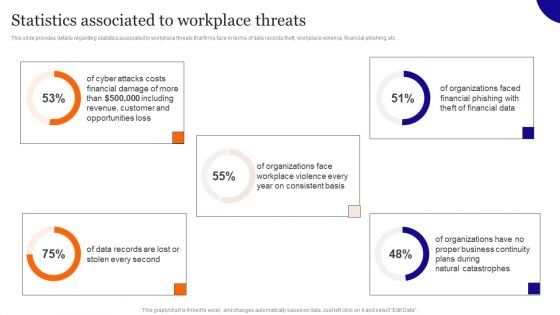
Statistics Associated To Workplace Threats Diagrams PDF
This slide provides details regarding statistics associated to workplace threats that firms face in terms of data records theft, workplace violence, financial phishing, etc. Get a simple yet stunning designed Statistics Associated To Workplace Threats Diagrams PDF. It is the best one to establish the tone in your meetings. It is an excellent way to make your presentations highly effective. So, download this PPT today from Slidegeeks and see the positive impacts. Our easy-to-edit Statistics Associated To Workplace Threats Diagrams PDF can be your go-to option for all upcoming conferences and meetings. So, what are you waiting for Grab this template today.
-
KPI Dashboard For Tracking Marcom Mix Strategy Progress Ideas PDF
Following slide showcases marketing mix progress monitoring dashboard to determine business performance. It includes elements such as clicks, impressions, click through rate, conversion rate, cost per click and monthly overview to Google ads. Showcasing this set of slides titled KPI Dashboard For Tracking Marcom Mix Strategy Progress Ideas PDF. The topics addressed in these templates are Kpi Dashboard, Tracking Marcom, Mix Strategy Progress. All the content presented in this PPT design is completely editable. Download it and make adjustments in color, background, font etc. as per your unique business setting.
-
Training And Education Metrics Tracking Dashboard Guidelines PDF
This slide showcases dashboard for tracking training programs details. It include metrics such as training to invited percentage, unique trained, training man-days, total program names, etc. Pitch your topic with ease and precision using this Training And Education Metrics Tracking Dashboard Guidelines PDF. This layout presents information on Location Wise Training, Training Concerning Vertical, Tennessee. It is also available for immediate download and adjustment. So, changes can be made in the color, design, graphics or any other component to create a unique layout.
-
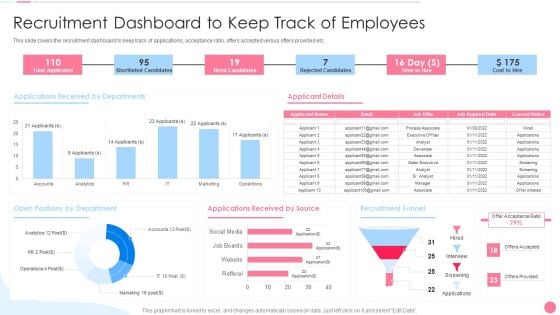
Social Media Hiring Approach Recruitment Dashboard To Keep Track Of Employees Mockup PDF
This slide covers the recruitment dashboard to keep track of applications, acceptance ratio, offers accepted versus offers provided etc. Deliver an awe inspiring pitch with this creative Social Media Hiring Approach Recruitment Dashboard To Keep Track Of Employees Mockup PDF bundle. Topics like Shortlisted Candidates, Hired Candidates, Rejected Candidates can be discussed with this completely editable template. It is available for immediate download depending on the needs and requirements of the user.
-
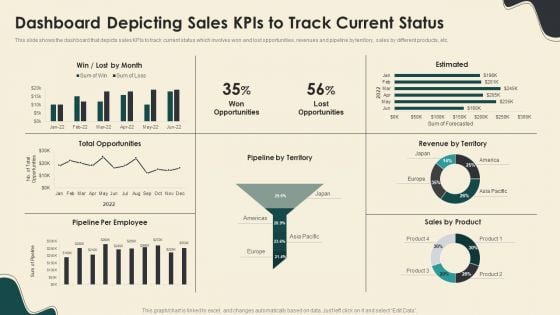
Dashboard Depicting Sales Kpis To Track Current Status Structure PDF
This slide shows the dashboard that depicts sales KPIs to track current status which involves won and lost opportunities, revenues and pipeline by territory, sales by different products, etc. Deliver and pitch your topic in the best possible manner with this Dashboard Depicting Sales Kpis To Track Current Status Structure PDF. Use them to share invaluable insights on Total Opportunities, Revenue By Territory, Sales By Product and impress your audience. This template can be altered and modified as per your expectations. So, grab it now.
-
Logistics Transport Company Financial Report Net Profit And Margin Ppt Layouts Graphics Tutorials PDF
The slide showcases the net profit and margin for transport company. It depicts change in net profit and profit margin for last five financial years form 2018 to 2022. Slidegeeks is here to make your presentations a breeze with Logistics Transport Company Financial Report Net Profit And Margin Ppt Layouts Graphics Tutorials PDF With our easy-to-use and customizable templates, you can focus on delivering your ideas rather than worrying about formatting. With a variety of designs to choose from, you are sure to find one that suits your needs. And with animations and unique photos, illustrations, and fonts, you can make your presentation pop. So whether you are giving a sales pitch or presenting to the board, make sure to check out Slidegeeks first
-
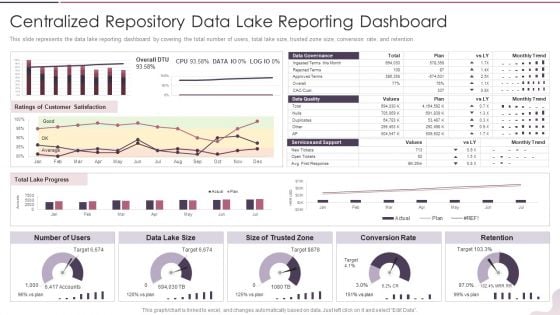
Data Lake Development With Azure Cloud Software Centralized Repository Data Lake Reporting Dashboard Demonstration PDF
This slide represents the data lake reporting dashboard by covering the total number of users, total lake size, trusted zone size, conversion rate, and retention. Deliver an awe inspiring pitch with this creative Data Lake Development With Azure Cloud Software Centralized Repository Data Lake Reporting Dashboard Demonstration PDF bundle. Topics like Conversion Rate, Services And Support can be discussed with this completely editable template. It is available for immediate download depending on the needs and requirements of the user.
-
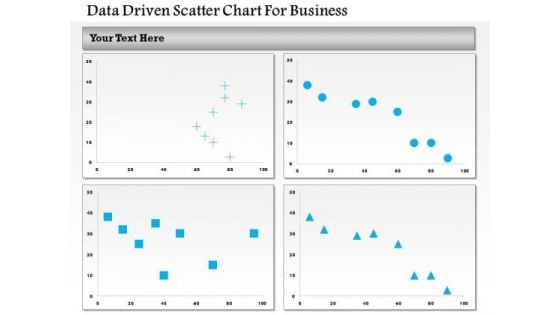
Business Diagram Data Driven Scatter Chart For Business PowerPoint Slide
This business diagram has been designed with four comparative charts. This slide suitable for data representation. You can also use this slide to present business analysis and reports. Use this diagram to present your views in a wonderful manner.
-
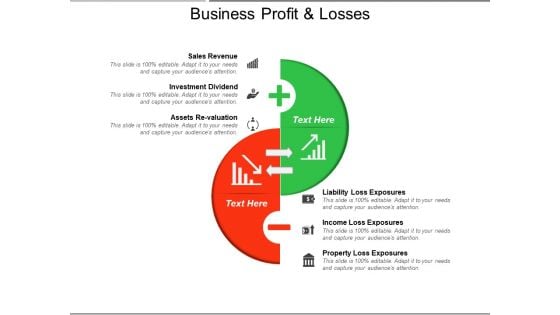
Business Profit And Losses Ppt PowerPoint Presentation Summary Outline
This is a business profit and losses ppt powerpoint presentation summary outline. This is a two stage process. The stages in this process are comparison chart, comparison table, comparison matrix.
-
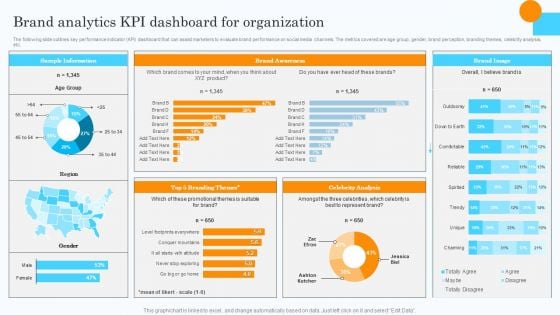
Market Research Assessment Of Target Market Requirements Brand Analytics Kpi Dashboard For Organization Clipart PDF
The following slide outlines key performance indicator KPI dashboard that can assist marketers to evaluate brand performance on social media channels. The metrics covered are age group, gender, brand perception, branding themes, celebrity analysis, etc. Do you have an important presentation coming up Are you looking for something that will make your presentation stand out from the rest Look no further than Market Research Assessment Of Target Market Requirements Brand Analytics Kpi Dashboard For Organization Clipart PDF. With our professional designs, you can trust that your presentation will pop and make delivering it a smooth process. And with Slidegeeks, you can trust that your presentation will be unique and memorable. So why wait Grab Market Research Assessment Of Target Market Requirements Brand Analytics Kpi Dashboard For Organization Clipart PDF today and make your presentation stand out from the rest.
-
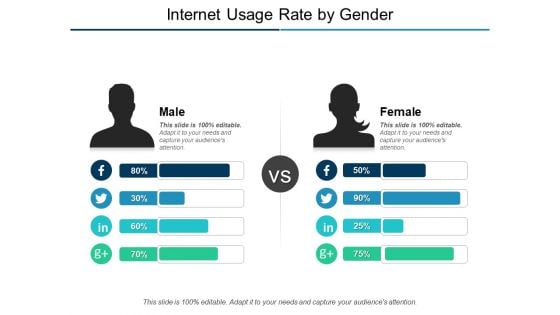
Internet Usage Rate By Gender Ppt PowerPoint Presentation Outline Diagrams
This is a internet usage rate by gender ppt powerpoint presentation outline diagrams. This is a two stage process. The stages in this process are comparison chart, comparison table, comparison matrix.
-
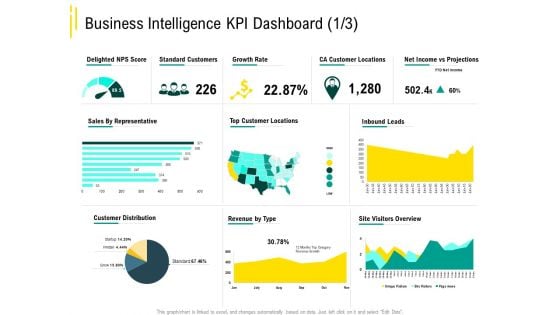
Expert Systems Business Intelligence KPI Dashboard Standard Diagrams PDF
Deliver and pitch your topic in the best possible manner with this expert systems business intelligence kpi dashboard standard diagrams pdf. Use them to share invaluable insights on delighted nps score, standard customers, growth rate, locations and impress your audience. This template can be altered and modified as per your expectations. So, grab it now.
-
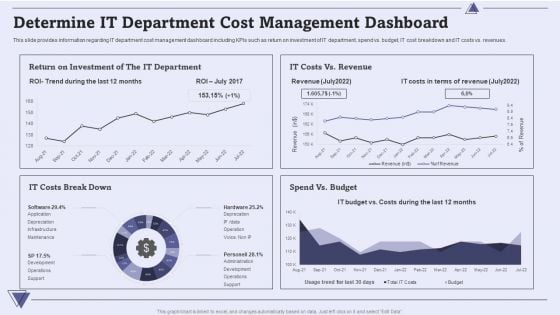
CIO For IT Cost Optimization Techniques Determine IT Department Cost Management Dashboard Introduction PDF
This slide provides information regarding IT department cost management dashboard including KPIs such as return on investment of IT department, spend vs. budget, IT cost breakdown and IT costs vs. revenues. Deliver and pitch your topic in the best possible manner with this CIO For IT Cost Optimization Techniques Determine IT Department Cost Management Dashboard Introduction PDF. Use them to share invaluable insights on Costs, Budget, Revenue and impress your audience. This template can be altered and modified as per your expectations. So, grab it now.
-
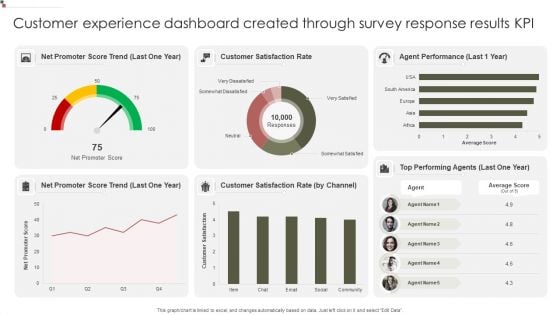
Customer Experience Dashboard Created Through Survey Response Results KPI Mockup PDF
Showcasing this set of slides titled Customer Experience Dashboard Created Through Survey Response Results KPI Mockup PDF. The topics addressed in these templates are Promoter Score, Customer Satisfaction, Agent Performance. All the content presented in this PPT design is completely editable. Download it and make adjustments in color, background, font etc. as per your unique business setting.
-
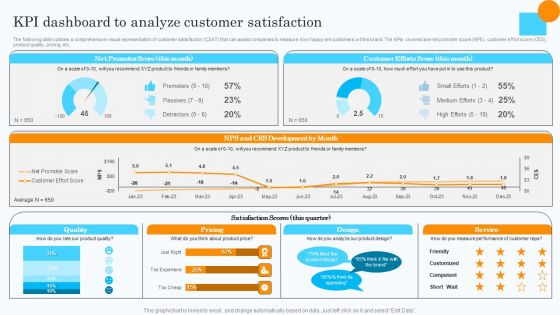
Market Research Assessment Of Target Market Requirements Kpi Dashboard To Analyze Customer Satisfaction Pictures PDF
The following slide outlines a comprehensive visual representation of customer satisfaction CSAT that can assist companies to measure how happy are customers wit the brand. The KPIs covered are net promoter score NPS, customer effort score CES, product quality, pricing, etc. Presenting this PowerPoint presentation, titled Market Research Assessment Of Target Market Requirements Kpi Dashboard To Analyze Customer Satisfaction Pictures PDF, with topics curated by our researchers after extensive research. This editable presentation is available for immediate download and provides attractive features when used. Download now and captivate your audience. Presenting this Market Research Assessment Of Target Market Requirements Kpi Dashboard To Analyze Customer Satisfaction Pictures PDF. Our researchers have carefully researched and created these slides with all aspects taken into consideration. This is a completely customizable Market Research Assessment Of Target Market Requirements Kpi Dashboard To Analyze Customer Satisfaction Pictures PDF that is available for immediate downloading. Download now and make an impact on your audience. Highlight the attractive features available with our PPTs.
-
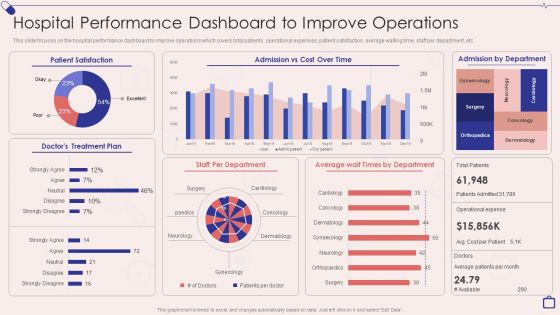
Implementing Integrated Software Hospital Performance Dashboard To Improve Operations Elements PDF
This slide focuses on the hospital performance dashboard to improve operations which covers total patients, operational expenses, patient satisfaction, average waiting time, staff per department, etc.Deliver an awe inspiring pitch with this creative Implementing Integrated Software Hospital Performance Dashboard To Improve Operations Elements PDF bundle. Topics like Admission Department, Staff Department, Operational Expense can be discussed with this completely editable template. It is available for immediate download depending on the needs and requirements of the user.
-
IT Threats Response Playbook KPI Dashboard To Track Department Wise Security Incidents Brochure PDF
Mentioned slide portrays KPI dashboard that can be used to monitor department wise security incidents. KPIs covered are new cases, total cases, resolved and pending cases.Deliver an awe inspiring pitch with this creative IT Threats Response Playbook KPI Dashboard To Track Department Wise Security Incidents Brochure PDF bundle. Topics like It Department, Hr Department, Requires Immediate can be discussed with this completely editable template. It is available for immediate download depending on the needs and requirements of the user.
-
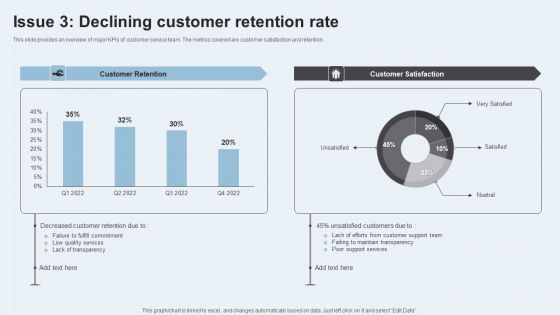
Action Plan To Enhance Client Service Issue 3 Declining Customer Retention Rate Guidelines PDF
This slide provides an overview of major KPIs of customer service team. The metrics covered are customer satisfaction and retention. Find a pre designed and impeccable Action Plan To Enhance Client Service Issue 3 Declining Customer Retention Rate Guidelines PDF. The templates can ace your presentation without additional effort. You can download these easy to edit presentation templates to make your presentation stand out from others. So, what are you waiting for Download the template from Slidegeeks today and give a unique touch to your presentation.
-
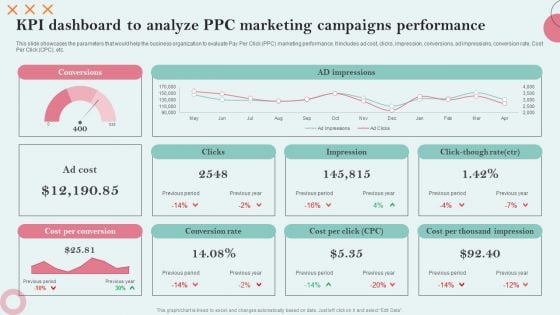
KPI Dashboard To Analyze PPC Marketing Campaigns Performance Information PDF
This slide showcases the parameters that would help the business organization to evaluate Pay Per Click PPC marketing performance. It includes ad cost, clicks, impression, conversions, ad impressions, conversion rate, Cost Per Click CPC, etc. Presenting this PowerPoint presentation, titled KPI Dashboard To Analyze PPC Marketing Campaigns Performance Information PDF, with topics curated by our researchers after extensive research. This editable presentation is available for immediate download and provides attractive features when used. Download now and captivate your audience. Presenting this KPI Dashboard To Analyze PPC Marketing Campaigns Performance Information PDF. Our researchers have carefully researched and created these slides with all aspects taken into consideration. This is a completely customizable KPI Dashboard To Analyze PPC Marketing Campaigns Performance Information PDF that is available for immediate downloading. Download now and make an impact on your audience. Highlight the attractive features available with our PPTs.
-
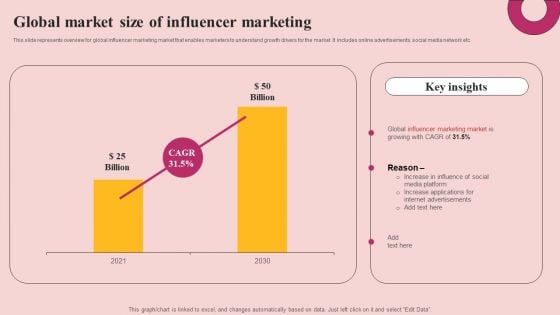
Global Market Size Of Influencer Marketing Rules PDF
This slide represents overview for global influencer marketing market that enables marketers to understand growth drivers for the market. It includes online advertisements, social media network etc. Boost your pitch with our creative Global Market Size Of Influencer Marketing Rules PDF. Deliver an awe inspiring pitch that will mesmerize everyone. Using these presentation templates you will surely catch everyones attention. You can browse the ppts collection on our website. We have researchers who are experts at creating the right content for the templates. So you do not have to invest time in any additional work. Just grab the template now and use them.
-
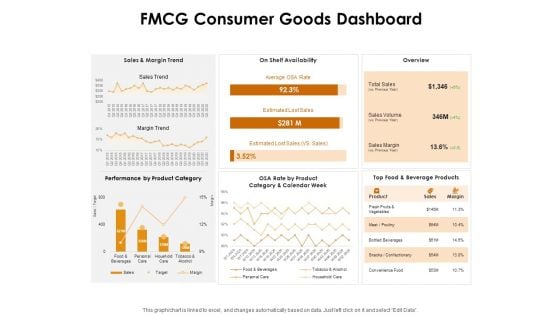
KPI Dashboards Per Industry FMCG Consumer Goods Dashboard Ppt PowerPoint Presentation Infographics Graphics Tutorials PDF
Deliver and pitch your topic in the best possible manner with this kpi dashboards per industry fmcg consumer goods dashboard ppt powerpoint presentation infographics graphics tutorials pdf. Use them to share invaluable insights on sales and margin trend, on shelf availability, overview, performance product category and impress your audience. This template can be altered and modified as per your expectations. So, grab it now.

 Home
Home 


