Charts and Graphs
-
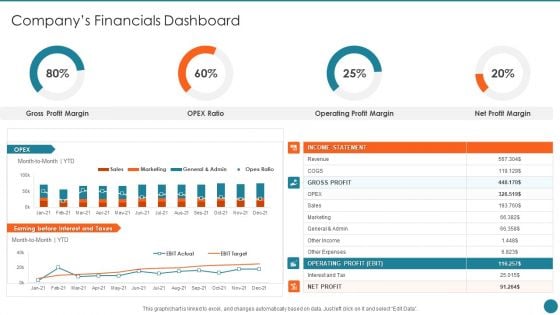
Business Overview Of An Information Technology Company Companys Financials Dashboard Themes PDF
Deliver an awe inspiring pitch with this creative Business Overview Of An Information Technology Company Companys Financials Dashboard Themes PDF bundle. Topics like Gross Profit, Operating Profit, Profit Margin can be discussed with this completely editable template. It is available for immediate download depending on the needs and requirements of the user.
-
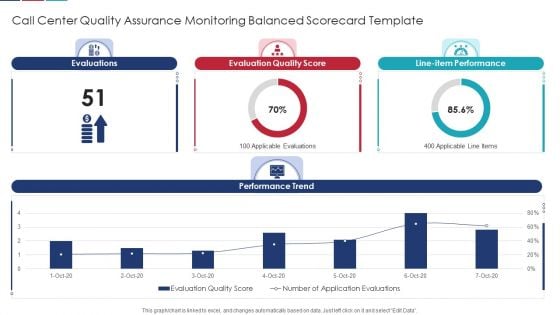
Call Center Quality Assurance Monitoring Balanced Scorecard Template Formats PDF
Deliver and pitch your topic in the best possible manner with this Call Center Quality Assurance Monitoring Balanced Scorecard Template Formats PDF Use them to share invaluable insights on Evaluation Quality, Line Performance, Evaluations and impress your audience. This template can be altered and modified as per your expectations. So, grab it now.
-
Financial Dashboard For Month Closing Income And Expenses Ideas PDF
This slide illustrates facts and figures related to month end financials of a corporation. It includes income statement graph, profit margin, income and expenditure graph etc.Showcasing this set of slides titled Financial Dashboard For Month Closing Income And Expenses Ideas PDF The topics addressed in these templates are Accounts Receivable, Income Statement, Expenditure All the content presented in this PPT design is completely editable. Download it and make adjustments in color, background, font etc. as per your unique business setting.
-
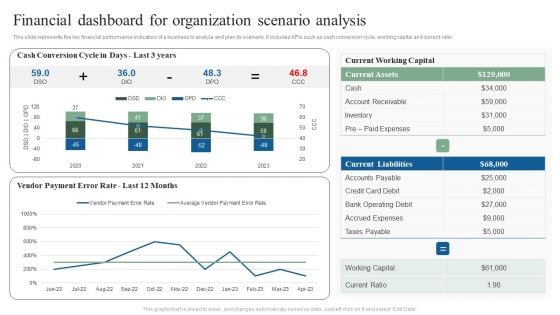
Financial Dashboard For Organization Scenario Analysis Ppt Show Ideas PDF
This slide represents the key financial performance indicators of a business to analyze and plan its scenario. It includes KPIs such as cash conversion cycle, working capital and current ratio. Showcasing this set of slides titled Financial Dashboard For Organization Scenario Analysis Ppt Show Ideas PDF. The topics addressed in these templates are Current Working Capital, Current Liabilities, Current Assets. All the content presented in this PPT design is completely editable. Download it and make adjustments in color, background, font etc. as per your unique business setting.
-
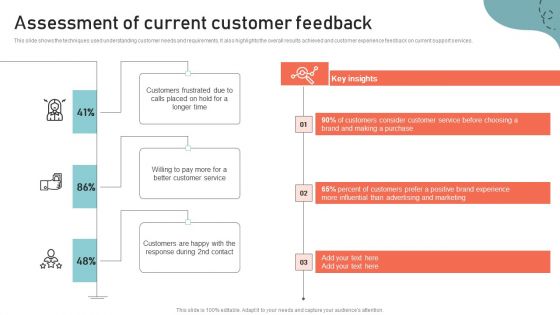
Optimizing Multichannel Strategy To Improve User Experience Assessment Of Current Customer Guidelines PDF
This slide highlight the results of current customer support services that represents the key major concerns such as poor customer service, low retention rate, and increasing call duration time etc. Get a simple yet stunning designed Optimizing Multichannel Strategy To Improve User Experience Assessment Of Current Customer Guidelines PDF. It is the best one to establish the tone in your meetings. It is an excellent way to make your presentations highly effective. So, download this PPT today from Slidegeeks and see the positive impacts. Our easy to edit Optimizing Multichannel Strategy To Improve User Experience Assessment Of Current Customer Guidelines PDF can be your go to option for all upcoming conferences and meetings. So, what are you waiting for Grab this template today.
-
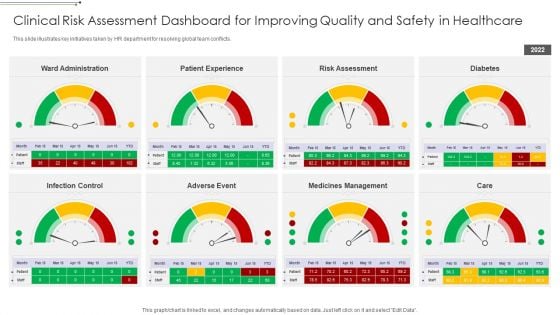
Clinical Risk Assessment Dashboard For Improving Quality And Safety In Healthcare Brochure PDF
This slide illustrates key initiatives taken by HR department for resolving global team conflicts. Pitch your topic with ease and precision using this Clinical Risk Assessment Dashboard For Improving Quality And Safety In Healthcare Brochure PDF This layout presents information on Ward Administration, Patient Experience, Risk Assessment It is also available for immediate download and adjustment. So, changes can be made in the color, design, graphics or any other component to create a unique layout.
-
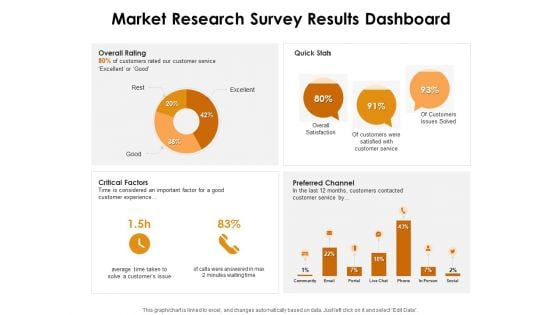
KPI Dashboards Per Industry Market Research Survey Results Dashboard Ppt PowerPoint Presentation Infographic Template Layout Ideas PDF
Deliver and pitch your topic in the best possible manner with this kpi dashboards per industry market research survey results dashboard ppt powerpoint presentation infographic template layout ideas pdf. Use them to share invaluable insights on overall rating, quick stats, critical factors, preferred channel and impress your audience. This template can be altered and modified as per your expectations. So, grab it now.
-
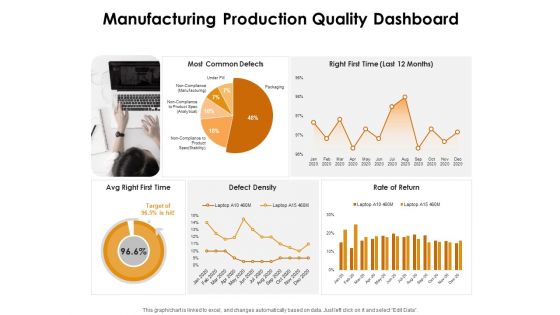
KPI Dashboards Per Industry Manufacturing Production Quality Dashboard Ppt PowerPoint Presentation Professional Graphic Tips PDF
Deliver and pitch your topic in the best possible manner with this kpi dashboards per industry manufacturing production quality dashboard ppt powerpoint presentation professional graphic tips pdf. Use them to share invaluable insights on most common defects, right first time last 12 months, avg right first time, defect density, rate return and impress your audience. This template can be altered and modified as per your expectations. So, grab it now.
-
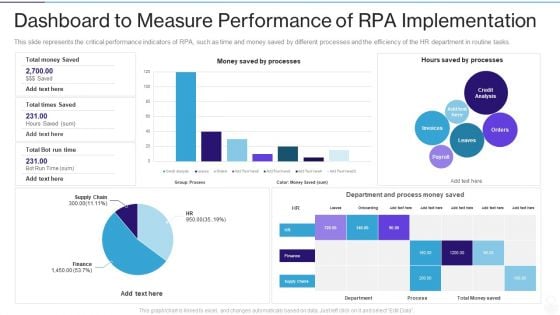
RPA IT Dashboard To Measure Performance Of RPA Implementation Ppt Professional Pictures PDF
This slide represents the critical performance indicators of RPA, such as time and money saved by different processes and the efficiency of the HR department in routine tasks. Deliver an awe inspiring pitch with this creative rpa it dashboard to measure performance of rpa implementation ppt professional pictures pdf bundle. Topics like processes, finance, supply chain, analysis, payroll can be discussed with this completely editable template. It is available for immediate download depending on the needs and requirements of the user.
-
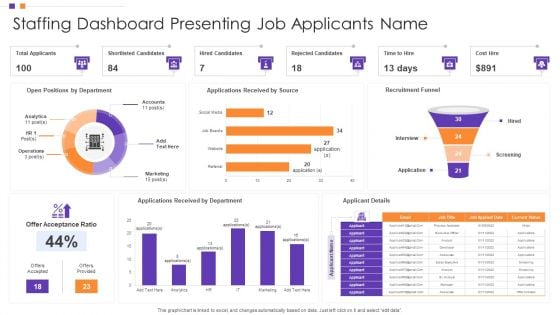
Staffing Dashboard Presenting Job Applicants Name Background PDF
Showcasing this set of slides titled Staffing Dashboard Presenting Job Applicants Name Background PDF The topics addressed in these templates are Shortlisted Candidates, Received By Department, Recruitment Funnel All the content presented in this PPT design is completely editable. Download it and make adjustments in color, background, font etc. as per your unique business setting.
-
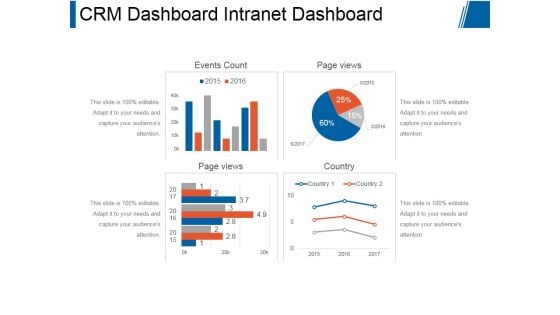
Crm Dashboard Intranet Dashboard Ppt PowerPoint Presentation Model
This is a crm dashboard intranet dashboard ppt powerpoint presentation model. This is a four stage process. The stages in this process are events count, page views, page views, country.
-
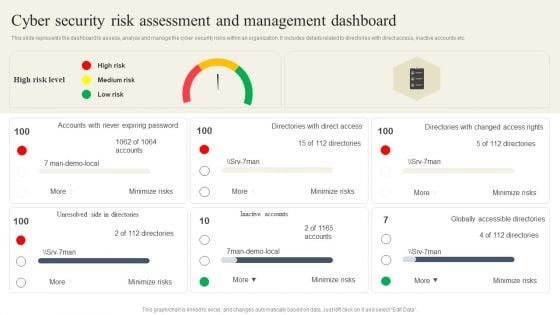
CYBER Security Breache Response Strategy Cyber Security Risk Assessment And Management Dashboard Summary PDF
This slide represents the dashboard to assess, analyze and manage the cyber security risks within an organization. It includes details related to directories with direct access, inactive accounts etc. This CYBER Security Breache Response Strategy Cyber Security Risk Assessment And Management Dashboard Summary PDF is perfect for any presentation, be it in front of clients or colleagues. It is a versatile and stylish solution for organizing your meetings. The CYBER Security Breache Response Strategy Cyber Security Risk Assessment And Management Dashboard Summary PDF features a modern design for your presentation meetings. The adjustable and customizable slides provide unlimited possibilities for acing up your presentation. Slidegeeks has done all the homework before launching the product for you. So, do not wait, grab the presentation templates today
-
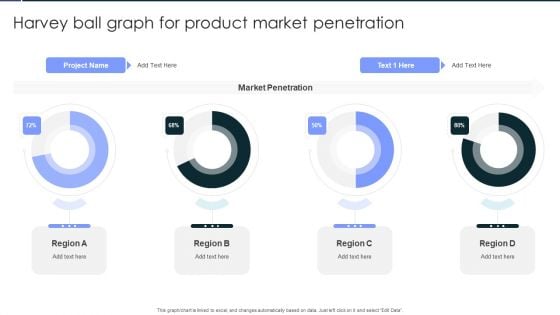
Harvey Ball Graph For Product Market Penetration Clipart PDF
Showcasing this set of slides titled Harvey Ball Graph For Product Market Penetration Clipart PDF. The topics addressed in these templates are Harvey Ball Graph, For Product, Market Penetration. All the content presented in this PPT design is completely editable. Download it and make adjustments in color, background, font etc. as per your unique business setting.
-
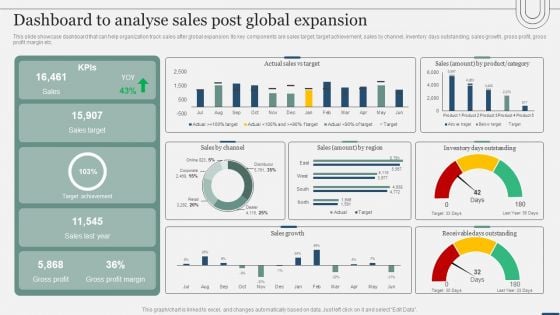
Assessing International Market Dashboard To Analyse Sales Post Global Expansion Elements PDF
This slide showcase dashboard that can help organization track sales after global expansion. Its key components are sales target, target achievement, sales by channel, inventory days outstanding, sales growth, gross profit, gross profit margin etc. Are you in need of a template that can accommodate all of your creative concepts This one is crafted professionally and can be altered to fit any style. Use it with Google Slides or PowerPoint. Include striking photographs, symbols, depictions, and other visuals. Fill, move around, or remove text boxes as desired. Test out color palettes and font mixtures. Edit and save your work, or work with colleagues. Download Assessing International Market Dashboard To Analyse Sales Post Global Expansion Elements PDF and observe how to make your presentation outstanding. Give an impeccable presentation to your group and make your presentation unforgettable.
-
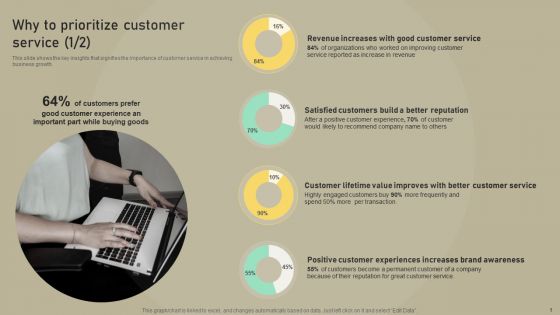
Customer Experience Optimization Why To Prioritize Customer Service Formats PDF
This slide shows the key insights that signifies the importance of customer service in achieving business growth. If you are looking for a format to display your unique thoughts, then the professionally designed Customer Experience Optimization Why To Prioritize Customer Service Formats PDF is the one for you. You can use it as a Google Slides template or a PowerPoint template. Incorporate impressive visuals, symbols, images, and other charts. Modify or reorganize the text boxes as you desire. Experiment with shade schemes and font pairings. Alter, share or cooperate with other people on your work. Download Customer Experience Optimization Why To Prioritize Customer Service Formats PDF and find out how to give a successful presentation. Present a perfect display to your team and make your presentation unforgettable.
-
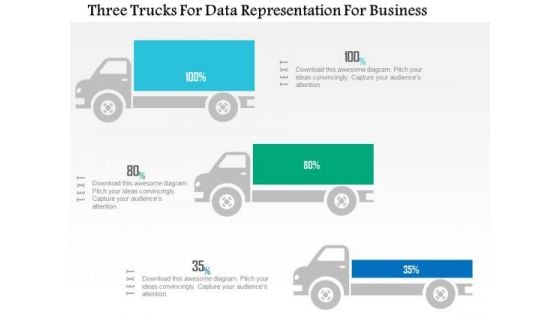
Business Diagram Three Trucks For Data Representation For Business PowerPoint Slide
This business diagram displays three trucks graphic. This diagram contains trucks for percentage value growth. Use this diagram to display business growth over a period of time.
-
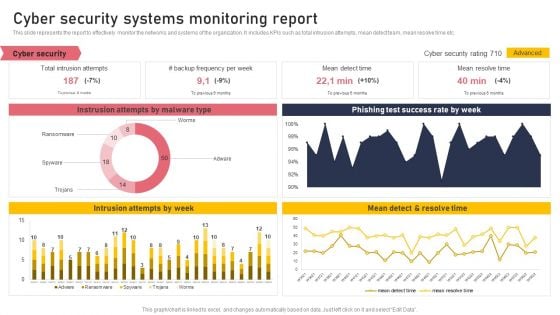
Cyber Security Systems Monitoring Report Formats PDF
This slide represents the report to effectively monitor the networks and systems of the organization. It includes KPIs such as total intrusion attempts, mean detect team, mean resolve time etc. Boost your pitch with our creative Cyber Security Systems Monitoring Report Formats PDF. Deliver an awe-inspiring pitch that will mesmerize everyone. Using these presentation templates you will surely catch everyones attention. You can browse the ppts collection on our website. We have researchers who are experts at creating the right content for the templates. So you do not have to invest time in any additional work. Just grab the template now and use them.
-
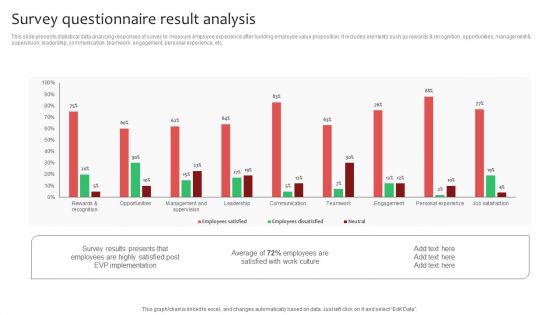
Survey Questionnaire Result Analysis Ppt Ideas Show PDF
This slide presents statistical data analyzing responses of survey to measure employee experience after building employee value proposition. It includes elements such as rewards and recognition, opportunities, management and supervision, leadership, communication, teamwork, engagement, personal experience, etc. Do you have an important presentation coming up Are you looking for something that will make your presentation stand out from the rest Look no further than Survey Questionnaire Result Analysis Ppt Ideas Show PDF. With our professional designs, you can trust that your presentation will pop and make delivering it a smooth process. And with Slidegeeks, you can trust that your presentation will be unique and memorable. So why wait Grab Survey Questionnaire Result Analysis Ppt Ideas Show PDF today and make your presentation stand out from the rest.
-
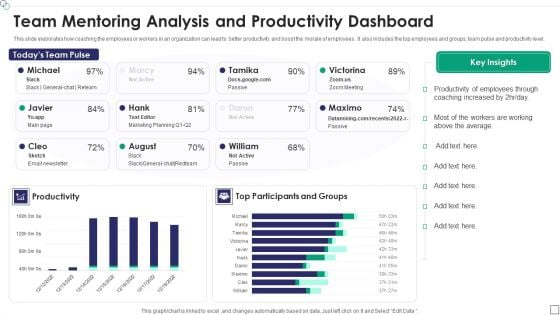
Team Mentoring Analysis And Productivity Dashboard Template PDF
This slide elaborates how coaching the employees or workers in an organization can lead to better productivity and boost the morale of employees . It also includes the top employees and groups, team pulse and productivity level.Showcasing this set of slides titled Team Mentoring Analysis And Productivity Dashboard Template PDF The topics addressed in these templates are Productivity Of Employees, Coaching Increased, Productivity All the content presented in this PPT design is completely editable. Download it and make adjustments in color, background, font etc. as per your unique business setting.
-
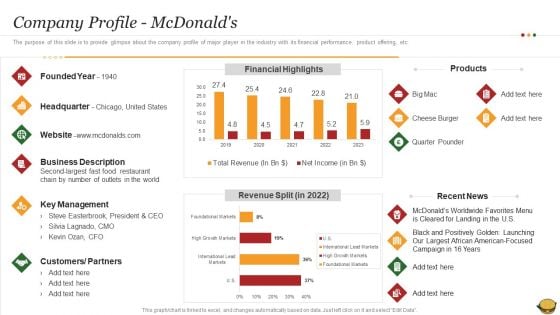
Hamburger Commerce Company Analysis Company Profile Mcdonalds Professional PDF
The purpose of this slide is to provide glimpse about the company profile of major player in the industry with its financial performance, product offering, etc Deliver an awe inspiring pitch with this creative Hamburger Commerce Company Analysis Company Profile Mcdonalds Professional PDF bundle. Topics like Business Description, Customers Or Partners, Key Management can be discussed with this completely editable template. It is available for immediate download depending on the needs and requirements of the user.
-
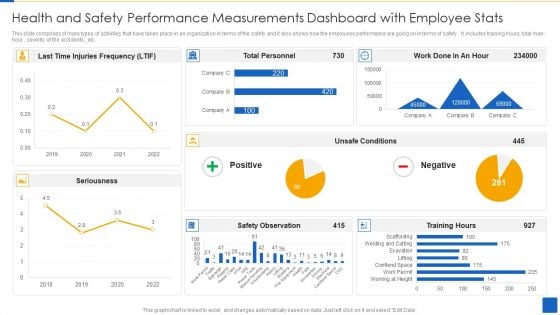
Health And Safety Performance Measurements Dashboard With Employee Stats Template PDF
This slide comprises of many types of activities that have taken place in an organization in terms of the safety and it also shows how the employees performance are going on in terms of safety . It includes training hours, total man-hour , severity of the accidents , etc.Pitch your topic with ease and precision using this Health And Safety Performance Measurements Dashboard With Employee Stats Template PDF This layout presents information on Safety Observation, Injuries Frequency, Unsafe Conditions It is also available for immediate download and adjustment. So, changes can be made in the color, design, graphics or any other component to create a unique layout.
-
Web Analytics Charts Visits Bounce Rate Page Views Ppt PowerPoint Presentation Icon Layouts
This is a web analytics charts visits bounce rate page views ppt powerpoint presentation icon layouts. This is a six stage process. The stages in this process are digital analytics, digital dashboard, marketing.
-
Business Diagram Laptop With Data Driven Area Chart PowerPoint Slide
This diagram has been designed with laptop and data driven area chart. Download this diagram to give your presentations more effective look. It helps in clearly conveying your message to clients and audience.
-
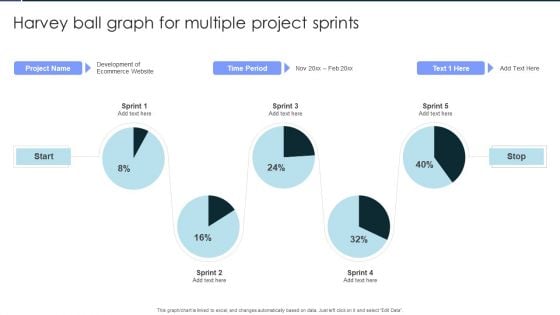
Harvey Ball Graph For Multiple Project Sprints Background PDF
Pitch your topic with ease and precision using this Harvey Ball Graph For Multiple Project Sprints Background PDF. This layout presents information on Harvey Ball Graph, For Multiple, Project Sprints. It is also available for immediate download and adjustment. So, changes can be made in the color, design, graphics or any other component to create a unique layout.
-
Application Performance Dashboard Ppt Icon Template PDF
This slide covers application performance in market KPIs and metrics such as impressions, clicks, searches for app, conversion rate etc. This Application Performance Dashboard Ppt Icon Template PDF from Slidegeeks makes it easy to present information on your topic with precision. It provides customization options, so you can make changes to the colors, design, graphics, or any other component to create a unique layout. It is also available for immediate download, so you can begin using it right away. Slidegeeks has done good research to ensure that you have everything you need to make your presentation stand out. Make a name out there for a brilliant performance.
-
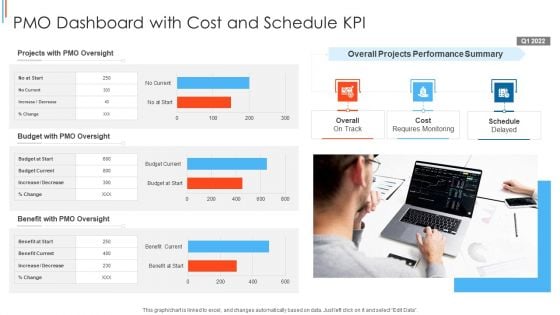
PMO Dashboard With Cost And Schedule KPI Template PDF
Showcasing this set of slides titled PMO Dashboard With Cost And Schedule KPI Themes PDF The topics addressed in these templates are Projects With Pmo Oversight, Budget With Pmo Oversight, Benefit With Pmo Oversight All the content presented in this PPT design is completely editable. Download it and make adjustments in color, background, font etc. as per your unique business setting.
-
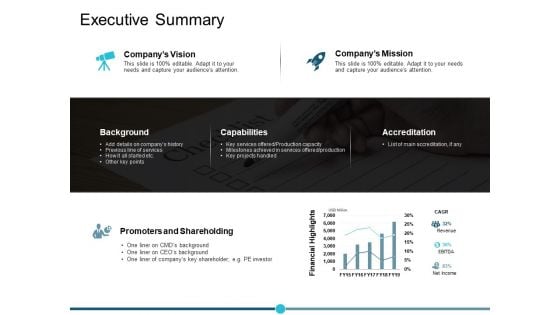
Executive Summary Ppt PowerPoint Presentation Model
This is a executive summary ppt powerpoint presentation model. This is a three stage process. The stages in this process are percentage, product, business, management, marketing.
-
HR Dashboard Indicating Weekly Professional Counselling Kpis Icons PDF
This slide illustrates HR career counselling dashboard. It provides information about hours of consultation, satisfaction rate, per consultant rate, popular counselors, etc. Showcasing this set of slides titled HR Dashboard Indicating Weekly Professional Counselling Kpis Icons PDF. The topics addressed in these templates are Specialization, Hours Of Consultation, Popular Counselors. All the content presented in this PPT design is completely editable. Download it and make adjustments in color, background, font etc. as per your unique business setting.
-
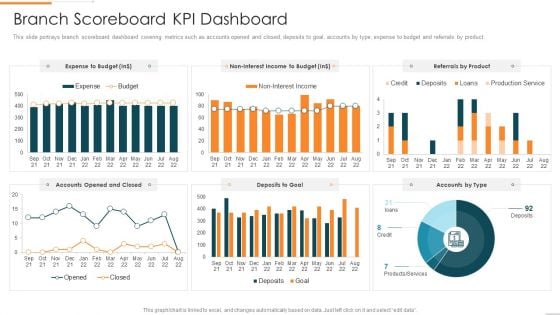
Enhanced Customer Banking Experience With Mobile Branch Scoreboard KPI Dashboard Graphics PDF
This slide portrays branch scoreboard dashboard covering metrics such as accounts opened and closed, deposits to goal, accounts by type, expense to budget and referrals by product.Deliver an awe inspiring pitch with this creative Enhanced Customer Banking Experience With Mobile Branch Scoreboard KPI Dashboard Graphics PDF bundle. Topics like Branch Scoreboard KPI Dashboard can be discussed with this completely editable template. It is available for immediate download depending on the needs and requirements of the user.
-
Kpis In Shipping Perfect Order Rate And On Time Shipment Ppt PowerPoint Presentation Show Guide
This is a kpis in shipping perfect order rate and on time shipment ppt powerpoint presentation show guide. This is a six stage process. The stages in this process are logistics performance, logistics dashboard, logistics kpis.
-
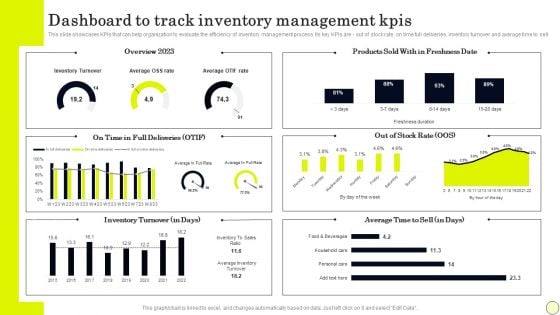
Dashboard To Track Inventory Management Kpis Portrait PDF
This slide showcases KPIs that can help organization to evaluate the efficiency of inventory management process. Its key KPIs are out of stock rate, on time full deliveries, inventory turnover and average time to sell. Here you can discover an assortment of the finest PowerPoint and Google Slides templates. With these templates, you can create presentations for a variety of purposes while simultaneously providing your audience with an eye catching visual experience. Download Dashboard To Track Inventory Management Kpis Portrait PDF to deliver an impeccable presentation. These templates will make your job of preparing presentations much quicker, yet still, maintain a high level of quality. Slidegeeks has experienced researchers who prepare these templates and write high quality content for you. Later on, you can personalize the content by editing the Dashboard To Track Inventory Management Kpis Portrait PDF.
-
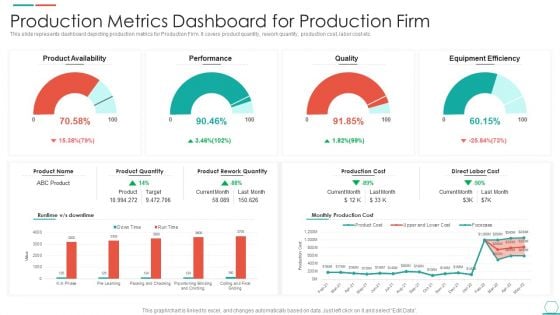
Production Metrics Dashboard For Production Firm Rules PDF
This slide represents dashboard depicting production metrics for Production Firm. It covers product quantity, rework quantity, production cost, labor cost etc. Showcasing this set of slides titled Production Metrics Dashboard For Production Firm Rules PDF. The topics addressed in these templates are Equipment Efficiency, Product Availability, Production Cost. All the content presented in this PPT design is completely editable. Download it and make adjustments in color, background, font etc. as per your unique business setting.
-
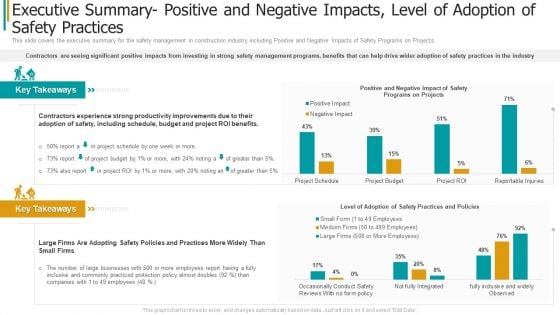
Construction Sector Project Risk Management Executive Summary Positive And Negative Impacts Level Of Adoption Of Safety Practices Graphics PDF
This slide covers the executive summary for the safety management in construction industry including Positive and Negative Impacts of Safety Programs on Projects. Deliver and pitch your topic in the best possible manner with this construction sector project risk management executive summary positive and negative impacts level of adoption of safety practices graphics pdf. Use them to share invaluable insights on improvements, policies, businesses, budget and impress your audience. This template can be altered and modified as per your expectations. So, grab it now.
-
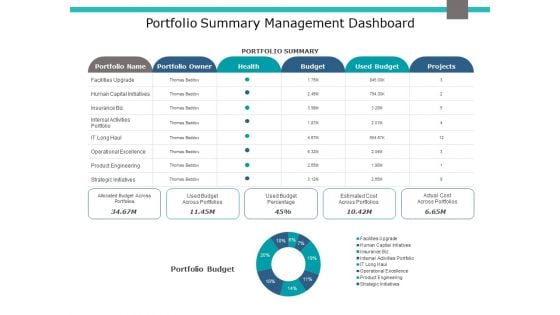
Portfolio Summary Management Dashboard Ppt PowerPoint Presentation Pictures Visuals
This is a portfolio summary management dashboard ppt powerpoint presentation pictures visuals. This is a six stage process. The stages in this process are finance, marketing, management, investment.
-
Information Technology Security Team Analytics Dashboard With KPI Themes PDF
This slide elaborates about the number of incidents that have taken place in cyber security and the malware types with per incident. It also includes the number of open and resolved ticked. Showcasing this set of slides titled Information Technology Security Team Analytics Dashboard With KPI Themes PDF. The topics addressed in these templates are Open Incidents, Resolved Incidents, Open Tickets, Resolved Tickets. All the content presented in this PPT design is completely editable. Download it and make adjustments in color, background, font etc. as per your unique business setting.
-
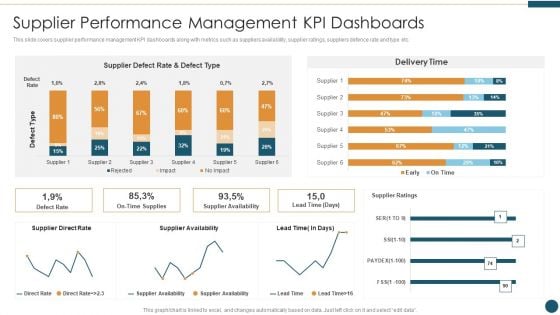
Supplier Relationship Management Supplier Performance Management KPI Dashboards Information PDF
This slide covers supplier performance management KPI dashboards along with metrics such as suppliers availability, supplier ratings, suppliers defence rate and type etc. Deliver an awe inspiring pitch with this creative Supplier Relationship Management Supplier Performance Management KPI Dashboards Information PDF bundle. Topics like Supplier Performance Management Kpi Dashboards can be discussed with this completely editable template. It is available for immediate download depending on the needs and requirements of the user.
-
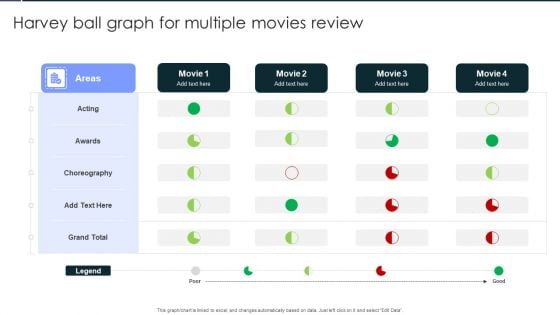
Harvey Ball Graph For Multiple Movies Review Template PDF
Showcasing this set of slides titled Harvey Ball Graph For Multiple Movies Review Template PDF. The topics addressed in these templates are Acting, Awards, Choreography. All the content presented in this PPT design is completely editable. Download it and make adjustments in color, background, font etc. as per your unique business setting.
-
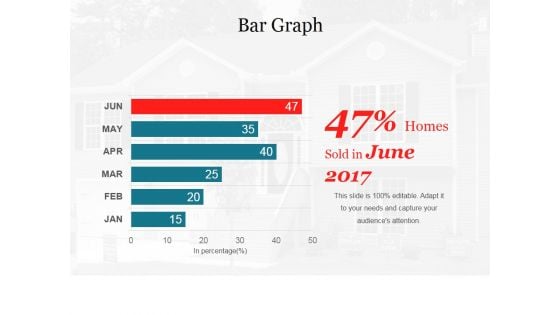
Bar Graph Ppt PowerPoint Presentation File Picture
This is a bar graph ppt powerpoint presentation file picture. This is a six stage process. The stages in this process are management, planning, marketing, business, strategy.
-
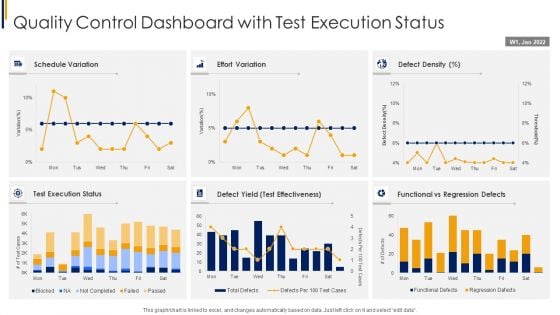
Quality Control Dashboard With Test Execution Status Themes PDF
Pitch your topic with ease and precision using this Quality Control Dashboard With Test Execution Status Themes PDF. This layout presents information on Schedule Variation, Defect Density, Regression Defects. It is also available for immediate download and adjustment. So, changes can be made in the color, design, graphics or any other component to create a unique layout.
-
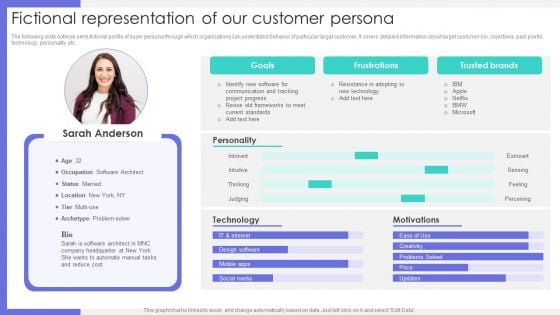
Fictional Representation Of Our Customer Persona Ppt Inspiration Deck PDF
The following slide outlines semi-fictional profile of buyer persona through which organizations can understand behavior of particular target customer. It covers detailed information about target customer bio, objectives, pain points, technology, personality, etc. Coming up with a presentation necessitates that the majority of the effort goes into the content and the message you intend to convey. The visuals of a PowerPoint presentation can only be effective if it supplements and supports the story that is being told. Keeping this in mind our experts created Fictional Representation Of Our Customer Persona Ppt Inspiration Deck PDF to reduce the time that goes into designing the presentation. This way, you can concentrate on the message while our designers take care of providing you with the right template for the situation.
-
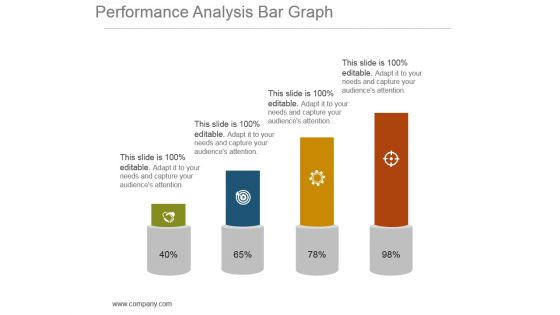
Performance Analysis Bar Graph Powerpoint Shapes
This is a performance analysis bar graph powerpoint shapes. This is a four stage process. The stages in this process are growth, finance, strategy, management, marketing.
-
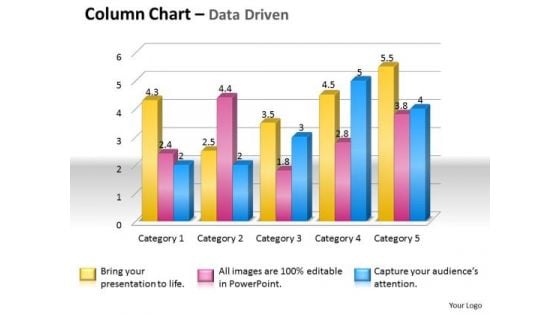
Data Analysis Techniques 3d Grouped Bar Chart PowerPoint Templates
Place The Orders With Your Thoughts. Our data analysis techniques 3d grouped bar chart Powerpoint Templates Know The Drill.
-
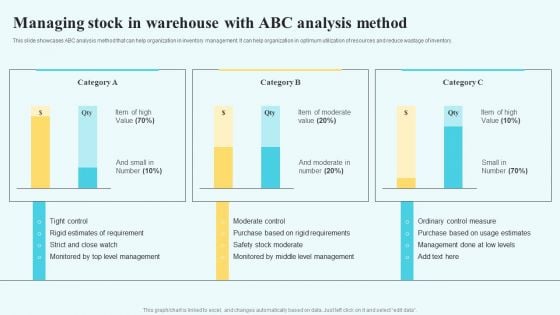
Adopting Multiple Tactics To Improve Inventory Optimization Managing Stock In Warehouse With Abc Analysis Method Brochure PDF
This modern and well arranged Adopting Multiple Tactics To Improve Inventory Optimization Managing Stock In Warehouse With Abc Analysis Method Brochure PDF provides lots of creative possibilities. It is very simple to customize and edit with the Powerpoint Software. Just drag and drop your pictures into the shapes. All facets of this template can be edited with Powerpoint no extra software is necessary. Add your own material, put your images in the places assigned for them, adjust the colors, and then you can show your slides to the world, with an animated slide included.
-
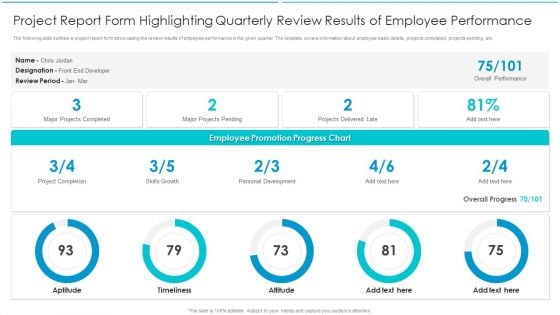
Project Report Form Highlighting Quarterly Review Results Of Employee Performance Brochure PDF
The following slide outlines a project report form showcasing the review results of employee performance in the given quarter. The template covers information about employee basic details, projects completed, projects pending, etc. Showcasing this set of slides titled Project Report Form Highlighting Quarterly Review Results Of Employee Performance Brochure PDF. The topics addressed in these templates are Growth, Development, Timeliness. All the content presented in this PPT design is completely editable. Download it and make adjustments in color, background, font etc. as per your unique business setting.
-
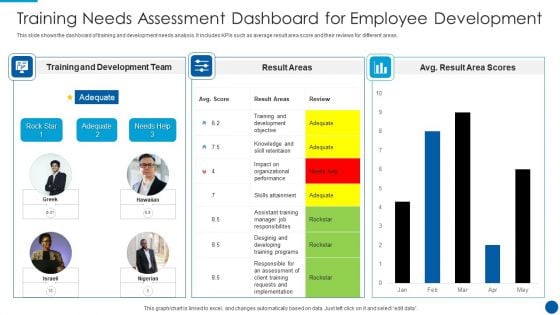
Training Needs Assessment Dashboard For Employee Development Demonstration PDF
This slide shows the dashboard of training and development needs analysis. It includes KPIs such as average result area score and their reviews for different areas. Showcasing this set of slides titled training needs assessment dashboard for employee development demonstration pdf. The topics addressed in these templates are development, team, implementation. All the content presented in this PPT design is completely editable. Download it and make adjustments in color, background, font etc. as per your unique business setting.
-
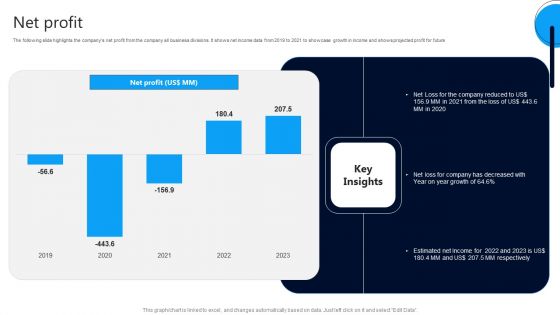
Market Research Evaluation Company Outline Net Profit Graphics PDF
The following slide highlights the companys net profit from the company all business divisions. It shows net income data from 2019 to 2021 to showcase growth in income and shows projected profit for future. Find highly impressive Market Research Evaluation Company Outline Net Profit Graphics PDF on Slidegeeks to deliver a meaningful presentation. You can save an ample amount of time using these presentation templates. No need to worry to prepare everything from scratch because Slidegeeks experts have already done a huge research and work for you. You need to download Market Research Evaluation Company Outline Net Profit Graphics PDF for your upcoming presentation. All the presentation templates are 100 percent editable and you can change the color and personalize the content accordingly. Download now.
-
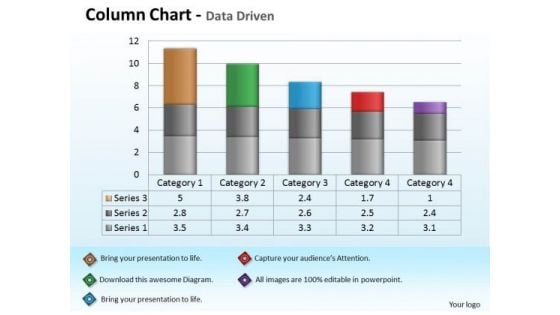
Quantitative Data Analysis Driven Economic With Column Chart PowerPoint Slides Templates
Add Some Dramatization To Your Thoughts. Our quantitative data analysis driven economic with column chart powerpoint slides Templates Make Useful Props.
-
Stock And Inventory Dashboard With Reorder Value Ppt PowerPoint Presentation File Slide Portrait PDF
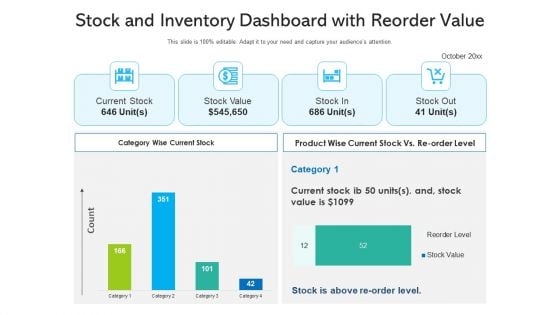
Showcasing this set of slides titled stock and inventory dashboard with reorder value ppt powerpoint presentation file slide portrait pdf. The topics addressed in these templates are stock and inventory dashboard with reorder value. All the content presented in this PPT design is completely editable. Download it and make adjustments in color, background, font etc. as per your unique business setting.
-
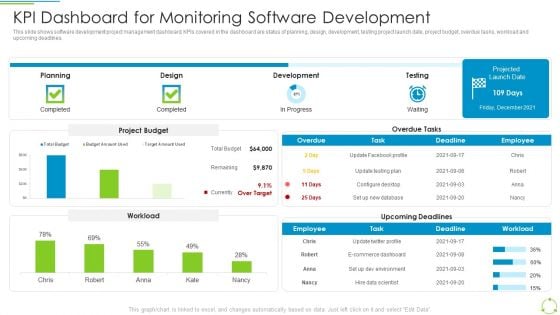
Executing Devops Framework KPI Dashboard For Monitoring Software Development Portrait PDF
This slide shows software development project management dashboard. KPIs covered in the dashboard are status of planning, design, development, testing project launch date, project budget, overdue tasks, workload and upcoming deadlines. Deliver an awe inspiring pitch with this creative Executing Devops Framework KPI Dashboard For Monitoring Software Development Portrait PDF bundle. Topics like Planning, Design, Development, Testing can be discussed with this completely editable template. It is available for immediate download depending on the needs and requirements of the user.
-
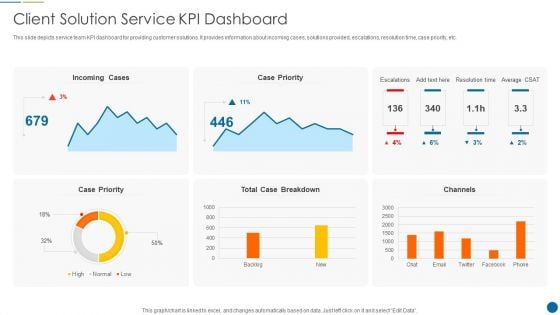
Client Solution Service Kpi Dashboard Sample PDF
This slide depicts service team KPI dashboard for providing customer solutions. It provides information about incoming cases, solutions provided, escalations, resolution time, case priority, etc. Showcasing this set of slides titled Client Solution Service Kpi Dashboard Sample PDF. The topics addressed in these templates are Client Solution Service KPI Dashboard. All the content presented in this PPT design is completely editable. Download it and make adjustments in color, background, font etc. as per your unique business setting
-
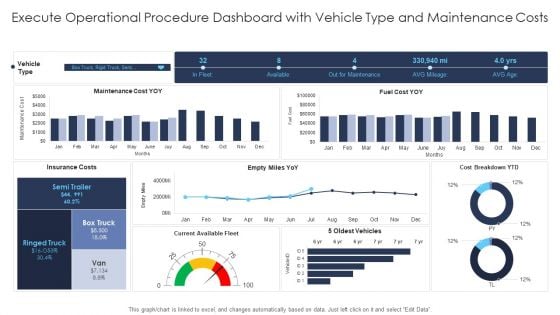
Execute Operational Procedure Dashboard With Vehicle Type And Maintenance Costs Introduction PDF
Deliver and pitch your topic in the best possible manner with this execute operational procedure dashboard with vehicle type and maintenance costs introduction pdf. Use them to share invaluable insights on execute operational procedure dashboard with raci chart and action timeline 2 or 2 and impress your audience. This template can be altered and modified as per your expectations. So, grab it now.
-
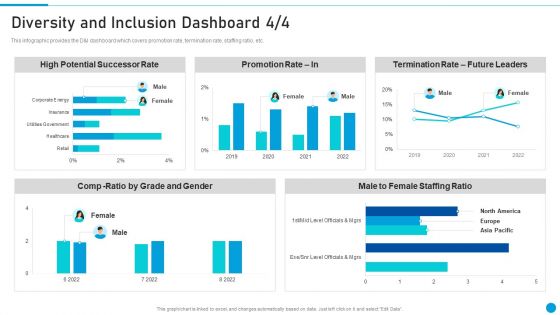
Embed Diversity And Inclusion Diversity And Inclusion Dashboard Introduction PDF
This infographic provides the D And I dashboard which covers promotion rate, termination rate, staffing ratio, etc. Deliver and pitch your topic in the best possible manner with this Embed Diversity And Inclusion Diversity And Inclusion Dashboard Introduction PDF. Use them to share invaluable insights on High Potential Successor Rate, Promotion Rate In, Termination Rate Future Leaders, Male To Female Staffing Ratio and impress your audience. This template can be altered and modified as per your expectations. So, grab it now.
-
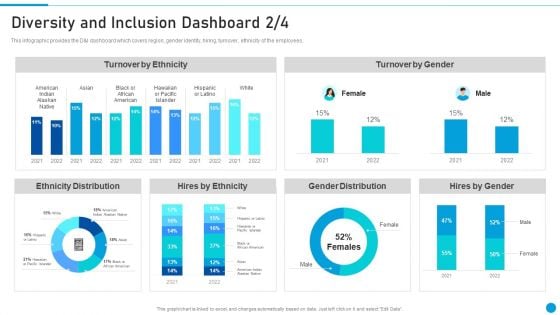
Embed Diversity And Inclusion Diversity And Inclusion Dashboard Download PDF
This infographic provides the D And I dashboard which covers region, gender identity, hiring, turnover, ethnicity of the employees. Deliver an awe inspiring pitch with this creative Embed Diversity And Inclusion Diversity And Inclusion Dashboard Download PDF bundle. Topics like Turnover By Ethnicity, Turnover By Gender, Ethnicity Distribution, Hires By Ethnicity, Gender Distribution, Hires By Gender can be discussed with this completely editable template. It is available for immediate download depending on the needs and requirements of the user.
-
Excel Data Analysis Data Tools Data Methods Statistical Chart For Process PowerPoint Templates
Blend Your Views With Our excel data analysis data tools data methods statistical chart for process Powerpoint Templates . They Are Made For Each Other.
-
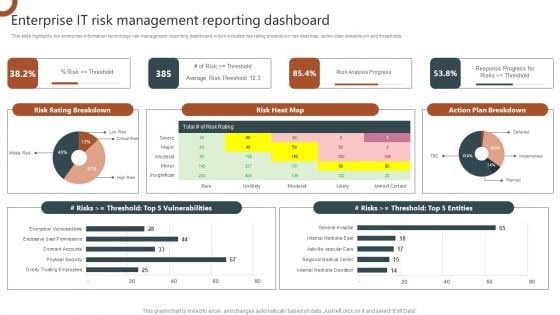
Organizations Risk Management And IT Security Enterprise IT Risk Management Reporting Dashboard Diagrams PDF
This slide highlights the enterprise information technology risk management reporting dashboard which includes risk rating breakdown risk heat map, action plan breakdown and thresholds. This Organizations Risk Management And IT Security Enterprise IT Risk Management Reporting Dashboard Diagrams PDF is perfect for any presentation, be it in front of clients or colleagues. It is a versatile and stylish solution for organizing your meetings. The Organizations Risk Management And IT Security Enterprise IT Risk Management Reporting Dashboard Diagrams PDF features a modern design for your presentation meetings. The adjustable and customizable slides provide unlimited possibilities for acing up your presentation. Slidegeeks has done all the homework before launching the product for you. So, do not wait, grab the presentation templates today.
-
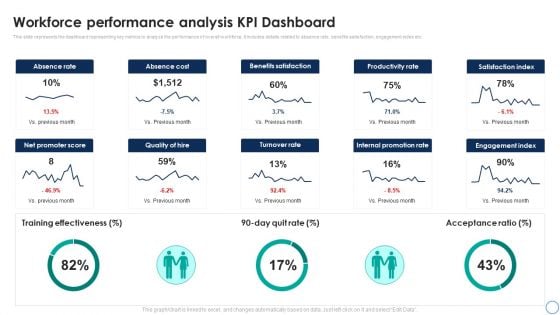
Business Analytics Application Workforce Performance Analysis KPI Dashboard Template PDF
This slide represents the dashboard representing key metrics to analyze the performance of overall workforce. It includes details related to absence rate, benefits satisfaction, engagement index etc. Take your projects to the next level with our ultimate collection of Business Analytics Application Workforce Performance Analysis KPI Dashboard Template PDF. Slidegeeks has designed a range of layouts that are perfect for representing task or activity duration, keeping track of all your deadlines at a glance. Tailor these designs to your exact needs and give them a truly corporate look with your own brand colors theyll make your projects stand out from the rest.
-
Personnel Sourcing And Recruitment Metrics Dashboard Themes PDF
Showcasing this set of slides titled Personnel Sourcing And Recruitment Metrics Dashboard Themes PDF The topics addressed in these templates are Sourcing Channels, Recruitment Conduit, Turnover Ratio Age Wise All the content presented in this PPT design is completely editable. Download it and make adjustments in color, background, font etc. as per your unique business setting.
-
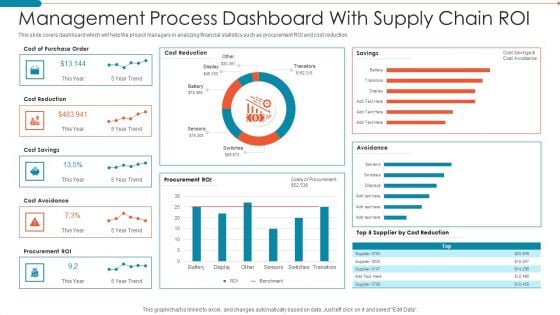
Management Process Dashboard With Supply Chain Roi Professional PDF
This slide covers dashboard which will help the project managers in analyzing financial statistics such as procurement ROI and cost reduction.Pitch your topic with ease and precision using this Management Process Dashboard With Supply Chain Roi Professional PDF. This layout presents information on Management Process Dashboard With Supply Chain Roi. It is also available for immediate download and adjustment. So, changes can be made in the color, design, graphics or any other component to create a unique layout.
-
Software Implementation Technique Software Implementation Project Progress Tracking Dashboard Introduction PDF
This slide represents the dashboard to track the progress of software implementation project. It includes details related to health, tasks, project, time, cost and workload of software implementation project. The Software Implementation Technique Software Implementation Project Progress Tracking Dashboard Introduction PDF is a compilation of the most recent design trends as a series of slides. It is suitable for any subject or industry presentation, containing attractive visuals and photo spots for businesses to clearly express their messages. This template contains a variety of slides for the user to input data, such as structures to contrast two elements, bullet points, and slides for written information. Slidegeeks is prepared to create an impression.
-
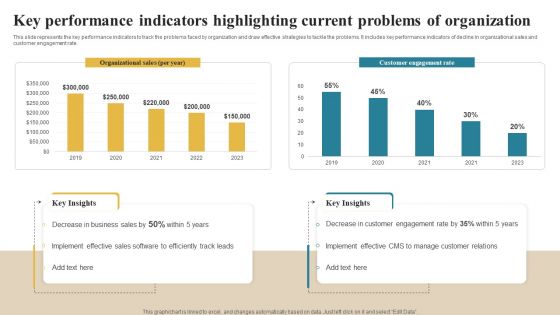
Software Implementation Technique Key Performance Indicators Highlighting Current Problems Elements PDF
This slide represents the key performance indicators to track the problems faced by organization and draw effective strategies to tackle the problems. It includes key performance indicators of decline in organizational sales and customer engagement rate. Make sure to capture your audiences attention in your business displays with our gratis customizable Software Implementation Technique Key Performance Indicators Highlighting Current Problems Elements PDF. These are great for business strategies, office conferences, capital raising or task suggestions. If you desire to acquire more customers for your tech business and ensure they stay satisfied, create your own sales presentation with these plain slides.

 Home
Home 


