Charts and Graphs
-
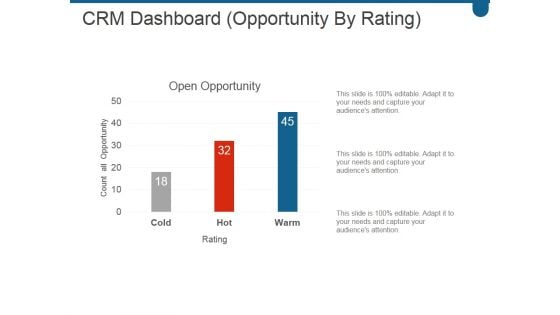
Crm Dashboard Opportunity By Rating Ppt PowerPoint Presentation Model
This is a crm dashboard opportunity by rating ppt powerpoint presentation model. This is a three stage process. The stages in this process are open opportunity, cold, hot, warm.
-
Stacked Area With Markers Ppt PowerPoint Presentation Icon
This is a stacked area with markers ppt powerpoint presentation icon. This is a two stage process. The stages in this process are business, growth, success, marketing, year.
-
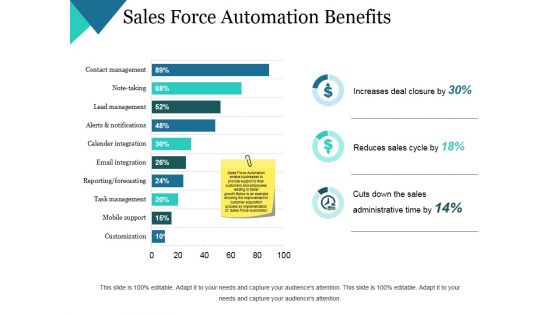
Sales Force Automation Benefits Ppt PowerPoint Presentation Infographics Samples
This is a sales force automation benefits ppt powerpoint presentation infographics samples. This is a two stage process. The stages in this process are increases deal closure by, reduces sales cycle by, cuts down the sales administrative time by, business, marketing.
-
Adjusted Roce Return On Capital Employed Template 2 Ppt PowerPoint Presentation Icon Backgrounds
This is a adjusted roce return on capital employed template 2 ppt powerpoint presentation icon backgrounds. This is a five stage process. The stages in this process are business, marketing, success, planning, management.
-
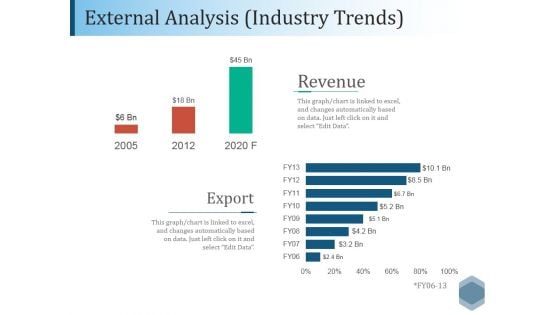
External Analysis Industry Trends Ppt PowerPoint Presentation File Outfit
This is a external analysis industry trends ppt powerpoint presentation file outfit. This is a two stage process. The stages in this process are revenue, export, bar, finance, analysis.
-
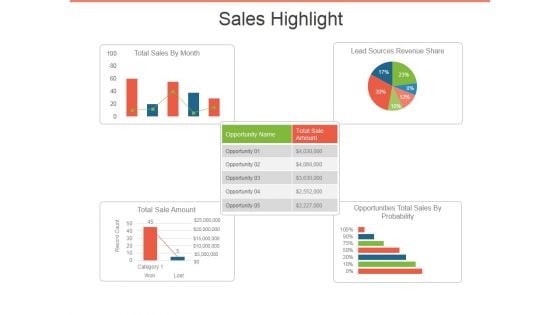
Sales Highlight Ppt PowerPoint Presentation Ideas Design Templates
This is a sales highlight ppt powerpoint presentation ideas design templates. This is a five stage process. The stages in this process are total sales by month, lead sources revenue share, opportunities total sales by probability, total sale amount.
-
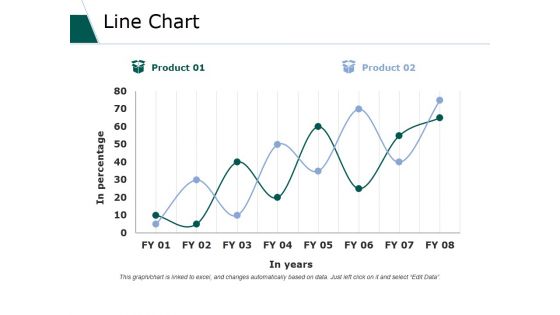
Line Chart Ppt PowerPoint Presentation Gallery Information
This is a line chart ppt powerpoint presentation gallery information. This is a two stage process. The stages in this process are business, marketing, strategy, planning, finance.
-
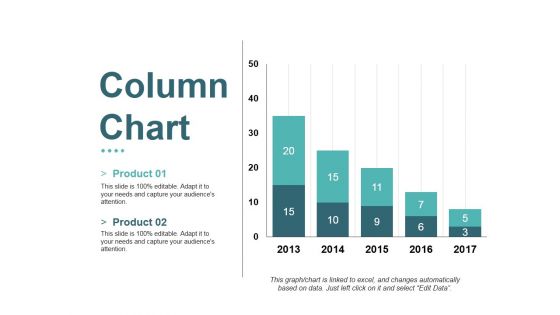
Column Chart Ppt PowerPoint Presentation Summary Maker
This is a column chart ppt powerpoint presentation summary maker. This is a two stage process. The stages in this process are business, marketing, product, bar graph, years.
-
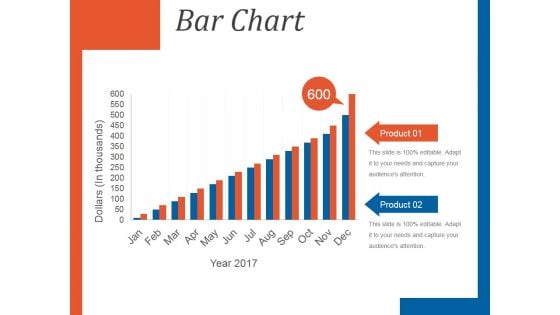
Bar Chart Template 1 Ppt PowerPoint Presentation Background Images
This is a bar chart template 1 ppt powerpoint presentation background images. This is a twelve stage process. The stages in this process are product, bar chart, dollars, year.
-
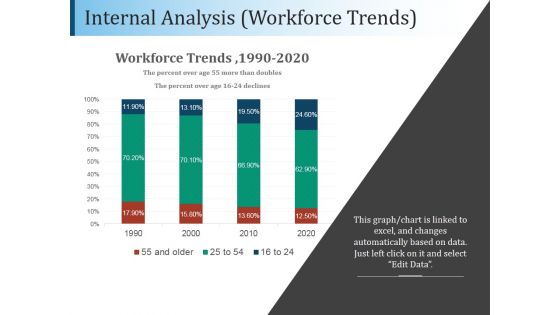
Internal Analysis Workforce Trends Ppt PowerPoint Presentation Example
This is a internal analysis workforce trends ppt powerpoint presentation example. This is a four stage process. The stages in this process are workforce trends, business, marketing, bar, finance.
-
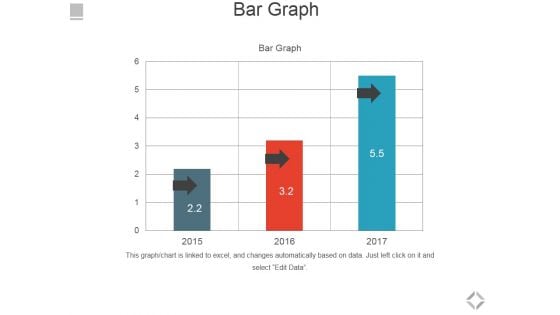
Bar Graph Ppt PowerPoint Presentation Summary Skills
This is a bar graph ppt powerpoint presentation summary skills. This is a three stage process. The stages in this process are bar graph, business, marketing, success, growth.
-
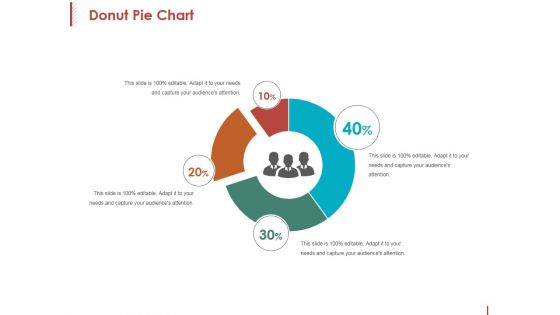
Donut Pie Chart Ppt PowerPoint Presentation Professional Example File
This is a donut pie chart ppt powerpoint presentation professional example file. This is a four stage process. The stages in this process are percentage, finance, donut, business, process.
-
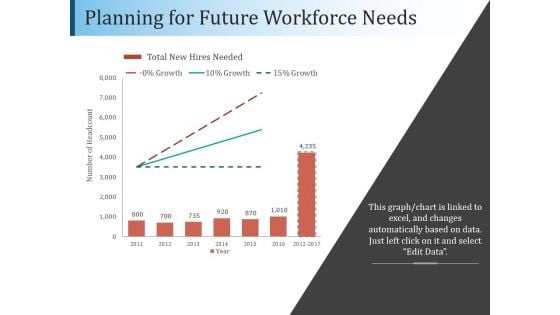
Planning For Future Workforce Needs Ppt PowerPoint Presentation Portfolio Graphics Template
This is a planning for future workforce needs ppt powerpoint presentation portfolio graphics template. This is a seven stage process. The stages in this process are hiring, business, growth, planning, success.
-
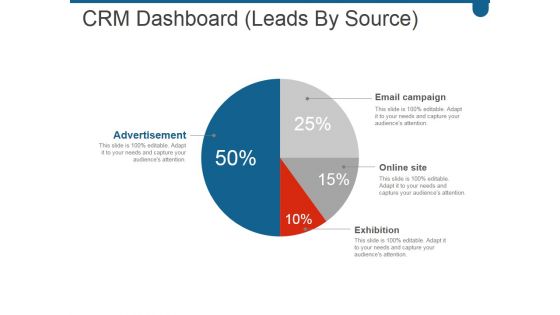
Crm Dashboard Leads By Source Ppt PowerPoint Presentation Inspiration
This is a crm dashboard leads by source ppt powerpoint presentation inspiration. This is a four stage process. The stages in this process are advertisement, email campaign, online site, exhibition.
-
Volume High Low Close Chart Ppt PowerPoint Presentation Pictures Icons
This is a volume high low close chart ppt powerpoint presentation pictures icons. This is a two stage process. The stages in this process are high, volume, low.
-
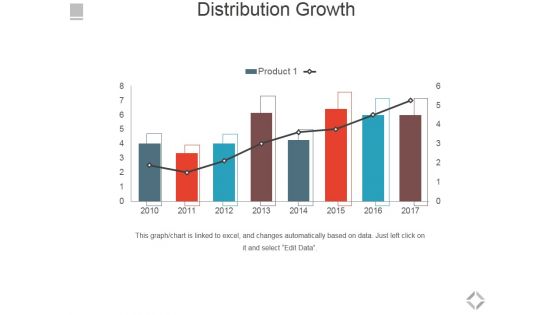
Distribution Growth Ppt PowerPoint Presentation Slides Clipart
This is a distribution growth ppt powerpoint presentation slides clipart. This is a eight stage process. The stages in this process are distribution growth, bar graph, business, marketing, success.
-
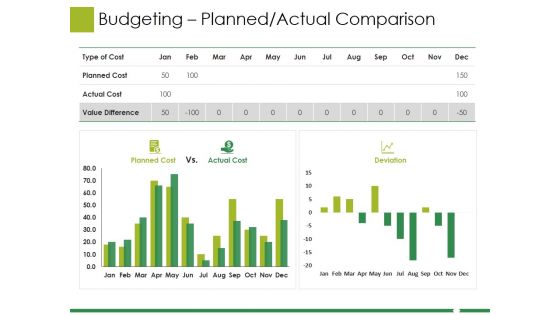
Budgeting Planned Actual Comparison Ppt PowerPoint Presentation Portfolio Information
This is a budgeting planned actual comparison ppt powerpoint presentation portfolio information. This is a three stage process. The stages in this process are planned cost, actual cost, deviation.
-
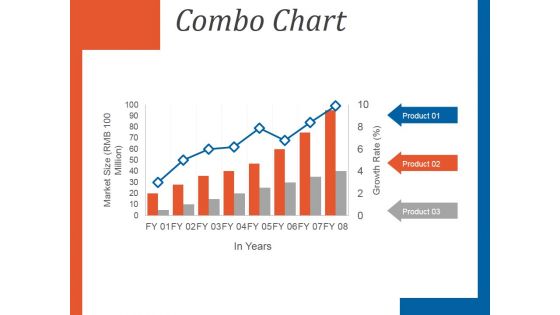
Combo Chart Ppt PowerPoint Presentation Design Ideas
This is a combo chart ppt powerpoint presentation design ideas. This is a eight stage process. The stages in this process are market size, combo chart, in years, product, growth rate.
-
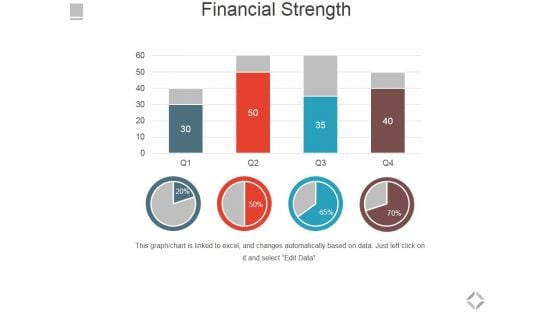
Financial Strength Ppt PowerPoint Presentation Summary Ideas
This is a financial strength ppt powerpoint presentation summary ideas. This is a four stage process. The stages in this process are bar graph, business, marketing, success, growth.
-
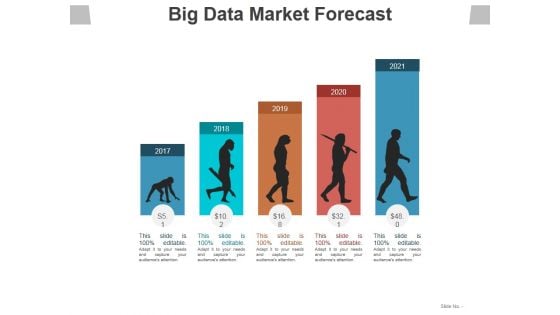
Big Data Market Forecast Ppt PowerPoint Presentation Ideas Information
This is a big data market forecast ppt powerpoint presentation ideas information. This is a five stage process. The stages in this process are years, planning, growth, business, marketing.
-
Line Chart Ppt PowerPoint Presentation Gallery Icon
This is a line chart ppt powerpoint presentation gallery icon. This is a two stage process. The stages in this process are business, marketing, line, graph, success.
-
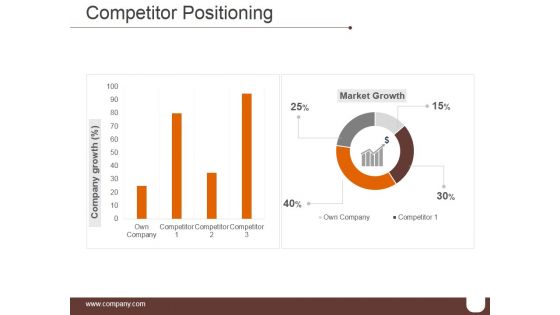
Competitor Positioning Ppt PowerPoint Presentation Visuals
This is a competitor positioning ppt powerpoint presentation visuals. This is a two stage process. The stages in this process are market growth, competitor, planning, strategy.
-
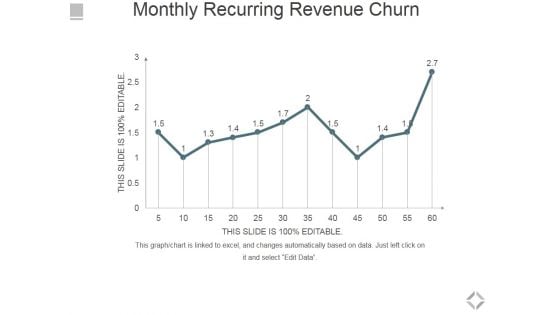
Monthly Recurring Revenue Churn Ppt PowerPoint Presentation Infographics Microsoft
This is a monthly recurring revenue churn ppt powerpoint presentation infographics microsoft. This is a one stage process. The stages in this process are bar graph, business, marketing, success, growth.
-
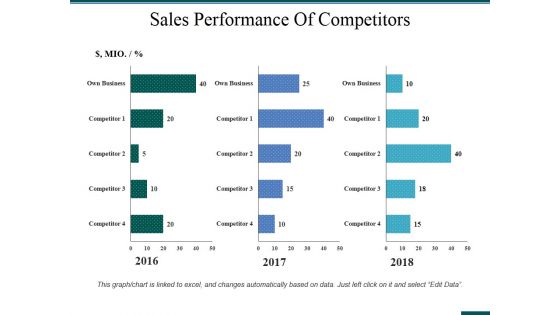
Sales Performance Of Competitors Ppt PowerPoint Presentation Portfolio Summary
This is a sales performance of competitors ppt powerpoint presentation portfolio summary. This is a three stage process. The stages in this process are business, management, sales, finance, analysis.
-
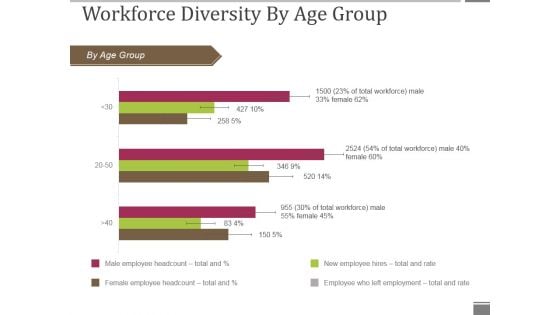
Workforce Diversity By Age Group Ppt PowerPoint Presentation Visual Aids Gallery
This is a workforce diversity by age group ppt powerpoint presentation visual aids gallery. This is a three stage process. The stages in this process are by age group, bar graph, business, marketing, presentation.
-
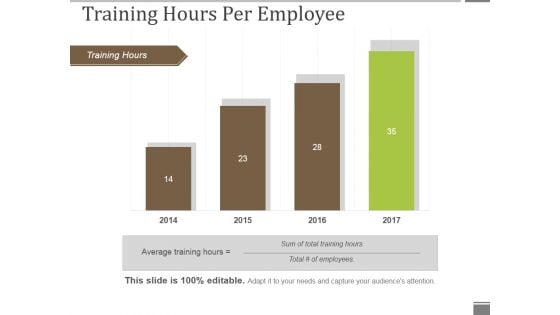
Training Hours Per Employee Ppt PowerPoint Presentation Professional Templates
This is a training hours per employee ppt powerpoint presentation professional templates. This is a four stage process. The stages in this process are training hours, years, planning, business, marketing.
-
Sales Budget Vs Actual Ppt PowerPoint Presentation Show Master Slide
This is a sales budget vs actual ppt powerpoint presentation show master slide. This is a two stage process. The stages in this process are business, finance, management, analysis, budget, actual.
-
Sales Activities Dashboard Ppt PowerPoint Presentation Icon Graphics
This is a sales activities dashboard ppt powerpoint presentation icon graphics. This is a two stage process. The stages in this process are business, finance, management, analysis, budget, actual.
-
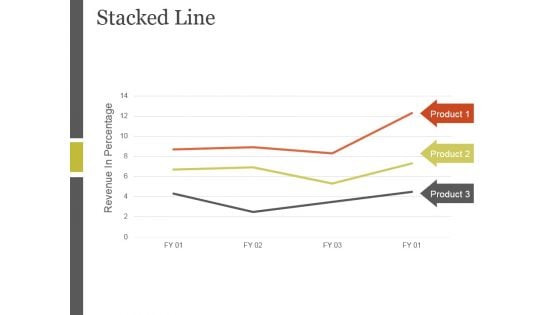
Stacked Line Ppt PowerPoint Presentation Inspiration
This is a stacked line ppt powerpoint presentation inspiration. This is a three stage process. The stages in this process are revenue in percentage, stacked line, product.
-
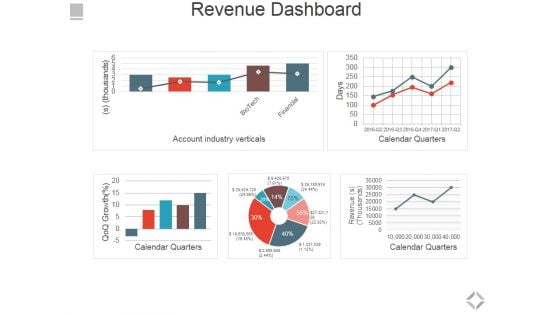
Revenue Dashboard Ppt PowerPoint Presentation Summary Brochure
This is a revenue dashboard ppt powerpoint presentation summary brochure. This is a five stage process. The stages in this process are account industry verticals, calendar quarters.
-
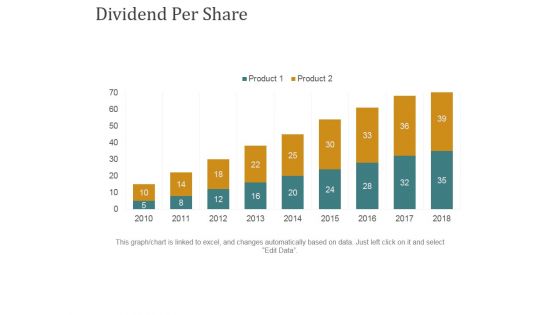
Dividend Per Share Ppt PowerPoint Presentation Summary Rules
This is a dividend per share ppt powerpoint presentation summary rules. This is a nine stage process. The stages in this process are business, bar graph, finance, marketing, strategy, growth.
-
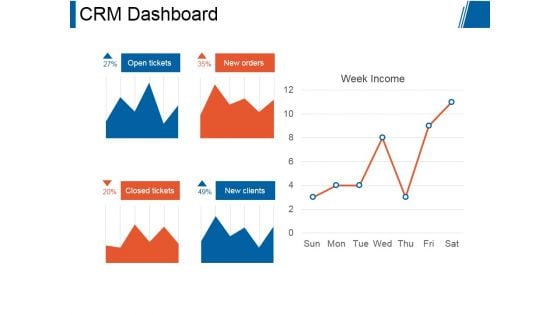
Crm Dashboard Ppt PowerPoint Presentation Good
This is a crm dashboard ppt powerpoint presentation good. This is a five stage process. The stages in this process are open tickets, new orders, closed tickets, new clients, week income.
-
Staff Acquisition Cost Cost Per Hire Ppt PowerPoint Presentation Styles Guidelines
This is a staff acquisition cost cost per hire ppt powerpoint presentation styles guidelines. This is a seven stage process. The stages in this process are cost per hire, bar graph, business, marketing, planning.
-
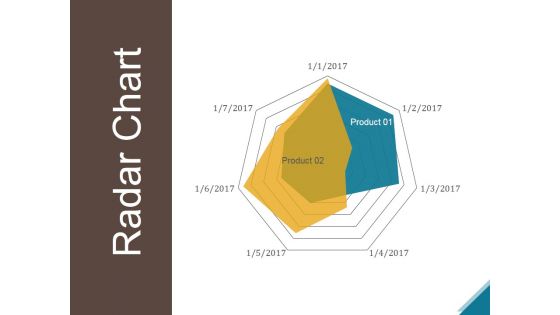
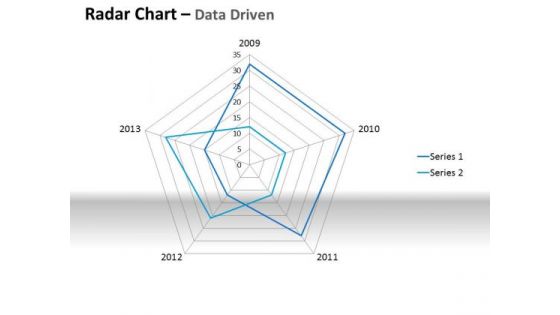
Radar Chart Ppt PowerPoint Presentation Ideas
This is a radar chart ppt powerpoint presentation ideas. This is a two stage process. The stages in this process are business, success, strategy, marketing, radar chart.
-
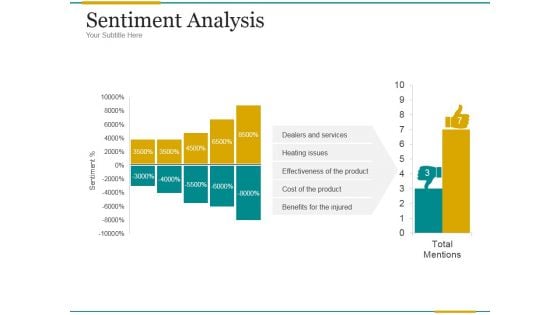
Sentiment Analysis Ppt PowerPoint Presentation Example File
This is a sentiment analysis ppt powerpoint presentation example file. This is a two stage process. The stages in this process are dealers and services, heating issues, effectiveness of the product, cost of the product, benefits for the injured.
-
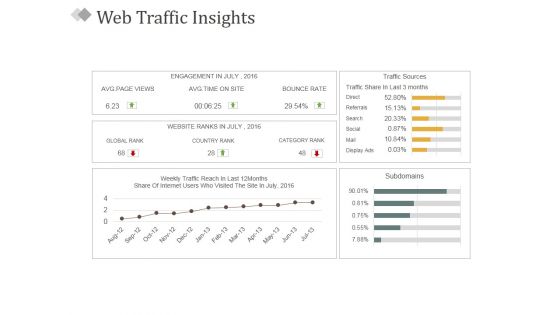
Web Traffic Insights Ppt PowerPoint Presentation Pictures Slides
This is a web traffic insights ppt powerpoint presentation pictures slides. This is a five stage process. The stages in this process are engagement in july, avg page views, global rank, country rank, category rank, bounce rate.
-
Puzzle Ppt PowerPoint Presentation Professional Brochure
This is a puzzle ppt powerpoint presentation professional brochure. This is a five stage process. The stages in this process are business, puzzle, strategy, management, icon.
-
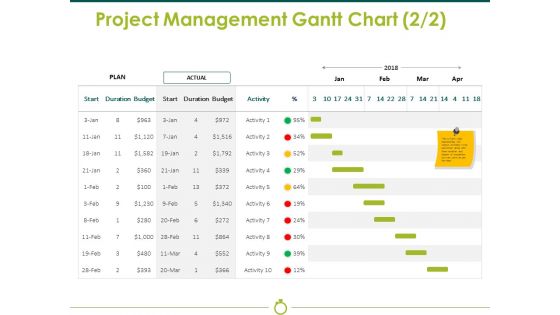
Project Management Gantt Chart Template 2 Ppt PowerPoint Presentation Show Styles
This is a project management gantt chart template 2 ppt powerpoint presentation show styles. This is a two stage process. The stages in this process are plan, actual, budget, duration, start.
-
Bar Chart Ppt PowerPoint Presentation Icon Information
This is a bar chart ppt powerpoint presentation icon information. This is a one stage process. The stages in this process are product, sales in percentage, financial years, bar graph, growth.
-
Budgeting Planned Actual Comparison Ppt PowerPoint Presentation Gallery Graphic Tips
This is a budgeting planned actual comparison ppt powerpoint presentation gallery graphic tips. This is a three stage process. The stages in this process are planned cost, actual cost, value difference.
-
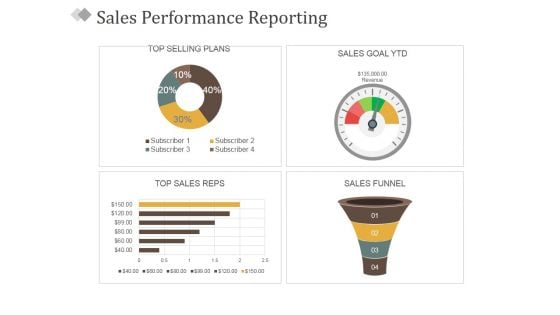
Sales Performance Reporting Ppt PowerPoint Presentation Ideas Aids
This is a sales performance reporting ppt powerpoint presentation ideas aids. This is a four stage process. The stages in this process are top selling plans, sales goal ytd, top sales reps, sales funnel.
-
Line Chart Ppt PowerPoint Presentation Icon Elements
This is a line chart ppt powerpoint presentation icon elements. This is a two stage process. The stages in this process are line graph, marketing, presentation, business, management.
-
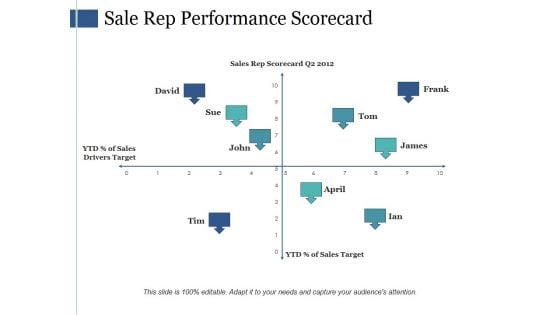
Sale Rep Performance Scorecard Ppt PowerPoint Presentation Pictures Background
This is a sale rep performance scorecard ppt powerpoint presentation pictures background. This is a four stage process. The stages in this process are david, sue, john, tim, frank.
-
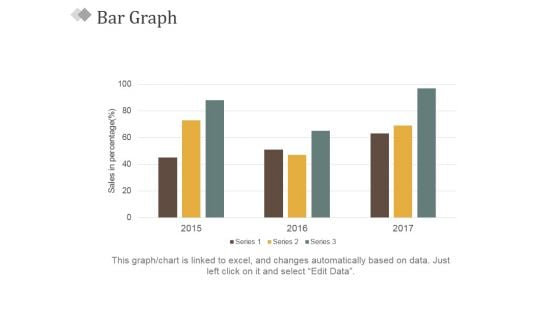
Bar Graph Ppt PowerPoint Presentation Slides Visual Aids
This is a bar graph ppt powerpoint presentation slides visual aids. This is a three stage process. The stages in this process are sales in percentage, bar graph, business, marketing, success.
-
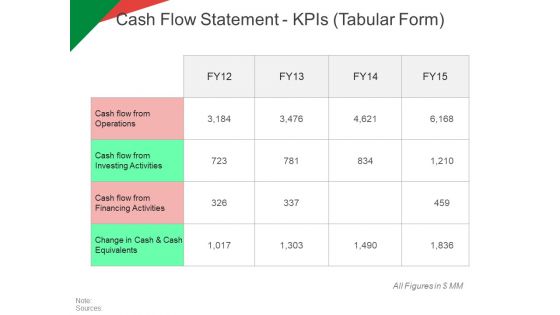
Cash Flow Statement Kpis Tabular Form Ppt PowerPoint Presentation Model Graphic Tips
This is a cash flow statement kpis tabular form ppt powerpoint presentation model graphic tips. This is a four stage process. The stages in this process are operations, investing activities, net increase in cash, financing activities.
-
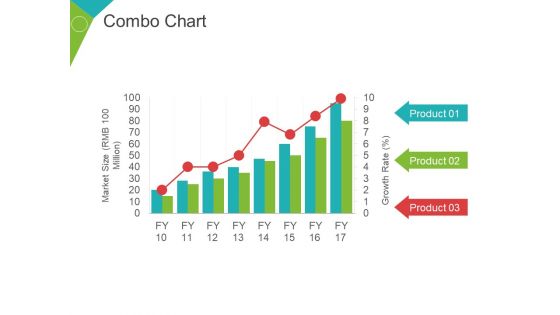
Combo Chart Ppt PowerPoint Presentation Infographic Template Graphic Images
This is a combo chart ppt powerpoint presentation infographic template graphic images. This is a three stage process. The stages in this process are market size, growth rate, percentage, business, marketing.
-
Revenue Cost Per Employee Comparison Ppt PowerPoint Presentation Icon Graphics Tutorials
This is a revenue cost per employee comparison ppt powerpoint presentation icon graphics tutorials. This is a two stage process. The stages in this process are revenue and cost per employee comparison, line chart, business, marketing, success,
-
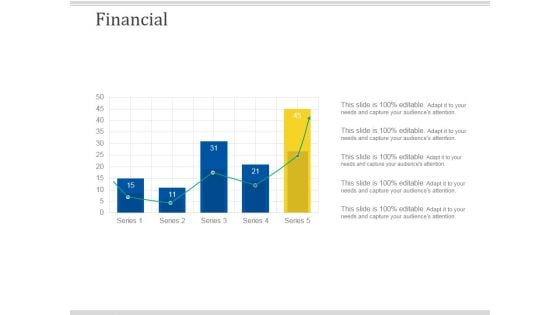
Financial Ppt PowerPoint Presentation File Infographic Template
This is a financial ppt powerpoint presentation file infographic template. This is a five stage process. The stages in this process are financial, business, marketing, presentation, success.
-
Employee Turnover Ppt PowerPoint Presentation Gallery Icons
This is a employee turnover ppt powerpoint presentation gallery icons. This is a one stage process. The stages in this process are turnover, rate, number of employee separations during the year, total number of employees during the year.
-
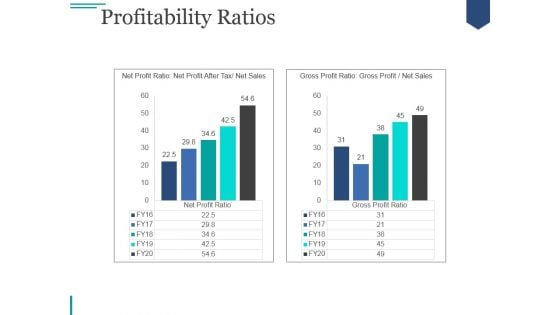
Profitability Ratios Ppt PowerPoint Presentation Infographic Template
This is a profitability ratios ppt powerpoint presentation infographic template. This is a two stage process. The stages in this process are graph, business, marketing, strategy, growth.
-
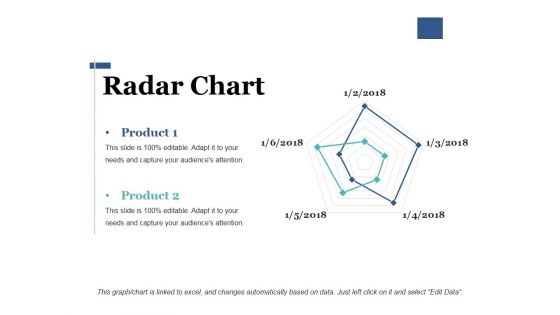
Radar Chart Ppt PowerPoint Presentation Portfolio Elements
This is a radar chart ppt powerpoint presentation portfolio elements. This is a five stage process. The stages in this process are business, strategy, marketing, finance, planning.
-
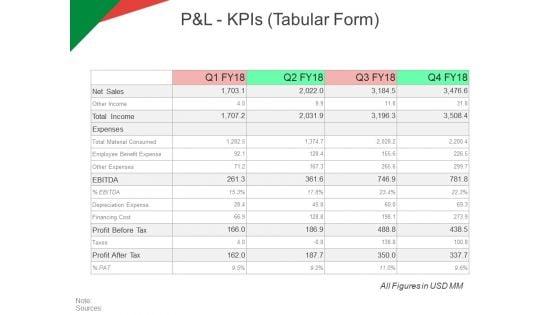
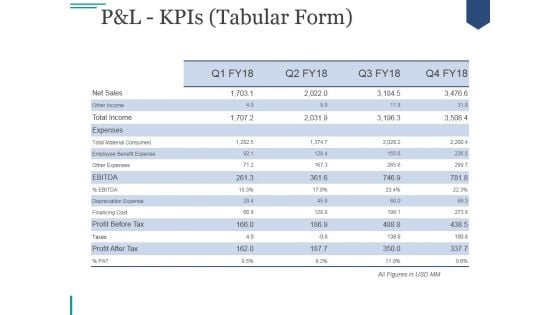
P And L Kpis Tabular Form Ppt PowerPoint Presentation Model Ideas
This is a p and l kpis tabular form ppt powerpoint presentation model ideas. This is a four stage process. The stages in this process are revenue, operating profit, cogs, net profit.
-
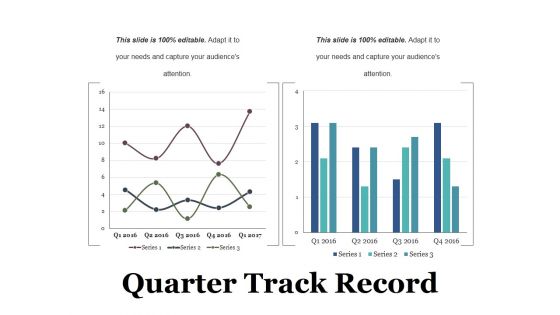
Quarter Track Record Ppt PowerPoint Presentation Styles Master Slide
This is a quarter track record ppt powerpoint presentation styles master slide. This is a two stage process. The stages in this process are business, graph, marketing, finance, planning.
-
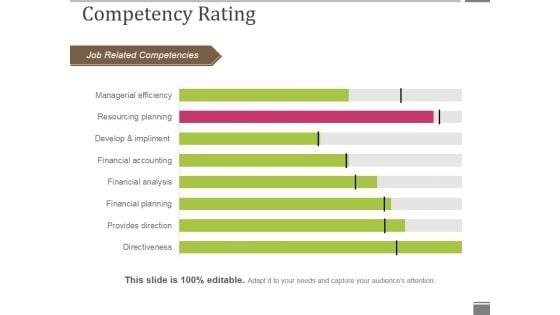
Competency Rating Template 1 Ppt PowerPoint Presentation Outline Smartart
This is a competency rating template 1 ppt powerpoint presentation outline smartart. This is a eight stage process. The stages in this process are job related competencies, competency rating, bar graph, business, marketing.
-
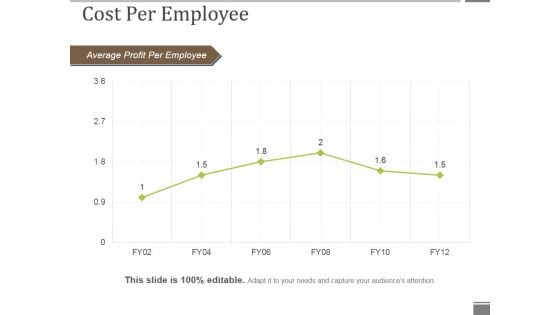
Cost Per Employee Ppt PowerPoint Presentation Model Graphics Download
This is a cost per employee ppt powerpoint presentation model graphics download. This is a six stage process. The stages in this process are average profit per employee, line chart, business, marketing, management.
-
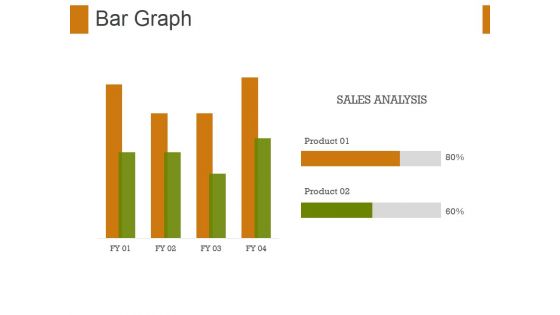
Bar Graph Ppt PowerPoint Presentation File Graphic Tips
This is a bar graph ppt powerpoint presentation file graphic tips. This is a two stage process. The stages in this process are bar graph, finance, marketing, strategy, sales, business.
-
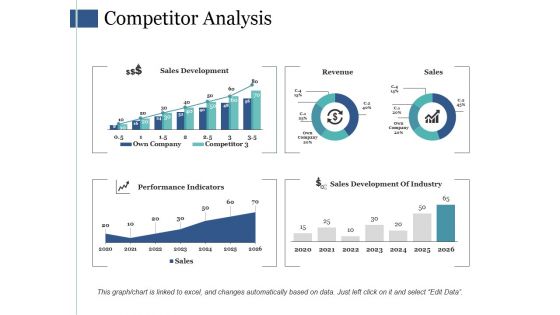
Competitor Analysis Ppt PowerPoint Presentation Slides Visuals
This is a competitor analysis ppt powerpoint presentation slides visuals. This is a four stage process. The stages in this process are sales development, revenue, sales, performance, indicators.
-
Pandl Kpis Tabular Form Ppt PowerPoint Presentation Visual Aids
This is a pandl kpis tabular form ppt powerpoint presentation visual aids. This is a four stage process. The stages in this process are revenue, cogs, operating profit, net profit.
-
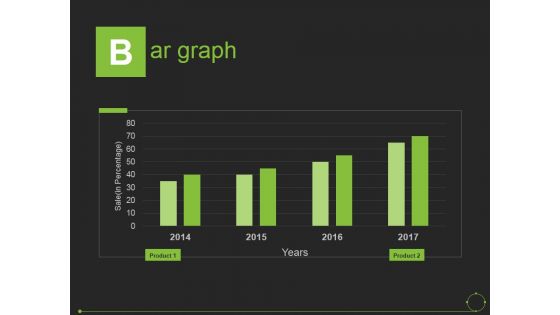
Bar Graph Ppt PowerPoint Presentation Portfolio Background
This is a bar graph ppt powerpoint presentation portfolio background. This is a four stage process. The stages in this process are sale, years, product.
-
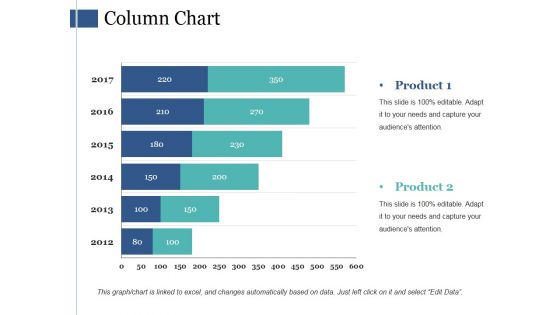
Column Chart Ppt PowerPoint Presentation Model Background Images
This is a column chart ppt powerpoint presentation model background images. This is a six stage process. The stages in this process are bar graph, marketing, finance, strategy, planning.
-
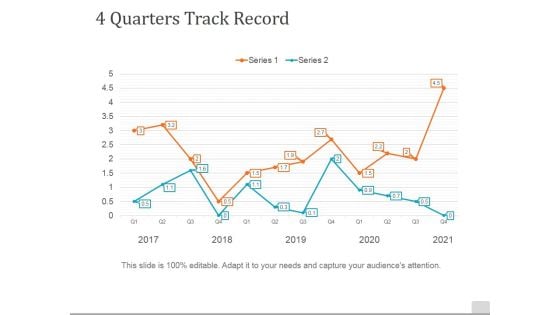
4 Quarters Track Record Template 1 Ppt PowerPoint Presentation Slides Example
This is a 4 quarters track record template 1 ppt powerpoint presentation slides example. This is a two stage process. The stages in this process are management, business, marketing, graph, line chart.
-
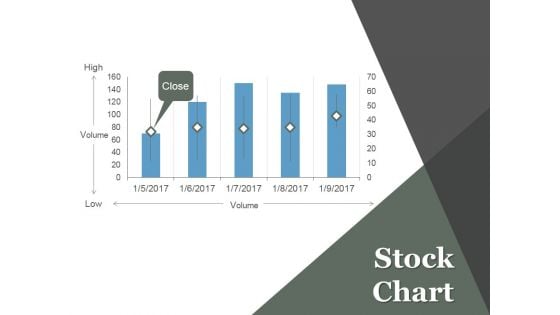
Stock Chart Ppt PowerPoint Presentation Information
This is a stock chart ppt powerpoint presentation information. This is a five stage process. The stages in this process are projects, marketing, high, volume, low.
-
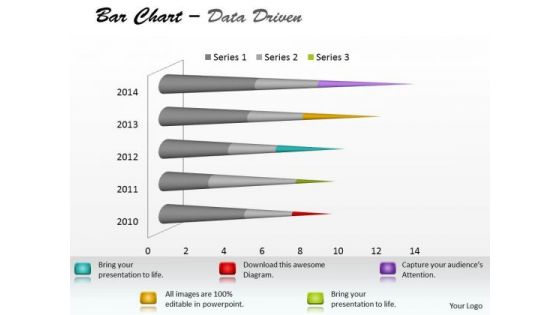
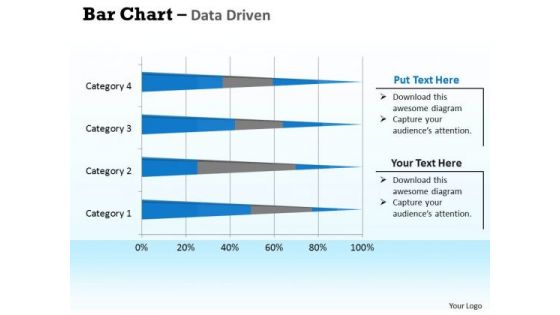
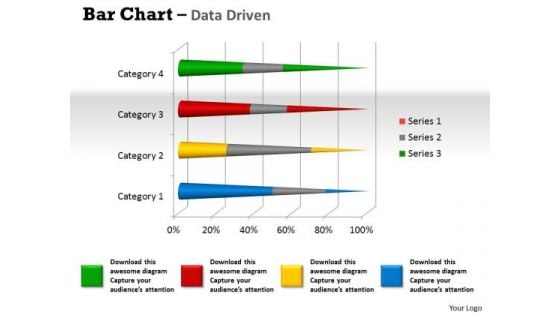
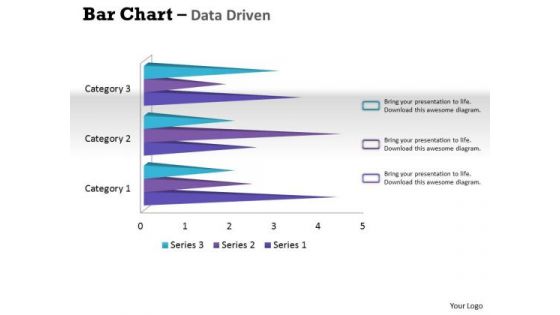
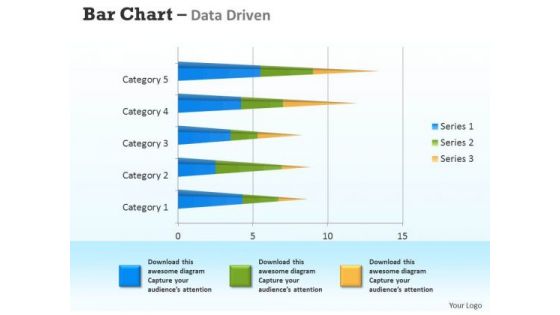
Microsoft Excel Data Analysis Bar Chart To Communicate Information PowerPoint Templates
With Our microsoft excel data analysis bar chart to communicate information Powerpoint Templates You Will Be Doubly Sure. They Possess That Stamp Of Authority.
-
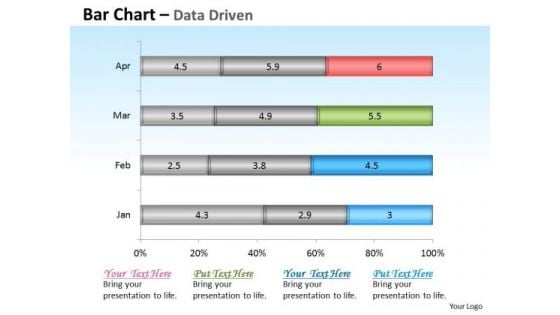
Data Analysis Bar Chart For Foreign Trade PowerPoint Templates
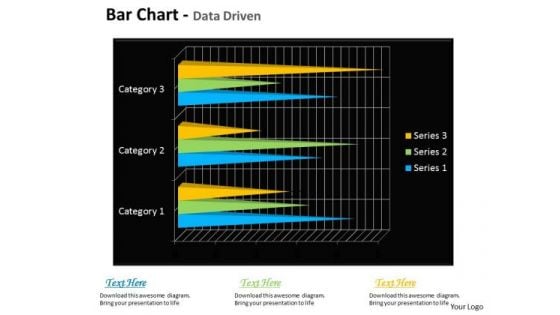
Be The Doer With Our data analysis bar chart for foreign trade Powerpoint Templates. Put Your Thoughts Into Practice.
-
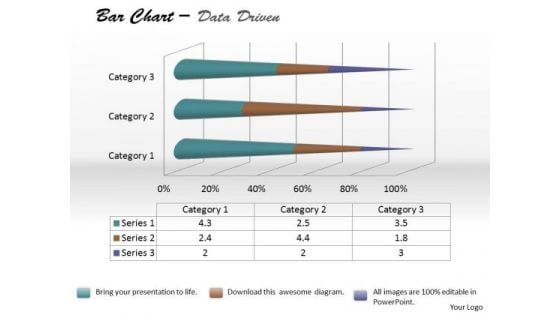
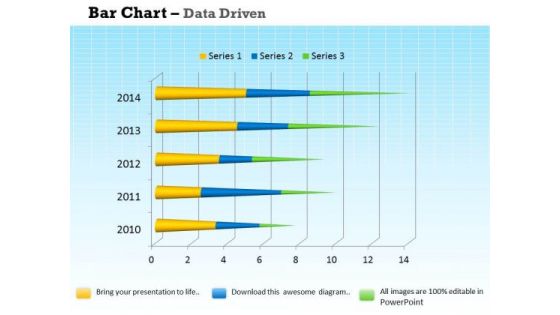
Data Analysis In Excel 3d Bar Chart For Interpretation PowerPoint Templates
Double Up Our data analysis in excel 3d bar chart for interpretation Powerpoint Templates With Your Thoughts. They Will Make An Awesome Pair.
-
Financial Data Analysis Driven Base Bar Chart Design PowerPoint Slides Templates
Get The Domestics Right With Our financial data analysis driven base bar chart design powerpoint slides Templates . Create The Base For Thoughts To Grow.
-
Data Analysis Programs 3d Bar Chart For Market Surveys PowerPoint Templates
Draw On The Experience Of Our data analysis programs 3d bar chart for market surveys Powerpoint Templates . They Imbibe From Past Masters.
-
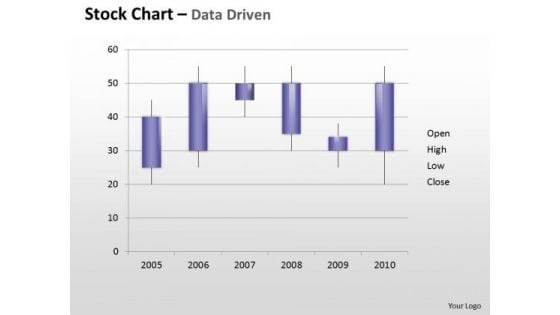
Data Analysis On Excel Driven Stock Chart For Business Growth PowerPoint Slides Templates
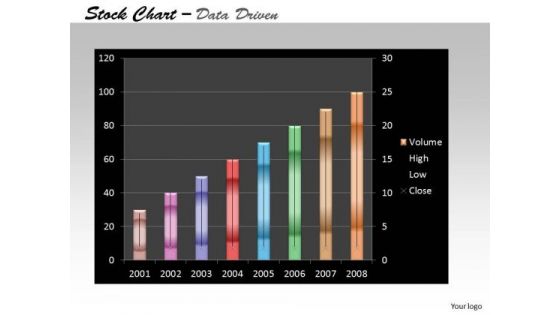
Add Some Dramatization To Your Thoughts. Our data analysis on excel driven stock chart for business growth powerpoint slides Templates Make Useful Props.
-
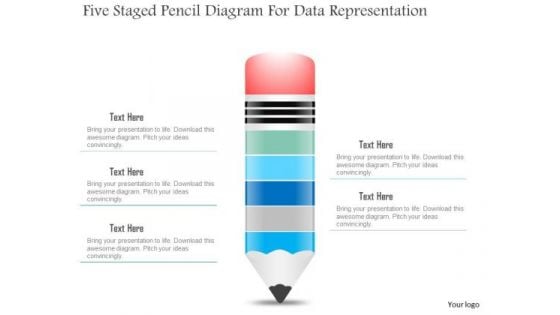
Business Diagram Five Staged Pencil Diagram For Data Representation PowerPoint Slide
This business slide displays five staged pencil diagram. It contains pencil graphic divided into five parts. This diagram slide depicts processes, stages, steps, points, options and education information display. Use this diagram, in your presentations to express your views innovatively.
-
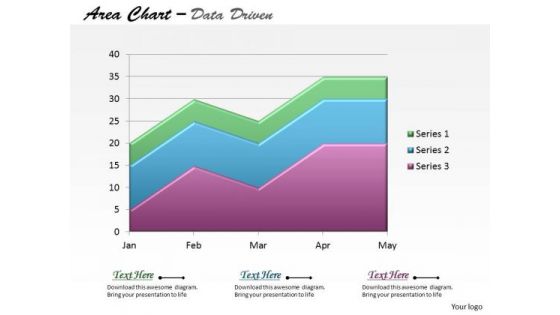
Data Analysis On Excel Driven Stacked Area Chart PowerPoint Slides Templates
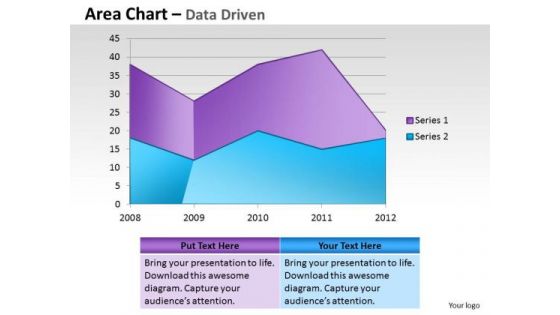
Be The Dramatist With Our data analysis on excel driven stacked area chart powerpoint slides Templates . Script Out The Play Of Words.
-
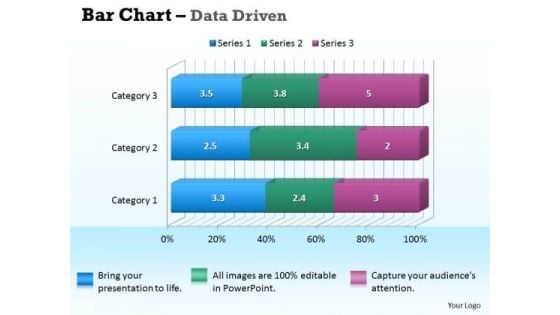
Data Analysis In Excel 3d Bar Chart For Business Information PowerPoint Templates
Our data analysis in excel 3d bar chart for business information Powerpoint Templates Deliver At Your Doorstep. Let Them In For A Wonderful Experience.
-
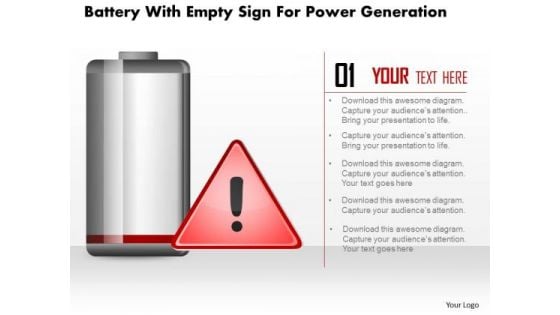
Business Diagram Battery With Empty Sign For Power Generation PowerPoint Slide
This business diagram displays empty sign alert on battery icon. Use this diagram, in your presentations to display energy saving, battery and technology. Create professional presentations using this diagram slide.
-
Financial Data Analysis Area Chart For Showing Trends PowerPoint Templates
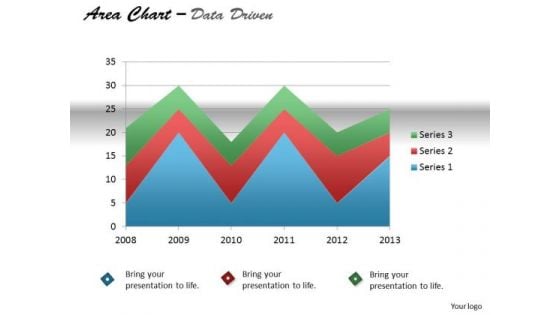
Document Your Views On Our financial data analysis area chart for showing trends Powerpoint Templates . They Will Create A Strong Impression.
-
Quantitative Data Analysis Bar Chart For Financial Markets PowerPoint Templates
Draft It Out On Our quantitative data analysis bar chart for financial markets Powerpoint Templates . Give The Final Touches With Your Ideas.
-
Excel Data Analysis Data Tools Data Methods Statistical Tool Survey Chart PowerPoint Templates
Analyze Ailments On Our excel data analysis data tools data methods statistical tool survey chart Powerpoint Templates . Bring Out The Thinking Doctor In You. Dock Your Thoughts With Our Excel Data Analysis . They Will Launch Them Into Orbit.
-
Quantitative Data Analysis Driven Display Series With Area Chart PowerPoint Slides Templates
Our quantitative data analysis driven display series with area chart powerpoint slides Templates Enjoy Drama. They Provide Entertaining Backdrops.
-
Data Analysis Programs 3d Bar Chart To Dispaly PowerPoint Templates
Lower The Drawbridge With Our data analysis programs 3d bar chart to dispaly Powerpoint Templates . Capture The Minds Of Your Audience.
-
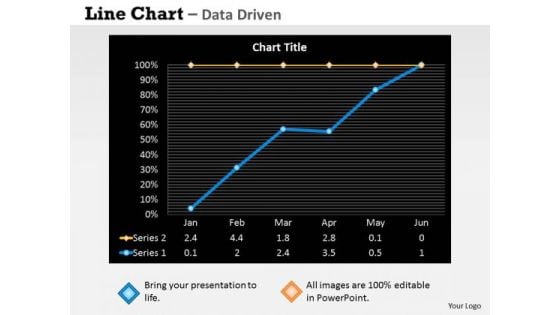
Quantitative Data Analysis Driven Economic Status Line Chart PowerPoint Slides Templates
Be The Dramatist With Our quantitative data analysis driven economic status line chart powerpoint slides Templates . Script Out The Play Of Words.
-
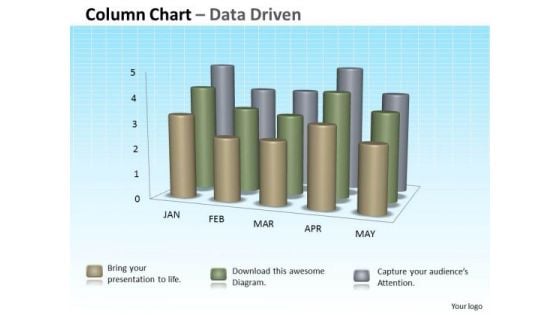
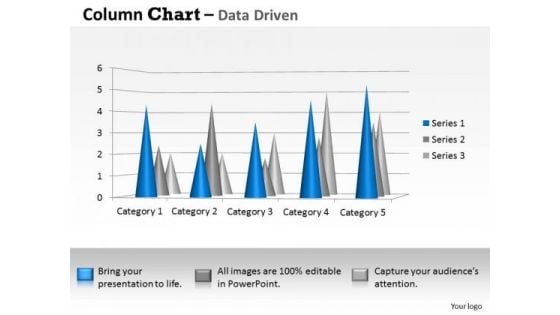
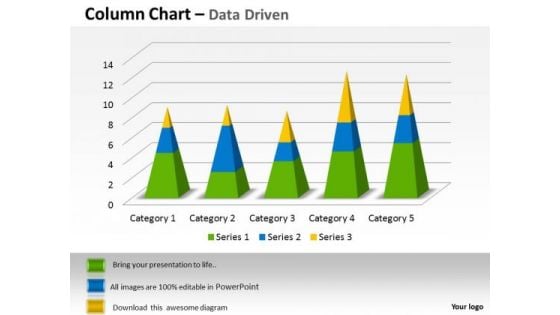
Data Analysis In Excel 3d Column Chart For Sets Of Information PowerPoint Templates
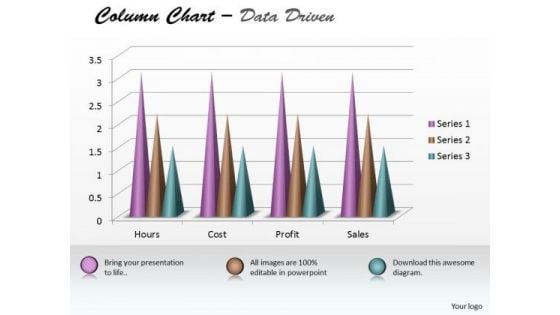
Double The Impact With Our data analysis in excel 3d column chart for sets of information Powerpoint Templates . Your Thoughts Will Have An Imposing Effect.
-
Excel Data Analysis Data Tools Data Methods Statistical Survey Driven PowerPoint Slides Templates
Ask For Assistance From Our excel data analysis data tools data methods statistical survey driven powerpoint slides Templates . You Will Be Duly Satisfied.
-
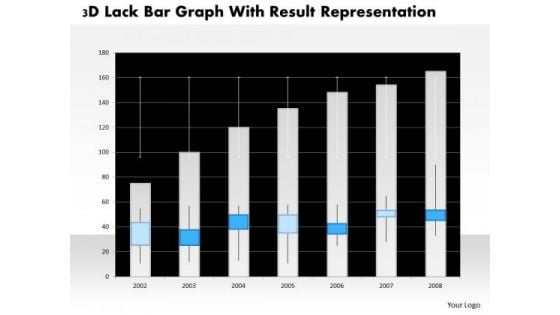
Business Diagram 3d Lack Bar Graph With Result Representation PowerPoint Slide
This business diagram has graphic of 3d lack bar graph. This diagram is a data visualization tool that gives you a simple way to present statistical information. This slide helps your audience examine and interpret the data you present.
-
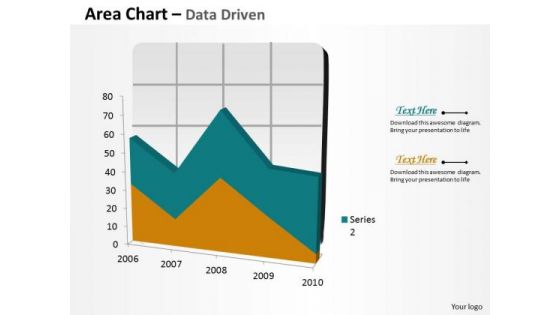
Data Analysis In Excel Area Chart For Business Process PowerPoint Templates
Your Grasp Of Economics Is Well Known. Help Your Audience Comprehend Issues With Our data analysis in excel area chart for business process Powerpoint Templates .
-
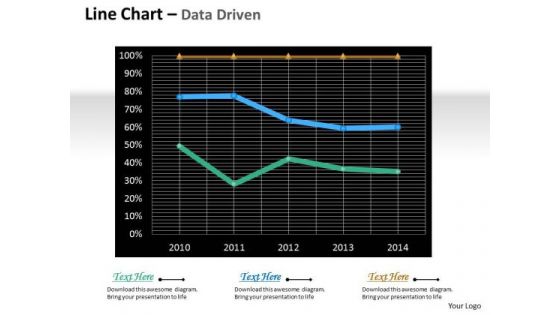
Multivariate Data Analysis Driven Line Chart For Market Survey PowerPoint Slides Templates
Rake In The Dough With
-
Data Analysis Techniques 3d Distribution Of In Sets PowerPoint Templates
Your Thoughts Will Be The Main Course. Provide The Dressing With Our data analysis techniques 3d distribution of in sets Powerpoint Templates .
-
Data Analysis Techniques 3d Bar Chart For Financial Solutions PowerPoint Templates
Make Your Dreams A Reality With Our data analysis techniques 3d bar chart for financial solutions Powerpoint Templates . Your Ideas Will Begin To Take Shape.
-
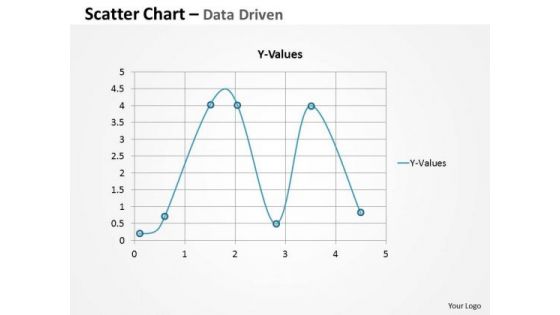
Examples Of Data Analysis Market Driven Plotting The Business Values PowerPoint Slides Templates
Ring The Duck With Our examples of data analysis market driven plotting the business values powerpoint slides Templates . Acquire The Points With Your Ideas.
-
Examples Of Data Analysis Market 3d Categories Sets PowerPoint Templates
Our examples of data analysis market 3d categories sets Powerpoint Templates Give Your Thoughts Their Due. They Project Them With Full Intensity.
-
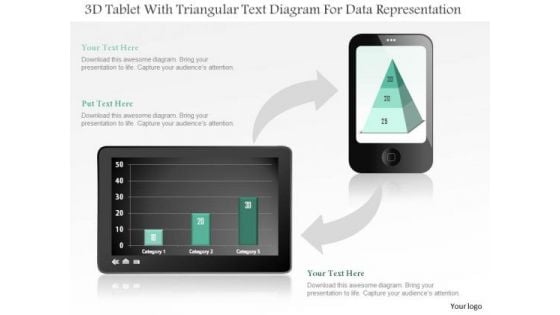
Business Diagram 3d Tablet With Triangular Text Diagram For Data Representation PowerPoint Slide
This business diagram displays bar graph on tablet and pyramid chart on mobile phone. Use this diagram, to make reports for interactive business presentations. Create professional presentations using this diagram.
-
Microsoft Excel Data Analysis 3d Bar Chart For Analyzing Survey PowerPoint Templates
Connect The Dots With Our microsoft excel data analysis 3d bar chart for analyzing survey Powerpoint Templates . Watch The Whole Picture Clearly Emerge.
-
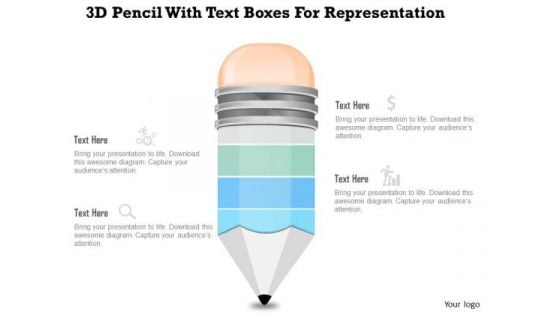
Business Diagram 3d Pencil With Text Boxes For Representation PowerPoint Slide
This Power Point diagram displays graphic of pencil with icons and text spaces. It contains diagram of colorful pencil for data display. Use this diagram to build professional presentations for your viewers.
-
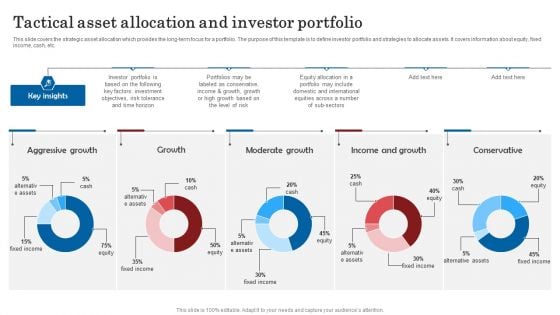
Tactical Asset Allocation And Investor Portfolio Guidelines PDF
This slide covers the strategic asset allocation which provides the long-term focus for a portfolio. The purpose of this template is to define investor portfolio and strategies to allocate assets. It covers information about equity, fixed income, cash, etc.Showcasing this set of slides titled Tactical Asset Allocation And Investor Portfolio Guidelines PDF. The topics addressed in these templates are Aggressive Growth, Moderate Growth, Alternative Assets. All the content presented in this PPT design is completely editable. Download it and make adjustments in color, background, font etc. as per your unique business setting.
-
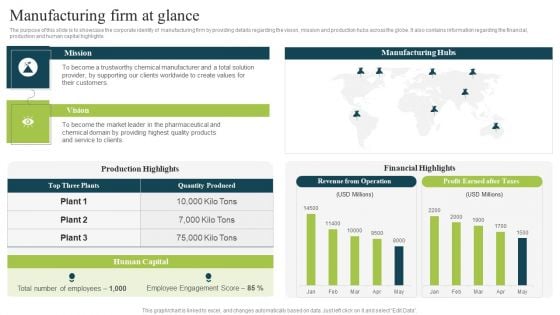
Plan To Enhance Manufacturing Manufacturing Firm At Glance Rules PDF
The purpose of this slide is to showcase the corporate identity of manufacturing firm by providing details regarding the vision, mission and production hubs across the globe. It also contains information regarding the financial, production and human capital highlights. There are so many reasons you need a Plan To Enhance Manufacturing Manufacturing Firm At Glance Rules PDF. The first reason is you cant spend time making everything from scratch, Thus, Slidegeeks has made presentation templates for you too. You can easily download these templates from our website easily.
-
PIM Software Solution Report Dashboard Mockup PDF
This slide covers the dashboard with active product information and performance report. It also includes product KPIs such as active products, missing products, items sold by category, and top 5 products. Pitch your topic with ease and precision using this PIM Software Solution Report Dashboard Mockup PDF. This layout presents information on Product Information, Product Performance, Missing Product Details. It is also available for immediate download and adjustment. So, changes can be made in the color, design, graphics or any other component to create a unique layout.
-
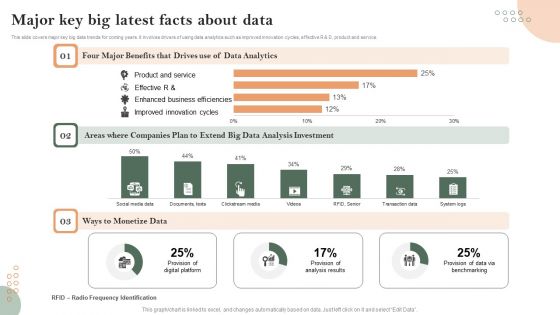
Major Key Big Latest Facts About Data Guidelines PDF
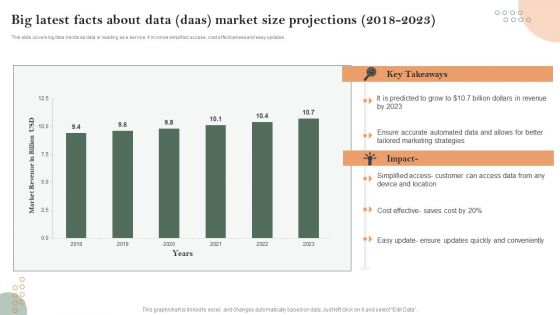
This slide covers major key big data trends for coming years. It involves drivers of using data analytics such as improved innovation cycles, effective R and D, product and service.
-
Sales Result Evaluation Between Company Different Product Microsoft PDF
This slide signifies outlining and executing strategies on sales result comparison using bar graph. It includes various plans that are being implemented by the company for increase product growth. Showcasing this set of slides titled Sales Result Evaluation Between Company Different Product Microsoft PDF. The topics addressed in these templates are Door Marketing, Provide Coupons Rewards, Increase Quality Product. All the content presented in this PPT design is completely editable. Download it and make adjustments in color, background, font etc. as per your unique business setting.
-
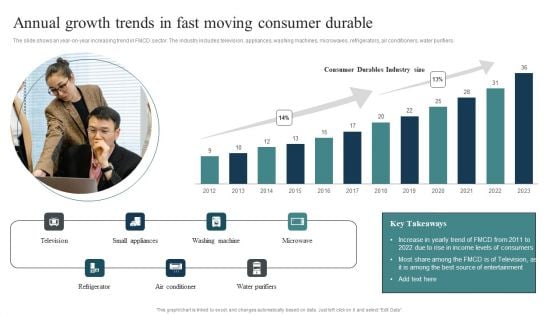
Annual Growth Trends In Fast Moving Consumer Durable Elements PDF
The slide shows an year-on-year increasing trend in FMCD sector. The industry includes television, appliances, washing machines, microwaves, refrigerators, air conditioners, water purifiers.Showcasing this set of slides titled Annual Growth Trends In Fast Moving Consumer Durable Elements PDF. The topics addressed in these templates are Washing Machine, Small Appliances, Refrigerator. All the content presented in this PPT design is completely editable. Download it and make adjustments in color, background, font etc. as per your unique business setting.
-
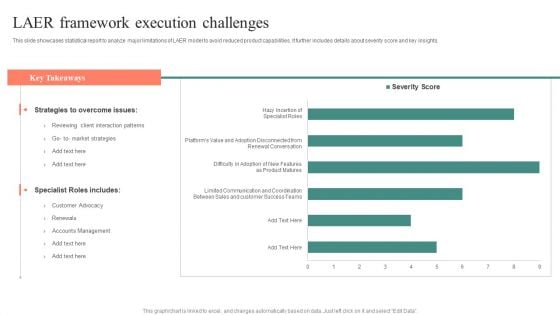
LAER Framework Execution Challenges Brochure PDF
This slide showcases statistical report to analyze major limitations of LAER model to avoid reduced product capabilities. It further includes details about severity score and key insights. Showcasing this set of slides titled LAER Framework Execution Challenges Brochure PDF. The topics addressed in these templates are Strategies To Overcome Issues, Specialist Roles Includes, Accounts Management. All the content presented in this PPT design is completely editable. Download it and make adjustments in color, background, font etc. as per your unique business setting.
-
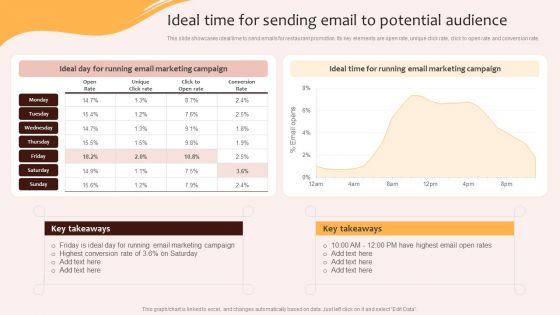
Digital Marketing Plan For Restaurant Business Ideal Time For Sending Email To Potential Audience Portrait PDF
This slide showcases ideal time to send emails for restaurant promotion. Its key elements are open rate, unique click rate, click to open rate and conversion rate.Retrieve professionally designed Digital Marketing Plan For Restaurant Business Ideal Time For Sending Email To Potential Audience Portrait PDF to effectively convey your message and captivate your listeners. Save time by selecting pre-made slideshows that are appropriate for various topics, from business to educational purposes. These themes come in many different styles, from creative to corporate, and all of them are easily adjustable and can be edited quickly. Access them as PowerPoint templates or as Google Slides themes. You Do not have to go on a hunt for the perfect presentation because Slidegeeks got you covered from everywhere.
-
Dashboard For Cash Flow And Financial KPI Ratio Icons PDF
Showcasing this set of slides titled Dashboard For Cash Flow And Financial KPI Ratio Icons PDF. The topics addressed in these templates are Days Sales Outstanding, Days Payable Outstanding, Return On Assets. All the content presented in this PPT design is completely editable. Download it and make adjustments in color, background, font etc. as per your unique business setting.
-
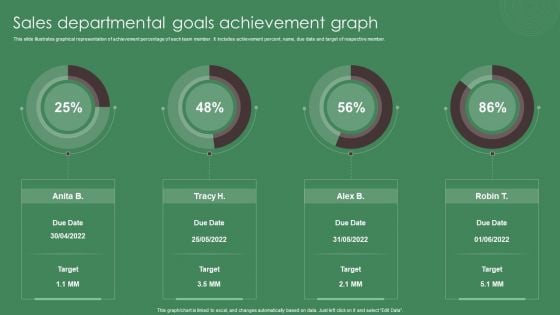
Sales Departmental Goals Achievement Graph Ppt Inspiration Slide Download PDF
This slide illustrates graphical representation of achievement percentage of each team member. It includes achievement percent, name, due date and target of respective member. Pitch your topic with ease and precision using this Sales Departmental Goals Achievement Graph Ppt Inspiration Slide Download PDF. This layout presents information on Sales Departmental, Goals, Achievement Graph. It is also available for immediate download and adjustment. So, changes can be made in the color, design, graphics or any other component to create a unique layout.
-
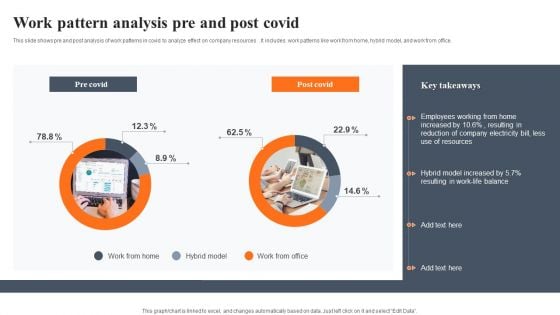
Work Pattern Analysis Pre And Post Covid Pictures PDF
This slide shows pre and post analysis of work patterns in covid to analyze effect on company resources . It includes work patterns like work from home, hybrid model, and work from office. Pitch your topic with ease and precision using this Work Pattern Analysis Pre And Post Covid Pictures PDF. This layout presents information on Work Pattern Analysis, Pre And Post Covid. It is also available for immediate download and adjustment. So, changes can be made in the color, design, graphics or any other component to create a unique layout.
-
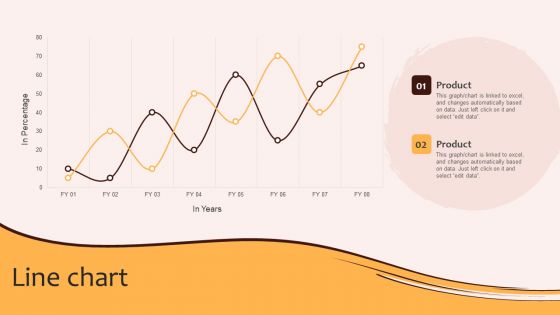
Line Chart Digital Marketing Plan For Restaurant Business Template PDF
Are you searching for a Line Chart Digital Marketing Plan For Restaurant Business Template PDF that is uncluttered, straightforward, and original Its easy to edit, and you can change the colors to suit your personal or business branding. For a presentation that expresses how much effort you have put in, this template is ideal With all of its features, including tables, diagrams, statistics, and lists, its perfect for a business plan presentation. Make your ideas more appealing with these professional slides. Download Line Chart Digital Marketing Plan For Restaurant Business Template PDF from Slidegeeks today.
-
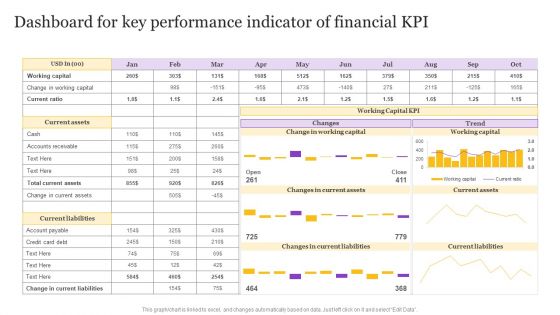
Dashboard For Key Performance Indicator Of Financial KPI Background PDF
Pitch your topic with ease and precision using this Dashboard For Key Performance Indicator Of Financial KPI Background PDF. This layout presents information on Dashboard For Key, Performance Indicator, Financial KPI. It is also available for immediate download and adjustment. So, changes can be made in the color, design, graphics or any other component to create a unique layout.
-
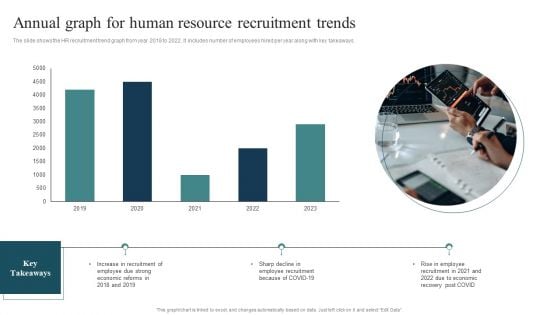
Annual Graph For Human Resource Recruitment Trends Summary PDF
The slide shows the HR recruitment trend graph from year 2018 to 2022. It includes number of employees hired per year along with key takeaways. Pitch your topic with ease and precision using this Annual Graph For Human Resource Recruitment Trends Summary PDF. This layout presents information on Employee Recruitment, Rise Employee, Economic Reforms. It is also available for immediate download and adjustment. So, changes can be made in the color, design, graphics or any other component to create a unique layout.
-
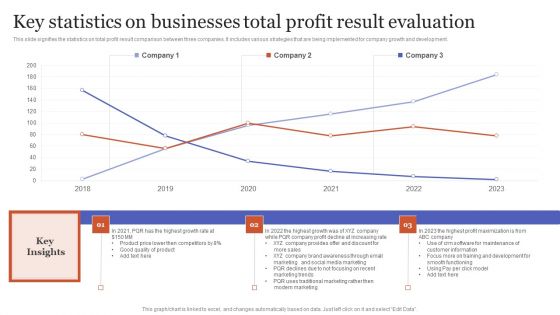
Key Statistics On Businesses Total Profit Result Evaluation Rules PDF
This slide signifies the statistics on total profit result comparison between three companies. It includes various strategies that are being implemented for company growth and development.Pitch your topic with ease and precision using this Key Statistics On Businesses Total Profit Result Evaluation Rules PDF. This layout presents information on Traditional Marketing, Modern Marketing, Training Development. It is also available for immediate download and adjustment. So, changes can be made in the color, design, graphics or any other component to create a unique layout.
-
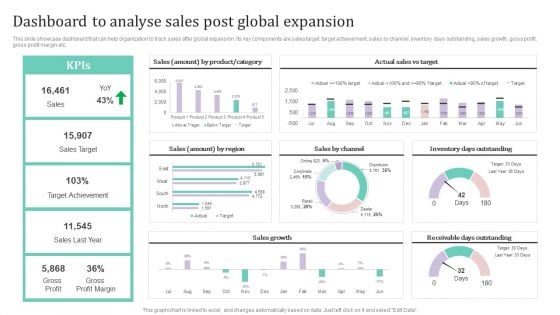
Dashboard To Analyse Sales Post Global Expansion Ppt PowerPoint Presentation File Styles PDF
This slide showcase dashboard that can help organization to track sales after global expansion. Its key components are sales target, target achievement, sales by channel, inventory days outstanding, sales growth, gross profit, gross profit margin etc.This Dashboard To Analyse Sales Post Global Expansion Ppt PowerPoint Presentation File Styles PDF from Slidegeeks makes it easy to present information on your topic with precision. It provides customization options, so you can make changes to the colors, design, graphics, or any other component to create a unique layout. It is also available for immediate download, so you can begin using it right away. Slidegeeks has done good research to ensure that you have everything you need to make your presentation stand out. Make a name out there for a brilliant performance.
-
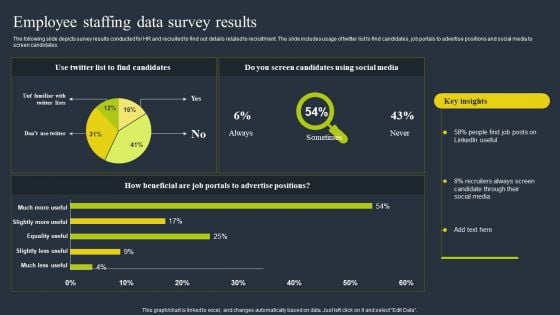
Employee Staffing Data Survey Results Mockup PDF
The following slide depicts survey results conducted for HR and recruited to find out details related to recruitment. The slide includes usage of twitter list to find candidates, job portals to advertise positions and social media to screen candidates. Showcasing this set of slides titled Employee Staffing Data Survey Results Mockup PDF. The topics addressed in these templates are Social Media, Recruiters, Advertise. All the content presented in this PPT design is completely editable. Download it and make adjustments in color, background, font etc. as per your unique business setting.
-
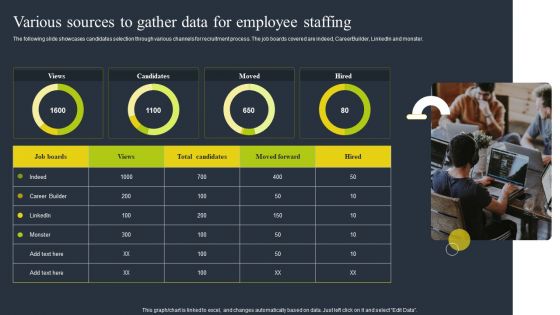
Various Sources To Gather Data For Employee Staffing Slides PDF
The following slide showcases candidates selection through various channels for recruitment process. The job boards covered are indeed, CareerBuilder, LinkedIn and monster. Showcasing this set of slides titled Various Sources To Gather Data For Employee Staffing Slides PDF. The topics addressed in these templates are Various Sources, Gather Data, Employee Staffing. All the content presented in this PPT design is completely editable. Download it and make adjustments in color, background, font etc. as per your unique business setting.
-
New Commodity Development Assessment Metrics Icons PDF
The following slide highlights the key metrics to evaluate product performance. It includes elements such as product wise revenue, time to the market etc.Pitch your topic with ease and precision using this New Commodity Development Assessment Metrics Icons PDF. This layout presents information on Annual Product, Wise Revenue, Shown Continuous. It is also available for immediate download and adjustment. So, changes can be made in the color, design, graphics or any other component to create a unique layout.
-
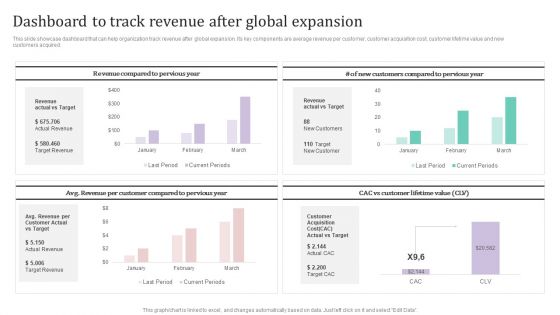
Dashboard To Track Revenue After Global Expansion Ppt PowerPoint Presentation File Example PDF
This slide showcase dashboard that can help organization track revenue after global expansion. Its key components are average revenue per customer, customer acquisition cost, customer lifetime value and new customers acquired.Take your projects to the next level with our ultimate collection of Dashboard To Track Revenue After Global Expansion Ppt PowerPoint Presentation File Example PDF. Slidegeeks has designed a range of layouts that are perfect for representing task or activity duration, keeping track of all your deadlines at a glance. Tailor these designs to your exact needs and give them a truly corporate look with your own brand colors they all make your projects stand out from the rest.
-
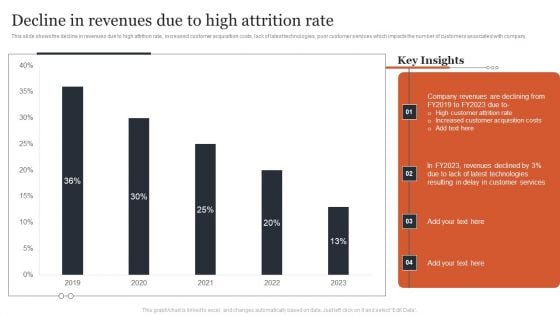
Managing Customer Attrition Decline In Revenues Due To High Attrition Rate Summary PDF
This slide shows the decline in revenues due to high attrition rate, increased customer acquisition costs, lack of latest technologies, poor customer services which impacts the number of customers associated with company. From laying roadmaps to briefing everything in detail, our templates are perfect for you. You can set the stage with your presentation slides. All you have to do is download these easy-to-edit and customizable templates. Managing Customer Attrition Decline In Revenues Due To High Attrition Rate Summary PDF will help you deliver an outstanding performance that everyone would remember and praise you for. Do download this presentation today.
-
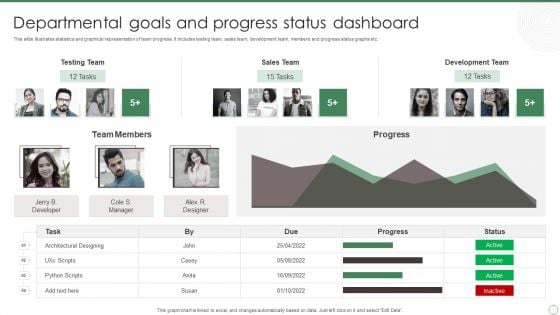
Departmental Goals And Progress Status Dashboard Ppt Portfolio Samples PDF
This slide illustrates statistics and graphical representation of team progress. It includes testing team, sales team, development team, members and progress status graphs etc. Pitch your topic with ease and precision using this Departmental Goals And Progress Status Dashboard Ppt Portfolio Samples PDF. This layout presents information on Testing Team, Sales Team, Development Team. It is also available for immediate download and adjustment. So, changes can be made in the color, design, graphics or any other component to create a unique layout.
-
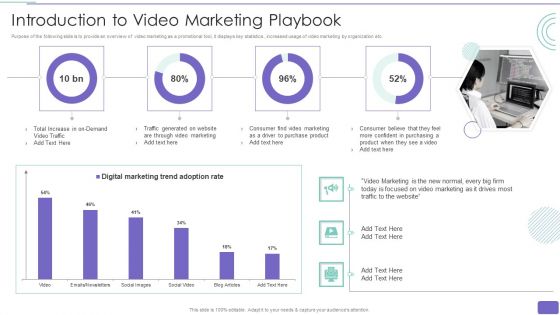
Youtube Advertising Strategy Playbook Introduction To Video Marketing Playbook Sample PDF
Purpose of the following slide is to provide an overview of video marketing as a promotional tool, it displays key statistics , increased usage of video marketing by organization etc. Deliver an awe inspiring pitch with this creative Youtube Advertising Strategy Playbook Introduction To Video Marketing Playbook Sample PDF bundle. Topics like Digital Marketing Trend, Adoption Rate, Social Media can be discussed with this completely editable template. It is available for immediate download depending on the needs and requirements of the user.
-
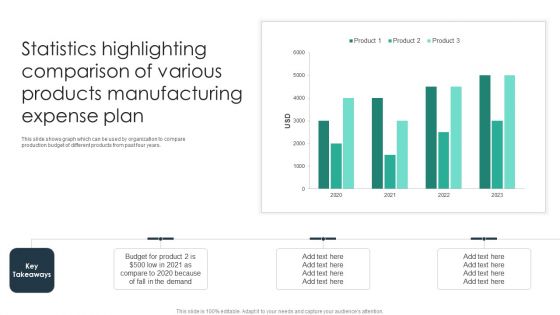
Statistics Highlighting Comparison Of Various Products Manufacturing Expense Plan Formats PDF
This slide shows graph which can be used by organization to compare production budget of different products from past four years. Pitch your topic with ease and precision using this Statistics Highlighting Comparison Of Various Products Manufacturing Expense Plan Formats PDF. This layout presents information on Budget For Product, Demand, Organization. It is also available for immediate download and adjustment. So, changes can be made in the color, design, graphics or any other component to create a unique layout.
-
Plan Dashboard For Tracking Location Wise Revenue Diagrams PDF
This slide presents a dashboard which will assist managers to track the revenue of each branch having geographical presence in different corners of the world. The key performance indicators are total revenue, location wise rent, branch performance among many others.Pitch your topic with ease and precision using this Plan Dashboard For Tracking Location Wise Revenue Diagrams PDF. This layout presents information on Taxes Paid, Current Month, Branch Performance, Previous Quarter. It is also available for immediate download and adjustment. So, changes can be made in the color, design, graphics or any other component to create a unique layout.
-
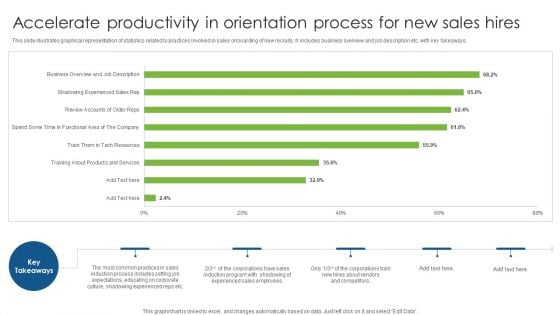
Accelerate Productivity In Orientation Process For New Sales Hires Structure PDF
This slide illustrates graphical representation of statistics related to practices involved in sales onboarding of new recruits. It includes business overview and job description etc. with key takeaways. Pitch your topic with ease and precision using this Accelerate Productivity In Orientation Process For New Sales Hires Structure PDF. This layout presents information on Accelerate Productivity In Orientation, Process For New, Sales Hires. It is also available for immediate download and adjustment. So, changes can be made in the color, design, graphics or any other component to create a unique layout.
-
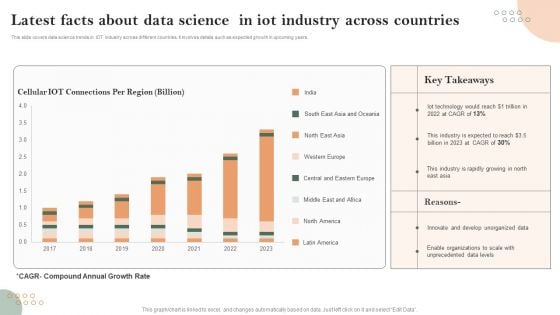
Latest Facts About Data Science In Iot Industry Across Countries Professional PDF
This slide covers data science trends in IOT industry across different countries. It involves details such as expected growth in upcoming years. Pitch your topic with ease and precision using this Latest Facts About Data Science In Iot Industry Across Countries Professional PDF. This layout presents information on Latest Facts, About Data Science, Iot Industry Across Countries. It is also available for immediate download and adjustment. So, changes can be made in the color, design, graphics or any other component to create a unique layout.
-
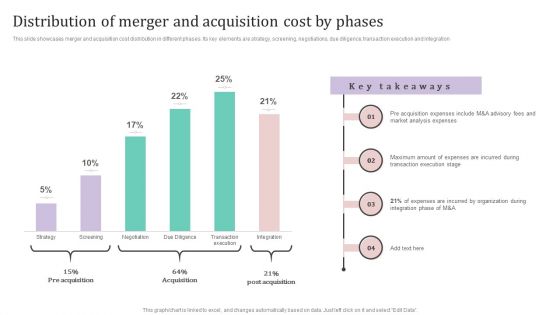
Distribution Of Merger And Acquisition Cost By Phases Ppt PowerPoint Presentation File Layouts PDF
This slide showcases merger and acquisition cost distribution in different phases. Its key elements are strategy, screening, negotiations, due diligence, transaction execution and integration. Do you know about Slidesgeeks Distribution Of Merger And Acquisition Cost By Phases Ppt PowerPoint Presentation File Layouts PDF These are perfect for delivering any kind od presentation. Using it, create PowerPoint presentations that communicate your ideas and engage audiences. Save time and effort by using our pre-designed presentation templates that are perfect for a wide range of topic. Our vast selection of designs covers a range of styles, from creative to business, and are all highly customizable and easy to edit. Download as a PowerPoint template or use them as Google Slides themes.
-
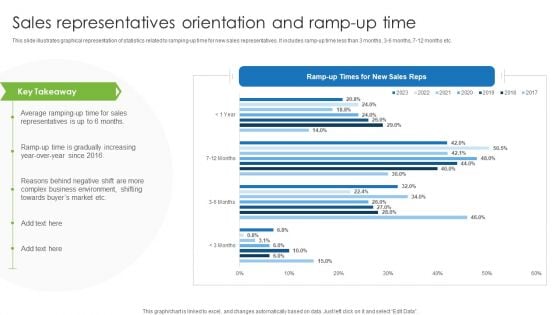
Sales Representatives Orientation And Ramp Up Time Summary PDF
This slide illustrates graphical representation of statistics related to ramping up time for new sales representatives. It includes ramp up time less than 3 months, 3 6 months, 7 12 months etc. Pitch your topic with ease and precision using this Sales Representatives Orientation And Ramp Up Time Summary PDF. This layout presents information on Sales Representatives Orientation, Ramp Up Time. It is also available for immediate download and adjustment. So, changes can be made in the color, design, graphics or any other component to create a unique layout.
-
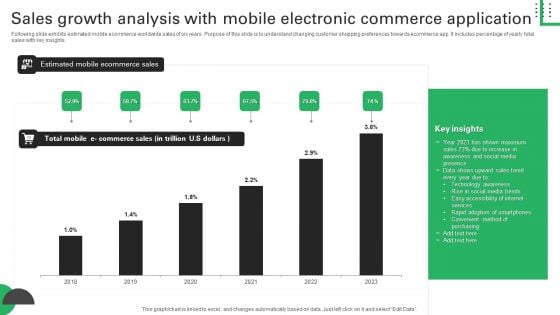
Sales Growth Analysis With Mobile Electronic Commerce Application Structure PDF
Following slide exhibits estimated mobile ecommerce worldwide sales of six years. Purpose of this slide is to understand changing customer shopping preferences towards ecommerce app. It includes percentage of yearly total sales with key insights. Pitch your topic with ease and precision using this Sales Growth Analysis With Mobile Electronic Commerce Application Structure PDF. This layout presents information on Shown Maximum, Awareness Social Media, Accessibility Internet. It is also available for immediate download and adjustment. So, changes can be made in the color, design, graphics or any other component to create a unique layout.
-
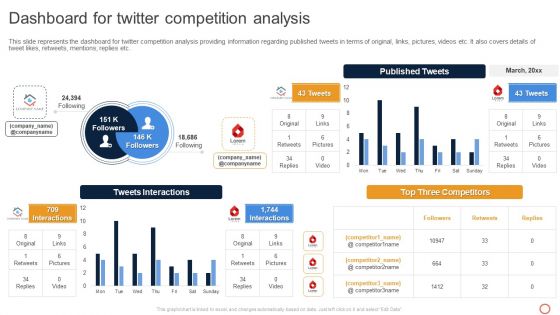
Leveraging Twitter For Social Dashboard For Twitter Competition Analysis Inspiration PDF
This slide represents the dashboard for twitter competition analysis providing information regarding published tweets in terms of original, links, pictures, videos etc. It also covers details of tweet likes, retweets, mentions, replies etc. From laying roadmaps to briefing everything in detail, our templates are perfect for you. You can set the stage with your presentation slides. All you have to do is download these easy-to-edit and customizable templates. Leveraging Twitter For Social Dashboard For Twitter Competition Analysis Inspiration PDF will help you deliver an outstanding performance that everyone would remember and praise you for. Do download this presentation today.
-
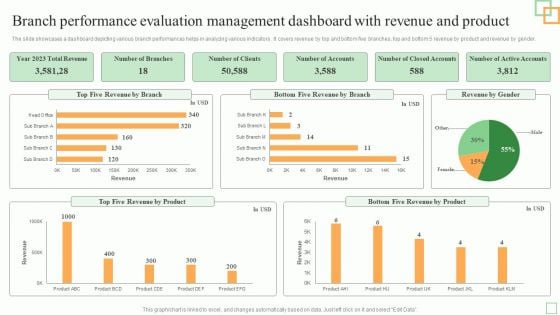
Branch Performance Evaluation Management Dashboard With Revenue And Product Mockup PDF
Pitch your topic with ease and precision using this Branch Performance Evaluation Management Dashboard With Revenue And Product Mockup PDF. This layout presents information on Five Revenue, Revenue Product, Total Revenue. It is also available for immediate download and adjustment. So, changes can be made in the color, design, graphics or any other component to create a unique layout.
-
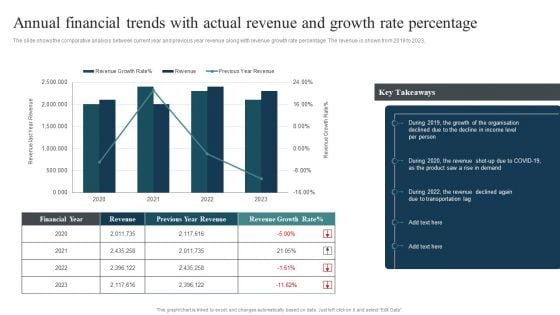
Annual Financial Trends With Actual Revenue And Growth Rate Percentage Download PDF
The slide shows the comparative analysis between current year and previous year revenue along with revenue growth rate percentage. The revenue is shown from 2019 to 2023.Showcasing this set of slides titled Annual Financial Trends With Actual Revenue And Growth Rate Percentage Download PDF. The topics addressed in these templates are Transportation, Revenue Declined, Growth Organisation. All the content presented in this PPT design is completely editable. Download it and make adjustments in color, background, font etc. as per your unique business setting.
-
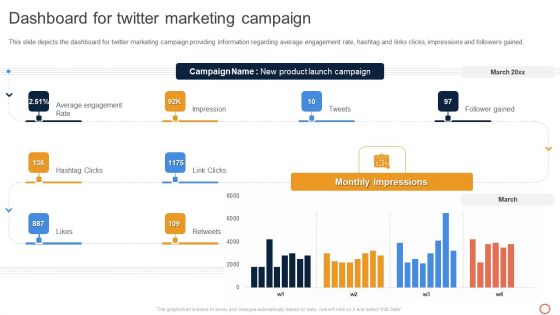
Leveraging Twitter For Social Dashboard For Twitter Marketing Campaign Summary PDF
This slide depicts the dashboard for twitter marketing campaign providing information regarding average engagement rate, hashtag and links clicks, impressions and followers gained. Present like a pro with Leveraging Twitter For Social Dashboard For Twitter Marketing Campaign Summary PDF Create beautiful presentations together with your team, using our easy-to-use presentation slides. Share your ideas in real-time and make changes on the fly by downloading our templates. So whether youre in the office, on the go, or in a remote location, you can stay in sync with your team and present your ideas with confidence. With Slidegeeks presentation got a whole lot easier. Grab these presentations today.
-
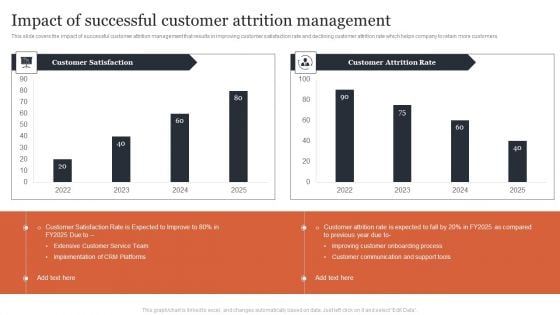
Managing Customer Attrition Impact Of Successful Customer Attrition Management Inspiration PDF
This slide covers the impact of successful customer attrition management that results in improving customer satisfaction rate and declining customer attrition rate which helps company to retain more customers. Do you have an important presentation coming up Are you looking for something that will make your presentation stand out from the rest Look no further than Managing Customer Attrition Impact Of Successful Customer Attrition Management Inspiration PDF. With our professional designs, you can trust that your presentation will pop and make delivering it a smooth process. And with Slidegeeks, you can trust that your presentation will be unique and memorable. So why wait Grab Managing Customer Attrition Impact Of Successful Customer Attrition Management Inspiration PDF today and make your presentation stand out from the rest.
-
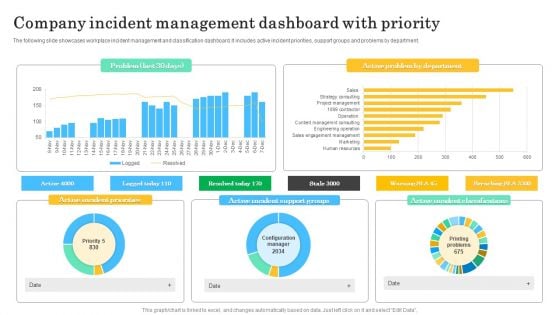
Company Incident Management Dashboard With Priority Microsoft PDF
The following slide showcases workplace incident management and classification dashboard. It includes active incident priorities, support groups and problems by department. Pitch your topic with ease and precision using this Company Incident Management Dashboard With Priority Microsoft PDF. This layout presents information on Active Incident Classifications, Active Incident Support, Active Incident Priorities . It is also available for immediate download and adjustment. So, changes can be made in the color, design, graphics or any other component to create a unique layout.
-
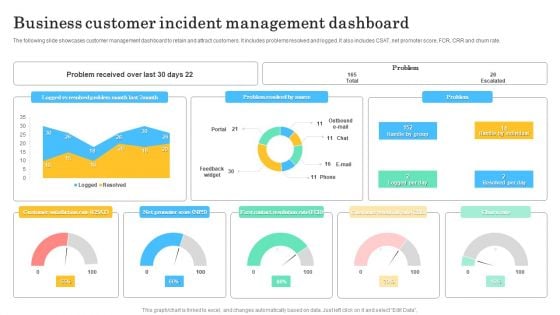
Business Customer Incident Management Dashboard Background PDF
The following slide showcases customer management dashboard to retain and attract customers. It includes problems resolved and logged. It also includes CSAT, net promoter score, FCR, CRR and churn rate. Showcasing this set of slides titled Business Customer Incident Management Dashboard Background PDF. The topics addressed in these templates are Customer Satisfaction Rate, Net Promoter Score, First Contact Resolution. All the content presented in this PPT design is completely editable. Download it and make adjustments in color, background, font etc. as per your unique business setting.
-
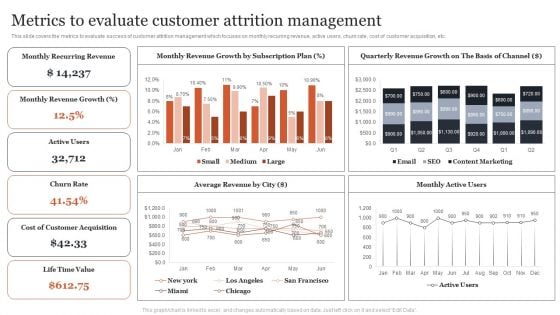
Managing Customer Attrition Metrics To Evaluate Customer Attrition Management Download PDF
This slide covers the metrics to evaluate success of customer attrition management which focuses on monthly recurring revenue, active users, churn rate, cost of customer acquisition, etc. If you are looking for a format to display your unique thoughts, then the professionally designed Managing Customer Attrition Metrics To Evaluate Customer Attrition Management Download PDF is the one for you. You can use it as a Google Slides template or a PowerPoint template. Incorporate impressive visuals, symbols, images, and other charts. Modify or reorganize the text boxes as you desire. Experiment with shade schemes and font pairings. Alter, share or cooperate with other people on your work. Download Managing Customer Attrition Metrics To Evaluate Customer Attrition Management Download PDF and find out how to give a successful presentation. Present a perfect display to your team and make your presentation unforgettable.
-
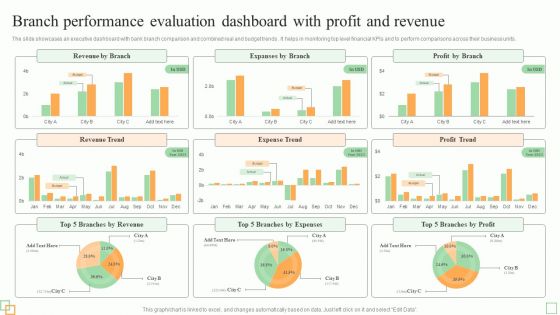
Branch Performance Evaluation Dashboard With Profit And Revenue Diagrams PDF
The slides showcases tips for enhancing branchs workforce performance and efficiency. It covers utilize transaction analysis data, schedule idle time, incent staff for efficiency, get bottom support and use part-time staff.Persuade your audience using this Best Practices To Improve Branch Workforce Performance Evaluation And Efficiency Introduction PDF. This PPT design covers five stages, thus making it a great tool to use. It also caters to a variety of topics including Market Opportunities, Customer Branch, Unnecessary Labor. Download this PPT design now to present a convincing pitch that not only emphasizes the topic but also showcases your presentation skills.
-
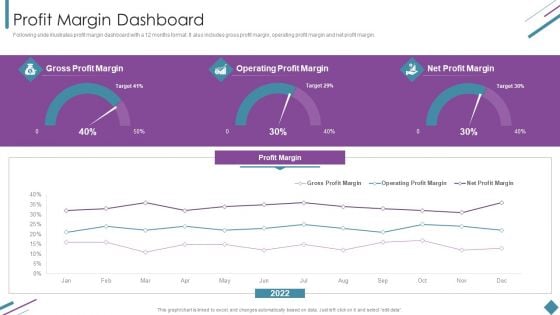
Metrics To Measure Business Performance Profit Margin Dashboard Designs PDF
Following slide illustrates profit margin dashboard with a 12 months format. It also includes gross profit margin, operating profit margin and net profit margin. Deliver and pitch your topic in the best possible manner with this Metrics To Measure Business Performance Profit Margin Dashboard Designs PDF. Use them to share invaluable insights on Gross Profit Margin, Operating Profit Margin, Net Profit Margin and impress your audience. This template can be altered and modified as per your expectations. So, grab it now.
-
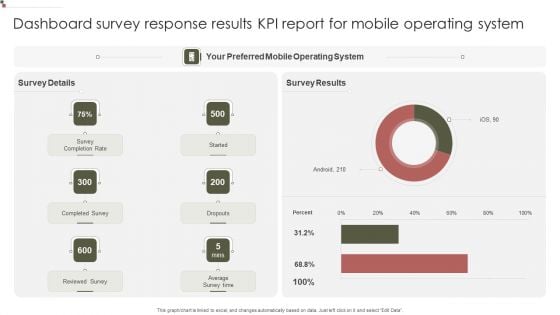
Dashboard Survey Response Results KPI Report For Mobile Operating System Designs PDF
Showcasing this set of slides titled Dashboard Survey Response Results KPI Report For Mobile Operating System Designs PDF. The topics addressed in these templates are Operating System, Survey Results, Completed Survey. All the content presented in this PPT design is completely editable. Download it and make adjustments in color, background, font etc. as per your unique business setting.
-
Strategy Playbook For Ecommerce Business Ecommerce Website Performance Tracking Dashboard Portrait PDF
This slide provides information regarding ecommerce website performance tracking dashboard addressing page views, website conversions, etc. Deliver an awe inspiring pitch with this creative Strategy Playbook For Ecommerce Business Ecommerce Website Performance Tracking Dashboard Portrait PDF bundle. Topics like Website Conversions, Website Performance, Website Overview can be discussed with this completely editable template. It is available for immediate download depending on the needs and requirements of the user.
-
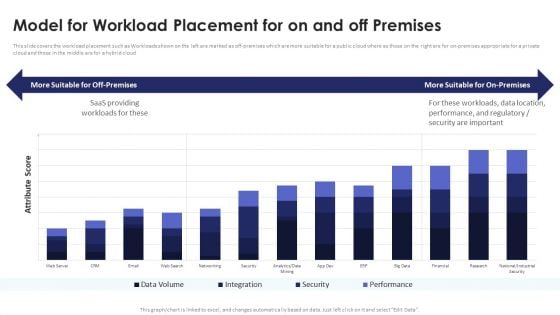
Multi Cloud Infrastructure Management Model For Workload Placement For On And Off Sample PDF
This slide covers the workload placement such as Workloads shown on the left are marked as off-premises which are more suitable for a public cloud where as those on the right are for on-premises appropriate for a private cloud and those in the middle are for a hybrid cloud. There are so many reasons you need a Multi Cloud Infrastructure Management Model For Workload Placement For On And Off Sample PDF. The first reason is you cant spend time making everything from scratch, Thus, Slidegeeks has made presentation templates for you too. You can easily download these templates from our website easily.
-
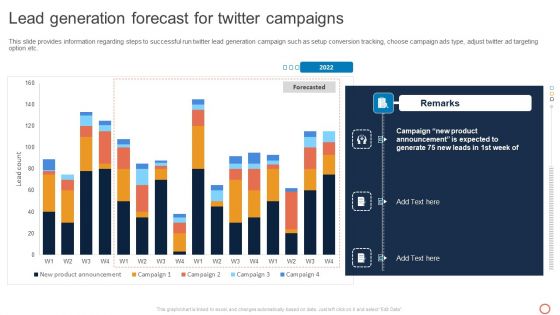
Leveraging Twitter For Social Lead Generation Forecast For Twitter Campaigns Download PDF
This slide provides information regarding steps to successful run twitter lead generation campaign such as setup conversion tracking, choose campaign ads type, adjust twitter ad targeting option etc. If your project calls for a presentation, then Slidegeeks is your go-to partner because we have professionally designed, easy-to-edit templates that are perfect for any presentation. After downloading, you can easily edit Leveraging Twitter For Social Lead Generation Forecast For Twitter Campaigns Download PDF and make the changes accordingly. You can rearrange slides or fill them with different images. Check out all the handy templates
-
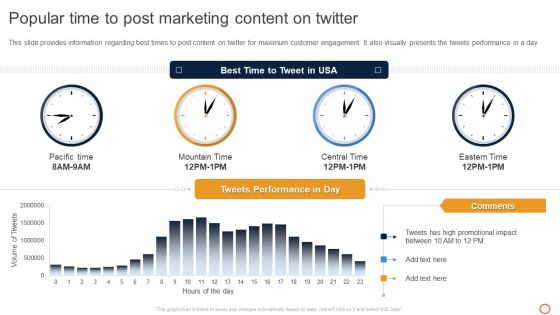
Leveraging Twitter For Social Popular Time To Post Marketing Content On Twitter Pictures PDF
This slide provides information regarding best times to post content on twitter for maximum customer engagement. It also visually presents the tweets performance in a day. Formulating a presentation can take up a lot of effort and time, so the content and message should always be the primary focus. The visuals of the PowerPoint can enhance the presenters message, so our Leveraging Twitter For Social Popular Time To Post Marketing Content On Twitter Pictures PDF was created to help save time. Instead of worrying about the design, the presenter can concentrate on the message while our designers work on creating the ideal templates for whatever situation is needed. Slidegeeks has experts for everything from amazing designs to valuable content, we have put everything into Leveraging Twitter For Social Popular Time To Post Marketing Content On Twitter Pictures PDF
-
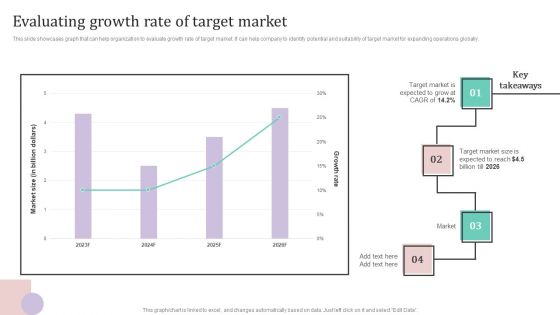
Evaluating Growth Rate Of Target Market Ppt PowerPoint Presentation File Professional PDF
This slide showcases graph that can help organization to evaluate growth rate of target market. It can help company to identify potential and suitability of target market for expanding operations globally.Create an editable Evaluating Growth Rate Of Target Market Ppt PowerPoint Presentation File Professional PDF that communicates your idea and engages your audience. Whether you are presenting a business or an educational presentation, pre-designed presentation templates help save time. Evaluating Growth Rate Of Target Market Ppt PowerPoint Presentation File Professional PDF is highly customizable and very easy to edit, covering many different styles from creative to business presentations. Slidegeeks has creative team members who have crafted amazing templates. So, go and get them without any delay.
-
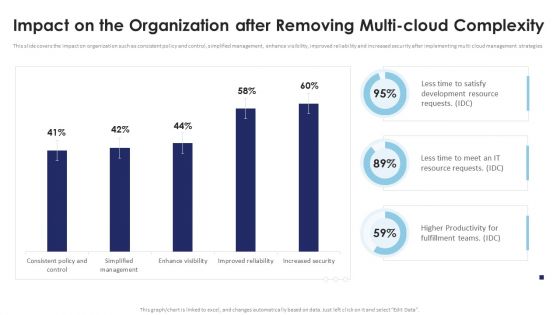
Multi Cloud Infrastructure Management Impact On The Organization After Removing Multi Mockup PDF
This slide covers the impact on organization such as consistent policy and control, simplified management, enhance visibility, improved reliability and increased security after implementing multi cloud management strategies. Create an editable Multi Cloud Infrastructure Management Impact On The Organization After Removing Multi Mockup PDF that communicates your idea and engages your audience. Whether youre presenting a business or an educational presentation, pre-designed presentation templates help save time. Multi Cloud Infrastructure Management Impact On The Organization After Removing Multi Mockup PDF is highly customizable and very easy to edit, covering many different styles from creative to business presentations. Slidegeeks has creative team members who have crafted amazing templates. So, go and get them without any delay.
-
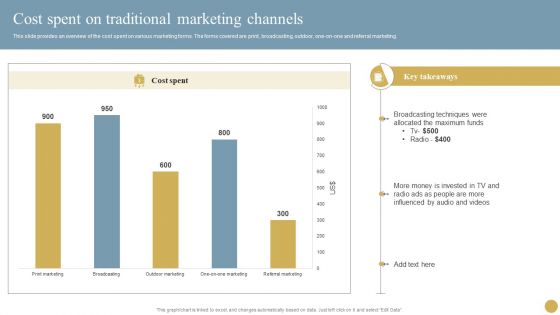
Optimizing Traditional Media To Boost Sales Cost Spent On Traditional Marketing Channels Portrait PDF
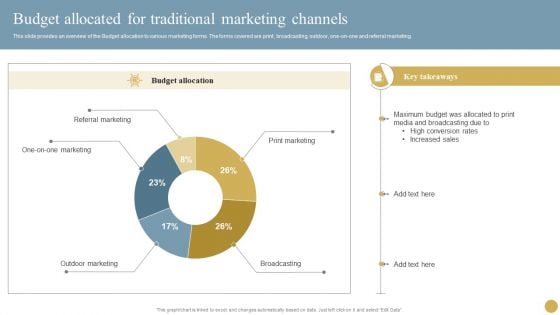
Slidegeeks is here to make your presentations a breeze with Optimizing Traditional Media To Boost Sales Cost Spent On Traditional Marketing Channels Portrait PDF With our easy-to-use and customizable templates, you can focus on delivering your ideas rather than worrying about formatting. With a variety of designs to choose from, you are sure to find one that suits your needs. And with animations and unique photos, illustrations, and fonts, you can make your presentation pop. So whether youre giving a sales pitch or presenting to the board, make sure to check out Slidegeeks first.
-
Capital Investment Options Project Team Performance Kpi Dashboard Topics PDF
This slide shows a KPI dashboard to monitor project team performance. KPIs covered are task, billable hours, billable cost, days lapsed, milestones achieved. Deliver and pitch your topic in the best possible manner with this Capital Investment Options Project Team Performance Kpi Dashboard Topics PDF. Use them to share invaluable insights on Team Members, Project Manager, Employee and impress your audience. This template can be altered and modified as per your expectations. So, grab it now.
-
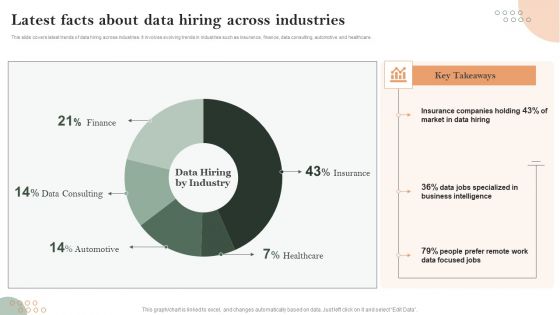
Latest Facts About Data Hiring Across Industries Clipart PDF
This slide covers latest trends of data hiring across industries. It involves evolving trends in industries such as insurance, finance, data consulting, automotive and healthcare. Showcasing this set of slides titled Latest Facts About Data Hiring Across Industries Clipart PDF. The topics addressed in these templates are Latest Facts About, Data Hiring, Across Industries. All the content presented in this PPT design is completely editable. Download it and make adjustments in color, background, font etc. as per your unique business setting.
-
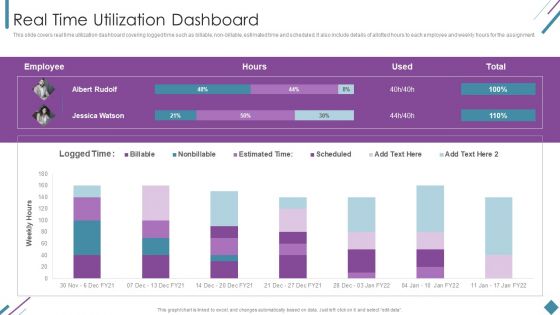
Metrics To Measure Business Performance Real Time Utilization Dashboard Topics PDF
This slide covers real time utilization dashboard covering logged time such as billable, non-billable, estimated time and scheduled. It also include details of allotted hours to each employee and weekly hours for the assignment. Deliver an awe inspiring pitch with this creative Metrics To Measure Business Performance Real Time Utilization Dashboard Topics PDF bundle. Topics like Weekly Hours, Employee, Estimated Time can be discussed with this completely editable template. It is available for immediate download depending on the needs and requirements of the user.
-
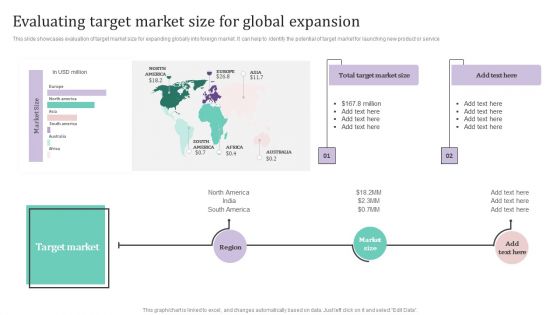
Evaluating Target Market Size For Global Expansion Ppt PowerPoint Presentation File Infographics PDF
Do you have to make sure that everyone on your team knows about any specific topic I yes, then you should give Evaluating Target Market Size For Global Expansion Ppt PowerPoint Presentation File Infographics PDF a try. Our experts have put a lot of knowledge and effort into creating this impeccable Evaluating Target Market Size For Global Expansion Ppt PowerPoint Presentation File Infographics PDF. You can use this template for your upcoming presentations, as the slides are perfect to represent even the tiniest detail. You can download these templates from the Slidegeeks website and these are easy to edit. So grab these today
-
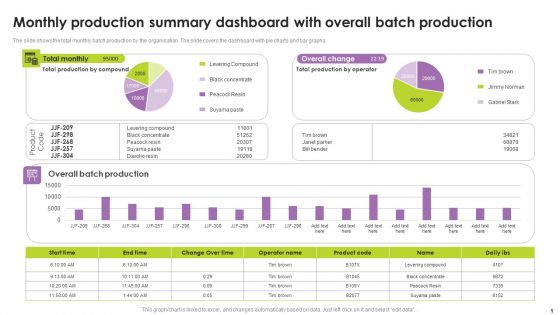
Monthly Production Summary Dashboard With Overall Batch Production Portrait PDF
The slide shows the total monthly batch production by the organisation. The slide covers the dashboard with pie charts and bar graphs. Showcasing this set of slides titled Monthly Production Summary Dashboard With Overall Batch Production Portrait PDF. The topics addressed in these templates are Monthly Production Summary Dashboard, Overall Batch Production. All the content presented in this PPT design is completely editable. Download it and make adjustments in color, background, font etc. as per your unique business setting.
-
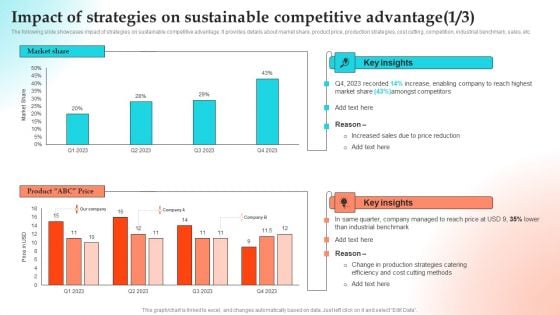
Implementing Strategies To Gain Competitive Advantage Impact Of Strategies On Sustainable Competitive Advantage Slides PDF
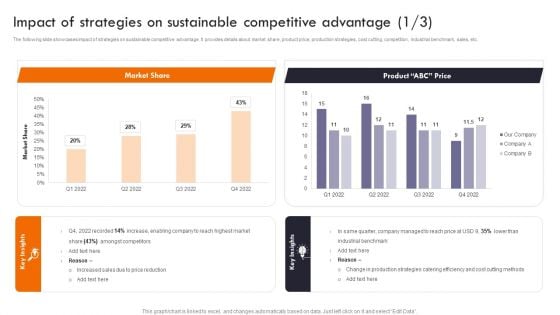
The following slide showcases impact of strategies on sustainable competitive advantage. It provides details about market share, product price, production strategies, cost cutting, competition, industrial benchmark, sales, etc. Get a simple yet stunning designed Implementing Strategies To Gain Competitive Advantage Impact Of Strategies On Sustainable Competitive Advantage Slides PDF. It is the best one to establish the tone in your meetings. It is an excellent way to make your presentations highly effective. So, download this PPT today from Slidegeeks and see the positive impacts. Our easy to edit Implementing Strategies To Gain Competitive Advantage Impact Of Strategies On Sustainable Competitive Advantage Slides PDF can be your go to option for all upcoming conferences and meetings. So, what are you waiting for Grab this template today.
-
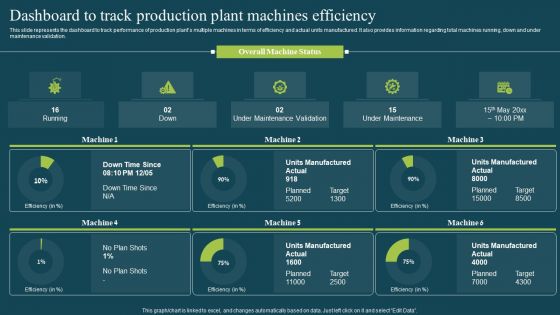
Plan To Enhance Manufacturing Dashboard To Track Production Plant Machines Microsoft PDF
This slide represents the dashboard to track performance of production plants multiple machines in terms of efficiency and actual units manufactured. It also provides information regarding total machines running, down and under maintenance validation. Here you can discover an assortment of the finest PowerPoint and Google Slides templates. With these templates, you can create presentations for a variety of purposes while simultaneously providing your audience with an eye-catching visual experience. Download Plan To Enhance Manufacturing Dashboard To Track Production Plant Machines Microsoft PDF to deliver an impeccable presentation. These templates will make your job of preparing presentations much quicker, yet still, maintain a high level of quality. Slidegeeks has experienced researchers who prepare these templates and write high-quality content for you. Later on, you can personalize the content by editing the Plan To Enhance Manufacturing Dashboard To Track Production Plant Machines Microsoft PDF.
-
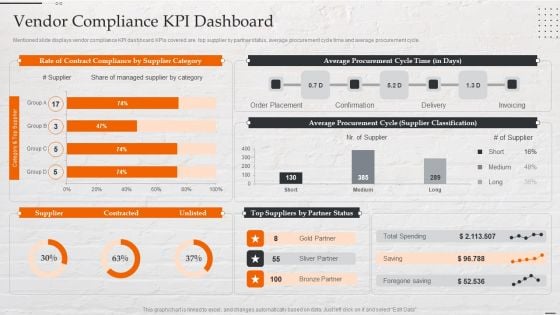
Capital Investment Options Vendor Compliance Kpi Dashboard Designs PDF
Mentioned slide displays vendor compliance KPI dashboard. KPIs covered are top supplier by partner status, average procurement cycle time and average procurement cycle. Deliver an awe inspiring pitch with this creative Capital Investment Options Vendor Compliance Kpi Dashboard Designs PDF bundle. Topics like Average Procurement, Cycle Time, Confirmation, Order Placement can be discussed with this completely editable template. It is available for immediate download depending on the needs and requirements of the user.
-
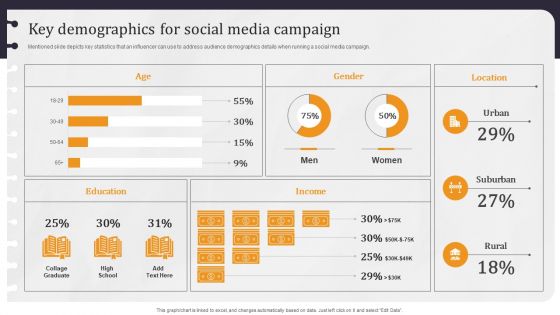
Developing Appealing Persona Key Demographics For Social Media Campaign Summary PDF
Mentioned slide depicts key statistics that an influencer can use to address audience demographics details when running a social media campaign. Explore a selection of the finest Developing Appealing Persona Key Demographics For Social Media Campaign Summary PDF here. With a plethora of professionally designed and pre-made slide templates, you can quickly and easily find the right one for your upcoming presentation. You can use our Developing Appealing Persona Key Demographics For Social Media Campaign Summary PDF to effectively convey your message to a wider audience. Slidegeeks has done a lot of research before preparing these presentation templates. The content can be personalized and the slides are highly editable. Grab templates today from Slidegeeks.
-
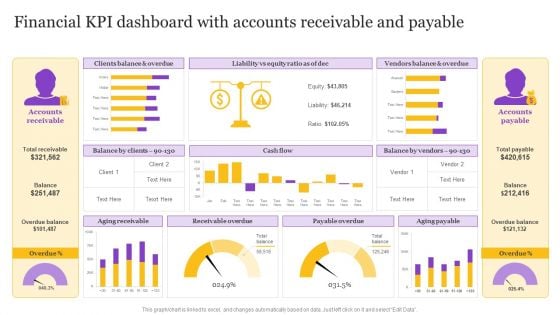
Financial KPI Dashboard With Accounts Receivable And Payable Designs PDF
Showcasing this set of slides titled Financial KPI Dashboard With Accounts Receivable And Payable Designs PDF. The topics addressed in these templates are Receivable Overdue, Aging Receivable, Payable Overdue. All the content presented in this PPT design is completely editable. Download it and make adjustments in color, background, font etc. as per your unique business setting.
-
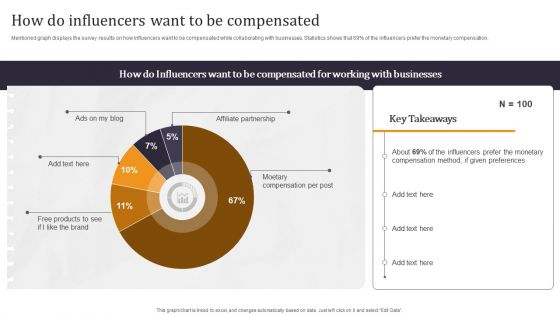
Developing Appealing Persona How Do Influencers Want To Be Compensated Summary PDF
Mentioned graph displays the survey results on how influencers want to be compensated while collaborating with businesses. Statistics shows that 69 percent of the influencers prefer the monetary compensation. This modern and well-arranged Developing Appealing Persona How Do Influencers Want To Be Compensated Summary PDF provides lots of creative possibilities. It is very simple to customize and edit with the Powerpoint Software. Just drag and drop your pictures into the shapes. All facets of this template can be edited with Powerpoint, no extra software is necessary. Add your own material, put your images in the places assigned for them, adjust the colors, and then you can show your slides to the world, with an animated slide included.
-
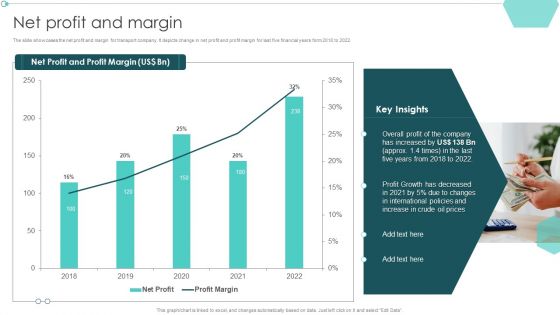
Transportation Company Profile Net Profit And Margin Ppt PowerPoint Presentation Summary Diagrams PDF
Deliver an awe inspiring pitch with this creative Transportation Company Profile Net Profit And Margin Ppt PowerPoint Presentation Summary Diagrams PDF bundle. Topics like Overall Profit, Increase In Crude, Profit Growth can be discussed with this completely editable template. It is available for immediate download depending on the needs and requirements of the user.
-
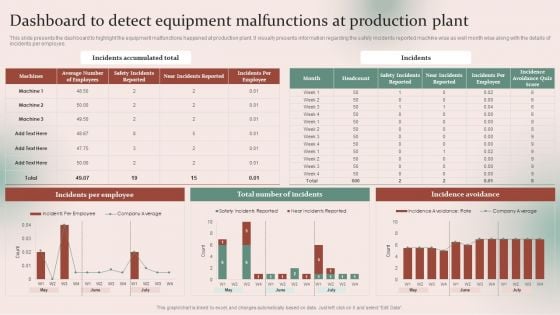
Strategies For Effective Manufacturing Dashboard To Detect Equipment Malfunctions Sample PDF
This slide presents the dashboard to highlight the equipment malfunctions happened at production plant. It visually presents information regarding the safety incidents reported machine wise as well month wise along with the details of incidents per employee. Slidegeeks has constructed Strategies For Effective Manufacturing Dashboard To Detect Equipment Malfunctions Sample PDF after conducting extensive research and examination. These presentation templates are constantly being generated and modified based on user preferences and critiques from editors. Here, you will find the most attractive templates for a range of purposes while taking into account ratings and remarks from users regarding the content. This is an excellent jumping-off point to explore our content and will give new users an insight into our top-notch PowerPoint Templates.
-
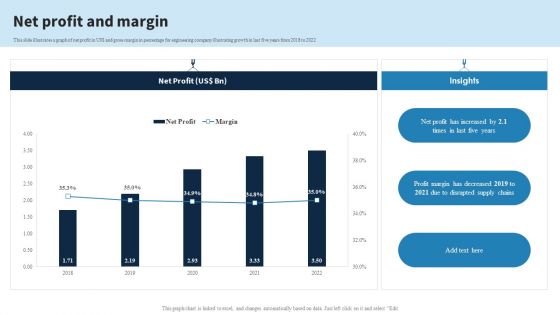
Engineering Services Company Report Net Profit And Margin Ppt PowerPoint Presentation File Aids PDF
This slide illustrates a graph of net profit in US dollar and gross margin in percentage for engineering company illustrating growth in last five years from 2018 to 2022. Present like a pro with Engineering Services Company Report Net Profit And Margin Ppt PowerPoint Presentation File Aids PDF Create beautiful presentations together with your team, using our easy-to-use presentation slides. Share your ideas in real-time and make changes on the fly by downloading our templates. So whether youre in the office, on the go, or in a remote location, you can stay in sync with your team and present your ideas with confidence. With Slidegeeks presentation got a whole lot easier. Grab these presentations today.
-
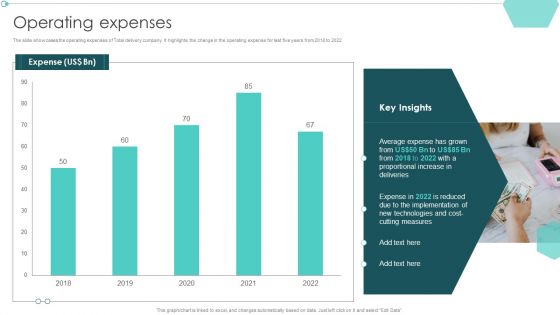
Transportation Company Profile Operating Expenses Ppt PowerPoint Presentation Portfolio Grid PDF
Deliver and pitch your topic in the best possible manner with this Transportation Company Profile Operating Expenses Ppt PowerPoint Presentation Portfolio Grid PDF. Use them to share invaluable insights on New Technologies, Cutting Measures, Proportional Increase and impress your audience. This template can be altered and modified as per your expectations. So, grab it now.
-
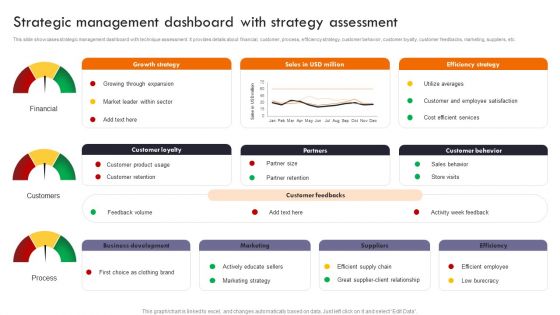
Gaining Competitive Edge Strategic Management Dashboard With Strategy Assessment Sample PDF
This slide showcases strategic management dashboard with technique assessment. It provides details about financial, customer, process, efficiency strategy, customer behavior, customer loyalty, customer feedbacks, marketing, suppliers, etc. The Gaining Competitive Edge Strategic Management Dashboard With Strategy Assessment Sample PDF is a compilation of the most recent design trends as a series of slides. It is suitable for any subject or industry presentation, containing attractive visuals and photo spots for businesses to clearly express their messages. This template contains a variety of slides for the user to input data, such as structures to contrast two elements, bullet points, and slides for written information. Slidegeeks is prepared to create an impression.
-
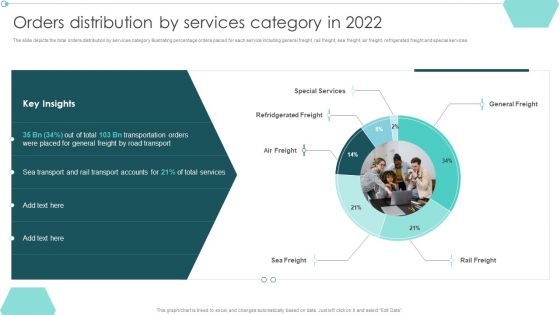
Transportation Company Profile Orders Distribution By Services Category In 2022 Ppt PowerPoint Presentation Slides Guidelines PDF
Deliver an awe inspiring pitch with this creative Transportation Company Profile Orders Distribution By Services Category In 2022 Ppt PowerPoint Presentation Slides Guidelines PDF bundle. Topics like Transportation Orders, Placed General, Transport Accounts can be discussed with this completely editable template. It is available for immediate download depending on the needs and requirements of the user.
-
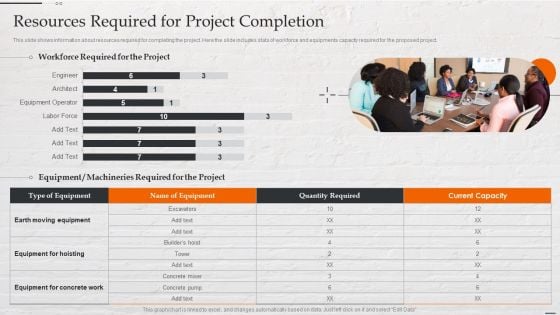
Capital Investment Options Resources Required For Project Completion Brochure PDF
This slide shows information about resources required for completing the project. Here the slide includes stats of workforce and equipments capacity required for the proposed project. Deliver an awe inspiring pitch with this creative Capital Investment Options Resources Required For Project Completion Brochure PDF bundle. Topics like Workforce Required, Project, Machineries Required can be discussed with this completely editable template. It is available for immediate download depending on the needs and requirements of the user.
-
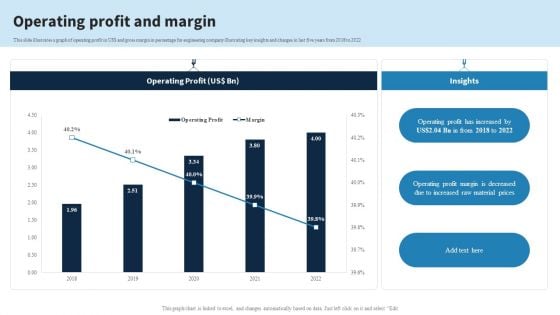
Engineering Services Company Report Operating Profit And Margin Ppt PowerPoint Presentation Gallery Show PDF
This slide illustrates a graph of operating profit in US dollar and gross margin in percentage for engineering company illustrating key insights and changes in last five years from 2018 to 2022. Do you have an important presentation coming up Are you looking for something that will make your presentation stand out from the rest Look no further than Engineering Services Company Report Operating Profit And Margin Ppt PowerPoint Presentation Gallery Show PDF. With our professional designs, you can trust that your presentation will pop and make delivering it a smooth process. And with Slidegeeks, you can trust that your presentation will be unique and memorable. So why wait Grab Engineering Services Company Report Operating Profit And Margin Ppt PowerPoint Presentation Gallery Show PDF today and make your presentation stand out from the rest.
-
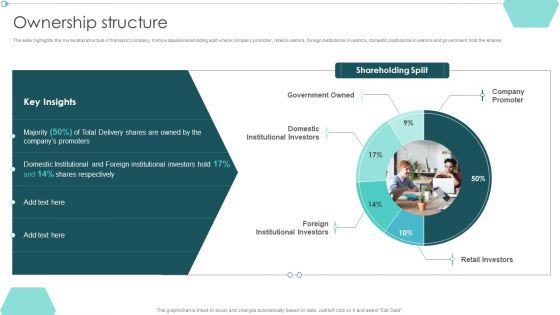
Transportation Company Profile Ownership Structure Ppt PowerPoint Presentation Show Introduction PDF
Deliver and pitch your topic in the best possible manner with this Transportation Company Profile Ownership Structure Ppt PowerPoint Presentation Show Introduction PDF. Use them to share invaluable insights on Domestic Institutional, Shares Respectively, Foreign Institutional and impress your audience. This template can be altered and modified as per your expectations. So, grab it now.
-
Engineering Services Company Report Ownership Structure Ppt PowerPoint Presentation File Model PDF
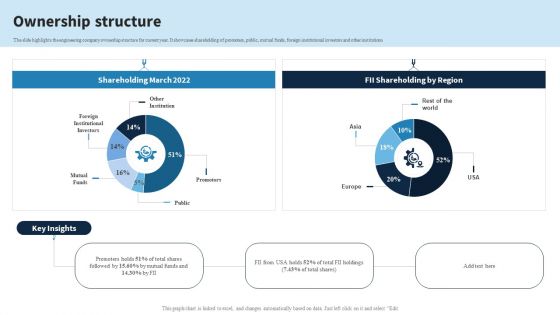
The slide highlights the engineering company ownership structure for current year. It showcases shareholding of promoters, public, mutual funds, foreign institutional investors and other institutions. If you are looking for a format to display your unique thoughts, then the professionally designed Engineering Services Company Report Ownership Structure Ppt PowerPoint Presentation File Model PDF is the one for you. You can use it as a Google Slides template or a PowerPoint template. Incorporate impressive visuals, symbols, images, and other charts. Modify or reorganize the text boxes as you desire. Experiment with shade schemes and font pairings. Alter, share or cooperate with other people on your work. Download Engineering Services Company Report Ownership Structure Ppt PowerPoint Presentation File Model PDF and find out how to give a successful presentation. Present a perfect display to your team and make your presentation unforgettable.
-
Engineering Services Company Report Product And Services Sales Ppt PowerPoint Presentation File Deck PDF
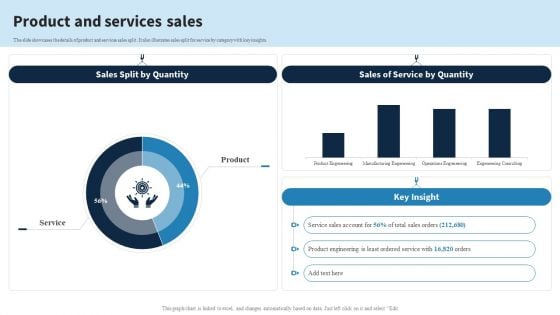
The slide showcases the details of product and services sales split. It also illustrates sales split for service by category with key insights. Find a pre-designed and impeccable Engineering Services Company Report Product And Services Sales Ppt PowerPoint Presentation File Deck PDF. The templates can ace your presentation without additional effort. You can download these easy-to-edit presentation templates to make your presentation stand out from others. So, what are you waiting for Download the template from Slidegeeks today and give a unique touch to your presentation.
-
Gaining Competitive Edge Impact Of Strategies On Sustainable Competitive Advantage Rules PDF
The following slide showcases impact of strategies on sustainable competitive advantage. It provides details about market share, product price, production strategies, cost cutting, competition, industrial benchmark, sales, etc. Retrieve professionally designed Gaining Competitive Edge Impact Of Strategies On Sustainable Competitive Advantage Rules PDF to effectively convey your message and captivate your listeners. Save time by selecting pre-made slideshows that are appropriate for various topics, from business to educational purposes. These themes come in many different styles, from creative to corporate, and all of them are easily adjustable and can be edited quickly. Access them as PowerPoint templates or as Google Slides themes. You dont have to go on a hunt for the perfect presentation because Slidegeeks got you covered from everywhere.
-
Developing Appealing Persona Metrics Addressing Social Media Followers Elements PDF
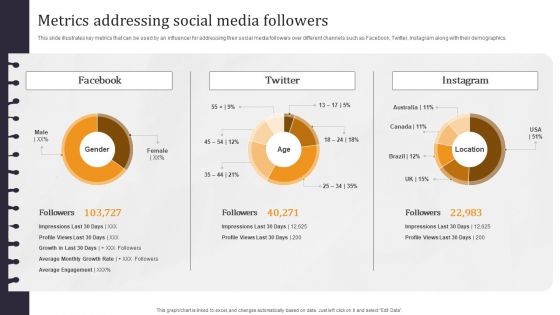
This slide illustrates key metrics that can be used by an influencer for addressing their social media followers over different channels such as Facebook, Twitter, Instagram along with their demographics. The best PPT templates are a great way to save time, energy, and resources. Slidegeeks have 100 PERCENT editable powerpoint slides making them incredibly versatile. With these quality presentation templates, you can create a captivating and memorable presentation by combining visually appealing slides and effectively communicating your message. Download Developing Appealing Persona Metrics Addressing Social Media Followers Elements PDF from Slidegeeks and deliver a wonderful presentation.
-
Strategy Playbook For Ecommerce Business Dashboard Tracking Essential Kpis For Ecommerce Performance Rules PDF
This slide provides information regarding essential KPIs for ecommerce performance dashboard tracking average bounce rate, new vs. old customers, channel revenue vs. channel acquisitions costs, channel revenue vs. sales, average conversion rate, etc. Deliver an awe inspiring pitch with this creative Strategy Playbook For Ecommerce Business Dashboard Tracking Essential Kpis For Ecommerce Performance Rules PDF bundle. Topics like Returning Customers, Acquisition Cost, Channel Revenue can be discussed with this completely editable template. It is available for immediate download depending on the needs and requirements of the user.
-
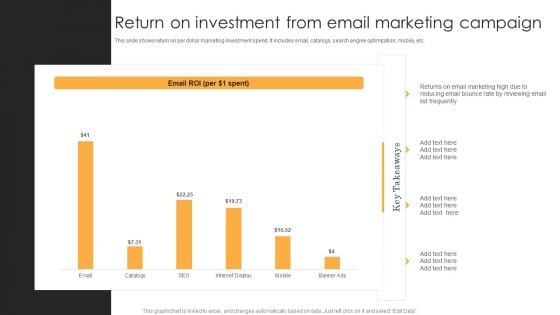
Return On Investment From Email Marketing Campaign Themes PDF
This slide shows return on per dollar marketing investment spend. It includes email, catalogs, search engine optimization, mobile, etc. Pitch your topic with ease and precision using this Return On Investment From Email Marketing Campaign Themes PDF. This layout presents information on Email Marketing, Email Roi, Reducing Email Bounce Rate. It is also available for immediate download and adjustment. So, changes can be made in the color, design, graphics or any other component to create a unique layout.
-
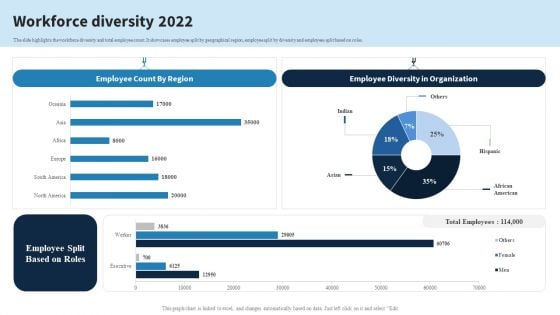
Engineering Services Company Report Workforce Diversity 2022 Ppt PowerPoint Presentation File Pictures PDF
The slide highlights the workforce diversity and total employee count. It showcases employee split by geographical region, employee split by diversity and employees split based on roles. Create an editable Engineering Services Company Report Workforce Diversity 2022 Ppt PowerPoint Presentation File Pictures PDF that communicates your idea and engages your audience. Whether youre presenting a business or an educational presentation, pre-designed presentation templates help save time. Engineering Services Company Report Workforce Diversity 2022 Ppt PowerPoint Presentation File Pictures PDF is highly customizable and very easy to edit, covering many different styles from creative to business presentations. Slidegeeks has creative team members who have crafted amazing templates. So, go and get them without any delay.
-
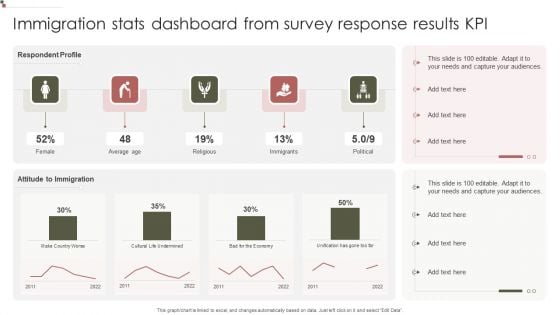
Immigration Stats Dashboard From Survey Response Results KPI Elements PDF
Pitch your topic with ease and precision using this Immigration Stats Dashboard From Survey Response Results KPI Elements PDF. This layout presents information on Attitude Immigration, Respondent Profile, Immigrants. It is also available for immediate download and adjustment. So, changes can be made in the color, design, graphics or any other component to create a unique layout.
-
Plan To Enhance Manufacturing Dashboard To Monitor Production Plant Shift Icons PDF
This slide represents the dashboard to monitor production plant efficiency for the multiple shifts. The multiple kpis covered in dashboard are availability, performance of manufacturing plant machines. It also provides information regarding the total downtime along with good parts yield. Presenting this PowerPoint presentation, titled Plan To Enhance Manufacturing Dashboard To Monitor Production Plant Shift Icons PDF, with topics curated by our researchers after extensive research. This editable presentation is available for immediate download and provides attractive features when used. Download now and captivate your audience. Presenting this Plan To Enhance Manufacturing Dashboard To Monitor Production Plant Shift Icons PDF. Our researchers have carefully researched and created these slides with all aspects taken into consideration. This is a completely customizable Plan To Enhance Manufacturing Dashboard To Monitor Production Plant Shift Icons PDF that is available for immediate downloading. Download now and make an impact on your audience. Highlight the attractive features available with our PPTs.
-
Engineering Services Company Report Top Products And Services Ppt File Graphics Pictures PDF
The slide highlights the top product and services by sales volume in 2022. It showcases mechanical tools, industrial sensors, safety valves, line expansion, security consulting and manufacturing automation. Want to ace your presentation in front of a live audience Our Engineering Services Company Report Top Products And Services Ppt File Graphics Pictures PDF can help you do that by engaging all the users towards you. Slidegeeks experts have put their efforts and expertise into creating these impeccable powerpoint presentations so that you can communicate your ideas clearly. Moreover, all the templates are customizable, and easy-to-edit and downloadable. Use these for both personal and commercial use.
-
Mobile Device Management Addressing Current Challenges In Managing Mobile Devices Professional PDF
This slide covers information regarding the current challenges faced by firm in management of mobile devices at workplace with various risks associated to mobile devices such as corporate data protection, data breaches and records exposed, etc. Get a simple yet stunning designed Mobile Device Management Addressing Current Challenges In Managing Mobile Devices Professional PDF. It is the best one to establish the tone in your meetings. It is an excellent way to make your presentations highly effective. So, download this PPT today from Slidegeeks and see the positive impacts. Our easy-to-edit Mobile Device Management Addressing Current Challenges In Managing Mobile Devices Professional PDF can be your go-to option for all upcoming conferences and meetings. So, what are you waiting for Grab this template today.
-
Key Trends To Improve Retail Financial Institution Industry Information PDF
Pitch your topic with ease and precision using this Key Trends To Improve Retail Financial Institution Industry Information PDF. This layout presents information on Improve Retail Financial, Institution Industry. It is also available for immediate download and adjustment. So, changes can be made in the color, design, graphics or any other component to create a unique layout.
-
Business Restructuring Process Dashboard To Determine Sales Profit And Conversions Inspiration PDF
This slide focuses on dashboard to determine sales profits and conversions that also includes revenues, profits, number of orders placed, total customers, procured items that will help company to measure the overall business performance. There are so many reasons you need a Business Restructuring Process Dashboard To Determine Sales Profit And Conversions Inspiration PDF. The first reason is you cant spend time making everything from scratch, Thus, Slidegeeks has made presentation templates for you too. You can easily download these templates from our website easily.
-
KPI Dashboard To Measure Financial Institution Industry Revenue Summary PDF
Pitch your topic with ease and precision using this KPI Dashboard To Measure Financial Institution Industry Revenue Summary PDF. This layout presents information on Measure Financial, Institution Industry . It is also available for immediate download and adjustment. So, changes can be made in the color, design, graphics or any other component to create a unique layout.
-
Business Restructuring Process Customer Churn Rate For Last Four Years Topics PDF
This slide shows the customer churn rate for last four consecutive years due to poor customer service, insufficient inventory, etc. that results in losing customers which in turn impact company goodwill. Want to ace your presentation in front of a live audience Our Business Restructuring Process Customer Churn Rate For Last Four Years Topics PDF can help you do that by engaging all the users towards you. Slidegeeks experts have put their efforts and expertise into creating these impeccable powerpoint presentations so that you can communicate your ideas clearly. Moreover, all the templates are customizable, and easy-to-edit and downloadable. Use these for both personal and commercial use.
-
Mobile Device Management Tracking Mobile Device Activities At Workplace Elements PDF
This slide covers information regarding the tracking mobile device activities at workplace with details about device security, ownership, last seen status. Are you in need of a template that can accommodate all of your creative concepts This one is crafted professionally and can be altered to fit any style. Use it with Google Slides or PowerPoint. Include striking photographs, symbols, depictions, and other visuals. Fill, move around, or remove text boxes as desired. Test out color palettes and font mixtures. Edit and save your work, or work with colleagues. Download Mobile Device Management Tracking Mobile Device Activities At Workplace Elements PDF and observe how to make your presentation outstanding. Give an impeccable presentation to your group and make your presentation unforgettable.
-
Mobile Device Management Determine Impact Of Effective Mobile Device Management Diagrams PDF
This slide covers information regarding the impact of effective mobile device management solution such as reduction in data breaches and records exposed, reduction in malwares samples per quarter. If you are looking for a format to display your unique thoughts, then the professionally designed Mobile Device Management Determine Impact Of Effective Mobile Device Management Diagrams PDF is the one for you. You can use it as a Google Slides template or a PowerPoint template. Incorporate impressive visuals, symbols, images, and other charts. Modify or reorganize the text boxes as you desire. Experiment with shade schemes and font pairings. Alter, share or cooperate with other people on your work. Download Mobile Device Management Determine Impact Of Effective Mobile Device Management Diagrams PDF and find out how to give a successful presentation. Present a perfect display to your team and make your presentation unforgettable.
-
Optimizing Traditional Media To Boost Sales Budget Allocated For Traditional Marketing Channels Designs PDF
Want to ace your presentation in front of a live audience. Our Optimizing Traditional Media To Boost Sales Budget Allocated For Traditional Marketing Channels Designs PDF can help you do that by engaging all the users towards you. Slidegeeks experts have put their efforts and expertise into creating these impeccable powerpoint presentations so that you can communicate your ideas clearly. Moreover, all the templates are customizable, and easy-to-edit and downloadable. Use these for both personal and commercial use.
-
Expectations After Expanding Into Global Markets Ppt PowerPoint Presentation Diagram Lists PDF
This slide showcase graph that can help organization to estimate the impact on organizational sales after global expansion. It showcases sales in thousand dollars and forecast for a period of two years.Want to ace your presentation in front of a live audience Our Expectations After Expanding Into Global Markets Ppt PowerPoint Presentation Diagram Lists PDF can help you do that by engaging all the users towards you.. Slidegeeks experts have put their efforts and expertise into creating these impeccable powerpoint presentations so that you can communicate your ideas clearly. Moreover, all the templates are customizable, and easy-to-edit and downloadable. Use these for both personal and commercial use.
-
Big Latest Facts About Data Daas Market Size Projections 2018 2023 Portrait PDF
This slide covers big data trends as data is heading as a service. It involves simplified access, cost effectiveness and easy updates. Showcasing this set of slides titled Big Latest Facts About Data Daas Market Size Projections 2018 2023 Portrait PDF. The topics addressed in these templates are Big Latest Facts, About Data, Market Size Projections. All the content presented in this PPT design is completely editable. Download it and make adjustments in color, background, font etc. as per your unique business setting.
-
Addressing Financial Repercussions Associated To Mobile Device Management Failures Summary PDF
This slide portrays information regarding the amount that is spend by firm in settling cases of security failures associated to mobile devices which not only consider as financial losses but hampered firms public image. There are so many reasons you need a Addressing Financial Repercussions Associated To Mobile Device Management Failures Summary PDF. The first reason is you cant spend time making everything from scratch, Thus, Slidegeeks has made presentation templates for you too. You can easily download these templates from our website easily.

 Home
Home 


