Finance PowerPoint Icons
-
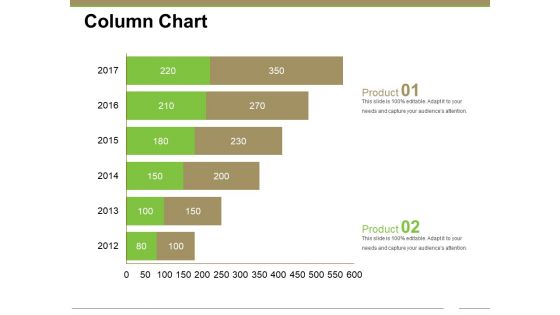
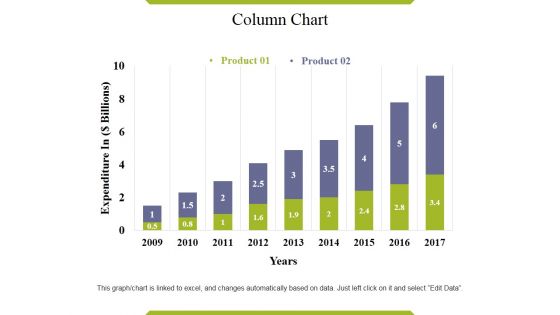
Column Chart Ppt PowerPoint Presentation Gallery Styles
This is a column chart ppt powerpoint presentation gallery styles. This is a two stage process. The stages in this process are years, graph, business, marketing, finance.
-
Radar Chart Ppt PowerPoint Presentation Icon Files
This is a radar chart ppt powerpoint presentation icon files. This is a three stage process. The stages in this process are chart, business, marketing, finance, strategy.
-
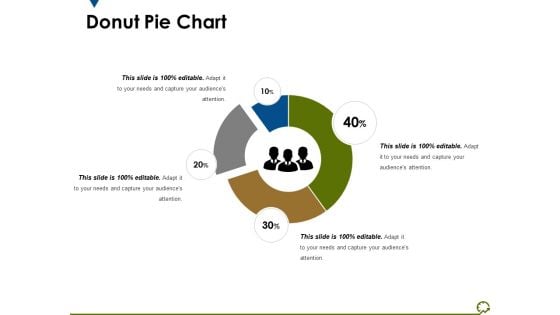
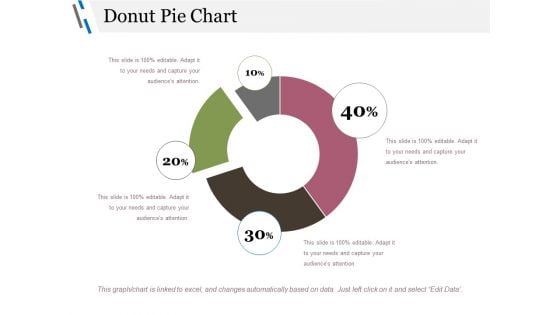
Donut Pie Chart Ppt PowerPoint Presentation Show Styles
This is a donut pie chart ppt powerpoint presentation show styles. This is a four stage process. The stages in this process are chart, business, process, management, percentage.
-
Financial Projections Ppt PowerPoint Presentation Icon Show
This is a financial projections ppt powerpoint presentation icon show. This is a three stage process. The stages in this process are minimum, medium, maximum, icons, finance.
-
Shareholding Pattern Ppt PowerPoint Presentation Icon Layouts
This is a shareholding pattern ppt powerpoint presentation icon layouts. This is a five stage process. The stages in this process are before funding, shareholder, after funding, business, percentage.
-
Traction Ppt PowerPoint Presentation Icon Example Introduction
This is a traction ppt powerpoint presentation icon example introduction. This is a three stage process. The stages in this process are any coverage in articles news, company s logo, growing fast, generating good revenues, business, finance.
-
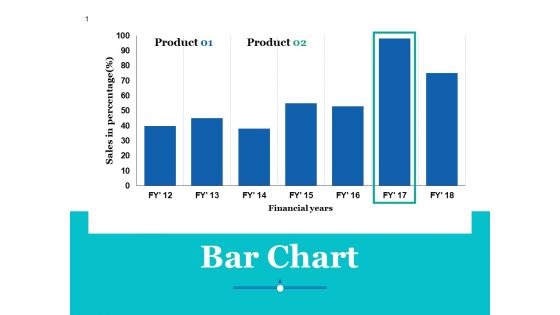
Bar Chart Ppt PowerPoint Presentation Professional Sample
This is a bar chart ppt powerpoint presentation professional sample. This is a two stage process. The stages in this process are bar chart, finance, business, marketing, planning.
-
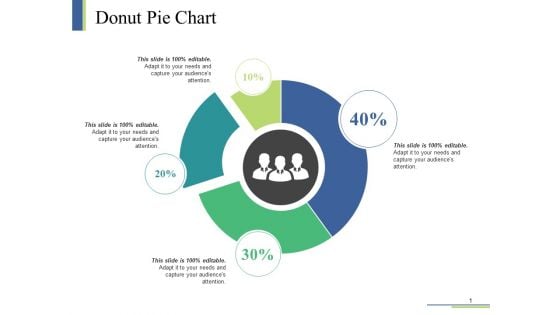
Donut Pie Chart Ppt PowerPoint Presentation Visual Aids Infographic Template
This is a donut pie chart ppt powerpoint presentation visual aids infographic template. This is a four stage process. The stages in this process are donut pie chart, finance, planning, management, marketing.
-
Stock Chart Ppt PowerPoint Presentation Slides Outline
This is a stock chart ppt powerpoint presentation slides outline. This is a one stage process. The stages in this process are high, low, business, marketing, graph.
-
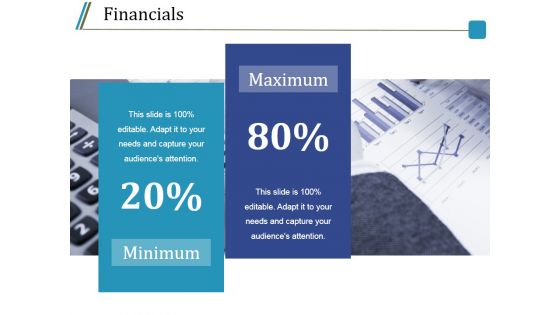
Financials Ppt PowerPoint Presentation Styles Show
This is a financials ppt powerpoint presentation styles show. This is a two stage process. The stages in this process are minimum, maximum, percentage, financial, business.
-
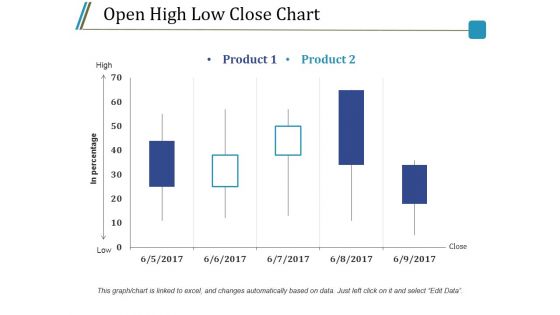
Open High Low Close Chart Ppt PowerPoint Presentation Styles Model
This is a open high low close chart ppt powerpoint presentation styles model. This is a five stage process. The stages in this process are product, high, low, in percentage, close.
-
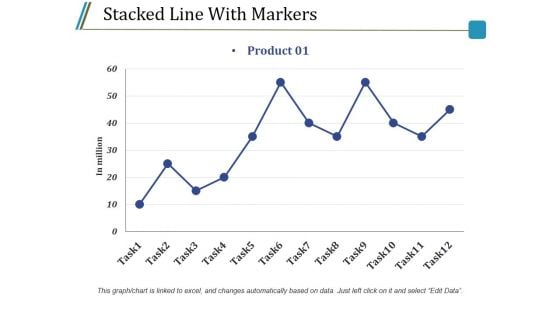
Stacked Line With Markers Ppt PowerPoint Presentation Infographic Template Graphics Example
This is a stacked line with markers ppt powerpoint presentation infographic template graphics example. This is a one stage process. The stages in this process are in million, task, product, finance, line graph.
-
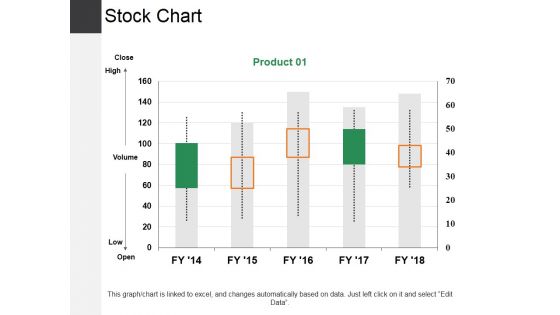
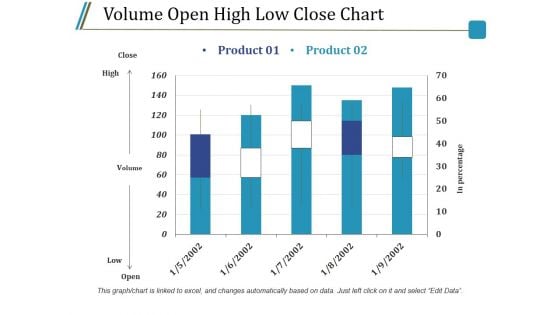
Volume Open High Low Close Chart Ppt PowerPoint Presentation Infographics Guide
This is a volume open high low close chart ppt powerpoint presentation infographics guide. This is a two stage process. The stages in this process are close, high, volume, low, open, product.
-
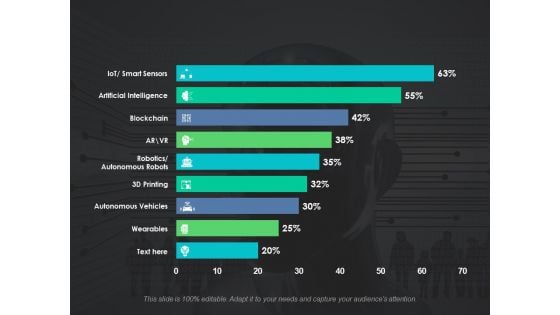
Survey On Adoption Of Emerging Technologies Ppt PowerPoint Presentation Model Format Ideas
This is a survey on adoption of emerging technologies ppt powerpoint presentation model format ideas. This is a nine stages process. The stages in this process are artificial intelligence, blockchain, autonomous robots, autonomous vehicles, wearable, finance.
-
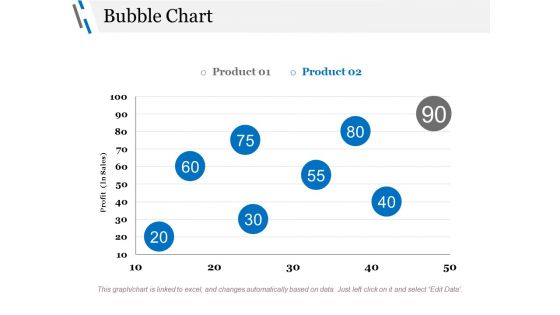
Bubble Chart Ppt PowerPoint Presentation Styles Objects
This is a bubble chart ppt powerpoint presentation styles objects. This is a two stage process. The stages in this process are profit, business, marketing, finance, chart.
-
Clustered Bar Ppt PowerPoint Presentation Icon Slides
This is a clustered bar ppt powerpoint presentation icon slides. This is a two stage process. The stages in this process are profit, business, marketing, finance, chart.
-
Donut Pie Chart Ppt PowerPoint Presentation Gallery Infographics
This is a donut pie chart ppt powerpoint presentation gallery infographics. This is a four stage process. The stages in this process are chart, business, management, percentage, process.
-
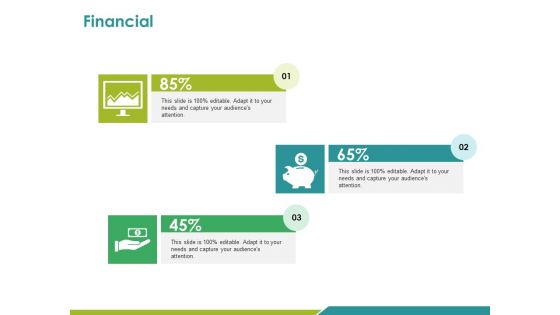
Financial Ppt PowerPoint Presentation Professional Format Ideas
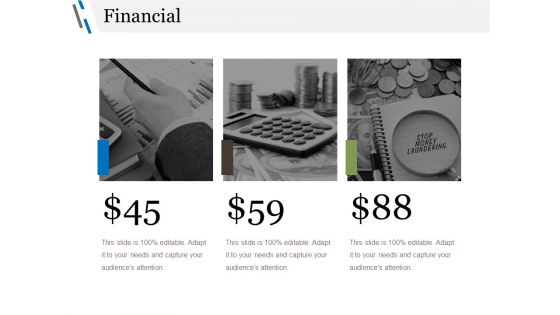
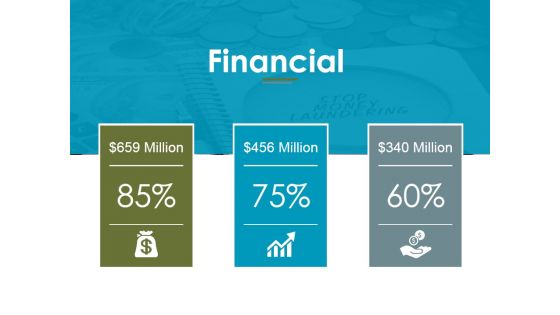
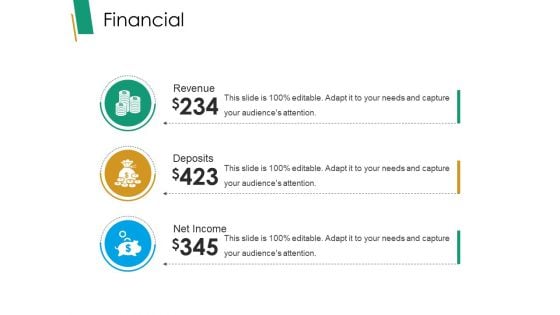
This is a financial ppt powerpoint presentation professional format ideas. This is a three stage process. The stages in this process are business, marketing, finance, strategy, planning.
-
Logo Designing Sources Ppt PowerPoint Presentation Ideas Microsoft
This is a logo designing sources ppt powerpoint presentation ideas microsoft. This is a five stage process. The stages in this process are others, friends relative, self employed, online design firm, local design.
-
Comparison Ppt PowerPoint Presentation Layouts Graphics Example
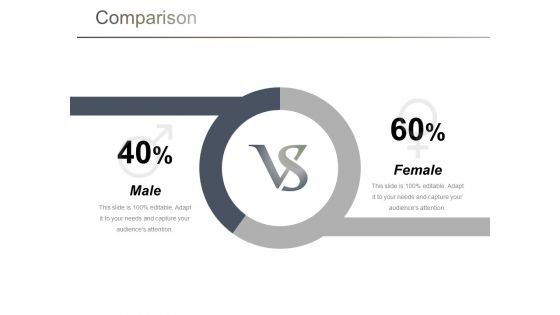
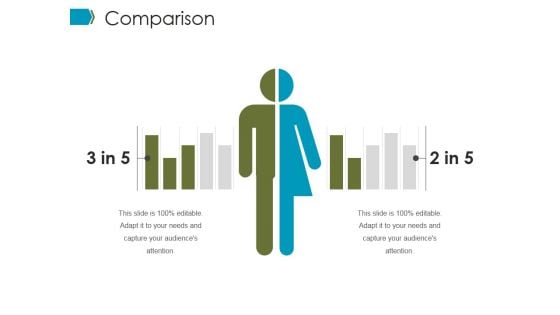
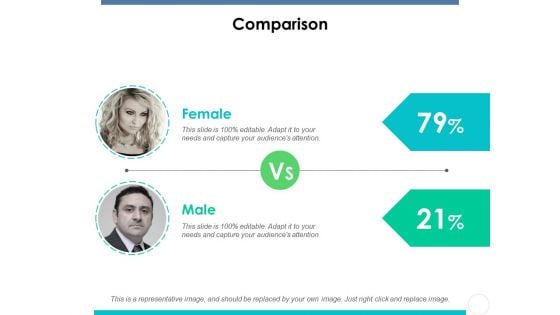
This is a comparison ppt powerpoint presentation layouts graphics example. This is a two stage process. The stages in this process are male, female, comparison, percentage, business.
-
Nurturing Ppt PowerPoint Presentation Show Smartart
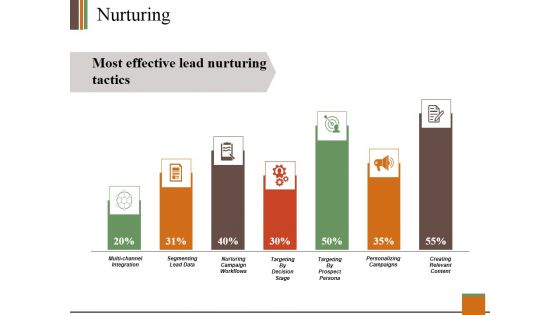
This is a nurturing ppt powerpoint presentation show smartart. This is a seven stage process. The stages in this process are segmenting lead data, personalizing campaigns, multi channel integration.
-
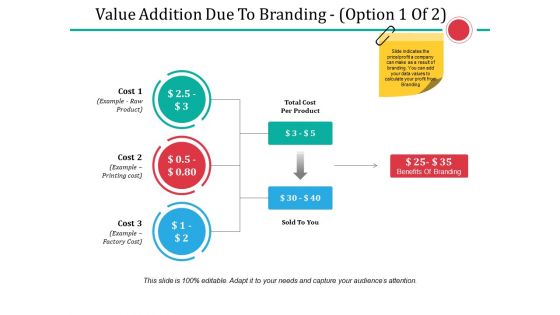
Value Addition Due To Branding Template 1 Ppt PowerPoint Presentation Portfolio Maker
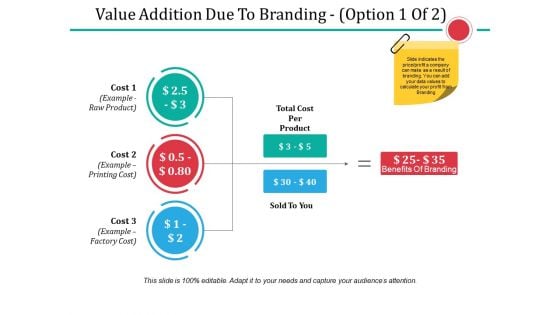
This is a value addition due to branding template 1 ppt powerpoint presentation portfolio maker. This is a three stage process. The stages in this process are sold to you, total cost per product, benefits of branding, business, marketing.
-
Value Addition Due To Branding Template 2 Ppt PowerPoint Presentation Model Elements
This is a value addition due to branding template 2 ppt powerpoint presentation model elements. This is a three stage process. The stages in this process are sold to you, total cost per product, benefits of branding, business, marketing.
-
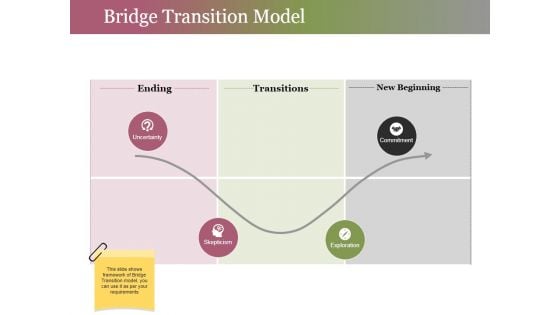
Bridge Transition Model Ppt PowerPoint Presentation Gallery Infographics
This is a bridge transition model ppt powerpoint presentation gallery infographics. This is a four stage process. The stages in this process are ending, transitions, new beginning, commitment, exploration.
-
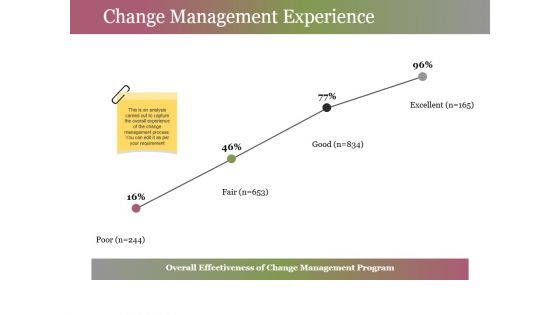
Change Management Experience Ppt PowerPoint Presentation Gallery Styles
This is a change management experience ppt powerpoint presentation gallery styles. This is a four stage process. The stages in this process are poor, fair, good, excellent, percentage.
-
Brand Tracking Info Graphics Ppt PowerPoint Presentation Portfolio Sample
This is a brand tracking info graphics ppt powerpoint presentation portfolio sample. This is a four stage process. The stages in this process are business, marketing, finance, strategy, planning.
-
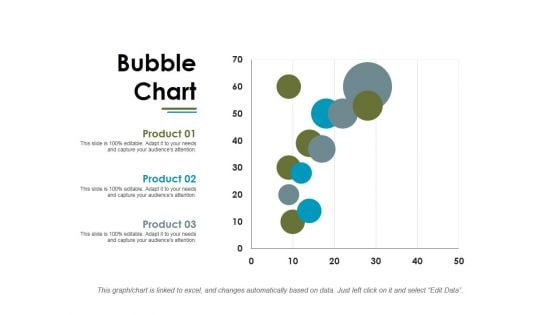
Bubble Chart Ppt PowerPoint Presentation Summary Microsoft
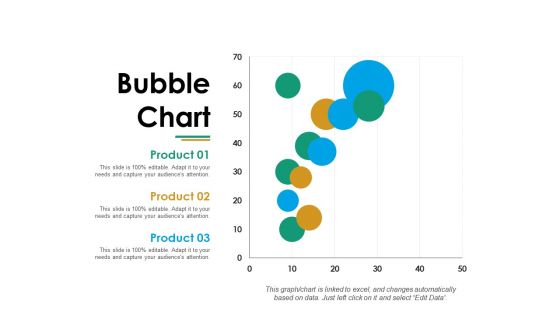
This is a bubble chart ppt powerpoint presentation summary microsoft. This is a three stage process. The stages in this process are business, marketing, graph, finance, planning.
-
Comparison Ppt PowerPoint Presentation Pictures Graphics Example
This is a comparison ppt powerpoint presentation pictures graphics example. This is a two stage process. The stages in this process are compare, male, female, finance, marketing.
-
Financial Ppt PowerPoint Presentation Outline Example Topics
This is a financial ppt powerpoint presentation outline example topics. This is a three stage process. The stages in this process are business, marketing, analysis, finance, planning.
-
Comparison Ppt PowerPoint Presentation Infographics Graphics
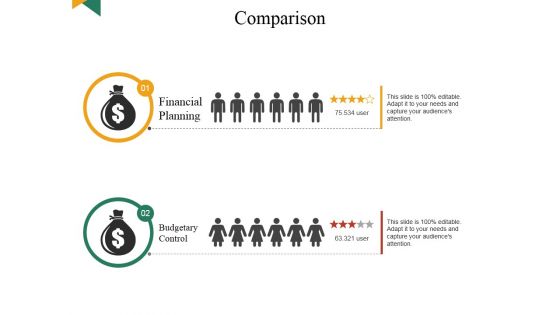
This is a comparison ppt powerpoint presentation infographics graphics. This is a two stage process. The stages in this process are budgetary control, financial planning.
-
Driving Force Behind Artificial Intelligence Maturity Ppt PowerPoint Presentation Gallery Slides
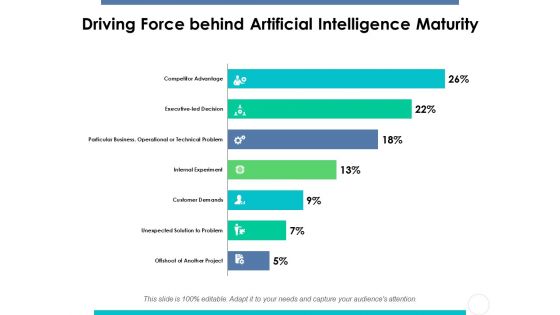
This is a driving force behind artificial intelligence maturity ppt powerpoint presentation gallery slides. This is a seven stage process. The stages in this process are driving force, artificial, intelligence, maturity, finance.
-
Bubble Chart Ppt PowerPoint Presentation Summary Graphic Tips
This is a bubble chart ppt powerpoint presentation summary graphic tips. This is a three stage process. The stages in this process are chart, business, marketing, finance, strategy.
-
Financial Ppt PowerPoint Presentation Layouts Infographic Template
This is a financial ppt powerpoint presentation layouts infographic template. This is a three stage process. The stages in this process are financial, business, marketing, strategy, icons.
-
Comparison Ppt PowerPoint Presentation Portfolio Graphics Template
This is a comparison ppt powerpoint presentation portfolio graphics template. This is a two stage process. The stages in this process are comparison, female, male.
-
Line Chart Template 2 Ppt PowerPoint Presentation Summary Design Inspiration
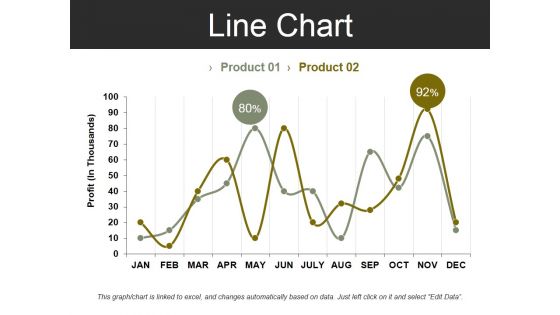
This is a line chart template 2 ppt powerpoint presentation summary design inspiration. This is a two stage process. The stages in this process are profit, business, marketing, finance, chart.
-
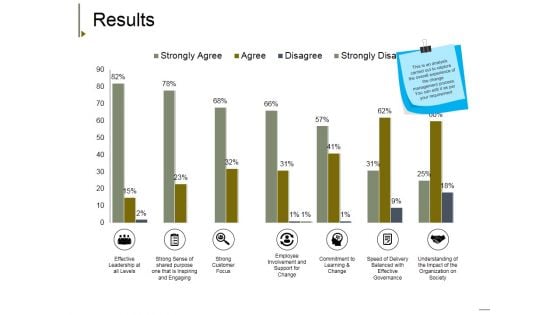
Results Ppt PowerPoint Presentation Model Gallery
This is a results ppt powerpoint presentation model gallery. This is a seven stage process. The stages in this process are effective leadership at all levels, strong sense of shared purpose one that is inspiring and engaging, strong customer focus, employee involvement and support for change, understanding of the impact of the organization on society.
-
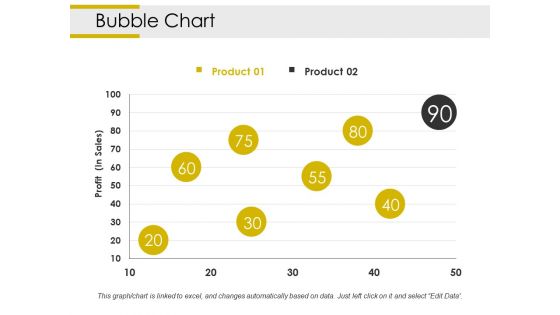
Bubble Chart Ppt PowerPoint Presentation Professional Backgrounds
This is a bubble chart ppt powerpoint presentation professional backgrounds. This is a two stage process. The stages in this process are profit, chart, business, marketing, finance.
-
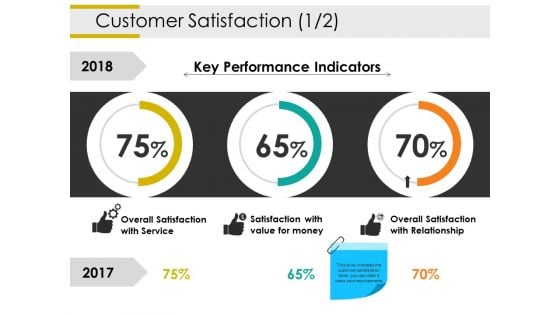
Customer Satisfaction Template 1 Ppt PowerPoint Presentation Portfolio Graphics Example
This is a customer satisfaction template 1 ppt powerpoint presentation portfolio graphics example. This is a three stage process. The stages in this process are overall satisfaction with service, satisfaction with value for money, overall satisfaction with relationship, key performance indicators, business, percentage.
-
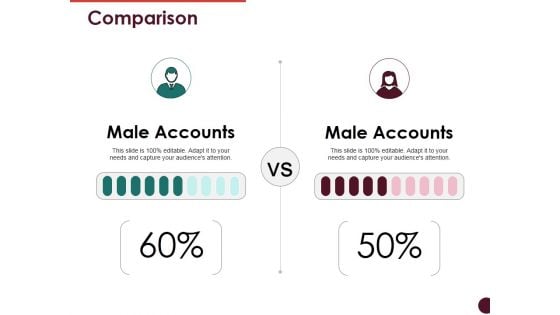
Comparison Ppt PowerPoint Presentation Infographic Template Files
This is a comparison ppt powerpoint presentation infographic template files. This is a two stage process. The stages in this process are male accounts, percentage, compare, business, management.
-
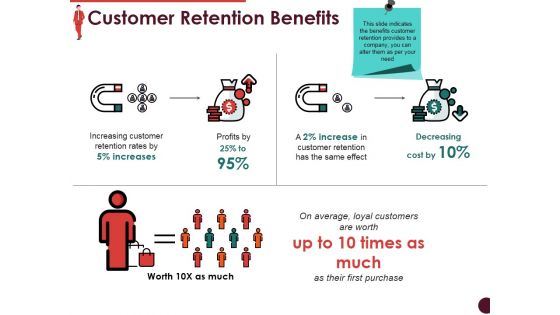
Customer Retention Benefits Ppt PowerPoint Presentation Model Ideas
This is a customer retention benefits ppt powerpoint presentation model ideas. This is a three stage process. The stages in this process are currency, finance, business, marketing, symbol.
-
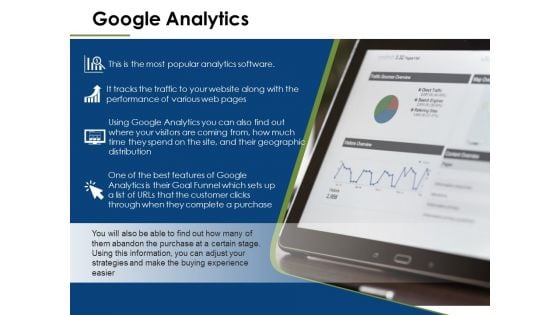
Google Analytics Ppt PowerPoint Presentation Slides Shapes
This is a google analytics ppt powerpoint presentation slides shapes. This is a one stage process. The stages in this process are marketing, management, business, strategy, business.
-
Radar Chart Ppt PowerPoint Presentation Slides Icon
This is a radar chart ppt powerpoint presentation slides icon. This is a two stage process. The stages in this process are business, marketing, growth, success, radar.
-
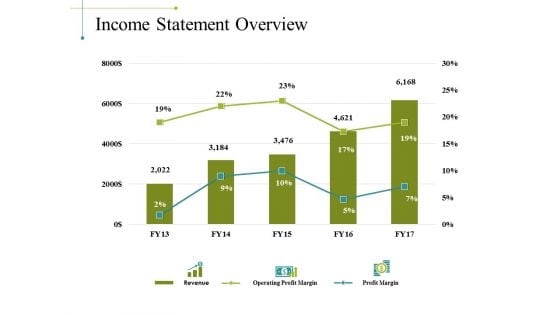
Income Statement Overview Ppt PowerPoint Presentation File Objects
This is a income statement overview ppt powerpoint presentation file objects. This is a three stage process. The stages in this process are business, market revenue, operating profit margin, profit margin.
-
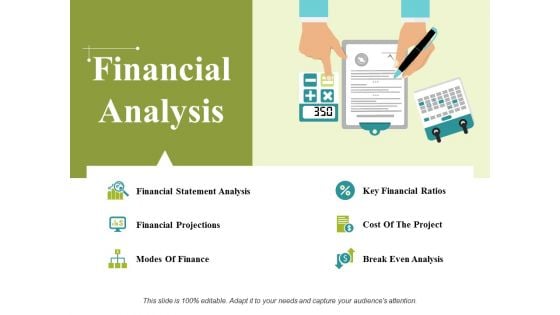
Financial Analysis Ppt PowerPoint Presentation Ideas Background Images
This is a financial analysis ppt powerpoint presentation ideas background images. This is a six stage process. The stages in this process are financial statement analysis, financial projections, modes of finance, key financial ratios, cost of the project.
-
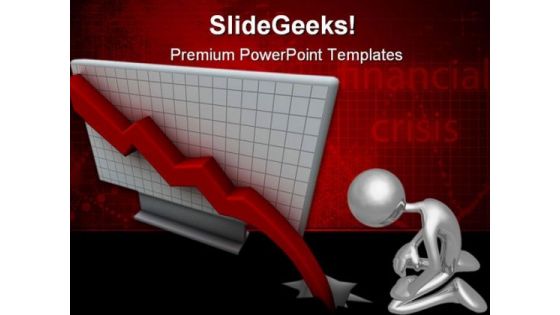
Crisis Finance PowerPoint Template 0610
3d rendered red chart that is falling down
-
Roof Solar Panels Technology PowerPoint Templates And PowerPoint Backgrounds 0211
Microsoft PowerPoint Template and Background with roof solar panels
-
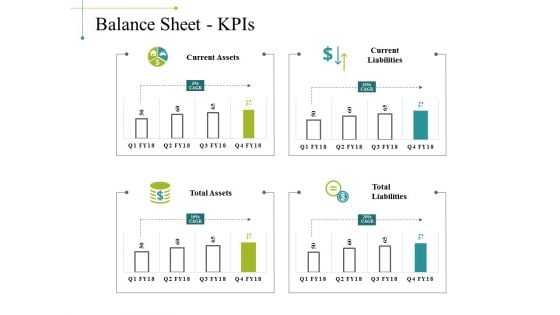
Balance Sheet Kpis Template 2 Ppt PowerPoint Presentation Gallery Example
This is a balance sheet kpis template 2 ppt powerpoint presentation gallery example. This is a four stage process. The stages in this process are business, marketing, graph, current liabilities, total liabilities.
-
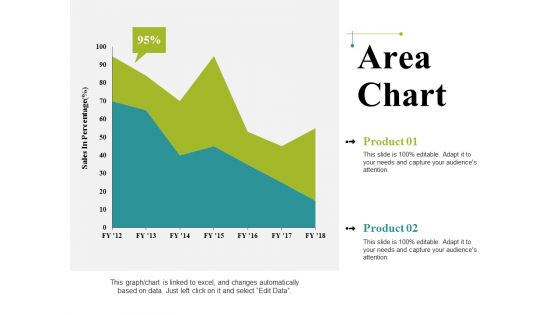
Area Chart Ppt PowerPoint Presentation Infographics Graphics Pictures
This is a area chart ppt powerpoint presentation infographics graphics pictures. This is a two stage process. The stages in this process are business, sales in percentage, area chart, marketing, graph.
-
Column Chart Ppt PowerPoint Presentation Styles Outline
This is a column chart ppt powerpoint presentation styles outline. This is a two stage process. The stages in this process are business, marketing, strategy, finance, planning.
-
Financial Ppt PowerPoint Presentation Visual Aids Styles
This is a financial ppt powerpoint presentation visual aids styles. This is a three stage process. The stages in this process are dollar, business, finance, marketing, percentage.
-
Rising Oil Prices Industrial PowerPoint Templates And PowerPoint Backgrounds 0211
Microsoft PowerPoint Template and Background with two oil barrels on top of bright green stock chart floating in a puddle of oil
-
Stock Charts Sales PowerPoint Templates And PowerPoint Backgrounds 0211
Microsoft PowerPoint Template and Background with three different stock chart 3d abstract render
-
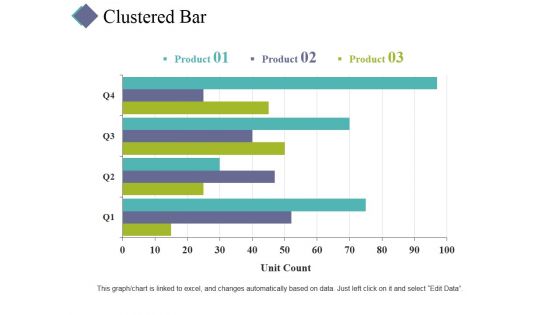
Clustered Bar Ppt PowerPoint Presentation Ideas Information
This is a clustered bar ppt powerpoint presentation ideas information. This is a three stage process. The stages in this process are clustered bar, finance, marketing, strategy, analysis.
-
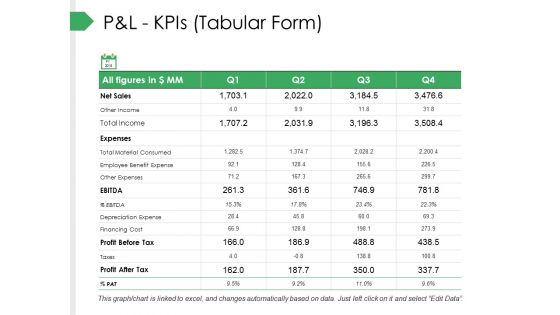
P And L Kpis Tabular Form Ppt PowerPoint Presentation Pictures Gallery
This is a p and l kpis tabular form ppt powerpoint presentation pictures gallery. This is a four stage process. The stages in this process are business, marketing, graph, strategy, finance.
-
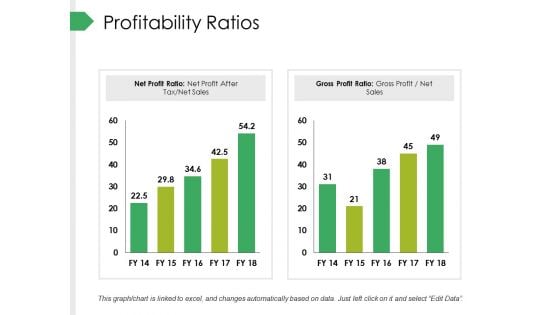
Profitability Ratios Ppt PowerPoint Presentation Summary Outline
This is a profitability ratios ppt powerpoint presentation summary outline. This is a two stage process. The stages in this process are business, net profit ratio, gross profit ratio, marketing, graph.
-
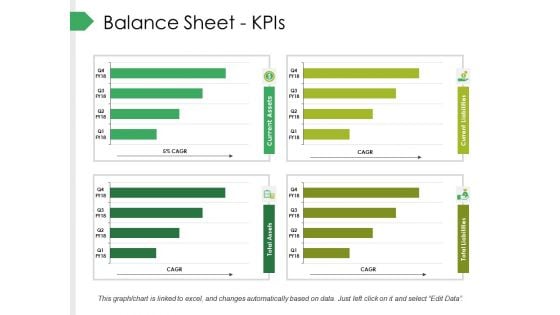
Balance Sheet Kpis Ppt PowerPoint Presentation File Picture
This is a balance sheet kpis ppt powerpoint presentation file picture. This is a four stage process. The stages in this process are business, marketing, finance, graph, cagr.
-
Line Chart Ppt PowerPoint Presentation Styles Backgrounds
This is a line chart ppt powerpoint presentation styles backgrounds. This is a three stage process. The stages in this process are business, marketing, strategy, planning, finance.
-
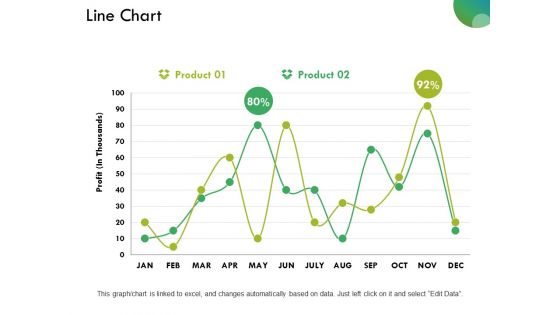
Line Chart Ppt PowerPoint Presentation Inspiration Smartart
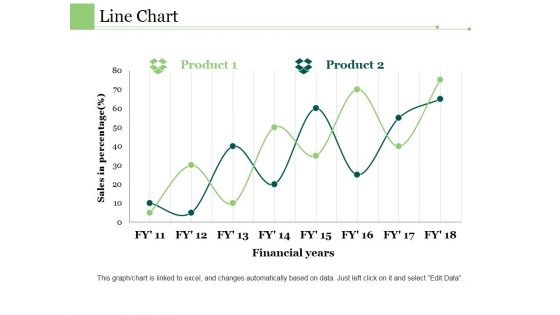
This is a line chart ppt powerpoint presentation inspiration smartart. This is a two stage process. The stages in this process are business, marketing, strategy, planning, finance.
-
Balance Sheet Kpis Ppt PowerPoint Presentation Summary Designs Download
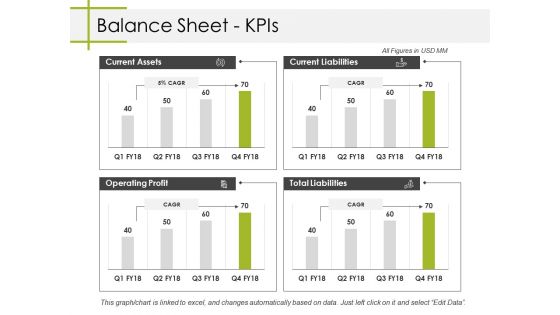
This is a balance sheet kpis ppt powerpoint presentation summary designs download. This is a four stage process. The stages in this process are current assets, current liabilities, total liabilities, operating profit, business.
-
Scatter Line Ppt PowerPoint Presentation Icon Ideas
This is a scatter line ppt powerpoint presentation icon ideas. This is a nine stage process. The stages in this process are business, marketing, strategy, planning, finance.

 Home
Home 


