Finance PowerPoint Icons
-
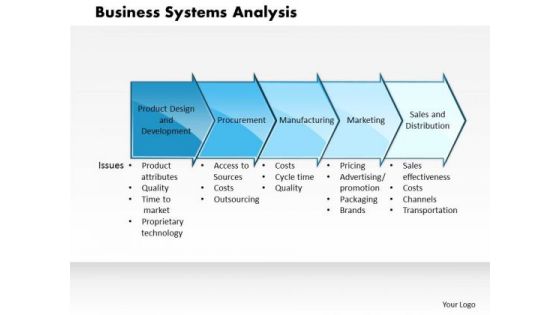
Business Framework Business Systems Analysis PowerPoint Presentation
This Power Point diagram slide has been crafted with unidirectional text box arrow diagram. This diagram slide is specially designed for business system analysis. Display analysis for any business process by using this innovative business PPT in your presentation.
-
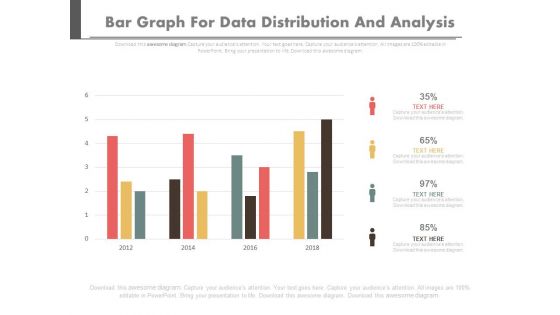
Bar Graph For Data Distribution And Analysis Powerpoint Slides
This PowerPoint template has been designed with bar graph. This PowerPoint diagram is useful for data distribution and analysis This diagram slide can be used to make impressive presentations.
-
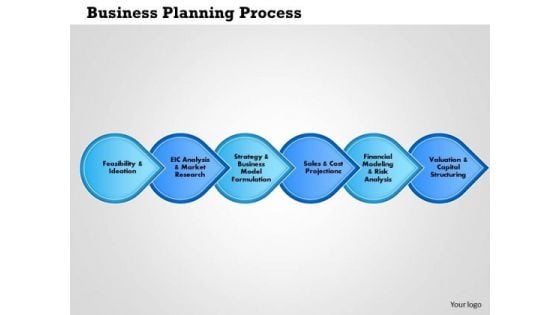
Business Framework Business Planning Process PowerPoint Presentation
a six staged linear processing diagram has been used in this power point slide. Use this Pot slide for business planning related topics. Add this planning process diagram in your business and marketing research related presentations.
-
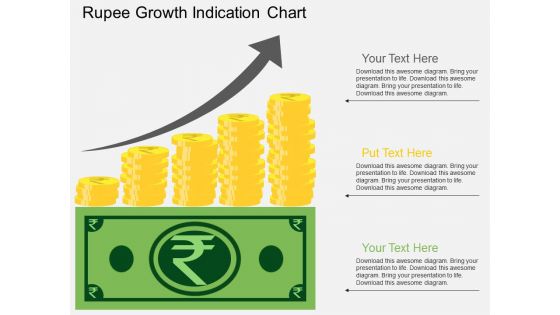
Rupee Growth Indication Chart Powerpoint Template
This business diagram displays rupee growth chart. This business diagram has been designed to implement strategic plan. Use this diagram to depict financial planning process in your presentations.
-
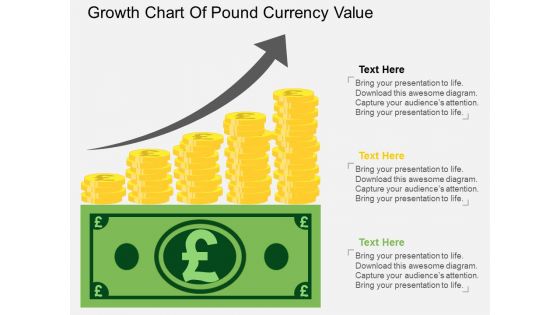
Growth Chart Of Pound Currency Value Powerpoint Template
The above PPT template displays growth chart of Pound currency. This diagram helps to exhibit Pound currency value growth. Adjust the above diagram in your business presentations to visually support your content.
-
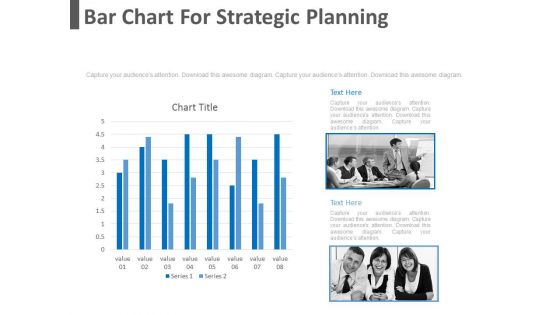
Bar Chart For Strategic Planning Powerpoint Slides
This PowerPoint template has been designed with bar graph with two teams. This diagram is useful to exhibit strategic planning. This diagram slide can be used to make impressive presentations.
-
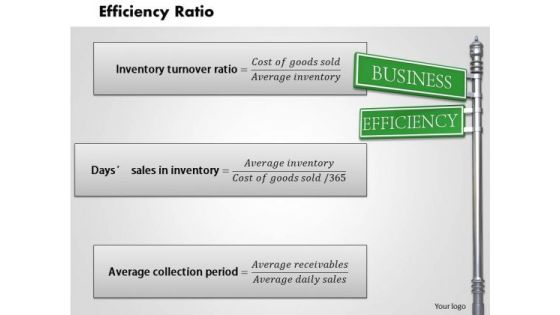
Business Framework Efficiency Ratio PowerPoint Presentation 1
This image slide has been designed to depict efficiency ratio. This image slide displays formulas to calculate average collection period, days sales in inventory, inventory turnover ratio. This image slide may be used to exhibit business marketing analysis in your presentations. This image slide will give edge to your presentations.
-
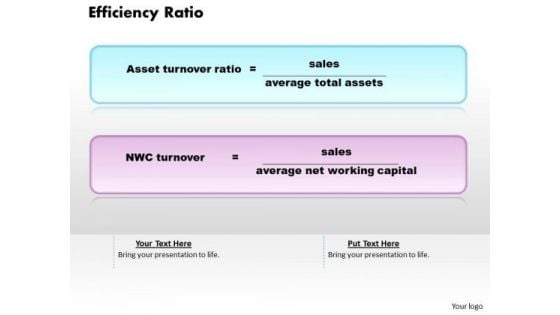
Business Framework Efficiency Ratio PowerPoint Presentation
This image slide has been designed to depict efficiency ratio. This image slide displays formulas to calculate asset turnover ratio and NWC ratio. This image slide may be used to exhibit business marketing analysis in your presentations. This image slide will give edge to your presentations.
-
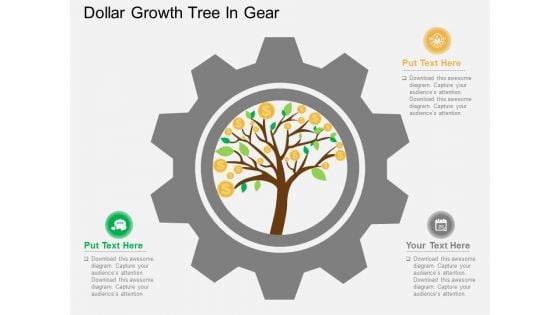
Dollar Growth Tree In Gear Powerpoint Templates
This PowerPoint slide has been designed with dollar growth tree. This diagram is designed to display financial growth planning. This professional slide helps in making an instant impact on viewers.
-
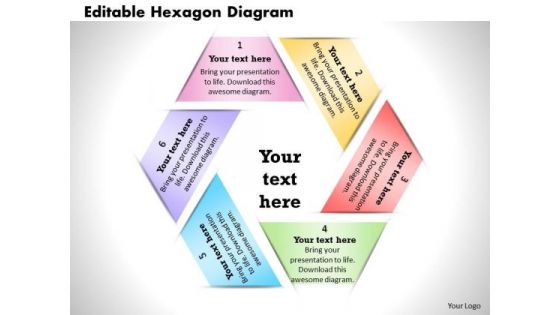
Business Framework Editable Hexagon Diagram PowerPoint Presentation
This image slide displays editable hexagon diagram. This business framework template has been designed to display various business processes in your presentations. This image slide may also be used to depict business planning process. This image slide will enhance the quality of your presentations.
-
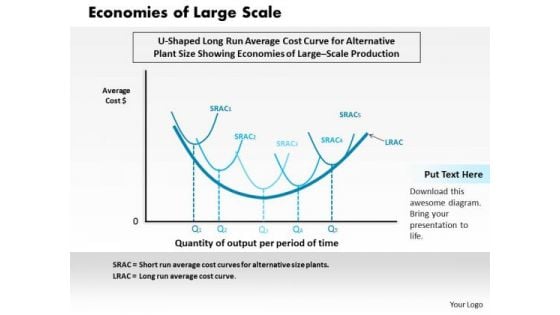
Business Framework Economies Of Large Scale PowerPoint Presentation
This image slide displays business framework for economies of large scale. This image slide may be used in your presentations to depict cost advantage for large scale firms and business financial reports. You may change color, size and orientation of any icon to your liking. Create professional presentations using this image slide.
-
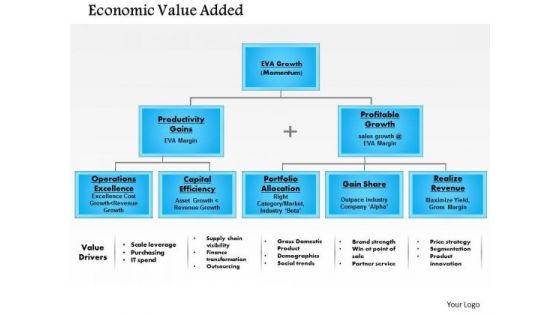
Business Framework Economic Value Add 2 PowerPoint Presentation
This image slide displays business framework for economic value added diagram. This image slide may be used in your presentations to depict firms economic profits and business financial reports. You may change color, size and orientation of any icon to your liking. Create professional presentations using this image slide.
-
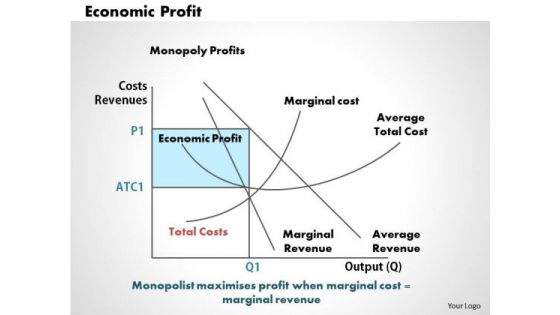
Business Framework Economic Profit PowerPoint Presentation
This image slide displays business framework for economic profit. This image slide may be used in your presentations to depict analysis in marketing profits and accounting business management. You may change color, size and orientation of any icon to your liking. Create wonderful presentations using this image slide.
-
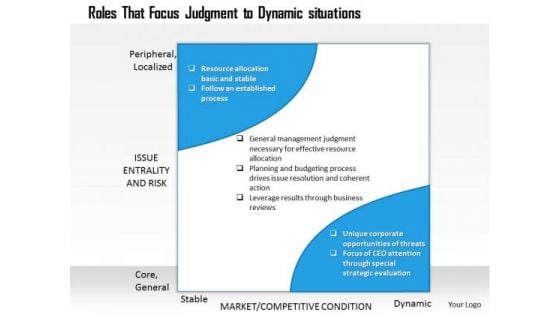
Business Framework Dynamic Situations PowerPoint Presentation
This beautiful image slide has been designed to display roles that focus judgment to dynamic situations in your presentations. This image slide may used to express views on business plan outline. You may change color, size and orientation of any icon to your liking. Create professional presentations using this image slide.
-
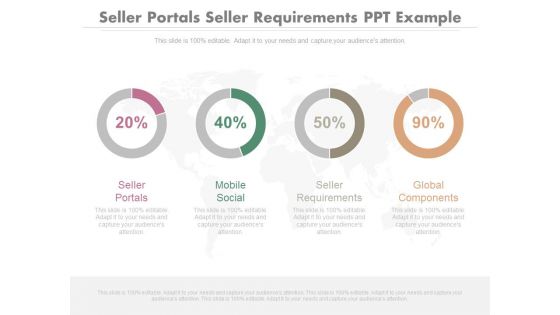
Seller Portals Seller Requirements Ppt Example
This is a seller portals seller requirements ppt example. This is a four stage process. The stages in this process are globe, finance, business, marketing.
-
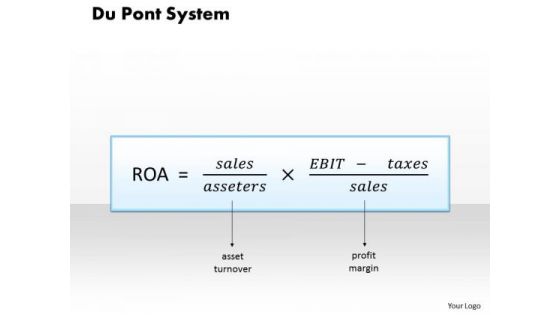
Business Framework Du Pont System PowerPoint Presentation
This beautiful image slide has been designed to display calculation formula for DuPont schema in your presentations. This image slide may be used in business and marketing presentations. You may change color, size and orientation of any icon to your liking. Create professional presentations using this image slide.
-
Business Framework Du Pont Schema PowerPoint Presentation
This beautiful image slide has been designed to display DuPont schema flow chart process in your presentations. This image slide may be used in business and marketing presentations. You may change color, size and orientation of any icon to your liking. Create professional presentations using this image slide.
-
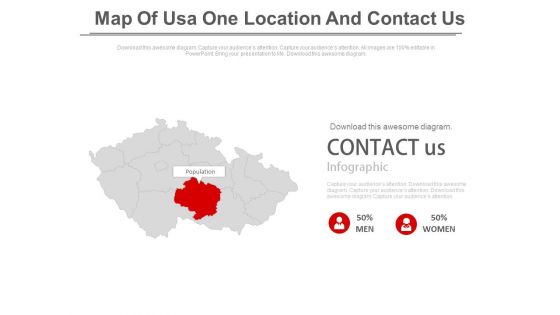
Map Of Usa With Contact Us Text Powerpoint Slides
This PowerPoint template has been designed with USA Map and contact us text. You may use this slide to display contact details and location. This diagram provides an effective way of displaying information you can edit text, color, shade and style as per you need.
-
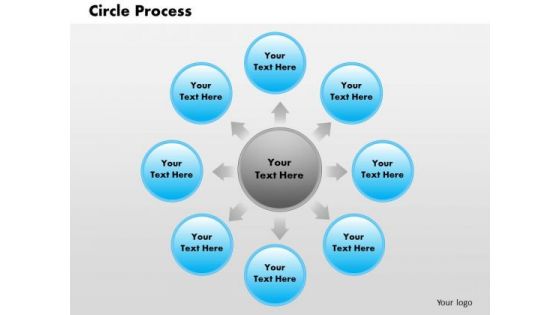
Business Framework Circle Process PowerPoint Presentation
A five staged multicolored circular process chart has been used to decorate this PPT. this business framework PPT is usable for various process flow with multiple levels. Use this PPT in your presentation and get good comments from viewers.
-
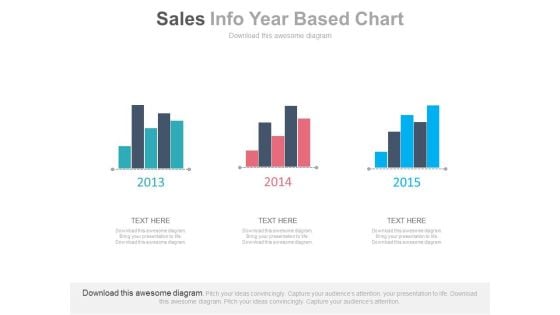
Three Years Sales Data Bar Graph Powerpoint Slides
This PowerPoint template has been designed with bar charts. This business slide may be used to display three years sales data for comparison. Present your views and ideas with this impressive design.
-
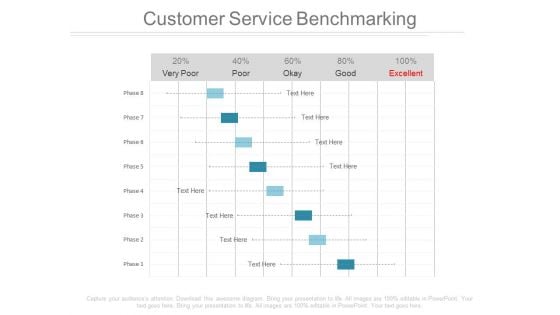
Customer Service Benchmarking Ppt Slides
This is a customer service benchmarking ppt slides. This is a eight stage process. The stages in this process are success, business, marketing.
-
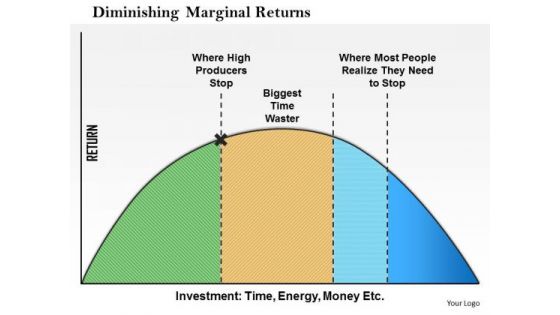
Business Framework Diminishing Marginal Returns PowerPoint Presentation
This image slide displays business framework for diminishing marginal returns. This image slide may be used in your presentations to depict business planning and market analysis. You may change color, size and orientation of any icon to your liking. Create wonderful presentations using this image slide.
-
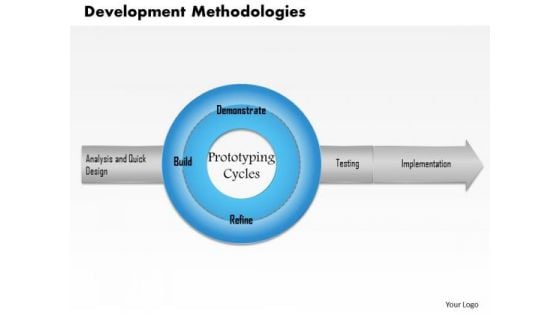
Business Framework Development Methodologies PowerPoint Presentation
This image slide displays business framework for development methodologies. This image slide may be used in your presentations to express views on business, marketing, research and analysis. You may change color, size and orientation of any icon to your liking. Create professional presentations using this image slide.
-
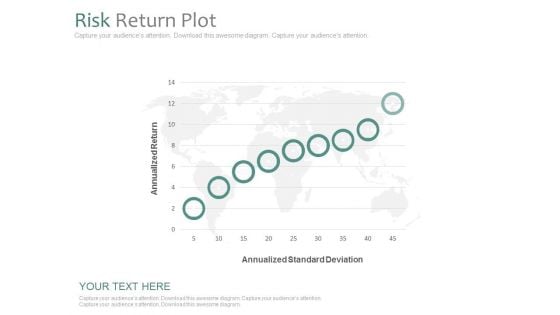
Risk Return Plot Ppt Slides
This is a risk return plot ppt slides. This is a nine stage process. The stages in this process are business, finance, marketing.
-
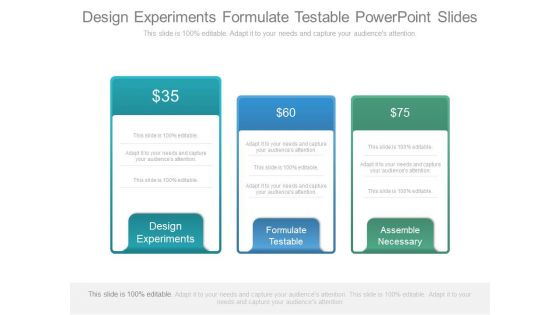
Design Experiments Formulate Testable Powerpoint Slides
This is a design experiments formulate testable powerpoint slides. This is a Three stage process. The stages in this process are finance, success, business, marketing.
-
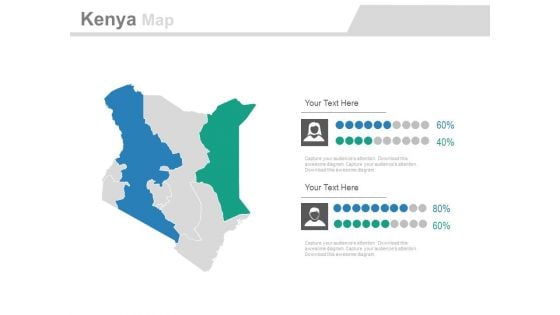
Map Of Kenya With Gender Population Analysis Powerpoint Slides
This PowerPoint map template has been designed with map of Kenya and male female icons. Use these maps to display gender population analysis in your presentations. Any text can be entered at any point in the PowerPoint map slide.
-
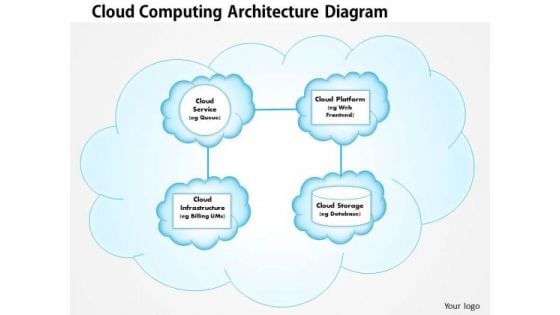
Business Framework Cloud Computing Architecture PowerPoint Presentation
Explain the details of cloud computing in any technical presentation by using this exclusive power point diagram slide. To display concept of cloud computing we have used graphic of cloud computing architecture. Make a good quality technical presentation for your viewers with this unique PPT slide.
-
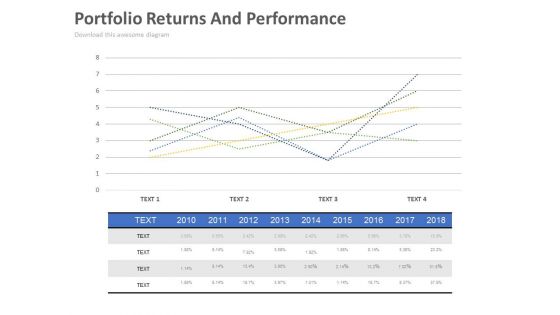
Portfolio Returns And Performance Ppt Slides
This is a portfolio returns and performance ppt slides. This is a five stage process. The stages in this process are business, finance, marketing, time planning.
-
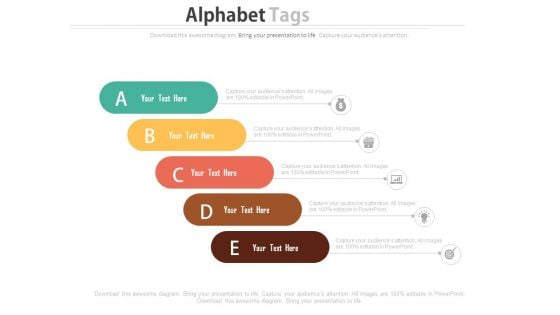
Alphabet Steps For Financial Strategy Analysis Powerpoint Slides
This PowerPoint template has been designed with alphabet steps with icons. This PPT slide may be used to display financial strategy analysis. Make outstanding business presentation with this template.
-
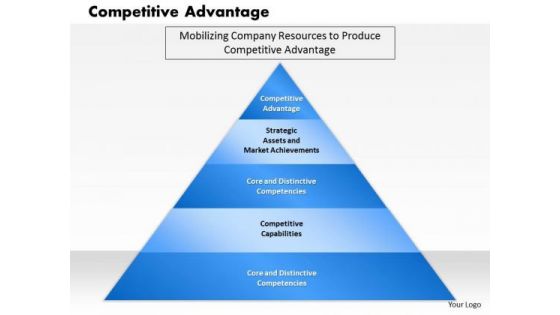
Business Framework Competitive Advantage PowerPoint Presentation 2
This image slide displays business framework for competitive advantage. Use this image slide to express views on company resources to produce competitive advantage. You may change color size and orientation of any icon to your liking. This image slide will enhance the quality of presentations.
-
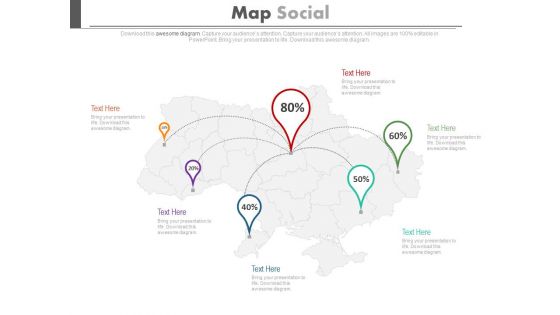
Map With Location Pointers And Percentage Ratios Powerpoint Slides
This PowerPoint map template has been carefully created by our professional team to display location and other geographic details. Each and every property of any region - color, size, shading etc can be modified to help you build an effective PowerPoint presentation. Use this map diagram to display sales territories, business and new office locations, travel planning etc.
-
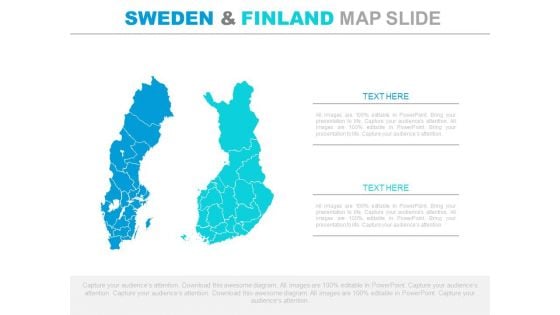
Sweden And Finland Map For Business Analysis Powerpoint Slides
This PowerPoint template has been designed with Sweden and Finland map. Each and every property of any region - color, size, shading etc can be modified to help you build an effective PowerPoint presentation. Use these maps to show sales territories, business and new office locations, travel planning etc in your presentations.
-
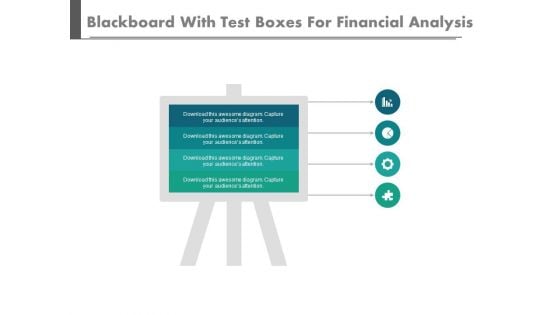
Display Board Infographic Business Diagram Powerpoint Slides
This PowerPoint template contains infographic diagram of display board. You may download this PPT slide design to display steps of strategic planning. You can easily customize this template to make it more unique as per your need.
-
Five Boxes With Icons For Strategic Planning Powerpoint Slides
This PowerPoint template contains graphics of five boxes with icons. You may download this PPT slide design to display steps of strategic planning. You can easily customize this template to make it more unique as per your need.
-
Five Tags For Marketing Information Management Powerpoint Slides
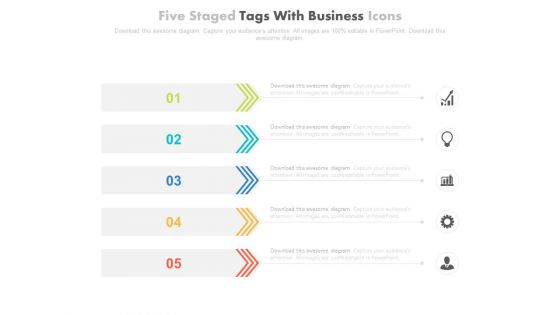
This PowerPoint template contains graphics of five tags with icons. You may download this slide for marketing information management. You can easily customize this template to make it more unique as per your need.
-
Circular Diagram For Percentage Analysis Powerpoint Slides
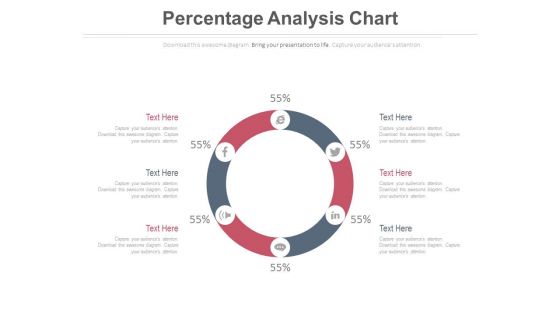
This PowerPoint slide has been designed with circular diagram with social media icons. This diagram slide may be used to display users of social media. Prove the viability of your ideas with this professional slide.
-
Business Framework Basic Pharmaceutical Industry Scenarios PowerPoint Presentation
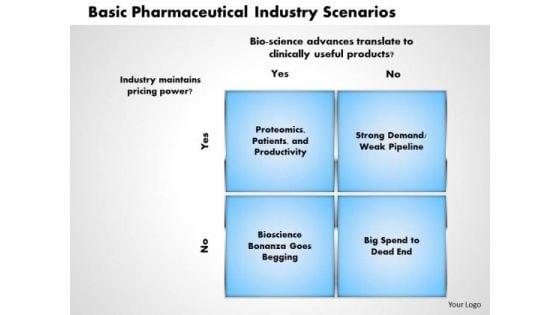
Define the scenarios of any pharmaceutical industry with this power point diagram slide. We have used graphic of blue colored square with four sections. Each sections can be used to show different scenario. Use this diagram slide for pharma company related scenario and presentations based on those scenarios.
-
Business Framework Animated Graphics PowerPoint Presentation
This diagram is a simple diagram that provides overview of a continuing sequence of stages, tasks. This is an effective way of displaying information you may edit text, color, shade and style as per you need.
-
Business Framework Crossing The Chasm PowerPoint Presentation 1
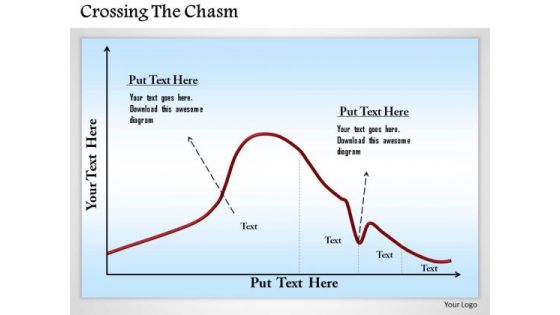
This innovative image slide has been designed to display crossing the chasm strategic framework. This business framework template may be used in your presentations to depict business marketing plan. This image slide will help you make professional presentations.
-
Three Tags For Accounting Equation Powerpoint Slides
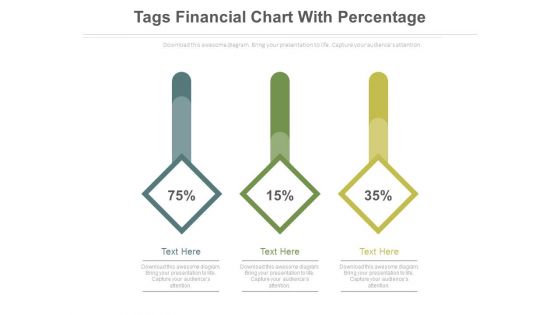
This PowerPoint template contains diagram of three tags. You may download this PPT slide design to display accounting equation. You can easily customize this template to make it more unique as per your need.
-
Business Framework Ansoff Product Matrix PowerPoint Presentation
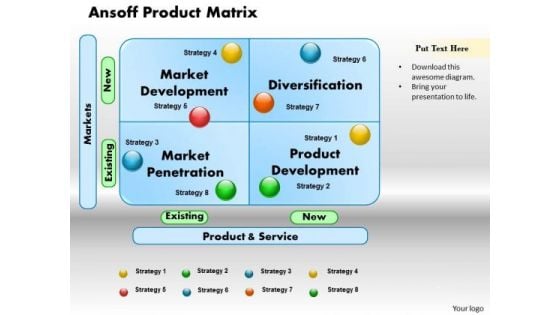
The Ansoff Matrix, designed by Igor Ansoff, classifies and explains different growth strategies for a company. Use this diagram to explain diversification strategies of a new product.
-
Four Steps For Financial Data Analysis Powerpoint Slides
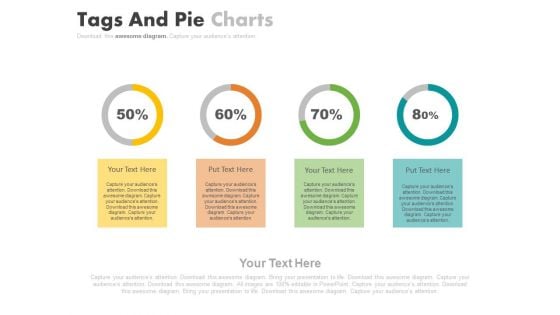
This PowerPoint contains four circles with percentage values. Download this diagram slide to display financial data analysis. This template is editable, You can edit text, color, shade and style of this diagram as per you need.
-
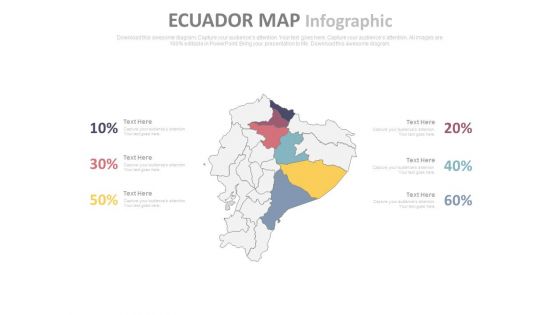
Ecuador Map With Six Different Locations And Percentage Values Powerpoint Slides
This PowerPoint template displays graphics of Ecuador map with six different locations and percentage values. This Map template can be used in business presentations to depict economic analysis. This slide can also be used by school students for educational projects.
-
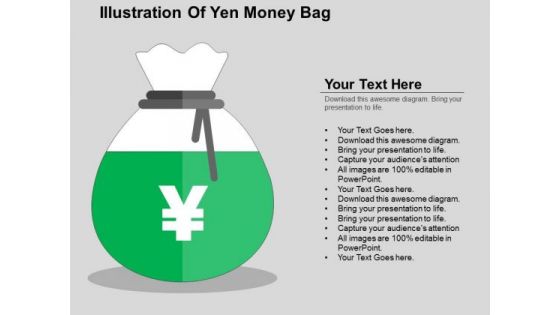
Illustration Of Yen Money Bag PowerPoint Templates
Define your message in convincing manner with this diagram slide. This PPT slide contains graphics of Yen money bag. Download this PPT slide to make finance related presentation.
-
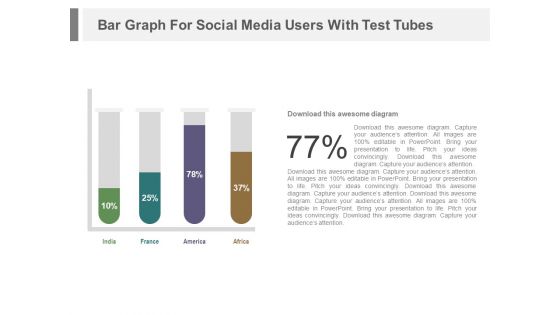
Test Tubes With Financial Data In Percentage Ratio Powerpoint Slides
This PowerPoint template contains graphics of test tubes with percentage values. You may download this PPT slide design to display financial ratio analysis. You can easily customize this template to make it more unique as per your need.
-
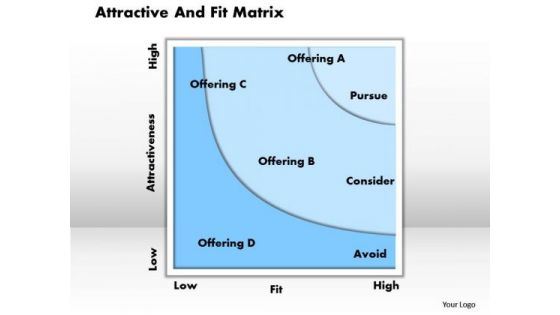
Business Framework Attractive And Fit Matrix PowerPoint Presentation
Walk your team through your plans using our attractive and fit matrix PowerPoint presentation slide template. See their energy levels rise as you show them the way. This diagram is perfect to make professional presentations.
-
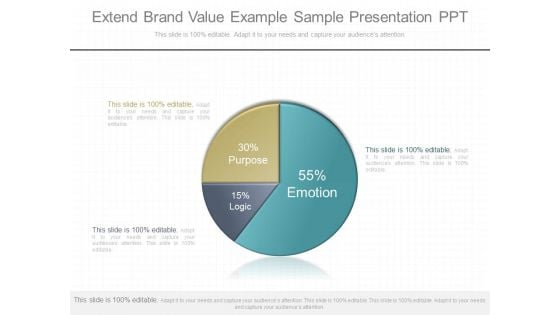
Extend Brand Value Example Sample Presentation Ppt
This is a extend brand value example sample presentation ppt. This is a three stage process. The stages in this process are purpose, logic, emotion.\n\n\n\n\n\n\n\n\n\n\n\n
-
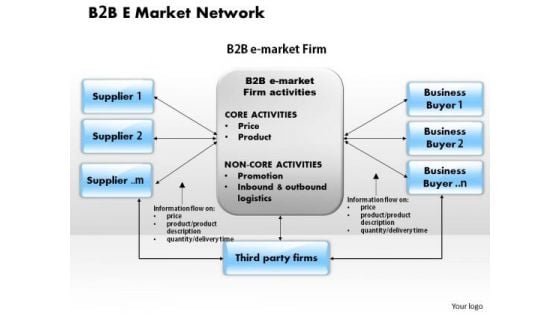
Business Framework B 2 B E Market Network PowerPoint Presentation
This diagram displays b 2 b e market network. Use this diagram in your presentation and make it more effective. This pre designed high quality business diagram will make your presentation simply the best.
-
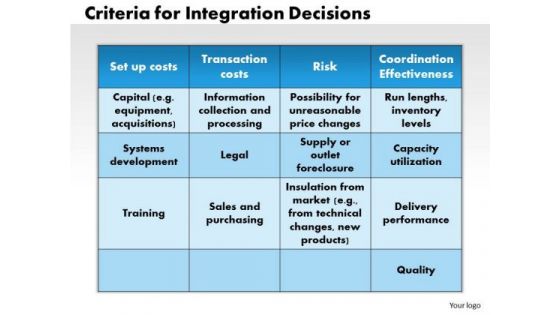
Business Framework Criteria For Integration Decisions PowerPoint Presentation
This innovative image slide has been designed to depict criteria for integration decisions. This business framework template may be used in your presentations to display business marketing plan. This image slide will enhance the quality of your presentations.
-
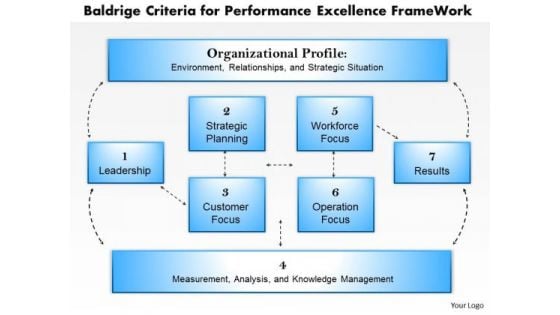
Business Framework Baldrige Criteria For Performance Excellence Frame Work PowerPoint Presentation
This business power point slide has been designed with graphic of performance excellence frame work. This frame work is used to explain baldrige criteria. This framework is usable for various business criteria. Use this diagram slide and build quality presentation for your viewers.
-
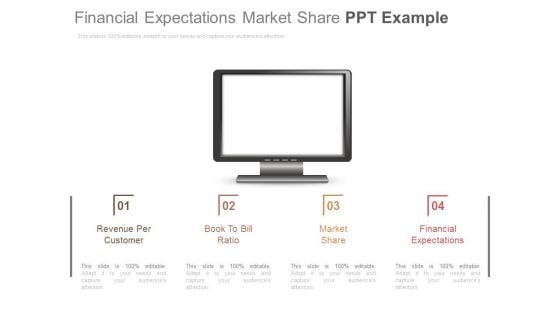
Financial Expectations Market Share Ppt Example
This is a financial expectations market share ppt example. This is a four stage process. The stages in this process are finance, computer, technology.
-
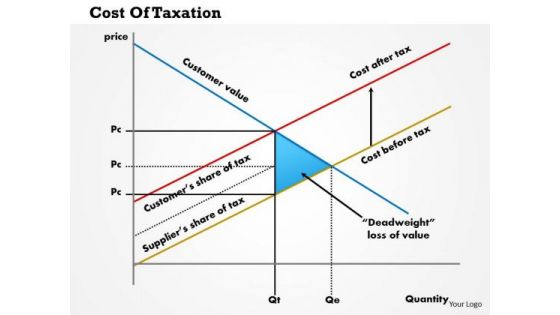
Business Framework Cost Of Taxation PowerPoint Presentation
This innovative image slide has been designed to display coat of taxation graph. This business framework template may be used to display financial ratios of taxation in your presentations. This image slide will impart professional appearance to your presentations.
-
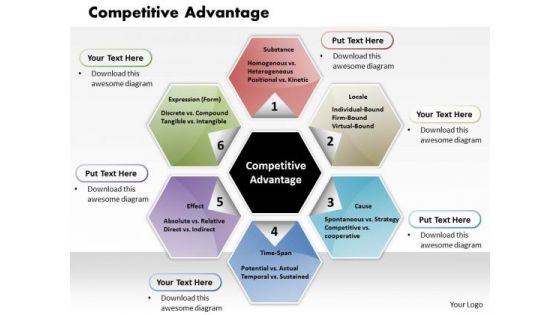
Business Framework Competitive Advantage PowerPoint Presentation
This image slide displays competitive advantage in business. This image slide has been crafted to depict different business strategies. Use this image slide, in your presentations to express views on strategic management models template. This image slide will enhance the quality of your presentations.
-
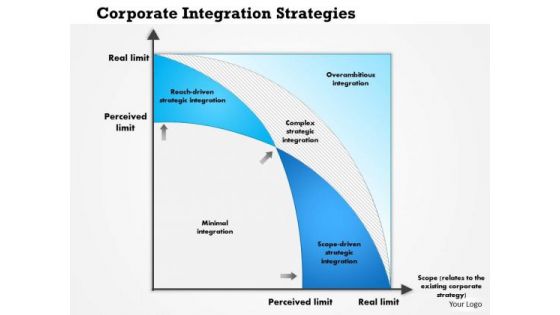
Business Framework Corporate Integration Strategies PowerPoint Presentation
This innovative image slide has been designed to display graph for corporate integration strategies. This business framework template may be used to display corporate strategy management in your presentations. This image slide will enhance the quality of your presentations.
-
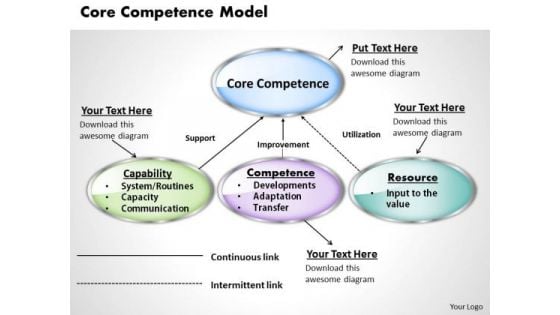
Business Framework Core Competence Model PowerPoint Presentation
This innovative image slide has been designed to display core competence model. This image slide may be used to express views on business and marketing management in your presentations. Give edge to your presentations using this image slide.
-
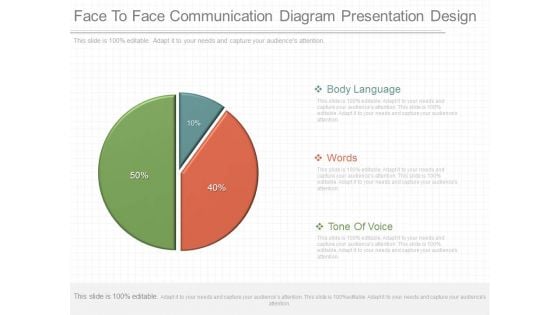
Face To Face Communication Diagram Presentation Design
This is a face to face communication diagram presentation design. This is a three stage process. The stages in this process are body language, words, tone of voice.
-
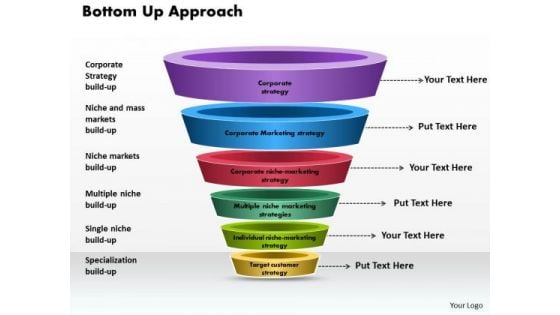
Business Framework Bottom Up Approach PowerPoint Presentation
This power point diagram slide has been crafted with bottom up approach. In this diagram, we have used multilevel funnel diagram with individual state. Use this diagram for your financial presentations and display bottom up approach in an graphical manner.
-
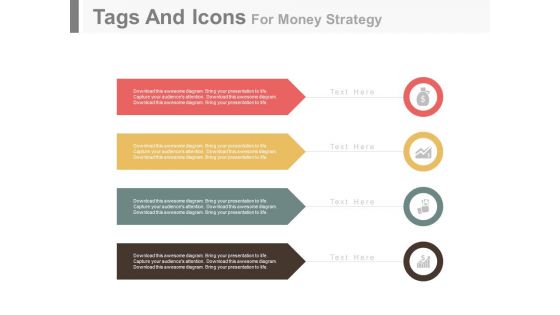
Four Tags For Marketing Performance Measurement Powerpoint Slides
This PowerPoint template contains graphics of four text tags with icons. You may download this PPT slide design to display marketing performance measurement. You can easily customize this template to make it more unique as per your need.
-
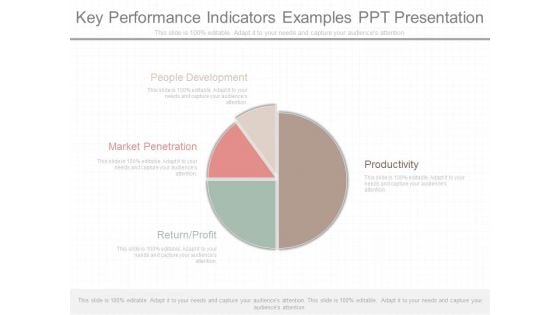
Key Performance Indicators Examples Ppt Presentation
This is a key performance indicators examples ppt presentation. This is a four stage process. The stages in this process are people development, productivity, market penetration, return profit.
-
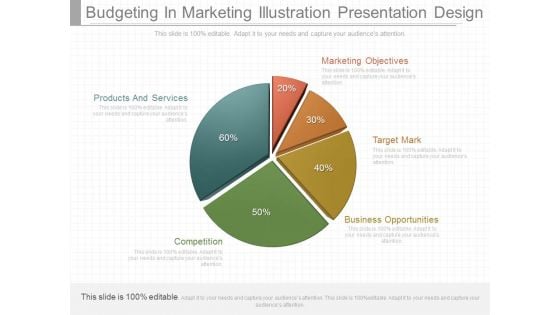
Budgeting In Marketing Illustration Presentation Design
This is a budgeting in marketing illustration presentation design. This is a five stage process. The stages in this process are products and services, marketing objectives, target mark, business opportunities, competition.

 Home
Home 


