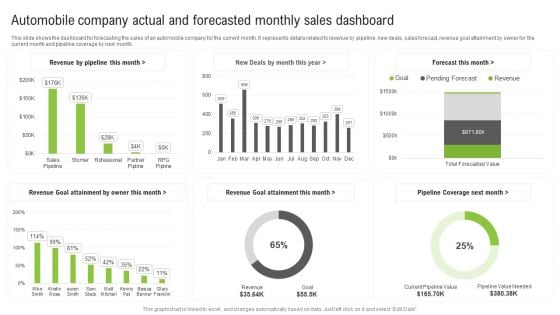
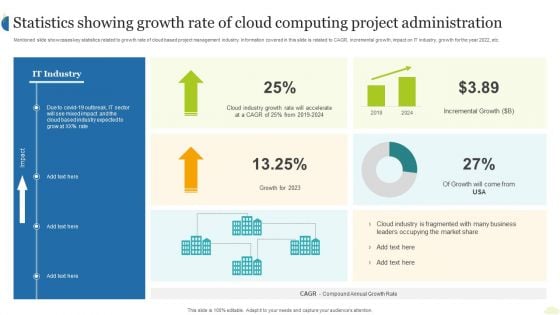
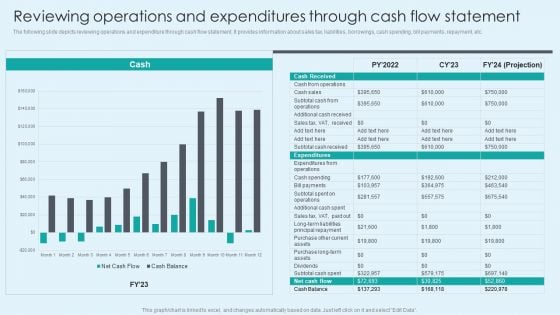
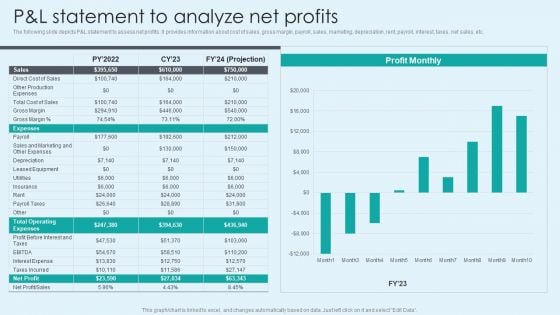
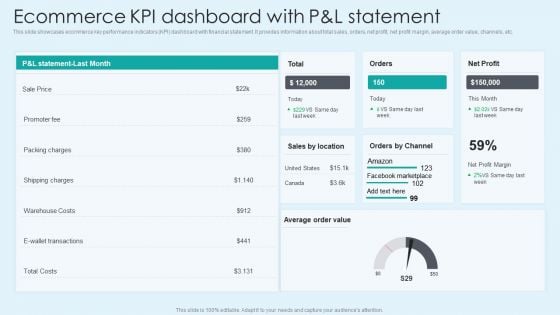
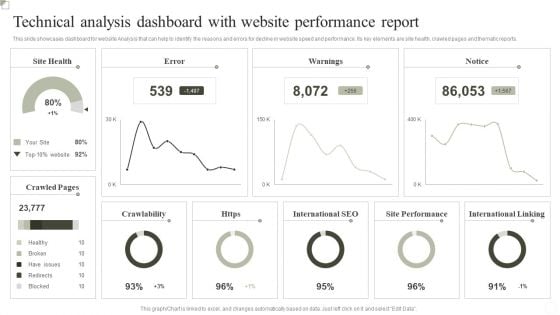
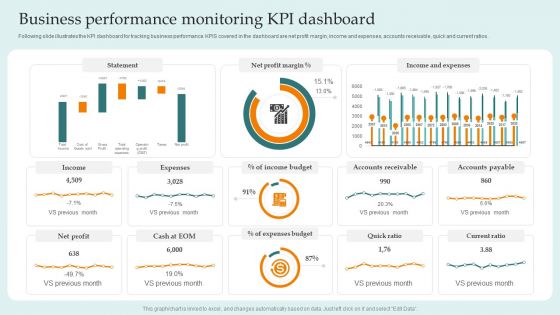
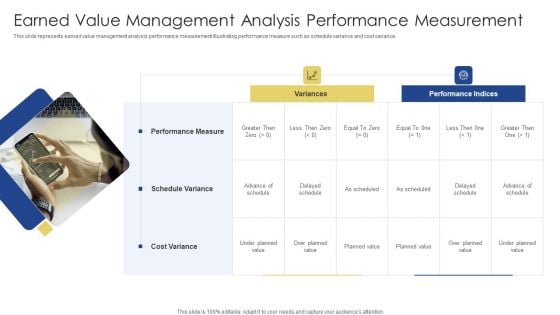
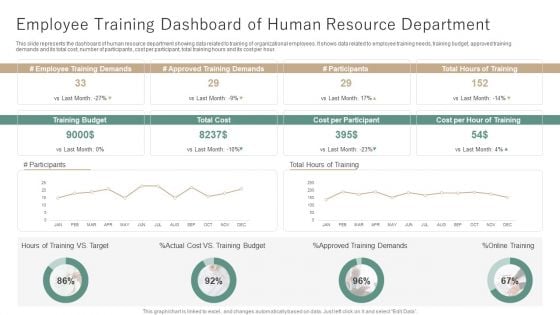
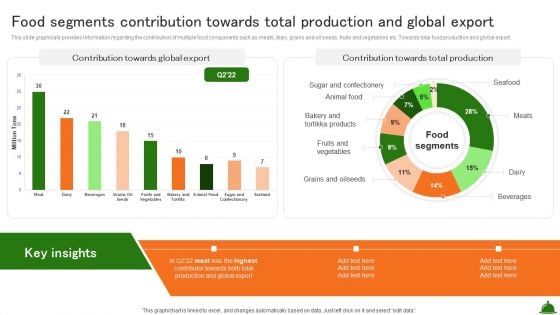
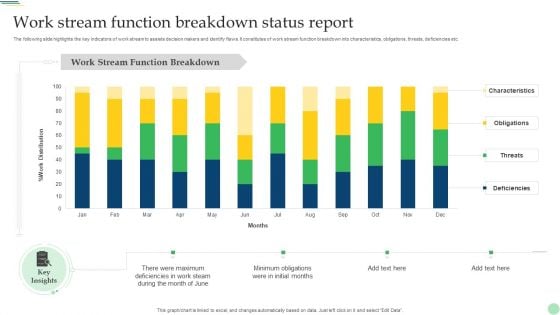
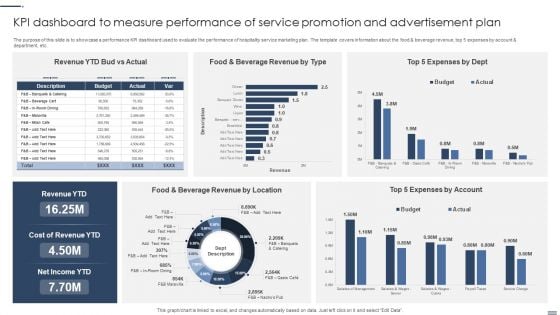
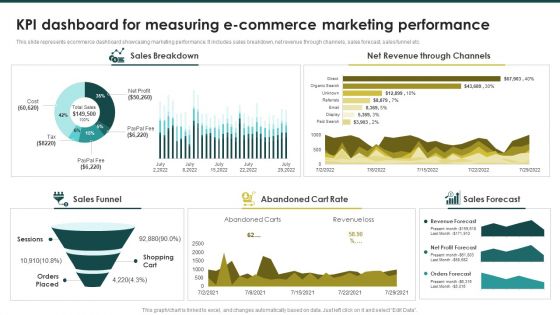
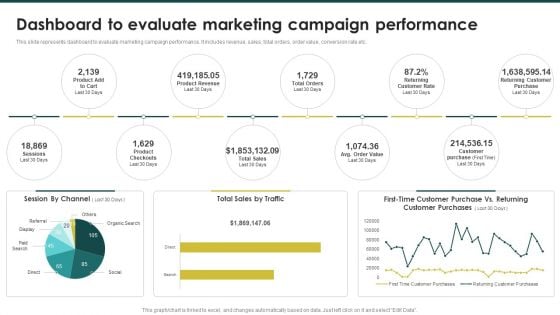
Finance PowerPoint Icons
-
Two Consecutive Years Revenue Comparison Topics PDF
This slide showcases profitability comparison with the help of a trend chart. It represents revenue, cost of goods sold, gross profit, net profit, etc. Pitch your topic with ease and precision using this Two Consecutive Years Revenue Comparison Topics PDF. This layout presents information on Revenue, Gross Profit, Net Income. It is also available for immediate download and adjustment. So, changes can be made in the color, design, graphics or any other component to create a unique layout.
-
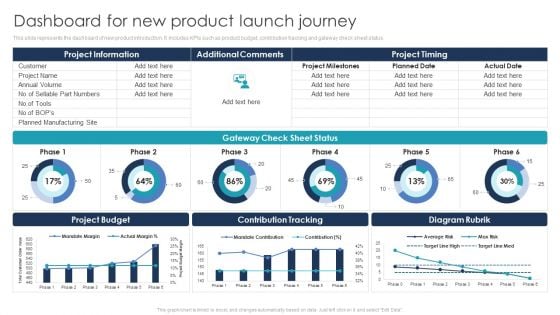
Dashboard For New Product Launch Journey Background PDF
This slide represents the dashboard of new product introduction. It includes KPIs such as product budget, contribution tracking and gateway check sheet status. Showcasing this set of slides titled Dashboard For New Product Launch Journey Background PDF. The topics addressed in these templates are Project Information, Project Budget, Contribution Tracking. All the content presented in this PPT design is completely editable. Download it and make adjustments in color, background, font etc. as per your unique business setting.
-
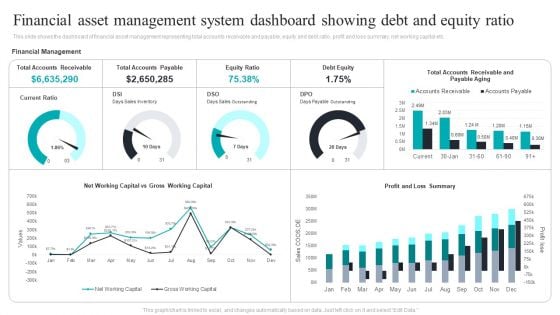
Financial Asset Management System Dashboard Showing Debt And Equity Ratio Graphics PDF
This slide shows the dashboard of financial asset management representing total accounts receivable and payable, equity and debt ratio, profit and loss summary, net working capital etc. Showcasing this set of slides titled Financial Asset Management System Dashboard Showing Debt And Equity Ratio Graphics PDF. The topics addressed in these templates are Financial Asset, Management System, Debt And Equity Ratio. All the content presented in this PPT design is completely editable. Download it and make adjustments in color, background, font etc. as per your unique business setting.
-
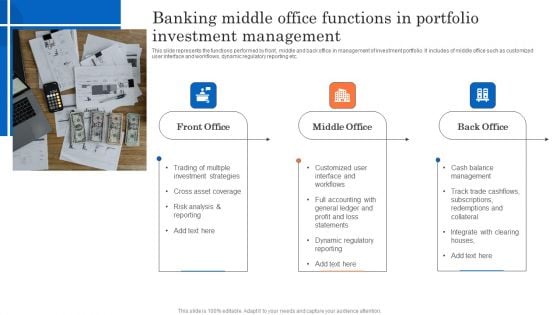
Banking Middle Office Functions In Portfolio Investment Management Information PDF
This slide represents the functions performed by front, middle and back office in management of investment portfolio. It includes of middle office such as customized user interface and workflows, dynamic regulatory reporting etc. Persuade your audience using this Banking Middle Office Functions In Portfolio Investment Management Information PDF. This PPT design covers three stages, thus making it a great tool to use. It also caters to a variety of topics including Front Office, Middle Office, Back Office. Download this PPT design now to present a convincing pitch that not only emphasizes the topic but also showcases your presentation skills.
-
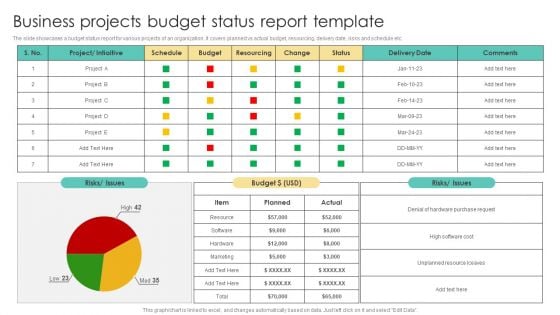
Business Projects Budget Status Report Template Topics PDF
The slide showcases a budget status report for various projects of an organization. It covers planned vs actual budget, resourcing, delivery date, risks and schedule etc. Showcasing this set of slides titled Business Projects Budget Status Report Template Topics PDF. The topics addressed in these templates are Business Projects, Budget Status, Report Template. All the content presented in this PPT design is completely editable. Download it and make adjustments in color, background, font etc. as per your unique business setting.
-
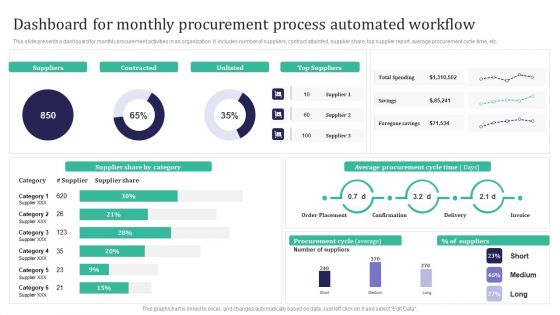
Integration Automation Dashboard For Monthly Procurement Process Automated Introduction PDF
This slide presents a dashboard for monthly procurement activities in an organization. It includes number of suppliers, contract attainted, supplier share, top supplier report, average procurement cycle time, etc. Slidegeeks is here to make your presentations a breeze with Integration Automation Dashboard For Monthly Procurement Process Automated Introduction PDF With our easy-to-use and customizable templates, you can focus on delivering your ideas rather than worrying about formatting. With a variety of designs to choose from, youre sure to find one that suits your needs. And with animations and unique photos, illustrations, and fonts, you can make your presentation pop. So whether youre giving a sales pitch or presenting to the board, make sure to check out Slidegeeks first.
-
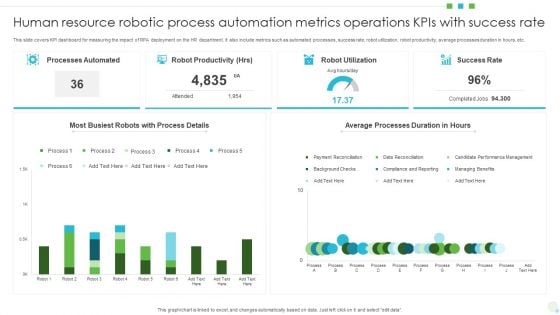
Human Resource Robotic Process Automation Metrics Operations Kpis With Success Rate Themes PDF
This slide covers KPI dashboard for measuring the impact of RPA deployment on the HR department. It also include metrics such as automated processes, success rate, robot utilization, robot productivity, average processes duration in hours, etc. Showcasing this set of slides titled Human Resource Robotic Process Automation Metrics Operations Kpis With Success Rate Themes PDF. The topics addressed in these templates are Processes Automated, Robot Productivity, Robot Utilization. All the content presented in this PPT design is completely editable. Download it and make adjustments in color, background, font etc. as per your unique business setting.
-
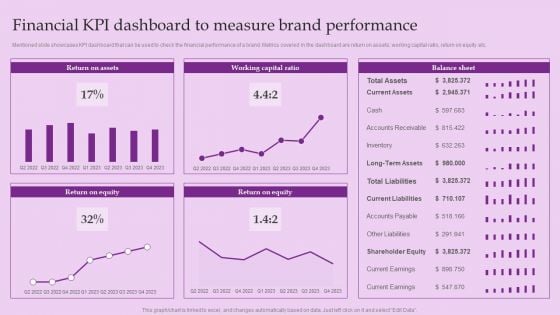
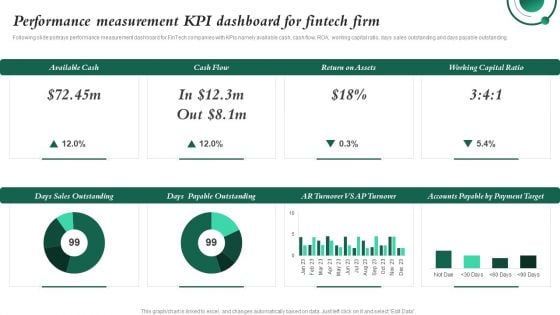
Financial KPI Dashboard To Measure Brand Performance Brand And Equity Evaluation Techniques Elements PDF
Mentioned slide showcases KPI dashboard that can be used to check the financial performance of a brand. Metrics covered in the dashboard are return on assets, working capital ratio, return on equity etc.Coming up with a presentation necessitates that the majority of the effort goes into the content and the message you intend to convey. The visuals of a PowerPoint presentation can only be effective if it supplements and supports the story that is being told. Keeping this in mind our experts created Financial KPI Dashboard To Measure Brand Performance Brand And Equity Evaluation Techniques Elements PDF to reduce the time that goes into designing the presentation. This way, you can concentrate on the message while our designers take care of providing you with the right template for the situation.
-
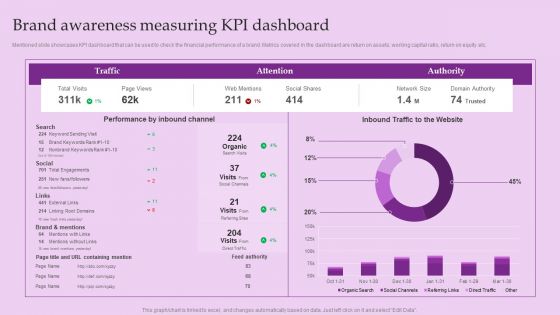
Brand Awareness Measuring Kpi Dashboard Brand And Equity Evaluation Techniques Ideas PDF
Mentioned slide showcases KPI dashboard that can be used to check the financial performance of a brand. Metrics covered in the dashboard are return on assets, working capital ratio, return on equity etc.From laying roadmaps to briefing everything in detail, our templates are perfect for you. You can set the stage with your presentation slides. All you have to do is download these easy-to-edit and customizable templates. Brand Awareness Measuring Kpi Dashboard Brand And Equity Evaluation Techniques Ideas PDF will help you deliver an outstanding performance that everyone would remember and praise you for. Do download this presentation today.
-
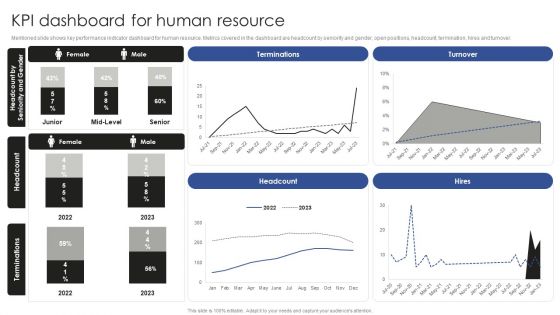
Talent Administration And Succession KPI Dashboard For Human Resource Rules PDF
Mentioned slide shows key performance indicator dashboard for human resource. Metrics covered in the dashboard are headcount by seniority and gender, open positions, headcount, termination, hires and turnover. If your project calls for a presentation, then Slidegeeks is your go-to partner because we have professionally designed, easy-to-edit templates that are perfect for any presentation. After downloading, you can easily edit Talent Administration And Succession KPI Dashboard For Human Resource Rules PDF and make the changes accordingly. You can rearrange slides or fill them with different images. Check out all the handy templates
-
Robotic Process Automation Dashboard With Monthly Test Execution KPI Icons PDF
This slide covers RPA metrics for analyzing test execution on automated platforms. It also includes test execution metrics such as total test executed, test status, tests executed daily for different operation systems, etc. Pitch your topic with ease and precision using this Robotic Process Automation Dashboard With Monthly Test Execution KPI Icons PDF. This layout presents information on Robotic Process Automation Dashboard, Monthly Test Execution Kpi. It is also available for immediate download and adjustment. So, changes can be made in the color, design, graphics or any other component to create a unique layout.
-
Talent Administration And Succession Determining Employee Headcount Average Tenure Inspiration PDF
Following slide displays informational stats about employee headcount and average tenure. It also includes a graph that shows stats about hiring and turnover rate. Slidegeeks is here to make your presentations a breeze with Talent Administration And Succession Determining Employee Headcount Average Tenure Inspiration PDF With our easy-to-use and customizable templates, you can focus on delivering your ideas rather than worrying about formatting. With a variety of designs to choose from, youre sure to find one that suits your needs. And with animations and unique photos, illustrations, and fonts, you can make your presentation pop. So whether youre giving a sales pitch or presenting to the board, make sure to check out Slidegeeks first.
-
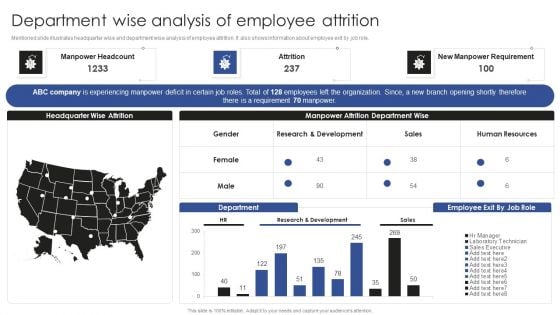
Talent Administration And Succession Department Wise Analysis Of Employee Attrition Introduction PDF
Mentioned slide illustrates headquarter wise and department wise analysis of employee attrition. It also shows information about employee exit by job role. Present like a pro with Talent Administration And Succession Department Wise Analysis Of Employee Attrition Introduction PDF Create beautiful presentations together with your team, using our easy-to-use presentation slides. Share your ideas in real-time and make changes on the fly by downloading our templates. So whether youre in the office, on the go, or in a remote location, you can stay in sync with your team and present your ideas with confidence. With Slidegeeks presentation got a whole lot easier. Grab these presentations today.
-
Robotic Process Automation Metrics Dashboard For Tracking Business Return On Investment Information PDF
This slide illustrates KPI Dashboard for measuring time and money saved after RPA deployment. It also include metrics for analysis such as productivity in robot hours, hours saved per process, money saved per process, etc. Pitch your topic with ease and precision using this Robotic Process Automation Metrics Dashboard For Tracking Business Return On Investment Information PDF. This layout presents information on Management, Goal, Productivity. It is also available for immediate download and adjustment. So, changes can be made in the color, design, graphics or any other component to create a unique layout.
-
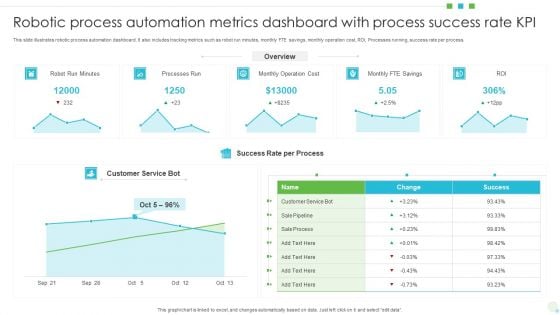
Robotic Process Automation Metrics Dashboard With Process Success Rate KPI Professional PDF
This slide illustrates robotic process automation dashboard. It also includes tracking metrics such as robot run minutes, monthly FTE savings, monthly operation cost, ROI, Processes running, success rate per process. Showcasing this set of slides titled Robotic Process Automation Metrics Dashboard With Process Success Rate KPI Professional PDF The topics addressed in these templates are Processes Run, Monthly Operation Cost, Customer Service Bot. All the content presented in this PPT design is completely editable. Download it and make adjustments in color, background, font etc. as per your unique business setting.
-
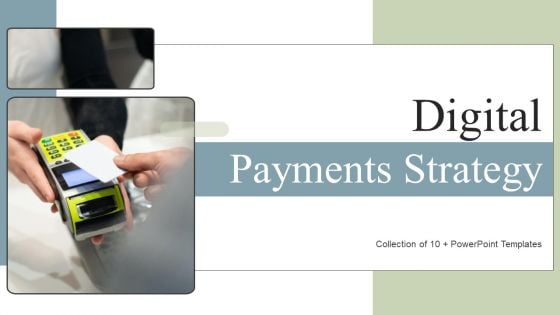
Digital Payments Strategy Ppt PowerPoint Presentation Complete Deck With Slides
Boost your confidence and team morale with this well-structured Digital Payments Strategy Ppt PowerPoint Presentation Complete Deck With Slides. This prefabricated set gives a voice to your presentation because of its well-researched content and graphics. Our experts have added all the components very carefully, thus helping you deliver great presentations with a single click. Not only that, it contains a set of twelve slides that are designed using the right visuals, graphics, etc. Various topics can be discussed, and effective brainstorming sessions can be conducted using the wide variety of slides added in this complete deck. Apart from this, our PPT design contains clear instructions to help you restructure your presentations and create multiple variations. The color, format, design anything can be modified as deemed fit by the user. Not only this, it is available for immediate download. So, grab it now.
-
Excavator Construction PowerPoint Templates And PowerPoint Backgrounds 0611
Microsoft PowerPoint Template and Background with construction industry yellow excavator at construction site
-
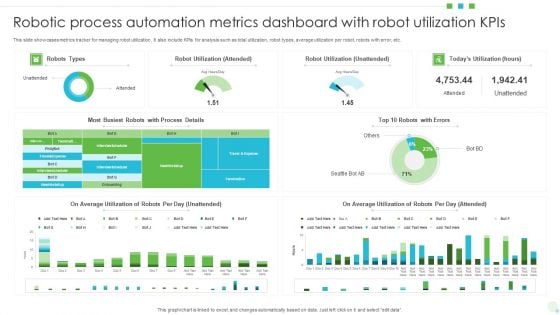
Robotic Process Automation Metrics Dashboard With Robot Utilization Kpis Background PDF
This slide showcases metrics tracker for managing robot utilization. It also include KPIs for analysis such as total utilization, robot types, average utilization per robot, robots with error, etc. Pitch your topic with ease and precision using this Robotic Process Automation Metrics Dashboard With Robot Utilization Kpis Background PDF. This layout presents information on Average Utilization, Robot Utilization, Automation Metrics Dashboard. It is also available for immediate download and adjustment. So, changes can be made in the color, design, graphics or any other component to create a unique layout.
-
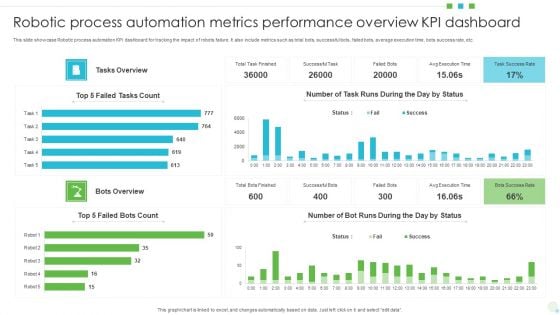
Robotic Process Automation Metrics Performance Overview KPI Dashboard Download PDF
This slide showcase Robotic process automation KPI dashboard for tracking the impact of robots failure. It also include metrics such as total bots, successful bots, failed bots, average execution time, bots success rate, etc. Showcasing this set of slides titled Robotic Process Automation Metrics Performance Overview KPI Dashboard Download PDF. The topics addressed in these templates are Robotic Process Automation, Metrics Performance Overview, Kpi Dashboard. All the content presented in this PPT design is completely editable. Download it and make adjustments in color, background, font etc. as per your unique business setting.
-
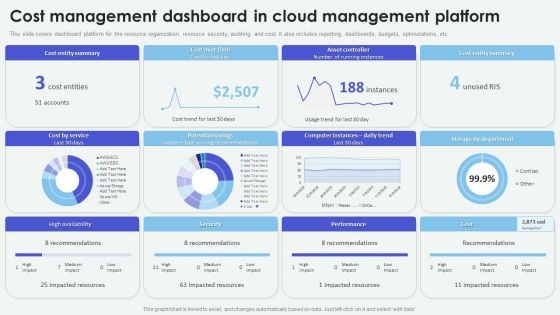
Cloud Based Computing Analysis Cost Management Dashboard In Cloud Management Formats PDF
Slidegeeks is here to make your presentations a breeze with Cloud Based Computing Analysis Cost Management Dashboard In Cloud Management Formats PDF With our easy-to-use and customizable templates, you can focus on delivering your ideas rather than worrying about formatting. With a variety of designs to choose from, youre sure to find one that suits your needs. And with animations and unique photos, illustrations, and fonts, you can make your presentation pop. So whether youre giving a sales pitch or presenting to the board, make sure to check out Slidegeeks first
-
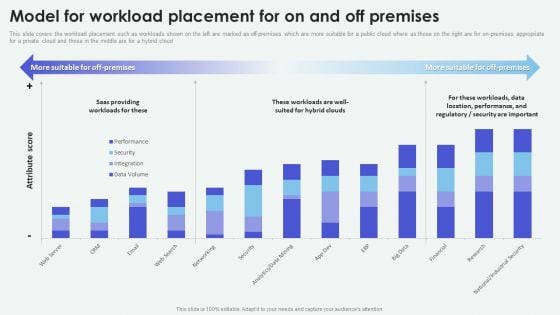
Cloud Based Computing Analysis Model For Workload Placement For On And Professional PDF
This slide covers the workload placement such as workloads shown on the left are marked as off-premises which are more suitable for a public cloud where as those on the right are for on-premises appropriate for a private cloud and those in the middle are for a hybrid cloud. Make sure to capture your audiences attention in your business displays with our gratis customizable Cloud Based Computing Analysis Model For Workload Placement For On And Professional PDF. These are great for business strategies, office conferences, capital raising or task suggestions. If you desire to acquire more customers for your tech business and ensure they stay satisfied, create your own sales presentation with these plain slides.
-
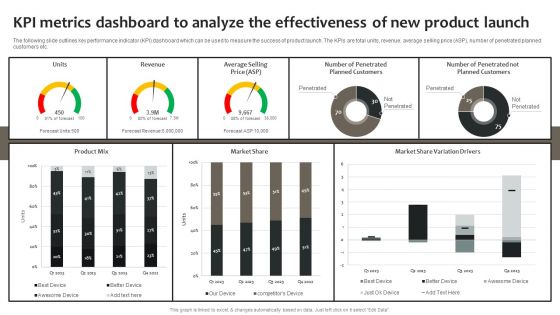
Effective Online And Offline Promotional Kpi Metrics Dashboard To Analyze The Effectiveness Of New Portrait PDF
The following slide outlines key performance indicator KPI dashboard which can be used to measure the success of product launch. The KPIs are total units, revenue, average selling price ASP, number of penetrated planned customers etc. From laying roadmaps to briefing everything in detail, our templates are perfect for you. You can set the stage with your presentation slides. All you have to do is download these easy-to-edit and customizable templates. Effective Online And Offline Promotional Kpi Metrics Dashboard To Analyze The Effectiveness Of New Portrait PDF will help you deliver an outstanding performance that everyone would remember and praise you for. Do download this presentation today.
-
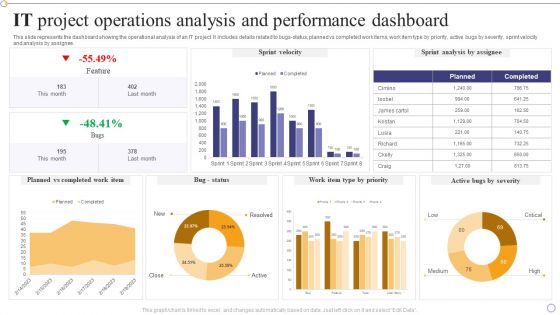
IT Project Operations Analysis And Performance Dashboard Themes PDF
This slide represents the dashboard showing the operational analysis of an IT project. It includes details related to bugs-status, planned vs completed work items, work item type by priority, active bugs by severity, sprint velocity and analysis by assignee.Showcasing this set of slides titled IT Project Operations Analysis And Performance Dashboard Themes PDF. The topics addressed in these templates are Planned Completed, Sprint Analysis, Feature. All the content presented in this PPT design is completely editable. Download it and make adjustments in color, background, font etc. as per your unique business setting.
-
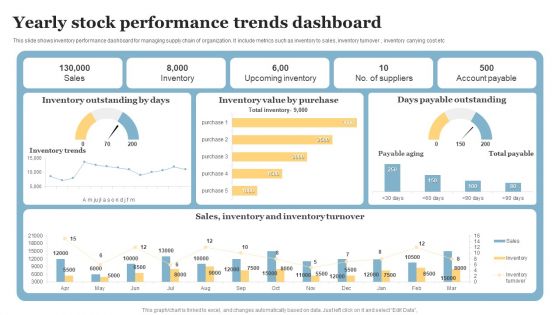
Yearly Stock Performance Trends Dashboard Designs PDF
This slide shows inventory performance dashboard for managing supply chain of organization. It include metrics such as inventory to sales, inventory turnover , inventory carrying cost etc. Showcasing this set of slides titled Yearly Stock Performance Trends Dashboard Designs PDF. The topics addressed in these templates are Inventory Outstanding Days, Days Payable Outstanding, Inventory Value Purchase. All the content presented in this PPT design is completely editable. Download it and make adjustments in color, background, font etc. as per your unique business setting.
-
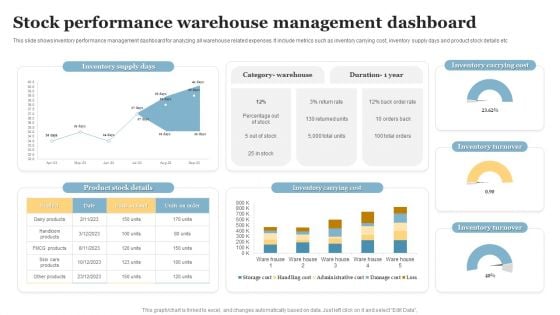
Stock Performance Warehouse Management Dashboard Brochure PDF
This slide shows inventory performance management dashboard for analyzing all warehouse related expenses. It include metrics such as inventory carrying cost, inventory supply days and product stock details etc. Showcasing this set of slides titled Stock Performance Warehouse Management Dashboard Brochure PDF. The topics addressed in these templates are Inventory Supply Days, Inventory Carrying Cost, Inventory Turnover. All the content presented in this PPT design is completely editable. Download it and make adjustments in color, background, font etc. as per your unique business setting.
-
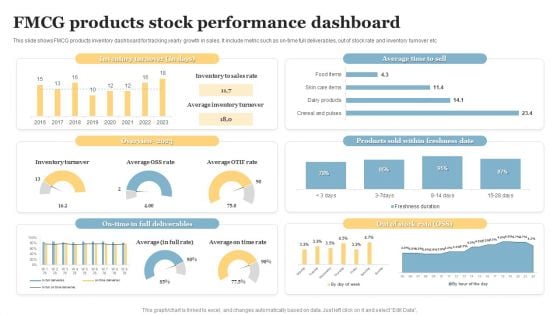
FMCG Products Stock Performance Dashboard Pictures PDF
This slide shows FMCG products inventory dashboard for tracking yearly growth in sales. It include metric such as on-time full deliverables, out of stock rate and inventory turnover etc. Showcasing this set of slides titled FMCG Products Stock Performance Dashboard Pictures PDF. The topics addressed in these templates are Inventory Turnover, Products Sold, Freshness Date. All the content presented in this PPT design is completely editable. Download it and make adjustments in color, background, font etc. as per your unique business setting.
-
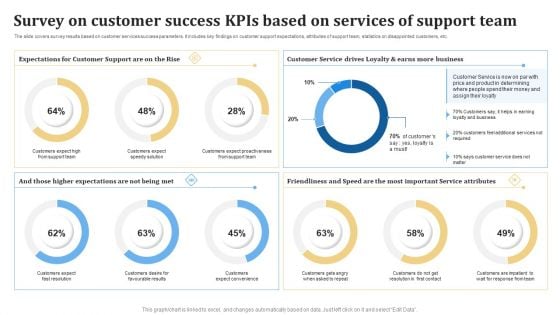
Survey On Customer Success KPIS Based On Services Of Support Team Ppt PowerPoint Presentation Styles Themes PDF
The slide covers survey results based on customer services success parameters. It includes key findings on customer support expectations, attributes of support team, statistics on disappointed customers, etc. Pitch your topic with ease and precision using this Survey On Customer Success KPIS Based On Services Of Support Team Ppt PowerPoint Presentation Styles Themes PDF. This layout presents information on Expectations, Customer Support, Customer Service. It is also available for immediate download and adjustment. So, changes can be made in the color, design, graphics or any other component to create a unique layout.
-
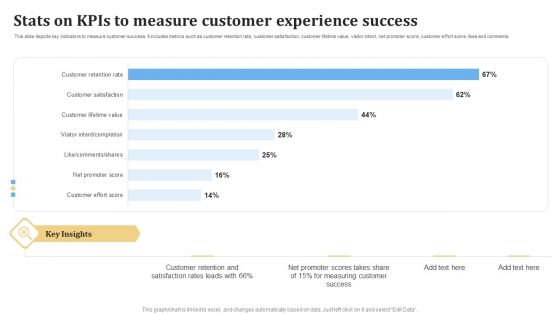
Stats On KPIS To Measure Customer Experience Success Ppt PowerPoint Presentation Slides Objects PDF
This slide depicts key indicators to measure customer success. It includes metrics such as customer retention rate, customer satisfaction, customer lifetime value, visitor intent, net promoter score, customer effort score, likes and comments. Showcasing this set of slides titled Stats On KPIS To Measure Customer Experience Success Ppt PowerPoint Presentation Slides Objects PDF. The topics addressed in these templates are Measure Customer, Experience Success. All the content presented in this PPT design is completely editable. Download it and make adjustments in color, background, font etc. as per your unique business setting.
-
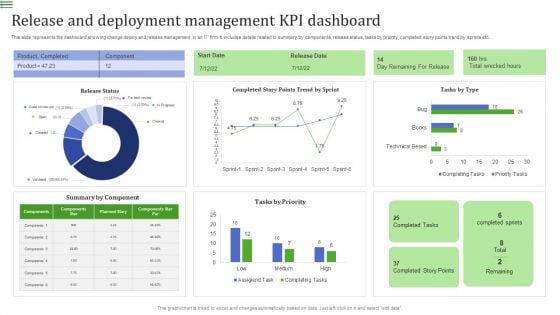
Release And Deployment Management KPI Dashboard Summary PDF
This slide represents the dashboard showing change deploy and release management in an IT firm. It includes details related to summary by components, release status, tasks by priority, completed story points trend by sprints etc.Showcasing this set of slides titled Release And Deployment Management KPI Dashboard Summary PDF. The topics addressed in these templates are Product Completed, Summary Component, Completed Story. All the content presented in this PPT design is completely editable. Download it and make adjustments in color, background, font etc. as per your unique business setting.
-
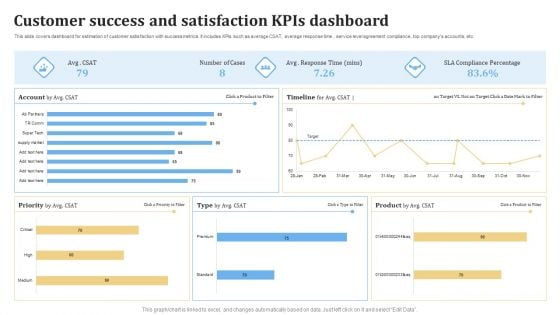
Customer Success And Satisfaction KPIS Dashboard Ppt PowerPoint Presentation Outline Visuals PDF
This slide covers dashboard for estimation of customer satisfaction with success metrics. It includes KPIs such as average CSAT, average response time , service level agreement compliance, top companys accounts, etc. Pitch your topic with ease and precision using this Customer Success And Satisfaction KPIS Dashboard Ppt PowerPoint Presentation Outline Visuals PDF. This layout presents information on Customer Success, Satisfaction KPIs Dashboard. It is also available for immediate download and adjustment. So, changes can be made in the color, design, graphics or any other component to create a unique layout.
-
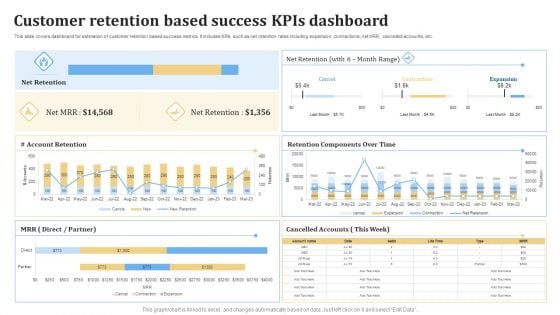
Customer Retention Based Success KPIS Dashboard Ppt PowerPoint Presentation Slides Graphics Pictures PDF
This slide covers dashboard for estimation of customer retention based success metrics. It includes KPIs such as net retention rates including expansion, contractions, net MRR, cancelled accounts, etc. Showcasing this set of slides titled Customer Retention Based Success KPIS Dashboard Ppt PowerPoint Presentation Slides Graphics Pictures PDF. The topics addressed in these templates are Account Retention, Cancelled Accounts, Retention Components. All the content presented in this PPT design is completely editable. Download it and make adjustments in color, background, font etc. as per your unique business setting.
-
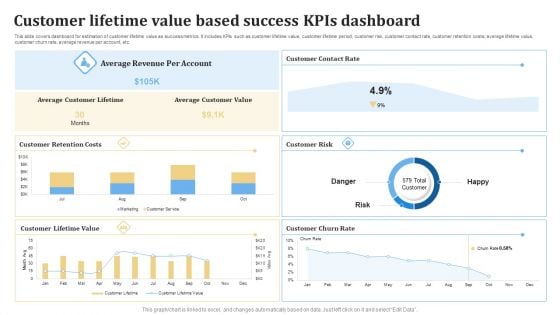
Customer Lifetime Value Based Success KPIS Dashboard Ppt PowerPoint Presentation Layouts Gridlines PDF
This slide covers dashboard for estimation of customer lifetime value as success metrics. It includes KPIs such as customer lifetime value, customer lifetime period, customer risk, customer contact rate, customer retention costs, average lifetime value, customer churn rate, average revenue per account, etc. Pitch your topic with ease and precision using this Customer Lifetime Value Based Success KPIS Dashboard Ppt PowerPoint Presentation Layouts Gridlines PDF. This layout presents information on Average Revenue, Customer Lifetime, Customer Risk. It is also available for immediate download and adjustment. So, changes can be made in the color, design, graphics or any other component to create a unique layout.
-
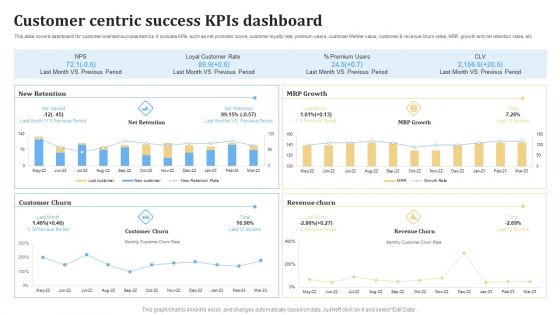
Customer Centric Success KPIS Dashboard Ppt PowerPoint Presentation Styles Example File PDF
This slide covers dashboard for customer oriented success metrics. It includes KPIs such as net promoter score, customer loyalty rate, premium users, customer lifetime value, customer and revenue churn rates, MRR growth and net retention rates, etc. Showcasing this set of slides titled Customer Centric Success KPIS Dashboard Ppt PowerPoint Presentation Styles Example File PDF. The topics addressed in these templates are New Retention, Customer Churn, Revenue Churn. All the content presented in this PPT design is completely editable. Download it and make adjustments in color, background, font etc. as per your unique business setting.
-
Icon For Major Threat Payment Process Structure PDF
Presenting Icon For Major Threat Payment Process Structure PDF to dispense important information. This template comprises Three stages. It also presents valuable insights into the topics including Icon For Major, Threat Payment Process. This is a completely customizable PowerPoint theme that can be put to use immediately. So, download it and address the topic impactfully.
-
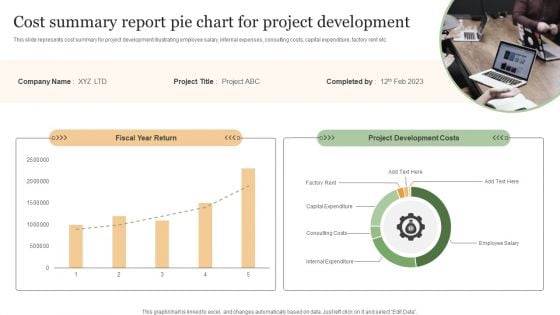
Cost Summary Report Pie Chart For Project Development Infographics PDF
This slide represents cost summary for project development illustrating employee salary, internal expenses, consulting costs, capital expenditure, factory rent etc. Showcasing this set of slides titled Cost Summary Report Pie Chart For Project Development Infographics PDF. The topics addressed in these templates are Fiscal Year Return, Project Development Costs. All the content presented in this PPT design is completely editable. Download it and make adjustments in color, background, font etc. as per your unique business setting.
-
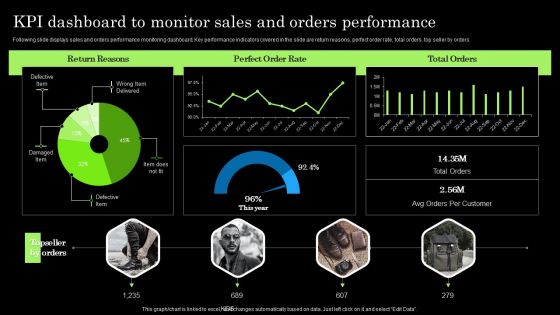
Tactical Brand Extension Launching Kpi Dashboard To Monitor Sales And Orders Formats PDF
Following slide displays sales and orders performance monitoring dashboard. Key performance indicators covered in the slide are return reasons, perfect order rate, total orders, top seller by orders. From laying roadmaps to briefing everything in detail, our templates are perfect for you. You can set the stage with your presentation slides. All you have to do is download these easy-to-edit and customizable templates. Tactical Brand Extension Launching Kpi Dashboard To Monitor Sales And Orders Formats PDF will help you deliver an outstanding performance that everyone would remember and praise you for. Do download this presentation today.
-
Credit Risk Management Strategies And Measures Ppt PowerPoint Presentation Complete Deck With Slides
This fourty three slide Credit Risk Management Strategies And Measures Ppt PowerPoint Presentation Complete Deck With Slides is your content ready tool to impress the stakeholders with your business planning and its manner of execution. Showcase your ideas and how you plan to make them real in detail with this PPT Template Bundle. The slides have the conceptual bandwidth to present the crucial aspects of your plan, such as funding, marketing, resource allocation, timeline, roadmap, and more. When you present your plans with this PPT Layout, the stakeholders are sure to come on board because you will be able to present a succinct, thought-out, winning project. Download this Complete Deck now to take control into your hands. The 100 percent customizable offer is just too good to be resisted.
-
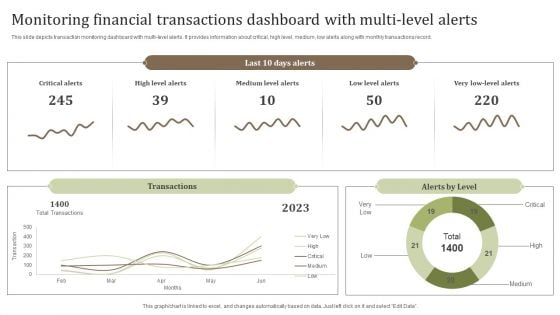
Monitoring Financial Transactions Dashboard With Multi Level Alerts Background PDF
This slide depicts transaction monitoring dashboard with multi-level alerts. It provides information about critical, high level, medium, low alerts along with monthly transactions record. Pitch your topic with ease and precision using this Monitoring Financial Transactions Dashboard With Multi Level Alerts Background PDF. This layout presents information on Critical Alerts, Medium Level Alerts, Total Transactions. It is also available for immediate download and adjustment. So, changes can be made in the color, design, graphics or any other component to create a unique layout.
-
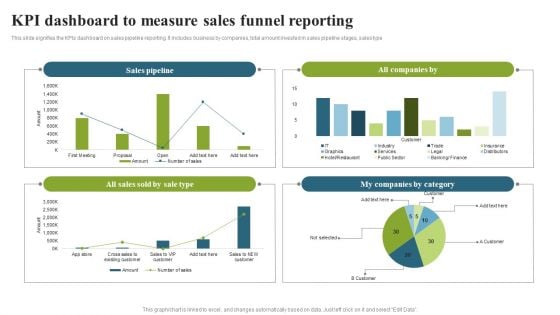
KPI Dashboard To Measure Sales Funnel Reporting Template PDF
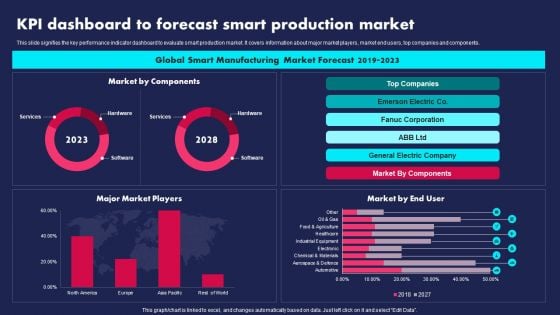
This slide signifies the KPIs dashboard on sales pipeline reporting. It includes business by companies, total amount invested in sales pipeline stages, sales type. Showcasing this set of slides titled KPI Dashboard To Measure Sales Funnel Reporting Template PDF. The topics addressed in these templates are Sales Pipeline, Companies Category, Sales Sold. All the content presented in this PPT design is completely editable. Download it and make adjustments in color, background, font etc. as per your unique business setting.
-
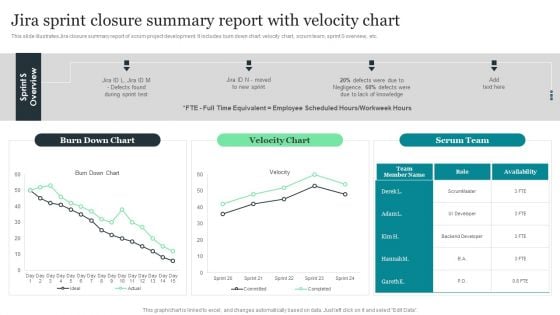
Jira Sprint Closure Summary Report With Velocity Chart Designs PDF
This slide illustrates Jira closure summary report of scrum project development. It includes burn down chart, velocity chart, scrum team, sprint S overview, etc. Pitch your topic with ease and precision using this Jira Sprint Closure Summary Report With Velocity Chart Designs PDF. This layout presents information on Jira Sprint Closure, Summary Report, Velocity Chart. It is also available for immediate download and adjustment. So, changes can be made in the color, design, graphics or any other component to create a unique layout.
-
Engineering Services Company Report Gross Profit And Margin Ppt PowerPoint Presentation File Show PDF
This slide illustrates a graph of gross profit in US dollar and gross margin in percentage for engineering company illustrating growth trend in last five years from 2018 to 2022. From laying roadmaps to briefing everything in detail, our templates are perfect for you. You can set the stage with your presentation slides. All you have to do is download these easy-to-edit and customizable templates. Engineering Services Company Report Gross Profit And Margin Ppt PowerPoint Presentation File Show PDF will help you deliver an outstanding performance that everyone would remember and praise you for. Do download this presentation today.
-
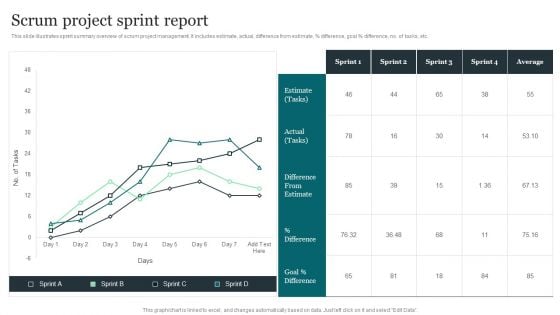
Scrum Project Sprint Report Guidelines PDF
This slide illustrates sprint summary overview of scrum project management. It includes estimate, actual, difference from estimate, percent difference, goal percent difference, no. of tasks, etc. Pitch your topic with ease and precision using this Scrum Project Sprint Report Guidelines PDF. This layout presents information on Scrum Project, Sprint Report. It is also available for immediate download and adjustment. So, changes can be made in the color, design, graphics or any other component to create a unique layout.
-
Customer Support Center Call Center Action Plan Dashboard Highlighting Agent Diagrams PDF
This slide showcases dashboard for call center action plan which includes total calls, average answer speed, abandon rate, average calls per minute with agent performance and overall customer satisfaction score. Want to ace your presentation in front of a live audience Our Customer Support Center Call Center Action Plan Dashboard Highlighting Agent Diagrams PDF can help you do that by engaging all the users towards you.. Slidegeeks experts have put their efforts and expertise into creating these impeccable powerpoint presentations so that you can communicate your ideas clearly. Moreover, all the templates are customizable, and easy-to-edit and downloadable. Use these for both personal and commercial use.
-
Conformance Testing Performance Tracking Dashboard Compliance Assessment Ppt Layouts Graphics PDF
This slide depicts the conformance testing performance tracking dashboard by covering details of test case analysis, tests linked to requirements, test case breakdown, tests per requirement, and so on. If your project calls for a presentation, then Slidegeeks is your go-to partner because we have professionally designed, easy-to-edit templates that are perfect for any presentation. After downloading, you can easily edit Conformance Testing Performance Tracking Dashboard Compliance Assessment Ppt Layouts Graphics PDF and make the changes accordingly. You can rearrange slides or fill them with different images. Check out all the handy templates
-
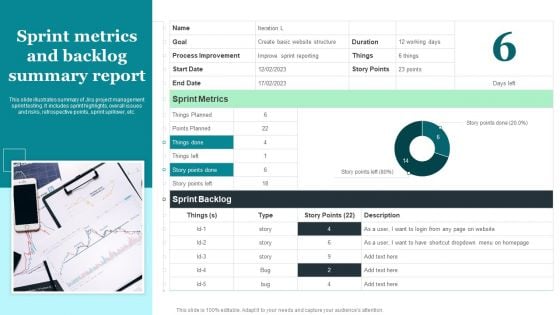
Sprint Metrics And Backlog Summary Report Brochure PDF
This slide illustrates summary of Jira project management sprint testing. It includes sprint highlights, overall issues and risks, retrospective points, sprint spillover, etc. Pitch your topic with ease and precision using this Sprint Metrics And Backlog Summary Report Brochure PDF. This layout presents information on Sprint Metrics And Backlog, Summary Report. It is also available for immediate download and adjustment. So, changes can be made in the color, design, graphics or any other component to create a unique layout.
-
Using Social Media Platforms To Enhance Dashboard For Tracking Social Media Kpis Formats PDF
This slide shows dashboard for tracking social media key performance indicators KPIs. It provides details about average social engagement, reactions, comments, shares, clicks, thumbnail, platform, post message, etc. Are you in need of a template that can accommodate all of your creative concepts This one is crafted professionally and can be altered to fit any style. Use it with Google Slides or PowerPoint. Include striking photographs, symbols, depictions, and other visuals. Fill, move around, or remove text boxes as desired. Test out color palettes and font mixtures. Edit and save your work, or work with colleagues. Download Using Social Media Platforms To Enhance Dashboard For Tracking Social Media Kpis Formats PDF and observe how to make your presentation outstanding. Give an impeccable presentation to your group and make your presentation unforgettable.
-
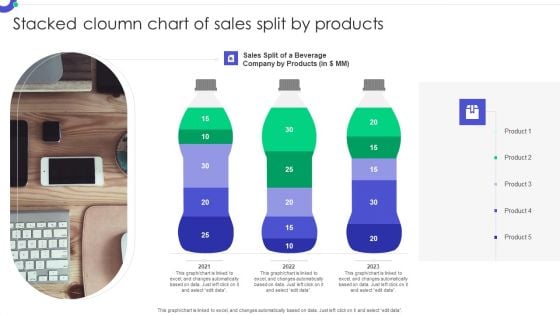
Stacked Cloumn Chart Of Sales Split By Products Graphics PDF
Showcasing this set of slides titled Stacked Cloumn Chart Of Sales Split By Products Graphics PDF. The topics addressed in these templates are Sales Split Beverage, Company Products. All the content presented in this PPT design is completely editable. Download it and make adjustments in color, background, font etc. as per your unique business setting.
-
Stacked Cloumn Chart Infographic Ppt PowerPoint Presentation Complete Deck With Slides
Boost your confidence and team morale with this well-structured Stacked Cloumn Chart Infographic Ppt PowerPoint Presentation Complete Deck With Slides. This prefabricated set gives a voice to your presentation because of its well-researched content and graphics. Our experts have added all the components very carefully, thus helping you deliver great presentations with a single click. Not only that, it contains a set of twelve slides that are designed using the right visuals, graphics, etc. Various topics can be discussed, and effective brainstorming sessions can be conducted using the wide variety of slides added in this complete deck. Apart from this, our PPT design contains clear instructions to help you restructure your presentations and create multiple variations. The color, format, design anything can be modified as deemed fit by the user. Not only this, it is available for immediate download. So, grab it now.
-
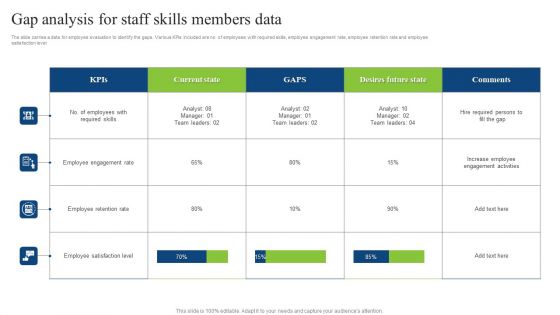
Gap Analysis For Staff Skills Members Data Guidelines PDF
The slide carries a data for employee evaluation to identify the gaps. Various KPIs included are no. of employees with required skills, employee engagement rate, employee retention rate and employee satisfaction level. Showcasing this set of slides titled Gap Analysis For Staff Skills Members Data Guidelines PDF. The topics addressed in these templates are Employee Engagement Rate, Employee Retention Rate. All the content presented in this PPT design is completely editable. Download it and make adjustments in color, background, font etc. as per your unique business setting.
-
Benefits Of Pharmacy Information System Platform Portrait PDF
This slide showcases a graphical representation of PMS platform advantages to pharmacists. Key benefits covered are faster prescription processing, improved inventory accuracy and customer retention, less paperwork and greater control over expenses. Showcasing this set of slides titled Benefits Of Pharmacy Information System Platform Portrait PDF. The topics addressed in these templates are Benefits Of Pharmacy, Information System Platform. All the content presented in this PPT design is completely editable. Download it and make adjustments in color, background, font etc. as per your unique business setting.
-
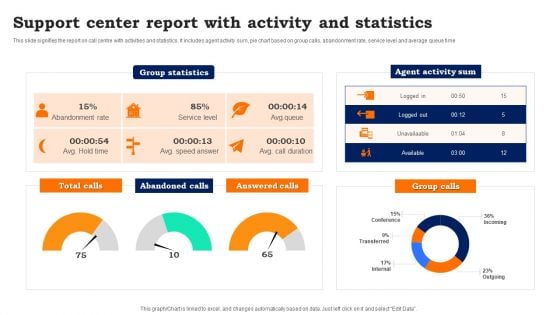
Support Center Report With Activity And Statistics Guidelines PDF
This slide signifies the report on call centre with activities and statistics. It includes agent activity sum, pie chart based on group calls, abandonment rate, service level and average queue time. Pitch your topic with ease and precision using this Support Center Report With Activity And Statistics Guidelines PDF. This layout presents information on Support Center Report, Activity And Statistics. It is also available for immediate download and adjustment. So, changes can be made in the color, design, graphics or any other component to create a unique layout.
-
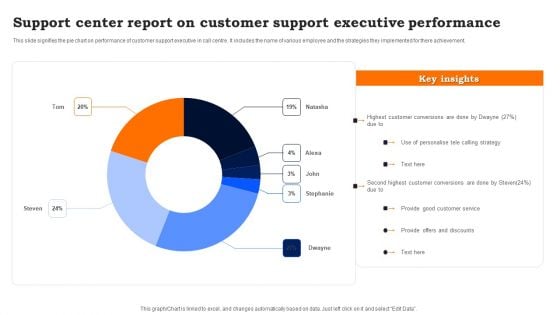
Support Center Report On Customer Support Executive Performance Sample PDF
This slide signifies the pie chart on performance of customer support executive in call centre. It includes the name of various employee and the strategies they implemented for there achievement. Showcasing this set of slides titled Support Center Report On Customer Support Executive Performance Sample PDF. The topics addressed in these templates are Use Of Personalise Telecalling, Provide Good Customer Service, Provide Offers And Discounts. All the content presented in this PPT design is completely editable. Download it and make adjustments in color, background, font etc. as per your unique business setting.
-
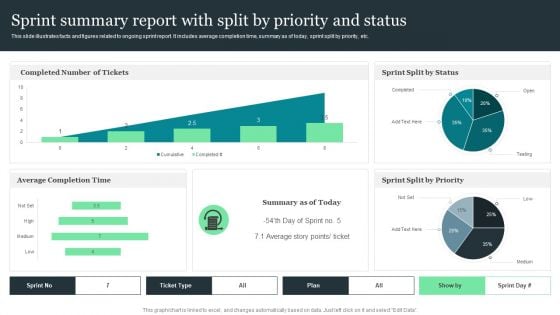
Sprint Summary Report With Split By Priority And Status Brochure PDF
This slide illustrates facts and figures related to ongoing sprint report. It includes average completion time, summary as of today, sprint split by priority, etc. Showcasing this set of slides titled Sprint Summary Report With Split By Priority And Status Brochure PDF. The topics addressed in these templates are Average Completion Time, Sprint Split By Priority, Sprint Split By Status. All the content presented in this PPT design is completely editable. Download it and make adjustments in color, background, font etc. as per your unique business setting.
-
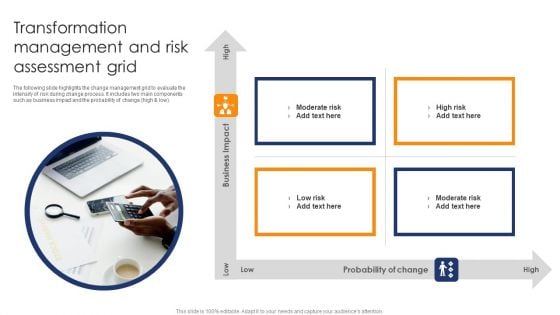
Transformation Management And Risk Assessment Grid Themes PDF
The following slide highlights the change management grid to evaluate the intensity of risk during change process. It includes two main components such as business impact and the probability of change high and low. Presenting Transformation Management And Risk Assessment Grid Themes PDF to dispense important information. This template comprises four stages. It also presents valuable insights into the topics including Business Impact, Low Risk, Moderate Risk. This is a completely customizable PowerPoint theme that can be put to use immediately. So, download it and address the topic impactfully.
-
Project Tracking Cost Tracker Dashboard Elements PDF
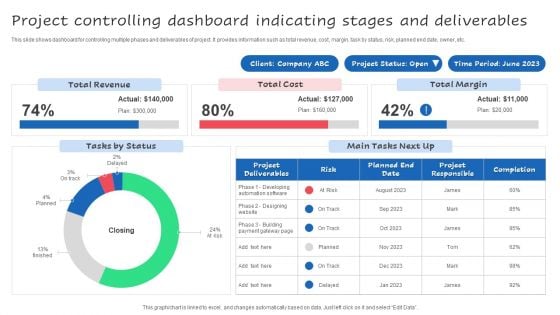
The following slide highlights the cost analysis of various projects to perform feasibility analysis. It includes budgeted versus actual cost, project wise cost and revenue allocation etc. Showcasing this set of slides titled Project Tracking Cost Tracker Dashboard Elements PDF. The topics addressed in these templates are Budgeted Costs, Resource Allocation, Project Costs. All the content presented in this PPT design is completely editable. Download it and make adjustments in color, background, font etc. as per your unique business setting.
-
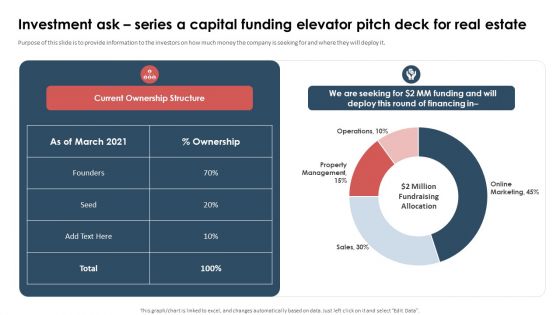
Investment Ask Series A Capital Funding Elevator Pitch Deck For Real Estate Slides PDF
Purpose of this slide is to provide information to the investors on how much money the company is seeking for and where they will deploy it. Presenting this PowerPoint presentation, titled Investment Ask Series A Capital Funding Elevator Pitch Deck For Real Estate Slides PDF, with topics curated by our researchers after extensive research. This editable presentation is available for immediate download and provides attractive features when used. Download now and captivate your audience. Presenting this Investment Ask Series A Capital Funding Elevator Pitch Deck For Real Estate Slides PDF. Our researchers have carefully researched and created these slides with all aspects taken into consideration. This is a completely customizable Investment Ask Series A Capital Funding Elevator Pitch Deck For Real Estate Slides PDF that is available for immediate downloading. Download now and make an impact on your audience. Highlight the attractive features available with our PPTs.
-
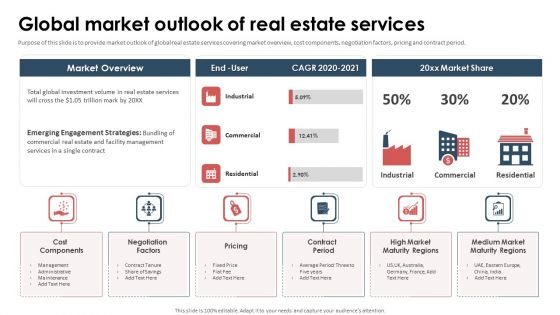
Series A Capital Funding Elevator Global Market Outlook Of Real Estate Services Microsoft PDF
Purpose of this slide is to provide market outlook of global real estate services covering market overview, cost components, negotiation factors, pricing and contract period. Do you know about Slidesgeeks Series A Capital Funding Elevator Global Market Outlook Of Real Estate Services Microsoft PDF These are perfect for delivering any kind od presentation. Using it, create PowerPoint presentations that communicate your ideas and engage audiences. Save time and effort by using our pre-designed presentation templates that are perfect for a wide range of topic. Our vast selection of designs covers a range of styles, from creative to business, and are all highly customizable and easy to edit. Download as a PowerPoint template or use them as Google Slides themes.
-
IT Cost Assessment With KPI Dashboard To Gain Competitive Advantage Icons PDF
Showcasing this set of slides titled IT Cost Assessment With KPI Dashboard To Gain Competitive Advantage Icons PDF. The topics addressed in these templates are Actual Cost, Yearly Analysis, Breakdown Chart. All the content presented in this PPT design is completely editable. Download it and make adjustments in color, background, font etc. as per your unique business setting.
-
Project Tracking Budget Risk And Health Tracker Inspiration PDF
The following slide depicts the tracker to trace the progress of project tracking at the same time. It includes various kpis such as task, budget, resource, issues and risk status etc. Showcasing this set of slides titled Project Tracking Budget Risk And Health Tracker Inspiration PDF. The topics addressed in these templates are Risk And Health Tracker, Project Tracking Budget. All the content presented in this PPT design is completely editable. Download it and make adjustments in color, background, font etc. as per your unique business setting.
-
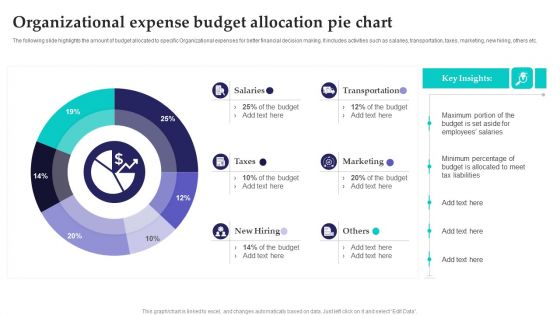
Organizational Expense Budget Allocation Pie Chart Inspiration PDF
The following slide highlights the amount of budget allocated to specific Organizational expenses for better financial decision making. It includes activities such as salaries, transportation, taxes, marketing, new hiring, others etc. Pitch your topic with ease and precision using this Organizational Expense Budget Allocation Pie Chart Inspiration PDF. This layout presents information on Transportation, Marketing, Budget. It is also available for immediate download and adjustment. So, changes can be made in the color, design, graphics or any other component to create a unique layout.
-
Annual Organizational Expense Analysis Icon Pictures PDF
Persuade your audience using this Annual Organizational Expense Analysis Icon Pictures PDF. This PPT design covers four stages, thus making it a great tool to use. It also caters to a variety of topics including Annual Organizational Expense, Analysis Icon. Download this PPT design now to present a convincing pitch that not only emphasizes the topic but also showcases your presentation skills.
-
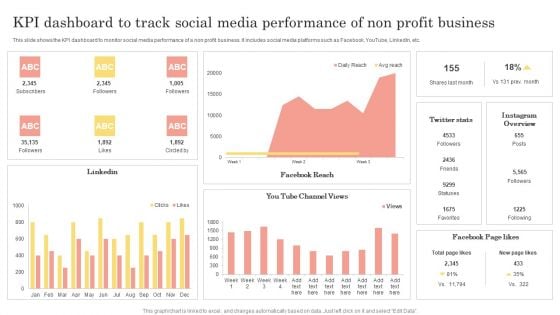
Kpi Dashboard To Track Social Media Performance Of Non Profit Business Portrait PDF
This slide shows the KPI dashboard to monitor social media performance of a non profit business. It includes social media platforms such as Facebook, YouTube, LinkedIn, etc. Showcasing this set of slides titled Kpi Dashboard To Track Social Media Performance Of Non Profit Business Portrait PDF. The topics addressed in these templates are Channel Views, Instagram Overview, Favorites. All the content presented in this PPT design is completely editable. Download it and make adjustments in color, background, font etc. as per your unique business setting.
-
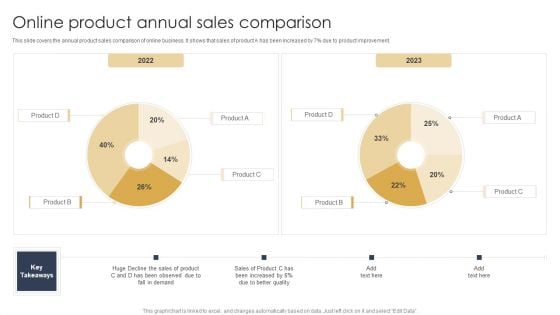
Online Product Annual Sales Comparison Brochure PDF
This slide covers the annual product sales comparison of online business. It shows that sales of product A has been increased by 7 percent due to product improvement. Showcasing this set of slides titled Online Product Annual Sales Comparison Brochure PDF. The topics addressed in these templates are Demand, Sales Of Product, Quality. All the content presented in this PPT design is completely editable. Download it and make adjustments in color, background, font etc. as per your unique business setting.
-
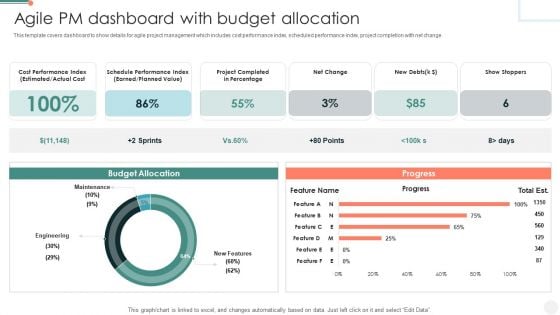
Agile PM Dashboard With Budget Allocation Guidelines PDF
This template covers dashboard to show details for agile project management which includes cost performance index, scheduled performance index, project completion with net change. Showcasing this set of slides titled Agile PM Dashboard With Budget Allocation Guidelines PDF. The topics addressed in these templates are Actual Cost, Budget Allocation, Agile Pm Dashboard. All the content presented in this PPT design is completely editable. Download it and make adjustments in color, background, font etc. as per your unique business setting.
-
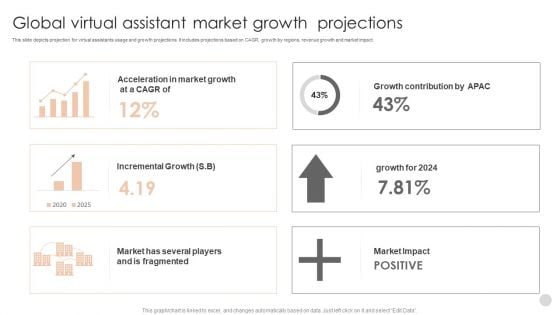
Global Virtual Assistant Market Growth Projections Graphics PDF
This slide depicts projection for virtual assistants usage and growth projections. It includes projections based on CAGR, growth by regions, revenue growth and market impact. Showcasing this set of slides titled Global Virtual Assistant Market Growth Projections Graphics PDF. The topics addressed in these templates are Acceleration Market, Incremental Growth, Players Fragmented. All the content presented in this PPT design is completely editable. Download it and make adjustments in color, background, font etc. as per your unique business setting.
-
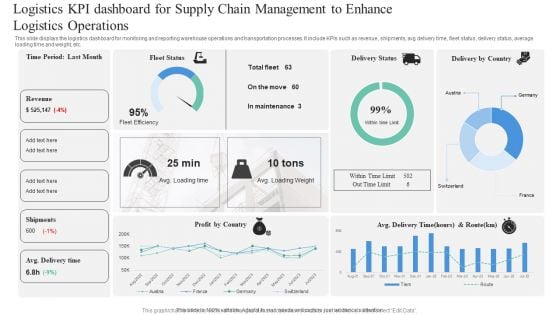
Logistics KPI Dashboard For Supply Chain Management To Enhance Logistics Operations Professional PDF
This slide displays the logistics dashboard for monitoring and reporting warehouse operations and transportation processes. It include KPIs such as revenue, shipments, avg delivery time, fleet status, delivery status, average loading time and weight, etc. Pitch your topic with ease and precision using this Logistics KPI Dashboard For Supply Chain Management To Enhance Logistics Operations Professional PDF. This layout presents information on Logistics KPI, Dashboard For Supply Chain, Management To Enhance, Logistics Operations. It is also available for immediate download and adjustment. So, changes can be made in the color, design, graphics or any other component to create a unique layout.
-
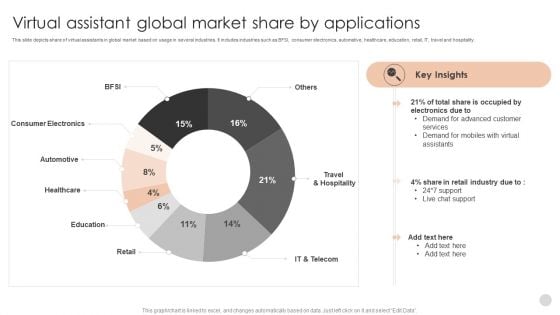
Virtual Assistant Global Market Share By Applications Infographics PDF
This slide depicts share of virtual assistants in global market based on usage in several industries. It includes industries such as BFSI, consumer electronics, automative, healthcare, education, retail, IT, travel and hospitality. Showcasing this set of slides titled Virtual Assistant Global Market Share By Applications Infographics PDF. The topics addressed in these templates are Consumer Electronics, Automotive, Demand Advanced. All the content presented in this PPT design is completely editable. Download it and make adjustments in color, background, font etc. as per your unique business setting.
-
Inventory Overview Dashboard In Supply Chain Management To Enhance Logistics Operations Summary PDF
This slide showcases the inventory management dashboard. It include KPIs such as inventory value, re-order products, restocking cost, inventory value by vendor, item name, last order date, warehouse, etc. Showcasing this set of slides titled Inventory Overview Dashboard In Supply Chain Management To Enhance Logistics Operations Summary PDF. The topics addressed in these templates are Inventory Overview Dashboard, Supply Chain Management, Enhance Logistics Operations. All the content presented in this PPT design is completely editable. Download it and make adjustments in color, background, font etc. as per your unique business setting.
-
PIM Software Solution Report Dashboard Mockup PDF
This slide covers the dashboard with active product information and performance report. It also includes product KPIs such as active products, missing products, items sold by category, and top 5 products. Pitch your topic with ease and precision using this PIM Software Solution Report Dashboard Mockup PDF. This layout presents information on Product Information, Product Performance, Missing Product Details. It is also available for immediate download and adjustment. So, changes can be made in the color, design, graphics or any other component to create a unique layout.
-
Developing Appealing Persona Customer Satisfaction Kpi Dashboard Microsoft PDF
This graph or chart is linked to excel, and changes automatically based on data. Just left click on it and select Edit Data. Do you have an important presentation coming up Are you looking for something that will make your presentation stand out from the rest Look no further than Developing Appealing Persona Customer Satisfaction Kpi Dashboard Microsoft PDF. With our professional designs, you can trust that your presentation will pop and make delivering it a smooth process. And with Slidegeeks, you can trust that your presentation will be unique and memorable. So why wait Grab Developing Appealing Persona Customer Satisfaction Kpi Dashboard Microsoft PDF today and make your presentation stand out from the rest
-
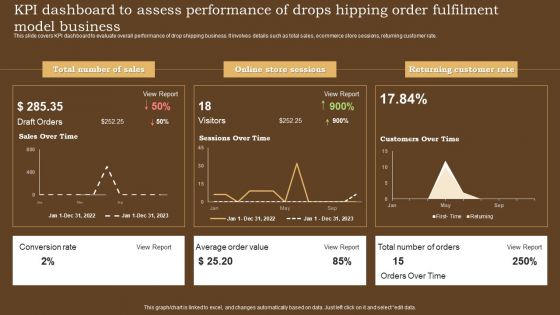
KPI Dashboard To Assess Performance Of Drops Hipping Order Fulfilment Model Business Themes PDF
This slide covers KPI dashboard to evaluate overall performance of drop shipping business. It involves details such as total sales, ecommerce store sessions, returning customer rate. Showcasing this set of slides titled KPI Dashboard To Assess Performance Of Drops Hipping Order Fulfilment Model Business Themes PDF. The topics addressed in these templates are Total Number Of Sales, Online Store Sessions, Returning Customer Rate. All the content presented in this PPT design is completely editable. Download it and make adjustments in color, background, font etc. as per your unique business setting.
-
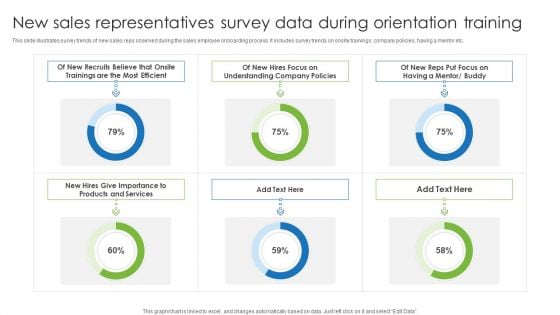
New Sales Representatives Survey Data During Orientation Training Themes PDF
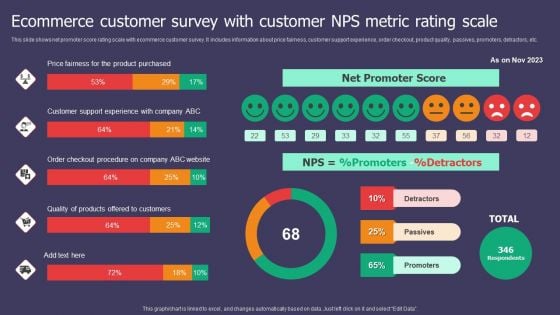
This slide illustrates survey trends of new sales reps observed during the sales employee onboarding process. It includes survey trends on onsite trainings, company policies, having a mentor etc. Showcasing this set of slides titled New Sales Representatives Survey Data During Orientation Training Themes PDF. The topics addressed in these templates are New Sales Representatives Survey, Data During Orientation Training. All the content presented in this PPT design is completely editable. Download it and make adjustments in color, background, font etc. as per your unique business setting.
-
Market Demand Equilibrium Gap In Electronic Graphics PDF
This slide showcase statistical data of demand and supply in electronic market with CAGR. It includes key insides that explain huge gap between demand and supply Showcasing this set of slides titled Market Demand Equilibrium Gap In Electronic Graphics PDF. The topics addressed in these templates are Demand, Domestic Supply Average, Production. All the content presented in this PPT design is completely editable. Download it and make adjustments in color, background, font etc. as per your unique business setting.
-
Employee Performance Assessment Survey Conclusion Portrait PDF
This slide illustrates the statistical results of a survey conducted by an organization to assess an employee on the basis of their soft skills to make required improvements. The skills include communication, organization, teamwork, and so on. Showcasing this set of slides titled Employee Performance Assessment Survey Conclusion Portrait PDF. The topics addressed in these templates are Teamwork, Organization, Communication All the content presented in this PPT design is completely editable. Download it and make adjustments in color, background, font etc. as per your unique business setting.
-
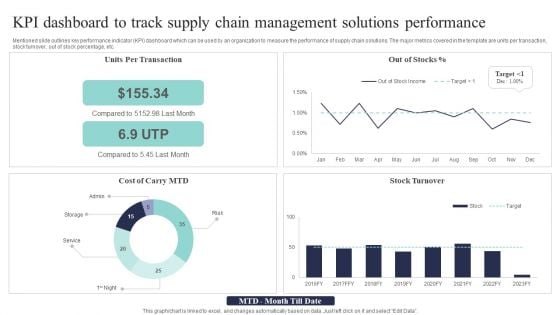
KPI Dashboard To Track Supply Chain Management Solutions Performance Background PDF
Mentioned slide outlines key performance indicator KPI dashboard which can be used by an organization to measure the performance of supply chain solutions. The major metrics covered in the template are units per transaction, stock turnover, out of stock percentage, etc. Pitch your topic with ease and precision using this KPI Dashboard To Track Supply Chain Management Solutions Performance Background PDF. This layout presents information on Per Transaction, Compared Last, Stock Turnover. It is also available for immediate download and adjustment. So, changes can be made in the color, design, graphics or any other component to create a unique layout.
-
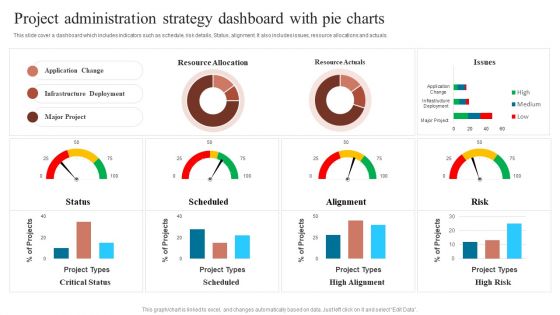
Project Administration Strategy Dashboard With Pie Charts Sample PDF
This slide cover a dashboard which includes indicators such as schedule, risk details, Status, alignment. It also includes issues, resource allocations and actuals. Pitch your topic with ease and precision using this Project Administration Strategy Dashboard With Pie Charts Sample PDF. This layout presents information on Communication Goal, Communication Tool, Increase Revenue. It is also available for immediate download and adjustment. So, changes can be made in the color, design, graphics or any other component to create a unique layout.
-
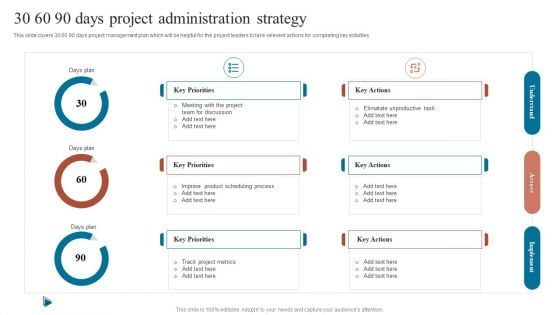
30 60 90 Days Project Administration Strategy Infographics PDF
This slide covers 30 60 90 days project management plan which will be helpful for the project leaders to take relevent actions for completing key activities.Pitch your topic with ease and precision using this 30 60 90 Days Project Administration Strategy Infographics PDF. This layout presents information on Team Discussion, Improve Product, Scheduling Process. It is also available for immediate download and adjustment. So, changes can be made in the color, design, graphics or any other component to create a unique layout.
-
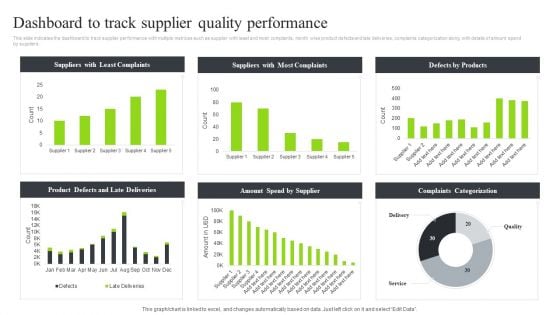
Strategic Sourcing And Supplier Quality Dashboard To Track Supplier Quality Performance Microsoft PDF
This slide indicates the dashboard to track supplier performance with multiple metrices such as supplier with least and most complaints, month wise product defects and late deliveries, complaints categorization along with details of amount spend by suppliers.Slidegeeks has constructed Strategic Sourcing And Supplier Quality Dashboard To Track Supplier Quality Performance Microsoft PDF after conducting extensive research and examination. These presentation templates are constantly being generated and modified based on user preferences and critiques from editors. Here, you will find the most attractive templates for a range of purposes while taking into account ratings and remarks from users regarding the content. This is an excellent jumping-off point to explore our content and will give new users an insight into our top-notch PowerPoint Templates.
-
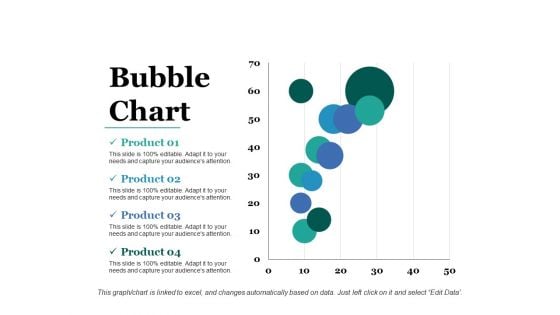
Bubble Chart Ppt PowerPoint Presentation File Styles
This is a bubble chart ppt powerpoint presentation file styles. This is a four stage process. The stages in this process are chart, business, marketing, strategy, bubble.
-
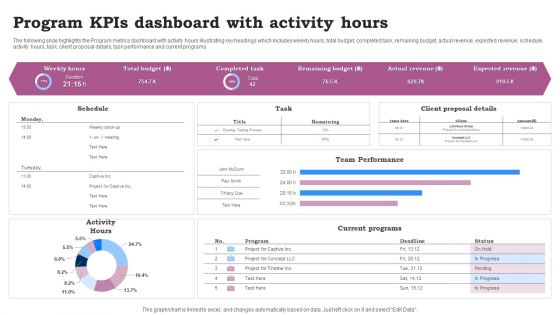
Program Kpis Dashboard With Activity Hours Ppt Infographics Clipart Images PDF
The following slide highlights the Program metrics dashboard with activity hours illustrating key headings which includes weekly hours, total budget, completed task, remaining budget, actual revenue, expected revenue, schedule, activity hours, task, client proposal details, task performance and current programs. Pitch your topic with ease and precision using this Program Kpis Dashboard With Activity Hours Ppt Infographics Clipart Images PDF. This layout presents information on Team Performance, Current Programs, Activity Hours. It is also available for immediate download and adjustment. So, changes can be made in the color, design, graphics or any other component to create a unique layout.
-
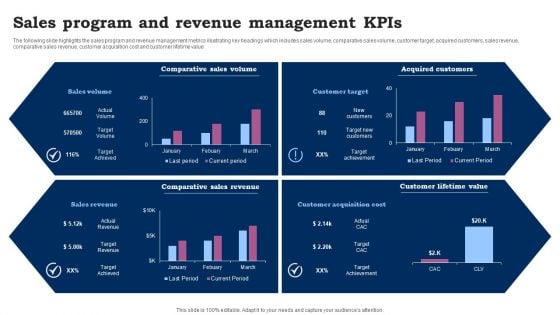
Sales Program And Revenue Management Kpis Ppt Outline Slide Download PDF
The following slide highlights the sales program and revenue management metrics illustrating key headings which includes sales volume, comparative sales volume, customer target, acquired customers, sales revenue, comparative sales revenue, customer acquisition cost and customer lifetime value. Showcasing this set of slides titled Sales Program And Revenue Management Kpis Ppt Outline Slide Download PDF. The topics addressed in these templates are Comparative Sales Volume, Acquired Customers, Comparative Sales Revenue. All the content presented in this PPT design is completely editable. Download it and make adjustments in color, background, font etc. as per your unique business setting.
-
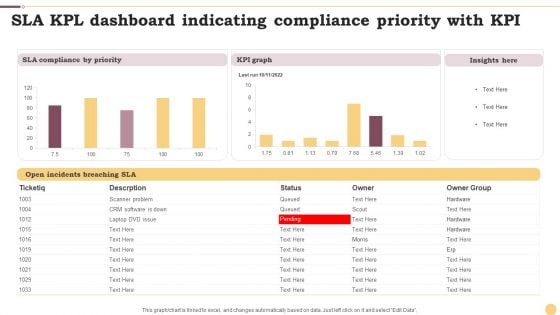
SLA KPL Dashboard Indicating Compliance Priority With KPI Ppt File Format PDF
This graph or chart is linked to excel, and changes automatically based on data. Just left click on it and select Edit Data. Showcasing this set of slides titled SLA KPL Dashboard Indicating Compliance Priority With KPI Ppt File Format PDF. The topics addressed in these templates are KPI Graph, Insights Here, SLA Compliance Priority. All the content presented in this PPT design is completely editable. Download it and make adjustments in color, background, font etc. as per your unique business setting.
-
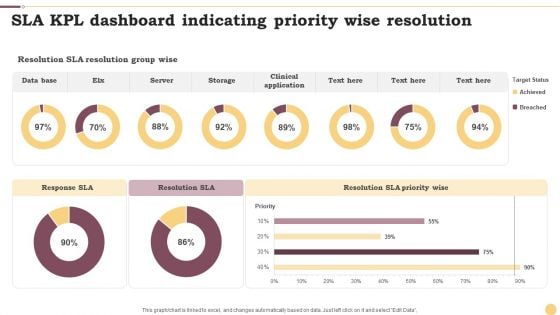
SLA KPL Dashboard Indicating Priority Wise Resolution Ppt Infographics Example File PDF
This graph or chart is linked to excel, and changes automatically based on data. Just left click on it and select Edit Data. Pitch your topic with ease and precision using this SLA KPL Dashboard Indicating Priority Wise Resolution Ppt Infographics Example File PDF. This layout presents information on Data Base, Server, Storage. It is also available for immediate download and adjustment. So, changes can be made in the color, design, graphics or any other component to create a unique layout.
-
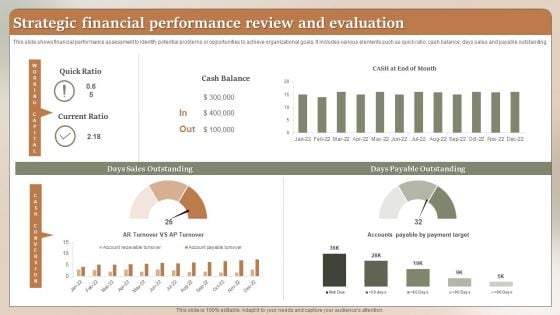
Strategic Financial Performance Review And Evaluation Ppt Layouts Styles PDF
This slide shows financial performance assessment to identify potential problems or opportunities to achieve organizational goals. It includes various elements such as quick ratio, cash balance, days sales and payable outstanding. Showcasing this set of slides titled Strategic Financial Performance Review And Evaluation Ppt Layouts Styles PDF. The topics addressed in these templates are Cash Balance, Quick Ratio, Current Ratio. All the content presented in this PPT design is completely editable. Download it and make adjustments in color, background, font etc. as per your unique business setting.
-
Doughnut Graph Ppt PowerPoint Presentation Complete Deck With Slides
Improve your presentation delivery using this Doughnut Graph Ppt PowerPoint Presentation Complete Deck With Slides. Support your business vision and objectives using this well-structured PPT deck. This template offers a great starting point for delivering beautifully designed presentations on the topic of your choice. Comprising twelve slides this professionally designed template is all you need to host discussion and meetings with collaborators. Each slide is self-explanatory and equipped with high-quality graphics that can be adjusted to your needs. Therefore, you will face no difficulty in portraying your desired content using this PPT slideshow. This PowerPoint slideshow contains every important element that you need for a great pitch. It is not only editable but also available for immediate download and utilization. The color, font size, background, shapes everything can be modified to create your unique presentation layout. Therefore, download it now.
-
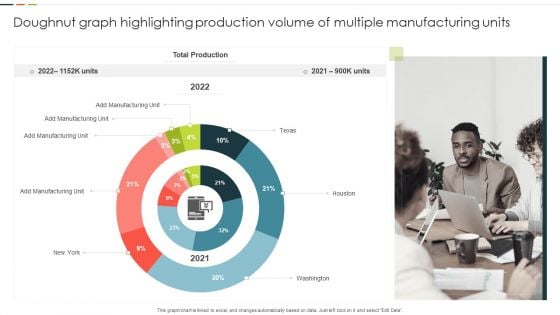
Doughnut Graph Highlighting Production Volume Of Multiple Manufacturing Units Guidelines PDF
This graph or chart is linked to excel, and changes automatically based on data. Just left click on it and select Edit Data. Showcasing this set of slides titled Doughnut Graph Highlighting Production Volume Of Multiple Manufacturing Units Guidelines PDF. The topics addressed in these templates are Total Production, Manufacturing Unit, Washington. All the content presented in this PPT design is completely editable. Download it and make adjustments in color, background, font etc. as per your unique business setting.
-
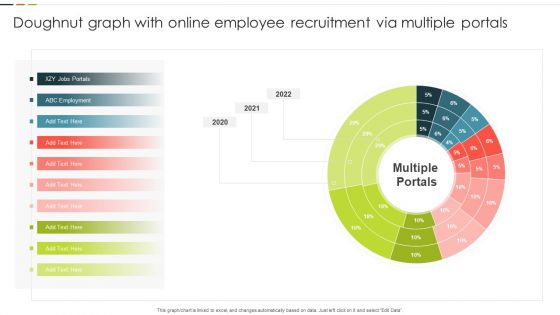
Doughnut Graph With Online Employee Recruitment Via Multiple Portals Mockup PDF
This graph or chart is linked to excel, and changes automatically based on data. Just left click on it and select Edit Data. Pitch your topic with ease and precision using this Doughnut Graph With Online Employee Recruitment Via Multiple Portals Mockup PDF. This layout presents information on ABC Employment, Multiple Portals, 2020 To 2022. It is also available for immediate download and adjustment. So, changes can be made in the color, design, graphics or any other component to create a unique layout.
-
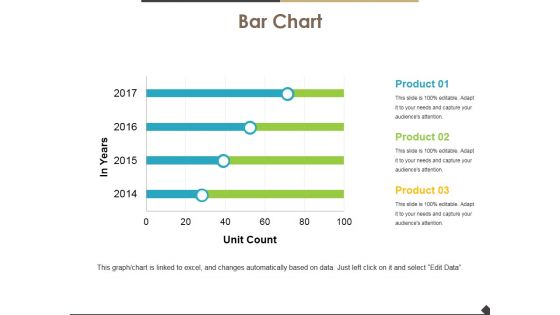
Bar Chart Ppt PowerPoint Presentation Show Grid
This is a bar chart ppt powerpoint presentation show grid. This is a four stage process. The stages in this process are bar chart, finance, marketing, analysis, business.
-
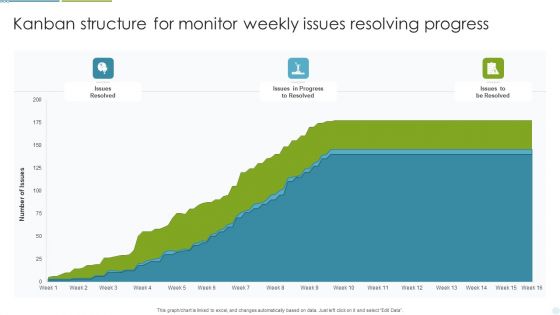
Kanban Structure For Monitor Weekly Issues Resolving Progress Ppt Professional Outline PDF
This graph or chart is linked to excel, and changes automatically based on data. Just left click on it and select Edit Data. Showcasing this set of slides titled Kanban Structure For Monitor Weekly Issues Resolving Progress Ppt Professional Outline PDF. The topics addressed in these templates are Issues Resolved, Progress To Resolved, Issues To Resolved. All the content presented in this PPT design is completely editable. Download it and make adjustments in color, background, font etc. as per your unique business setting.
-
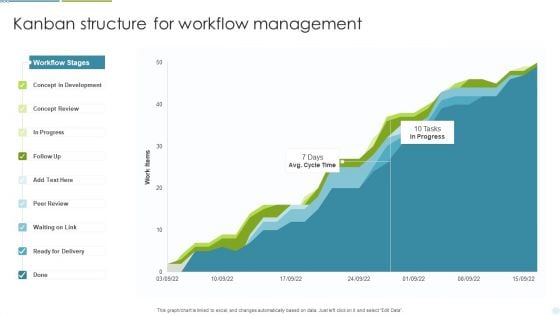
Kanban Structure For Workflow Management Ppt Inspiration Template PDF
This graph or chart is linked to excel, and changes automatically based on data. Just left click on it and select Edit Data. Pitch your topic with ease and precision using this Kanban Structure For Workflow Management Ppt Inspiration Template PDF. This layout presents information on Concept Development, Concept Review, Ready For Delivery. It is also available for immediate download and adjustment. So, changes can be made in the color, design, graphics or any other component to create a unique layout.
-
Kanban Structure To Track Cycle Time For Project Execution Ppt Icon Images PDF
This graph or chart is linked to excel, and changes automatically based on data. Just left click on it and select Edit Data. Showcasing this set of slides titled Kanban Structure To Track Cycle Time For Project Execution Ppt Icon Images PDF. The topics addressed in these templates are Lead Time, Cycle Time, WIP Limit. All the content presented in this PPT design is completely editable. Download it and make adjustments in color, background, font etc. as per your unique business setting.
-
Cash Flow Metrics Ppt PowerPoint Presentation Complete Deck With Slides
Improve your presentation delivery using this Cash Flow Metrics Ppt PowerPoint Presentation Complete Deck With Slides. Support your business vision and objectives using this well-structured PPT deck. This template offers a great starting point for delivering beautifully designed presentations on the topic of your choice. Comprising thirteen slides this professionally designed template is all you need to host discussion and meetings with collaborators. Each slide is self-explanatory and equipped with high-quality graphics that can be adjusted to your needs. Therefore, you will face no difficulty in portraying your desired content using this PPT slideshow. This PowerPoint slideshow contains every important element that you need for a great pitch. It is not only editable but also available for immediate download and utilization. The color, font size, background, shapes everything can be modified to create your unique presentation layout. Therefore, download it now.
-
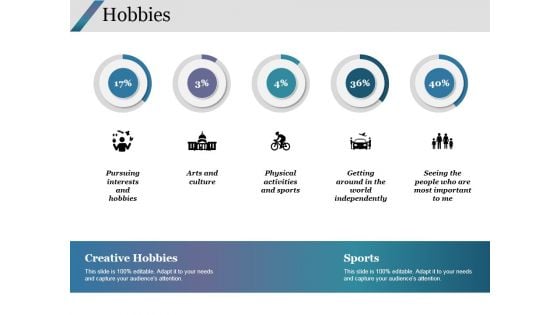
Hobbies Ppt PowerPoint Presentation Infographics Format
This is a hobbies ppt powerpoint presentation infographics format. This is a five stage process. The stages in this process are creative hobbies, sports, arts and culture, pursuing interests and hobbies, physical activities and sports.
-
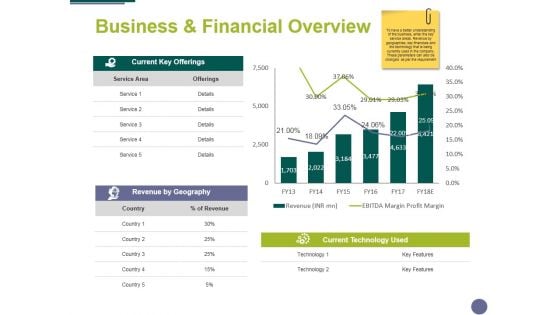
Business And Financial Overview Ppt PowerPoint Presentation Summary Format
This is a business and financial overview ppt powerpoint presentation summary format. This is a two stage process. The stages in this process are finance, analysis, marketing, business, compere.
-
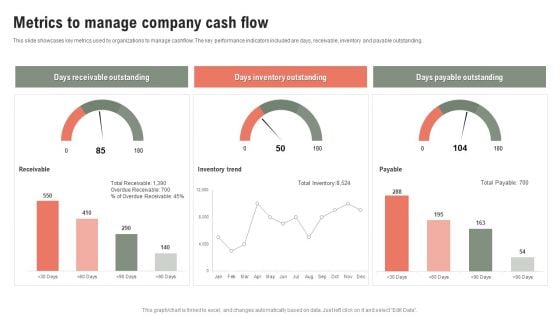
Metrics To Manage Company Cash Flow Ppt Model Gridlines PDF
This slide showcases key metrics used by organizations to manage cashflow. The key performance indicators included are days, receivable, inventory and payable outstanding. Pitch your topic with ease and precision using this Metrics To Manage Company Cash Flow Ppt Model Gridlines PDF. This layout presents information on Days Receivable Outstanding, Days Inventory Outstanding, Days Payable Outstanding. It is also available for immediate download and adjustment. So, changes can be made in the color, design, graphics or any other component to create a unique layout.
-
Manda Performance Tracker Ppt PowerPoint Presentation Layouts Designs
This is a manda performance tracker ppt powerpoint presentation layouts designs. This is a five stage process. The stages in this process are finance, analysis, marketing, strategy, business.
-
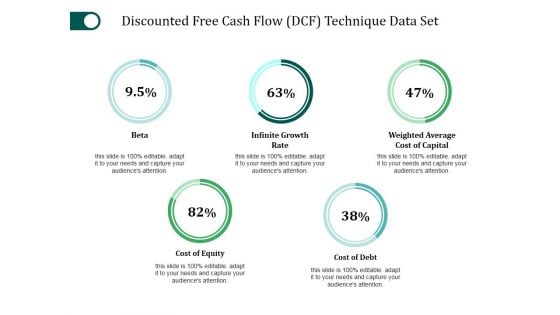
Discounted Free Cash Flow Technique Data Set Ppt PowerPoint Presentation File Summary
This is a discounted free cash flow technique data set ppt powerpoint presentation file summary. This is a five stage process. The stages in this process are beta, infinite growth rate, cost of equity, cost of debt.
-
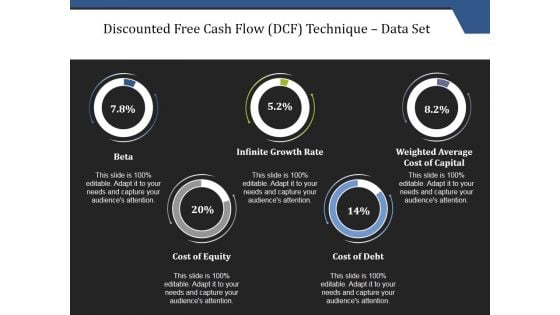
Discounted Free Cash Flow Dcf Technique Data Set Ppt PowerPoint Presentation File Inspiration
This is a discounted free cash flow dcf technique data set ppt powerpoint presentation file inspiration. This is a five stage process. The stages in this process are beta, infinite growth rate, weighted average cost of capital, cost of equity, cost of debt.
-
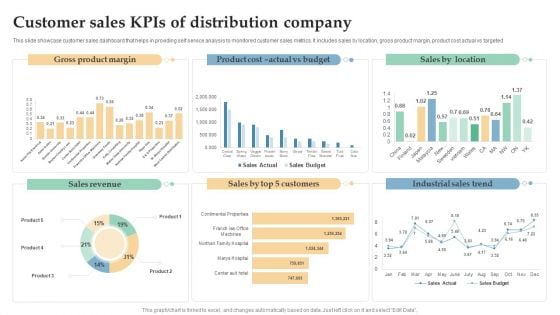
Customer Sales Kpis Of Distribution Company Ppt Infographic Template Templates PDF
This slide showcase customer sales dashboard that helps in providing self service analysis to monitored customer sales metrics. It includes sales by location, gross product margin, product cost actual vs targeted. Showcasing this set of slides titled Customer Sales Kpis Of Distribution Company Ppt Infographic Template Templates PDF. The topics addressed in these templates are Gross Product Margin, Sales Revenue, Industrial Sales Trend. All the content presented in this PPT design is completely editable. Download it and make adjustments in color, background, font etc. as per your unique business setting.
-
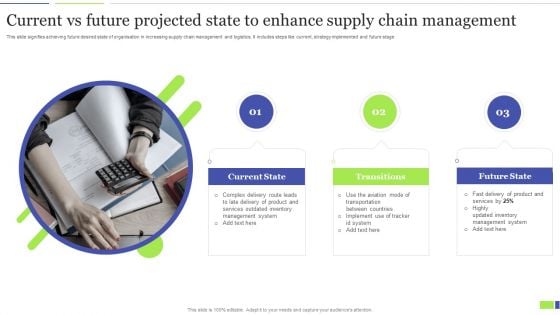
Current Vs Future Projected State To Enhance Supply Chain Management Guidelines PDF
This slide signifies achieving future desired state of organisation in increasing supply chain management and logistics. It includes steps like current, strategy implemented and future stage. Persuade your audience using this Current Vs Future Projected State To Enhance Supply Chain Management Guidelines PDF. This PPT design covers three stages, thus making it a great tool to use. It also caters to a variety of topics including Current State, Transitions, Future State. Download this PPT design now to present a convincing pitch that not only emphasizes the topic but also showcases your presentation skills.
-
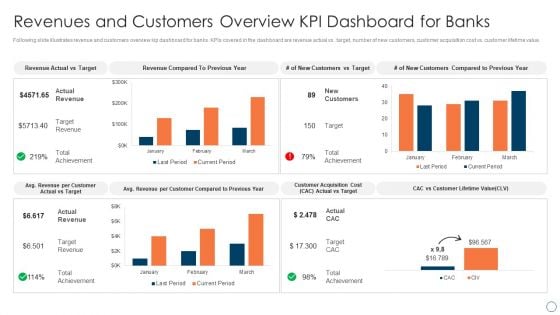
BPM Tools Application To Increase Revenues And Customers Overview KPI Dashboard For Banks Clipart PDF
Following slide illustrates revenue and customers overview kip dashboard for banks. KPIs covered in the dashboard are revenue actual vs. target, number of new customers, customer acquisition cost vs. customer lifetime value. Get a simple yet stunning designed BPM Tools Application To Increase Revenues And Customers Overview KPI Dashboard For Banks Clipart PDF. It is the best one to establish the tone in your meetings. It is an excellent way to make your presentations highly effective. So, download this PPT today from Slidegeeks and see the positive impacts. Our easy-to-edit BPM Tools Application To Increase Revenues And Customers Overview KPI Dashboard For Banks Clipart PDF can be your go-to option for all upcoming conferences and meetings. So, what are you waiting for Grab this template today.
-
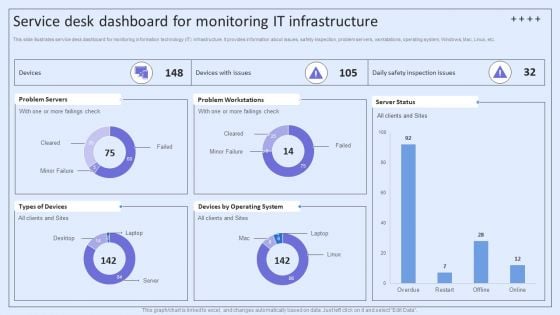
Integrating ITSM To Enhance Service Service Desk Dashboard For Monitoring It Infrastructure Infographics PDF
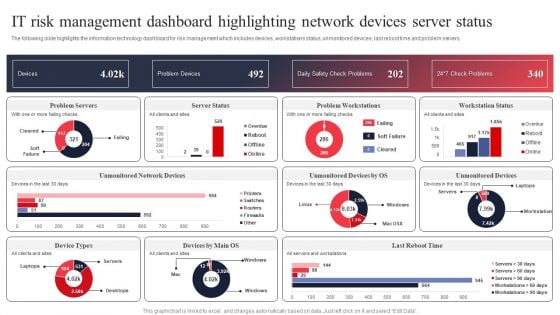
This slide illustrates service desk dashboard for monitoring information technology IT infrastructure. It provides information about issues, safety inspection, problem servers, workstations, operating system, Windows, Mac, Linux, etc. Do you know about Slidesgeeks Integrating ITSM To Enhance Service Service Desk Dashboard For Monitoring It Infrastructure Infographics PDF These are perfect for delivering any kind od presentation. Using it, create PowerPoint presentations that communicate your ideas and engage audiences. Save time and effort by using our pre-designed presentation templates that are perfect for a wide range of topic. Our vast selection of designs covers a range of styles, from creative to business, and are all highly customizable and easy to edit. Download as a PowerPoint template or use them as Google Slides themes.
-
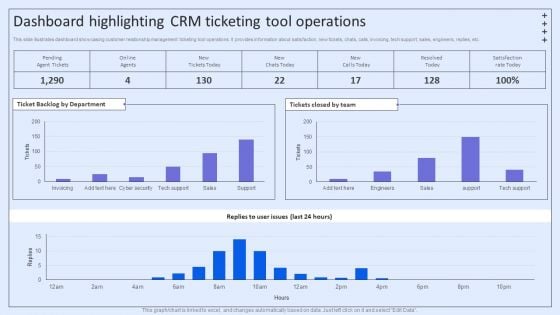
Integrating ITSM To Enhance Service Dashboard Highlighting CRM Ticketing Tool Operations Designs PDF
This slide illustrates dashboard showcasing customer relationship management ticketing tool operations. It provides information about satisfaction, new tickets, chats, calls, invoicing, tech support, sales, engineers, replies, etc. There are so many reasons you need a Integrating ITSM To Enhance Service Dashboard Highlighting CRM Ticketing Tool Operations Designs PDF. The first reason is you cant spend time making everything from scratch, Thus, Slidegeeks has made presentation templates for you too. You can easily download these templates from our website easily.
-
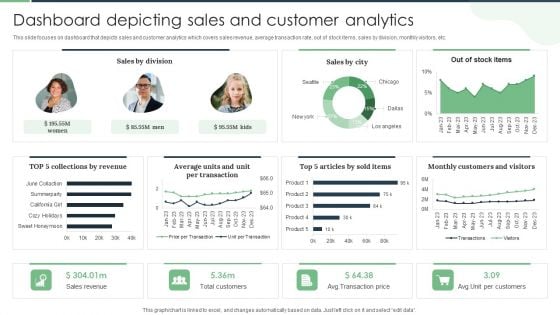
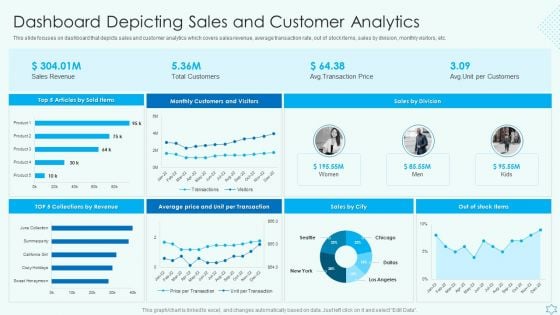
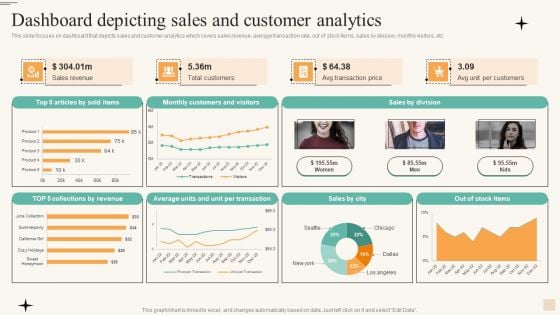
Dashboard Depicting Sales And Customer Analytics Professional PDF
This slide focuses on dashboard that depicts sales and customer analytics which covers sales revenue, average transaction rate, out of stock items, sales by division, monthly visitors, etc. Make sure to capture your audiences attention in your business displays with our gratis customizable Dashboard Depicting Sales And Customer Analytics Professional PDF. These are great for business strategies, office conferences, capital raising or task suggestions. If you desire to acquire more customers for your tech business and ensure they stay satisfied, create your own sales presentation with these plain slides.
-
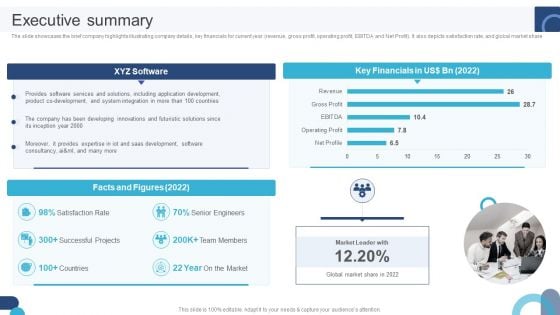
Digital Application Software Development Business Profile Executive Summary Structure PDF
The slide showcases the brief company highlights illustrating company details, key financials for current year revenue, gross profit, operating profit, EBITDA and Net Profit. It also depicts satisfaction rate, and global market share. If you are looking for a format to display your unique thoughts, then the professionally designed Digital Application Software Development Business Profile Executive Summary Structure PDF is the one for you. You can use it as a Google Slides template or a PowerPoint template. Incorporate impressive visuals, symbols, images, and other charts. Modify or reorganize the text boxes as you desire. Experiment with shade schemes and font pairings. Alter, share or cooperate with other people on your work. Download Digital Application Software Development Business Profile Executive Summary Structure PDF and find out how to give a successful presentation. Present a perfect display to your team and make your presentation unforgettable.
-
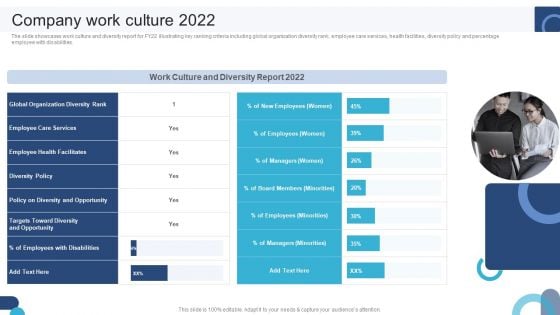
Digital Application Software Development Business Profile Company Work Culture 2022 Portrait PDF
The slide showcases work culture and diversity report for FY22 illustrating key ranking criteria including global organization diversity rank, employee care services, health facilities, diversity policy and percentage employee with disabilities. From laying roadmaps to briefing everything in detail, our templates are perfect for you. You can set the stage with your presentation slides. All you have to do is download these easy-to-edit and customizable templates. Digital Application Software Development Business Profile Company Work Culture 2022 Portrait PDF will help you deliver an outstanding performance that everyone would remember and praise you for. Do download this presentation today.
-
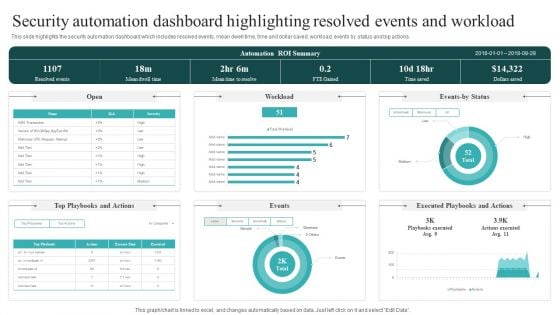
Security Automation Dashboard Highlighting Resolved Events And Workload Guidelines PDF
This slide highlights the security automation dashboard which includes resolved events, mean dwell time, time and dollar saved, workload, events by status and top actions. This Security Automation Dashboard Highlighting Resolved Events And Workload Guidelines PDF is perfect for any presentation, be it in front of clients or colleagues. It is a versatile and stylish solution for organizing your meetings. The Security Automation Dashboard Highlighting Resolved Events And Workload Guidelines PDF features a modern design for your presentation meetings. The adjustable and customizable slides provide unlimited possibilities for acing up your presentation. Slidegeeks has done all the homework before launching the product for you. So, don not wait, grab the presentation templates today.
-
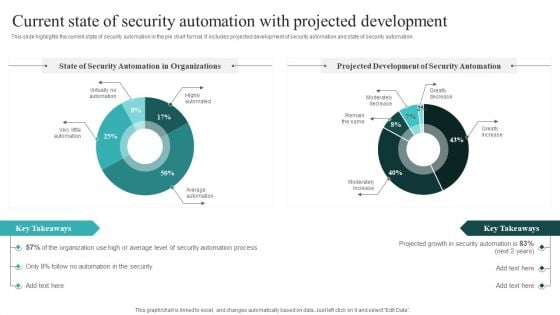
Current State Of Security Automation With Projected Development Slides PDF
This slide highlights the current state of security automation in the pie chart format. It includes projected development of security automation and state of security automation. If you are looking for a format to display your unique thoughts, then the professionally designed IT Security Automation Systems Guide Different Security Automation Tools With Pros And Cons Summary PDF is the one for you. You can use it as a Google Slides template or a PowerPoint template. Incorporate impressive visuals, symbols, images, and other charts. Modify or reorganize the text boxes as you desire. Experiment with shade schemes and font pairings. Alter, share or cooperate with other people on your work. Download IT Security Automation Systems Guide Different Security Automation Tools With Pros And Cons Summary PDF and find out how to give a successful presentation. Present a perfect display to your team and make your presentation unforgettable.
-
Deploy Merchandise Program To Enhance Sales Dashboard Depicting Sales And Customer Analytics Sample PDF
This slide focuses on dashboard that depicts sales and customer analytics which covers sales revenue, average transaction rate, out of stock items, sales by division, monthly visitors, etc. Make sure to capture your audiences attention in your business displays with our gratis customizable Deploy Merchandise Program To Enhance Sales Dashboard Depicting Sales And Customer Analytics Sample PDF. These are great for business strategies, office conferences, capital raising or task suggestions. If you desire to acquire more customers for your tech business and ensure they stay satisfied, create your own sales presentation with these plain slides.
-
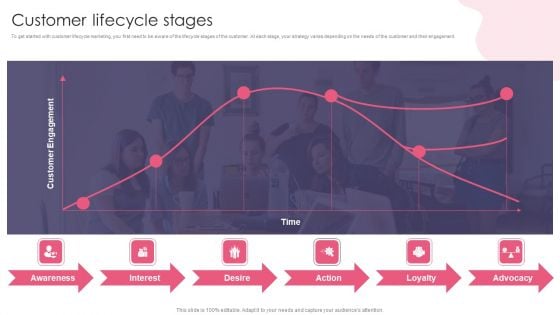
Customer Digital Lifecycle Marketing And Planning Stages Customer Lifecycle Stages Guidelines PDF
To get started with customer lifecycle marketing, you first need to be aware of the lifecycle stages of the customer. At each stage, your strategy varies depending on the needs of the customer and their engagement. Formulating a presentation can take up a lot of effort and time, so the content and message should always be the primary focus. The visuals of the PowerPoint can enhance the presenters message, so our Customer Digital Lifecycle Marketing And Planning Stages Customer Lifecycle Stages Guidelines PDF was created to help save time. Instead of worrying about the design, the presenter can concentrate on the message while our designers work on creating the ideal templates for whatever situation is needed. Slidegeeks has experts for everything from amazing designs to valuable content, we have put everything into Customer Digital Lifecycle Marketing And Planning Stages Customer Lifecycle Stages Guidelines PDF.
-
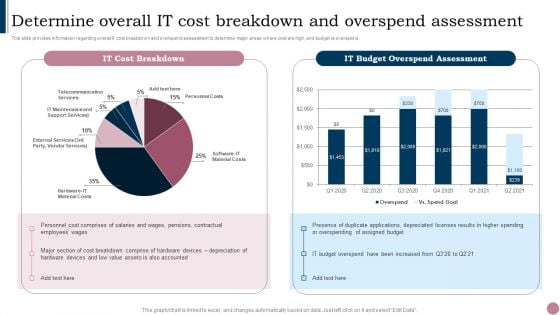
Cios Guide To Optimize Determine Overall IT Cost Breakdown And Overspend Themes PDF
This slide provides information regarding overall It cost breakdown and overspend assessment to determine major areas where cost are high, and budget is overspend. Crafting an eye-catching presentation has never been more straightforward. Let your presentation shine with this tasteful yet straightforward Cios Guide To Optimize Determine Overall IT Cost Breakdown And Overspend Themes PDF template. It offers a minimalistic and classy look that is great for making a statement. The colors have been employed intelligently to add a bit of playfulness while still remaining professional. Construct the ideal Cios Guide To Optimize Determine Overall IT Cost Breakdown And Overspend Themes PDF that effortlessly grabs the attention of your audience Begin now and be certain to wow your customers.
-
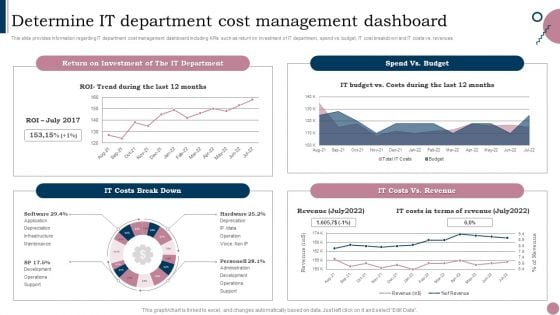
Cios Guide To Optimize Determine IT Department Cost Management Dashboard Ideas PDF
This slide provides information regarding IT department cost management dashboard including KPIs such as return on investment of IT department, spend vs. budget, IT cost breakdown and IT costs vs. revenues. Find highly impressive Cios Guide To Optimize Determine IT Department Cost Management Dashboard Ideas PDF on Slidegeeks to deliver a meaningful presentation. You can save an ample amount of time using these presentation templates. No need to worry to prepare everything from scratch because Slidegeeks experts have already done a huge research and work for you. You need to download Cios Guide To Optimize Determine IT Department Cost Management Dashboard Ideas PDF for your upcoming presentation. All the presentation templates are 100 percent editable and you can change the color and personalize the content accordingly. Download now.
-
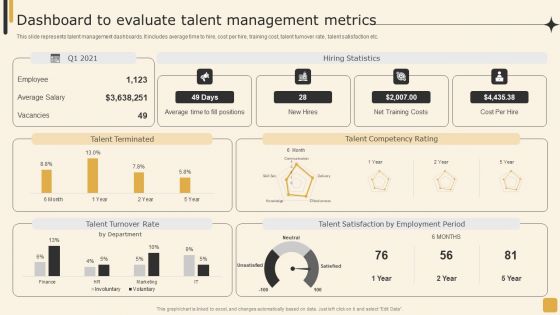
Dashboard To Evaluate Talent Management Metrics Employee Performance Management Tactics Themes PDF
This slide represents talent management dashboards. It includes average time to hire, cost per hire, training cost, talent turnover rate, talent satisfaction etc.Presenting this PowerPoint presentation, titled Dashboard To Evaluate Talent Management Metrics Employee Performance Management Tactics Themes PDF, with topics curated by our researchers after extensive research. This editable presentation is available for immediate download and provides attractive features when used. Download now and captivate your audience. Presenting this Dashboard To Evaluate Talent Management Metrics Employee Performance Management Tactics Themes PDF. Our researchers have carefully researched and created these slides with all aspects taken into consideration. This is a completely customizable Dashboard To Evaluate Talent Management Metrics Employee Performance Management Tactics Themes PDF that is available for immediate downloading. Download now and make an impact on your audience. Highlight the attractive features available with our PPTs.
-
Our Financial Details Company Process Administration And Optimization Playbook Microsoft PDF
The following slide displays the key financial details of the organization as the provided graphs displays the gross profit margin, earning per share and revenues of the organization for the past 3 years.Crafting an eye-catching presentation has never been more straightforward. Let your presentation shine with this tasteful yet straightforward Our Financial Details Company Process Administration And Optimization Playbook Microsoft PDF template. It offers a minimalistic and classy look that is great for making a statement. The colors have been employed intelligently to add a bit of playfulness while still remaining professional. Construct the ideal Our Financial Details Company Process Administration And Optimization Playbook Microsoft PDF that effortlessly grabs the attention of your audience Begin now and be certain to wow your customers.
-
Business Concepts PowerPoint Icon S
Business concepts poster isolated over a white background
-
Key Business Metrics Dashboard Company Process Administration And Optimization Playbook Infographics PDF
The following dashboard displays the key business metrics such as new customers, profit, revenue per customer, and weekly revenue. Slidegeeks is here to make your presentations a breeze with Key Business Metrics Dashboard Company Process Administration And Optimization Playbook Infographics PDF With our easy-to-use and customizable templates, you can focus on delivering your ideas rather than worrying about formatting. With a variety of designs to choose from, you are sure to find one that suits your needs. And with animations and unique photos, illustrations, and fonts, you can make your presentation pop. So whether you are giving a sales pitch or presenting to the board, make sure to check out Slidegeeks first.
-
Utilizing SEO To Boost Customer SEO Reporting Dashboard To Evaluate Website Rank Background PDF
The purpose of this slide is to outline mobile search engine optimization SEO reporting dashboard. It covers different metrics such as web traffic overview, total views, content overview, goal value and conversion etc. Take your projects to the next level with our ultimate collection of Utilizing SEO To Boost Customer SEO Reporting Dashboard To Evaluate Website Rank Background PDF. Slidegeeks has designed a range of layouts that are perfect for representing task or activity duration, keeping track of all your deadlines at a glance. Tailor these designs to your exact needs and give them a truly corporate look with your own brand colors theyll make your projects stand out from the rest.
-
KPI Dashboard To Forecast Smart Production Market Ppt PowerPoint Presentation Gallery Visual Aids PDF
This slide signifies the key performance indicator dashboard to evaluate smart production market. It covers information about major market players, market end users, top companies and components. Pitch your topic with ease and precision using this KPI Dashboard To Forecast Smart Production Market Ppt PowerPoint Presentation Gallery Visual Aids PDF. This layout presents information on Global Smart Manufacturing, Market Forecast, 2019 To 2023. It is also available for immediate download and adjustment. So, changes can be made in the color, design, graphics or any other component to create a unique layout.
-
Project Controlling Dashboard Indicating Stages And Deliverables Ppt Styles Guide PDF
This slide shows dashboard for controlling multiple phases and deliverables of project. It provides information such as total revenue, cost, margin, task by status, risk, planned end date, owner, etc. Pitch your topic with ease and precision using this Project Controlling Dashboard Indicating Stages And Deliverables Ppt Styles Guide PDF. This layout presents information on Total Revenue, Total Margin, Total Cost. It is also available for immediate download and adjustment. So, changes can be made in the color, design, graphics or any other component to create a unique layout.
-
Ecommerce Customer Survey With Customer NPS Metric Rating Scale Ppt Inspiration Visual Aids PDF
This slide shows net promoter score rating scale with ecommerce customer survey. It includes information about price fairness, customer support experience, order checkout, product quality, passives, promoters, detractors, etc. Pitch your topic with ease and precision using this Ecommerce Customer Survey With Customer NPS Metric Rating Scale Ppt Inspiration Visual Aids PDF. This layout presents information on Net Promoter Score, Price Fairness, Product Purchased. It is also available for immediate download and adjustment. So, changes can be made in the color, design, graphics or any other component to create a unique layout.
-
Enterprise Resource Planning System Dashboard To Measure Construction Project Performance Download PDF
Following slide highlights ERP system dashboard showcasing the results of construction project. The template provides information about project type, work status, stages, completion percentage, utilized duration, workload etc. Showcasing this set of slides titled Enterprise Resource Planning System Dashboard To Measure Construction Project Performance Download PDF. The topics addressed in these templates are Project By Stage, Project Completion, Planned Resources. All the content presented in this PPT design is completely editable. Download it and make adjustments in color, background, font etc. as per your unique business setting.
-
Automated Testing Framework Dashboard Indicating Reported Issues And Results Ideas PDF
This slide showcase test automation framework dashboard indicating reported issues and results which can benefit IT firms in quick resolution of these problems. It contains information about weekly total, test results and details. It also includes information about passed, known issue, avoided, ended, queued, etc. Showcasing this set of slides titled Automated Testing Framework Dashboard Indicating Reported Issues And Results Ideas PDF. The topics addressed in these templates are Weekly Total, Test Results, Last 7 Days. All the content presented in this PPT design is completely editable. Download it and make adjustments in color, background, font etc. as per your unique business setting.
-
Strategy Evaluation Ppt PowerPoint Presentation Complete Deck With Slides
Improve your presentation delivery using this Strategy Evaluation Ppt PowerPoint Presentation Complete Deck With Slides. Support your business vision and objectives using this well-structured PPT deck. This template offers a great starting point for delivering beautifully designed presentations on the topic of your choice. Comprisingtwelve slides this professionally designed template is all you need to host discussion and meetings with collaborators. Each slide is self-explanatory and equipped with high-quality graphics that can be adjusted to your needs. Therefore, you will face no difficulty in portraying your desired content using this PPT slideshow. This PowerPoint slideshow contains every important element that you need for a great pitch. It is not only editable but also available for immediate download and utilization. The color, font size, background, shapes everything can be modified to create your unique presentation layout. Therefore, download it now.
-
Digital Marketing Budget Spending Evaluation Video Content Advertising Strategies For Youtube Background PDF
This slide highlights the graph which showcase digital marketing spending analysis with key takeaway section it also includes the youtube marketing, instagram marketing, SEO marketing, facebook marketing with content marketing spending.Slidegeeks is here to make your presentations a breeze with Digital Marketing Budget Spending Evaluation Video Content Advertising Strategies For Youtube Background PDF With our easy-to-use and customizable templates, you can focus on delivering your ideas rather than worrying about formatting. With a variety of designs to choose from, you are sure to find one that suits your needs. And with animations and unique photos, illustrations, and fonts, you can make your presentation pop. So whether you are giving a sales pitch or presenting to the board, make sure to check out Slidegeeks first.
-
Steps Of ERP Data Migration Strategy Ppt PowerPoint Presentation Gallery Graphic Tips PDF
This slide showcases the steps of building the strategy for business ERP system data migration. The steps includes such as planning, preparation, design, execution, testing and maintenance. Presenting Steps Of ERP Data Migration Strategy Ppt PowerPoint Presentation Gallery Graphic Tips PDF to dispense important information. This template comprises six stages. It also presents valuable insights into the topics including Maintenance, Testing, Execution, Design. This is a completely customizable PowerPoint theme that can be put to use immediately. So, download it and address the topic impactfully.
-
Improving Effective Human Resource Communication Impact On Employee Engagement Dashboard Slides PDF
This slide shows the dashboard representing the impact of effective hr communication within the organization on employee engagement score. It shows details related to engagement score, response rate, engagement score of teams, net promoter score etc. Pitch your topic with ease and precision using this Improving Effective Human Resource Communication Impact On Employee Engagement Dashboard Slides PDF. This layout presents information on Engagement Score, Response Rate, Engagement Score Levels. It is also available for immediate download and adjustment. So, changes can be made in the color, design, graphics or any other component to create a unique layout.
-
Application Of Artificial Intelligence AI Driven Dashboard With Website Kpis Formats PDF
This slide shows AI driven dashboard with website KPIs. It provides information such as total visits, traffic sources, geography, bounce rate, monthly visits, average visit time, etc. Showcasing this set of slides titled Application Of Artificial Intelligence AI Driven Dashboard With Website Kpis Formats PDF. The topics addressed in these templates are Bounce Rate, Monthly Visits, Traffic Sources. All the content presented in this PPT design is completely editable. Download it and make adjustments in color, background, font etc. as per your unique business setting.
-
Strategic Market Summary Assessment Dashboard To Build Entry Planning Ppt Layouts Background Image PDF
The following slide highlights the KPIs of existing market to analyze and form entry plan for new market segment. It includes KPAs such as overview, competition, market share and size etc. Persuade your audience using this Strategic Market Summary Assessment Dashboard To Build Entry Planning Ppt Layouts Background Image PDF. This PPT design covers one stages, thus making it a great tool to use. It also caters to a variety of topics including Market Overview, Website Traffic, Projected Budget. Download this PPT design now to present a convincing pitch that not only emphasizes the topic but also showcases your presentation skills.
-
E Commerce Business Sales Monthly Forecast Graph Ppt Infographics Show PDF
This slide shows the table and graph representing monthly sales forecast of an e-commerce business. It shows details related to the expected growth rate, historical data, projected data and actual growth of sales. Pitch your topic with ease and precision using this E Commerce Business Sales Monthly Forecast Graph Ppt Infographics Show PDF. This layout presents information on Expected Growth Rate, Historical, Actual Growth Rate. It is also available for immediate download and adjustment. So, changes can be made in the color, design, graphics or any other component to create a unique layout.
-
Automobile Company Actual And Forecasted Monthly Sales Dashboard Ppt Infographic Template Aids PDF
This slide shows the dashboard for forecasting the sales of an automobile company for the current month. It represents details related to revenue by pipeline, new deals, sales forecast, revenue goal attainment by owner for the current month and pipeline coverage by next month. Showcasing this set of slides titled Automobile Company Actual And Forecasted Monthly Sales Dashboard Ppt Infographic Template Aids PDF. The topics addressed in these templates are Forecast Month, Revenue Goal Attainment, Revenue Goal Attainment. All the content presented in this PPT design is completely editable. Download it and make adjustments in color, background, font etc. as per your unique business setting.
-
Statistics Showing Growth Rate Of Cloud Computing Project Administration Ppt Ideas Aids PDF
Mentioned slide showcases key statistics related to growth rate of cloud based project management industry. Information covered in this slide is related to CAGR, incremental growth, impact on IT industry, growth for the year 2022, etc. Showcasing this set of slides titled Statistics Showing Growth Rate Of Cloud Computing Project Administration Ppt Ideas Aids PDF. The topics addressed in these templates are IT Industry, Growth 2023, Incremental Growth. All the content presented in this PPT design is completely editable. Download it and make adjustments in color, background, font etc. as per your unique business setting.
-
Business Concepts PowerPoint Icon C
Business concepts poster isolated over a white background
-
Online Money Transfer Ppt PowerPoint Presentation Complete Deck With Slides
Improve your presentation delivery using this Online Money Transfer Ppt PowerPoint Presentation Complete Deck With Slides. Support your business vision and objectives using this well-structured PPT deck. This template offers a great starting point for delivering beautifully designed presentations on the topic of your choice. Comprising twenty slides this professionally designed template is all you need to host discussion and meetings with collaborators. Each slide is self-explanatory and equipped with high-quality graphics that can be adjusted to your needs. Therefore, you will face no difficulty in portraying your desired content using this PPT slideshow. This PowerPoint slideshow contains every important element that you need for a great pitch. It is not only editable but also available for immediate download and utilization. The color, font size, background, shapes everything can be modified to create your unique presentation layout. Therefore, download it now.
-
Reviewing Operations And Expenditures Through Cash Flow Statement Ideas PDF
The following slide depicts reviewing operations and expenditure through cash flow statement. It provides information about sales tax, liabilities, borrowings, cash spending, bill payments, repayment, etc. Boost your pitch with our creative Reviewing Operations And Expenditures Through Cash Flow Statement Ideas PDF. Deliver an awe-inspiring pitch that will mesmerize everyone. Using these presentation templates you will surely catch everyones attention. You can browse the ppts collection on our website. We have researchers who are experts at creating the right content for the templates. So you do not have to invest time in any additional work. Just grab the template now and use them.
-
P And L Statement To Analyze Net Profits Mockup PDF
The following slide depicts P and L statement to assess net profits. It provides information about cost of sales, gross margin, payroll, sales, marketing, depreciation, rent, payroll, interest, taxes, net sales, etc. Find a pre designed and impeccable P And L Statement To Analyze Net Profits Mockup PDF. The templates can ace your presentation without additional effort. You can download these easy to edit presentation templates to make your presentation stand out from others. So, what are you waiting for Download the template from Slidegeeks today and give a unique touch to your presentation.
-
Ecommerce KPI Dashboard With Pand L Statement Download PDF
This slide showcases ecommerce key performance indicators KPI dashboard with financial statement. It provides information about total sales, orders, net profit, net profit margin, average order value, channels, etc. This Ecommerce KPI Dashboard With Pand L Statement Download PDF from Slidegeeks makes it easy to present information on your topic with precision. It provides customization options, so you can make changes to the colors, design, graphics, or any other component to create a unique layout. It is also available for immediate download, so you can begin using it right away. Slidegeeks has done good research to ensure that you have everything you need to make your presentation stand out. Make a name out there for a brilliant performance.
-
Technical Analysis Dashboard With Website Performance Report Ppt Inspiration Outline PDF
This slide showcases dashboard for website Analysis that can help to identify the reasons and errors for decline in website speed and performance. Its key elements are site health, crawled pages and thematic reports. Showcasing this set of slides titled Technical Analysis Dashboard With Website Performance Report Ppt Inspiration Outline PDF. The topics addressed in these templates are Crawlability, International SEO, Site Performance, International Linking. All the content presented in this PPT design is completely editable. Download it and make adjustments in color, background, font etc. as per your unique business setting.
-
Website Analysis Ppt PowerPoint Presentation Complete Deck With Slides
This Website Analysis Ppt PowerPoint Presentation Complete Deck With Slides acts as backup support for your ideas, vision, thoughts, etc. Use it to present a thorough understanding of the topic. This PPT slideshow can be utilized for both in-house and outside presentations depending upon your needs and business demands. Entailing fifteen slides with a consistent design and theme, this template will make a solid use case. As it is intuitively designed, it suits every business vertical and industry. All you have to do is make a few tweaks in the content or any other component to design unique presentations. The biggest advantage of this complete deck is that it can be personalized multiple times once downloaded. The color, design, shapes, and other elements are free to modify to add personal touches. You can also insert your logo design in this PPT layout. Therefore a well-thought and crafted presentation can be delivered with ease and precision by downloading this Website Analysis Ppt PowerPoint Presentation Complete Deck With Slides PPT slideshow.
-
Procurement Automation Strategy End To End Process Tracking Dashboard On Cloud Icons PDF
This slide covers tool for analysing end to end procurement process. It includes features such as tracking real- time overall business health, checking quotation to order conversion, automated notifications and payments reminders, etc. If you are looking for a format to display your unique thoughts, then the professionally designed Procurement Automation Strategy End To End Process Tracking Dashboard On Cloud Icons PDF is the one for you. You can use it as a Google Slides template or a PowerPoint template. Incorporate impressive visuals, symbols, images, and other charts. Modify or reorganize the text boxes as you desire. Experiment with shade schemes and font pairings. Alter, share or cooperate with other people on your work. Download Procurement Automation Strategy End To End Process Tracking Dashboard On Cloud Icons PDF and find out how to give a successful presentation. Present a perfect display to your team and make your presentation unforgettable.
-
Business Performance Monitoring Kpi Dashboard Guide For Successful Merger And Acquisition Mockup PDF
Coming up with a presentation necessitates that the majority of the effort goes into the content and the message you intend to convey. The visuals of a PowerPoint presentation can only be effective if it supplements and supports the story that is being told. Keeping this in mind our experts created Business Performance Monitoring Kpi Dashboard Guide For Successful Merger And Acquisition Mockup PDF to reduce the time that goes into designing the presentation. This way, you can concentrate on the message while our designers take care of providing you with the right template for the situation.
-
IT System Risk Management Guide IT Risk Management Dashboard Highlighting Network Devices Server Status Elements PDF
The following slide highlights the information technology dashboard for risk management which includes devices, workstations status, unmonitored devices, last reboot time and problem servers. If you are looking for a format to display your unique thoughts, then the professionally designed IT System Risk Management Guide IT Risk Management Dashboard Highlighting Network Devices Server Status Elements PDF is the one for you. You can use it as a Google Slides template or a PowerPoint template. Incorporate impressive visuals, symbols, images, and other charts. Modify or reorganize the text boxes as you desire. Experiment with shade schemes and font pairings. Alter, share or cooperate with other people on your work. Download IT System Risk Management Guide IT Risk Management Dashboard Highlighting Network Devices Server Status Elements PDF and find out how to give a successful presentation. Present a perfect display to your team and make your presentation unforgettable.
-
Usage Trend Chart Of Skincare Product Market Ppt Slides Graphics Download PDF
This slide shows market trend graph of skincare product usage in four quarters. It also indicates that product A is most preferred by the customers. Pitch your topic with ease and precision using this Usage Trend Chart Of Skincare Product Market Ppt Slides Graphics Download PDF. This layout presents information on Trend Product, Skincare Product, Quarter Due. It is also available for immediate download and adjustment. So, changes can be made in the color, design, graphics or any other component to create a unique layout.
-
Dashboard For Monitoring Process Performance Of Wastewater Treatment Plant Ppt Infographic Template Demonstration PDF
This slide showcase dashboard for monitoring process performance of wastewater management plant which contains cooling degrees, control, efficiency, protection, etc. Showcasing this set of slides titled Dashboard For Monitoring Process Performance Of Wastewater Treatment Plant Ppt Infographic Template Demonstration PDF. The topics addressed in these templates are Percent Control, Water Use Efficiency, Scale Protection, Protection From Erosion. All the content presented in this PPT design is completely editable. Download it and make adjustments in color, background, font etc. as per your unique business setting.
-
Kpis To Measure Social Media Recruitment Success Tactical Plan To Enhance Social Media Hiring Process Clipart PDF
This slide focuses on key performance indicators to measure social media recruitment success which includes time to hire, recruitment costs, age of applicants, recruitment funnel, ratio of male and female.Do you have to make sure that everyone on your team knows about any specific topic I yes, then you should give ProKpis To Measure Social Media Recruitment Success Tactical Plan To Enhance Social Media Hiring Process Clipart PDF a try. Our experts have put a lot of knowledge and effort into creating this impeccable Kpis To Measure Social Media Recruitment Success Tactical Plan To Enhance Social Media Hiring Process Clipart PDF. You can use this template for your upcoming presentations, as the slides are perfect to represent even the tiniest detail. You can download these templates from the Slidegeeks website and these are easy to edit. So grab these today.
-
Performance Measurement KPI Dashboard For Fintech Firm Investment In Latest Technology To Ensure Portrait PDF
Following slide portrays performance measurement dashboard for FinTech companies with KPIs namely available cash, cash flow, ROA, working capital ratio, days sales outstanding and days payable outstanding.Whether you have daily or monthly meetings, a brilliant presentation is necessary. Performance Measurement KPI Dashboard For Fintech Firm Investment In Latest Technology To Ensure Portrait PDF can be your best option for delivering a presentation. Represent everything in detail using Performance Measurement KPI Dashboard For Fintech Firm Investment In Latest Technology To Ensure Portrait PDF and make yourself stand out in meetings. The template is versatile and follows a structure that will cater to your requirements. All the templates prepared by Slidegeeks are easy to download and edit. Our research experts have taken care of the corporate themes as well. So, give it a try and see the results.
-
Business Threats Landscape Dashboard With Cyber Attacks Analysis Ppt Summary Brochure PDF
This slide illustrates risk landscape dashboard with cyber attacks analysis which contains malware attack frequency, country wise attacks, top 10 attacks, etc. It can assist IT managers in analyzing top threats so that they can be dealt with proper efficiency. Pitch your topic with ease and precision using this Business Threats Landscape Dashboard With Cyber Attacks Analysis Ppt Summary Brochure PDF. This layout presents information on Malware Attack Frequency, Every Minute, Every Second. It is also available for immediate download and adjustment. So, changes can be made in the color, design, graphics or any other component to create a unique layout.
-
Hospital Management Software Dashboard Depicting Health Admin Tasks Ppt Pictures Inspiration PDF
This Slide represents hospital management system dashboard depicting health admin tasks. It includes detail such as active doctors, patients, representatives, nurses and other staff. Pitch your topic with ease and precision using this Hospital Management Software Dashboard Depicting Health Admin Tasks Ppt Pictures Inspiration PDF. This layout presents information on Active Doctors, Active Patients, Representative. It is also available for immediate download and adjustment. So, changes can be made in the color, design, graphics or any other component to create a unique layout.
-
Financial Budgeting And Assessment Dashboard With Revenue Variance Designs PDF
This slide shows the dashboard representing financial analysis and planning of an organization. It highlights the set revenue targets and actual revenue with the help of graphs. Showcasing this set of slides titled Financial Budgeting And Assessment Dashboard With Revenue Variance Designs PDF. The topics addressed in these templates are YTD Revenue, Revenue Delta, Revenue Variance. All the content presented in this PPT design is completely editable. Download it and make adjustments in color, background, font etc. as per your unique business setting.
-
Earned Value Management Analysis Performance Measurement Ppt Infographics Portrait PDF
This slide represents earned value management analysis performance measurement illustrating performance measure such as schedule variance and cost variance. Presenting Earned Value Management Analysis Performance Measurement Ppt Infographics Portrait PDF to dispense important information. This template comprises two stages. It also presents valuable insights into the topics including Performance Measure, Schedule Variance, Cost Variance. This is a completely customizable PowerPoint theme that can be put to use immediately. So, download it and address the topic impactfully.
-
Employee Training Dashboard Of Human Resource Department Ppt Outline Themes PDF
This slide represents the dashboard of human resource department showing data related to training of organizational employees. It shows data related to employee training needs, training budget, approved training demands and its total cost, number of participants, cost per participant, total training hours and its cost per hour. Showcasing this set of slides titled Employee Training Dashboard Of Human Resource Department Ppt Outline Themes PDF. The topics addressed in these templates are Employee Training Demands, Approved Training Demands, Cost per Participant. All the content presented in this PPT design is completely editable. Download it and make adjustments in color, background, font etc. as per your unique business setting.
-
KPI Dashboard For Tracking Supply Chain Costs Industry Analysis Of Food Formats PDF
This slide represents the KPI dashboard to track the multiple cost associated with supply chain in food manufacturing industry. It includes information regarding cash to cash cycle in days, carry cost of inventory along with details of net sales.Find a pre-designed and impeccable KPI Dashboard For Tracking Supply Chain Costs Industry Analysis Of Food Formats PDF. The templates can ace your presentation without additional effort. You can download these easy-to-edit presentation templates to make your presentation stand out from others. So, what are you waiting for Download the template from Slidegeeks today and give a unique touch to your presentation.
-
Food Segments Contribution Towards Total Production And Global Export Industry Analysis Of Food Slides PDF
This slide graphically provides information regarding the contribution of multiple food components such as meats, diary, grains and oil seeds, fruits and vegetables etc. Towards total food production and global export.The best PPT templates are a great way to save time, energy, and resources. Slidegeeks have 100precent editable powerpoint slides making them incredibly versatile. With these quality presentation templates, you can create a captivating and memorable presentation by combining visually appealing slides and effectively communicating your message. Download Food Segments Contribution Towards Total Production And Global Export Industry Analysis Of Food Slides PDF from Slidegeeks and deliver a wonderful presentation.
-
Workforce Productivity Tracking Report Slide2 Professional PDF
The following slide highlights the KPIs of work streams to identify the threats and formulate strategies to mitigate its effect. It includes elements such as summary, health report etc. Pitch your topic with ease and precision using this Workforce Productivity Tracking Report Slide2 Professional PDF. This layout presents information on Sales, Issues, Budget, Workforce. It is also available for immediate download and adjustment. So, changes can be made in the color, design, graphics or any other component to create a unique layout.
-
Workforce Productivity Tracking Report Kpi Dashboard Icons PDF
The following slide presents the KPAs of project work stream for transparency and better decision making. It includes KPIs such as work stream status, priority check, planned vs actual budget etc. Showcasing this set of slides titled Workforce Productivity Tracking Report Kpi Dashboard Icons PDF. The topics addressed in these templates are Initiation Meeting, Resource Assessment, Technological Analysis. All the content presented in this PPT design is completely editable. Download it and make adjustments in color, background, font etc. as per your unique business setting.
-
Work Stream Function Breakdown Status Report Demonstration PDF
The following slide highlights the key indicators of work stream to assists decision makers and identify flaws. It constitutes of work stream function breakdown into characteristics, obligations, threats, deficiencies etc. Pitch your topic with ease and precision using this Work Stream Function Breakdown Status Report Demonstration PDF. This layout presents information on Characteristics, Obligations, Threats, Deficiencies. It is also available for immediate download and adjustment. So, changes can be made in the color, design, graphics or any other component to create a unique layout.
-
Kpi Dashboard To Measure Performance Of Service Promotion And Advertisement Plan Background PDF
The purpose of this slide is to showcase a performance KPI dashboard used to evaluate the performance of hospitality service marketing plan. The template covers information about the food and beverage revenue, top 5 expenses by account and department, etc. Showcasing this set of slides titled Kpi Dashboard To Measure Performance Of Service Promotion And Advertisement Plan Background PDF. The topics addressed in these templates areLocation, Account, Cost Revenue. All the content presented in this PPT design is completely editable. Download it and make adjustments in color, background, font etc. as per your unique business setting.
-
KPI Dashboard For Measuring Ecommerce Marketing Ecommerce Marketing Plan To Enhance Brochure PDF
This slide represents ecommerce dashboard showcasing marketing performance. It includes sales breakdown, net revenue through channels, sales forecast, sales funnel etc.Find highly impressive KPI Dashboard For Measuring Ecommerce Marketing Ecommerce Marketing Plan To Enhance Brochure PDF on Slidegeeks to deliver a meaningful presentation. You can save an ample amount of time using these presentation templates. No need to worry to prepare everything from scratch because Slidegeeks experts have already done a huge research and work for you. You need to download KPI Dashboard For Measuring Ecommerce Marketing Ecommerce Marketing Plan To Enhance Brochure PDF for your upcoming presentation. All the presentation templates are 100precent editable and you can change the color and personalize the content accordingly. Download now.
-
Dashboard To Evaluate Marketing Campaign Performance Ecommerce Marketing Plan To Enhance Microsoft PDF
This slide represents dashboard to evaluate marketing campaign performance. It includes revenue, sales, total orders, order value, conversion rate etc.Do you have to make sure that everyone on your team knows about any specific topic I yes, then you should give Dashboard To Evaluate Marketing Campaign Performance Ecommerce Marketing Plan To Enhance Microsoft PDF a try. Our experts have put a lot of knowledge and effort into creating this impeccable Dashboard To Evaluate Marketing Campaign Performance Ecommerce Marketing Plan To Enhance Microsoft PDF. You can use this template for your upcoming presentations, as the slides are perfect to represent even the tiniest detail. You can download these templates from the Slidegeeks website and these are easy to edit. So grab these today.
-
Dashboard Depicting Sales And Customer Analytics Infographics PDF
This slide focuses on dashboard that depicts sales and customer analytics which covers sales revenue, average transaction rate, out of stock items, sales by division, monthly visitors, etc. If you are looking for a format to display your unique thoughts, then the professionally designed Dashboard Depicting Sales And Customer Analytics Infographics PDF is the one for you. You can use it as a Google Slides template or a PowerPoint template. Incorporate impressive visuals, symbols, images, and other charts. Modify or reorganize the text boxes as you desire. Experiment with shade schemes and font pairings. Alter, share or cooperate with other people on your work. Download Dashboard Depicting Sales And Customer Analytics Infographics PDF and find out how to give a successful presentation. Present a perfect display to your team and make your presentation unforgettable.
-
Annual Innovative Technology Investment By Company Size Microsoft PDF
Mentioned slide portrays informational stats on annual innovative technology investment by company size. Here the table shows that about 85 percent of startups falling in doller 0 dollar 9.9MM bracket invested in innovative technologies in 2022. Presenting this PowerPoint presentation, titled Annual Innovative Technology Investment By Company Size Microsoft PDF, with topics curated by our researchers after extensive research. This editable presentation is available for immediate download and provides attractive features when used. Download now and captivate your audience. Presenting this Annual Innovative Technology Investment By Company Size Microsoft PDF. Our researchers have carefully researched and created these slides with all aspects taken into consideration. This is a completely customizable Annual Innovative Technology Investment By Company Size Microsoft PDF that is available for immediate downloading. Download now and make an impact on your audience. Highlight the attractive features available with our PPTs.
-
Project Report Of Digital Sales Marketing Campaign Performance Professional PDF
Following slide showcases a project report which can be used to measure digital marketing performance. The template provides information about marketing activities such as Facebook ads, PPC, SEO and email marketing campaign. Pitch your topic with ease and precision using this Project Report Of Digital Sales Marketing Campaign Performance Professional PDF. This layout presents information on Email Campaign, SEO Campaign, Marketing Activities. It is also available for immediate download and adjustment. So, changes can be made in the color, design, graphics or any other component to create a unique layout.
-
PowerPoint Slides Education Round Process Flow Chart Ppt Design
PowerPoint Slides Education Round Process Flow Chart PPT Design-These amazing PowerPoint pre-designed slides and PowerPoint templates have been carefully created by our team of experts to help you impress your audience. Our stunning collection of Powerpoint slides are 100% editable and can easily fit in any PowerPoint presentations. By using these animations and graphics in PowerPoint and you can easily make professional presentations. Any text can be entered at any point in the PowerPoint template or slide. Just DOWNLOAD our awesome PowerPoint templates and you are ready to go.
-
KPI Dashboard To Measure Ecommerce Sales And Marketing Project Performance Portrait PDF
Following slide showcases performance KPI dashboard used to measure the ecommerce marketing project results. The Key performance indicators mentioned in the slide are new customers, repeat purchase rate, average order value, conversion rate, etc. Pitch your topic with ease and precision using this KPI Dashboard To Measure Ecommerce Sales And Marketing Project Performance Portrait PDF. This layout presents information on Purchase Rate, Average Order Value, Ecommerce Conversion Rate. It is also available for immediate download and adjustment. So, changes can be made in the color, design, graphics or any other component to create a unique layout.
-
Human Capital Metrics For New Hire Ppt Pictures Brochure PDF
This graph or chart is linked to excel, and changes automatically based on data. Just left click on it and select Edit Data. Pitch your topic with ease and precision using this Human Capital Metrics For New Hire Ppt Pictures Brochure PDF. This layout presents information on Active Employee Count, New Hire Count, New Hire. It is also available for immediate download and adjustment. So, changes can be made in the color, design, graphics or any other component to create a unique layout.
-
KPI Dashboard Of Technical Customer Support Service Ppt Layouts Professional PDF
This slide covers KPI dashboard of technical customer support service. It involves KPIs such as overdue tickets, problem types, tickets by customer types and detail about technical support engineers. Showcasing this set of slides titled KPI Dashboard Of Technical Customer Support Service Ppt Layouts Professional PDF. The topics addressed in these templates are Overdue Tickets, Problems Types, Technical Support Engineers. All the content presented in this PPT design is completely editable. Download it and make adjustments in color, background, font etc. as per your unique business setting.
-
KPI Dashboard To Track Process Products Sold By Insurance Topics PDF
This slide shows dashboard which can be used to compare insurance sales of current and previous year. It includes metrics such as monthly policy status, quarterly premium revenue, overall policy status, etc. Pitch your topic with ease and precision using this KPI Dashboard To Track Process Products Sold By Insurance Topics PDF. This layout presents information on Overall Policy Status, Quarterly Premium Revenue, Monthly Policy Status. It is also available for immediate download and adjustment. So, changes can be made in the color, design, graphics or any other component to create a unique layout.
-
Product And Service Offerings Segment Analysis Competitor Vs Our Company Designs PDF
This slide covers comparison of various segments offered by competitors and our company. It also includes segments such as childrenswear, menswear, and womenswear. Here you can discover an assortment of the finest PowerPoint and Google Slides templates. With these templates, you can create presentations for a variety of purposes while simultaneously providing your audience with an eye catching visual experience. Download Product And Service Offerings Segment Analysis Competitor Vs Our Company Designs PDF to deliver an impeccable presentation. These templates will make your job of preparing presentations much quicker, yet still, maintain a high level of quality. Slidegeeks has experienced researchers who prepare these templates and write high quality content for you. Later on, you can personalize the content by editing the Product And Service Offerings Segment Analysis Competitor Vs Our Company Designs PDF.
-
Project Task List Template 2 Ppt PowerPoint Presentation Inspiration Designs
This is a project task list template 2 ppt powerpoint presentation inspiration designs. This is a three stage process. The stages in this process are complete, incomplete, slippage.
-
CRM Software Subscription Pricing Package Program Deployment Plan Guidelines PDF
This slide represents the pricing plan and model of a renowned CRM software. It includes details relayed to prices of four subscription based price plans such as standard, professional, enterprise and ultimate plan along with the solutions offered by each package. Persuade your audience using this CRM Software Subscription Pricing Package Program Deployment Plan Guidelines PDF. This PPT design covers four stages, thus making it a great tool to use. It also caters to a variety of topics including Standard, Professional, Enterprise, Ultimate. Download this PPT design now to present a convincing pitch that not only emphasizes the topic but also showcases your presentation skills.
-
Roadmap Showing Five Stages Of CRM System Implementation Program Deployment Plan Rules PDF
This slide represents the customer relationship management system implementation plan. It includes roadmap representing five phases of CRM implementation such as explore, plan, configure, train and deploy. Persuade your audience using this Roadmap Showing Five Stages Of CRM System Implementation Program Deployment Plan Rules PDF. This PPT design covers five stages, thus making it a great tool to use. It also caters to a variety of topics including Explore, Plan, Configure, Train, Deploy. Download this PPT design now to present a convincing pitch that not only emphasizes the topic but also showcases your presentation skills.
-
Customer Service Enterprise Workforce Dashboard Designs PDF
This slide ILLUSTRATES consumer support extended team dashboard. It provides information about average resolution time, cases transferred open cases, service level agreements SLAs, etc. Pitch your topic with ease and precision using this Customer Service Enterprise Workforce Dashboard Designs PDF. This layout presents information on Average Resolution Time, Active SLAs Breached, Average Customer. It is also available for immediate download and adjustment. So, changes can be made in the color, design, graphics or any other component to create a unique layout.
-
Customer Service Request Tickets Administration Dashboard Icons PDF
This slide covers division of tickets into different groups. It also includes a pie chart dividing tickets in multiple categories such as status, tech groups, alert level, request type and alert condition. Pitch your topic with ease and precision using this Customer Service Request Tickets Administration Dashboard Icons PDF. This layout presents information on Tickets Activity, Tickets Alert Level, Tickets Teach Group. It is also available for immediate download and adjustment. So, changes can be made in the color, design, graphics or any other component to create a unique layout.
-
Evaluation Of Earning Potential From Gross Earning And Ebit Dashboard Professional PDF
This slide illustrates finding profit potential of a corporation while studying gross profit margin and EBITDA. It includes key operating expenditure and gross profit margin, EBITDA dollar MM and EBITDA percent margin etc. Showcasing this set of slides titled Evaluation Of Earning Potential From Gross Earning And Ebit Dashboard Professional PDF. The topics addressed in these templates are Evaluation Of Earning Potential, Gross Earning, Ebit Dashboard. All the content presented in this PPT design is completely editable. Download it and make adjustments in color, background, font etc. as per your unique business setting.
-
Payment Ticketing Invoice Procedure Icon Brochure PDF
Presenting Payment Ticketing Invoice Procedure Icon Brochure PDF to dispense important information. This template comprises four stages. It also presents valuable insights into the topics including Invoice Procedure Icon, Payment Ticketing. This is a completely customizable PowerPoint theme that can be put to use immediately. So, download it and address the topic impactfully.
-
Yearly Budget Development Cycle Icon Pictures PDF
Persuade your audience using this Yearly Budget Development Cycle Icon Pictures PDF. This PPT design covers three stages, thus making it a great tool to use. It also caters to a variety of topics including Yearly Budget, Development Cycle Icon. Download this PPT design now to present a convincing pitch that not only emphasizes the topic but also showcases your presentation skills.
-
Project KPI Dashboard To Monitor Financial Budget Evaluation Demonstration PDF
This slide signifies the key performance indicator dashboard to evaluate financial estimation. It covers information regarding to expense, payable account and monthly performance. Showcasing this set of slides titled Project KPI Dashboard To Monitor Financial Budget Evaluation Demonstration PDF. The topics addressed in these templates are Project KPI Dashboard, Monitor Financial Budget Evaluation. All the content presented in this PPT design is completely editable. Download it and make adjustments in color, background, font etc. as per your unique business setting.
-
Creating New Product Launch Campaign Strategy Dashboard To Track Sales Opportunities Professional PDF
Mentioned slide shows dashboard that can be used by an organization to track win and lost sales opportunities. It includes metrics namely won opportunities, lost opportunities, pipeline by territory, total opportunities. Formulating a presentation can take up a lot of effort and time, so the content and message should always be the primary focus. The visuals of the PowerPoint can enhance the presenters message, so our Creating New Product Launch Campaign Strategy Dashboard To Track Sales Opportunities Professional PDF was created to help save time. Instead of worrying about the design, the presenter can concentrate on the message while our designers work on creating the ideal templates for whatever situation is needed. Slidegeeks has experts for everything from amazing designs to valuable content, we have put everything into Creating New Product Launch Campaign Strategy Dashboard To Track Sales Opportunities Professional PDF
-
Financial Summary Report Income And Expense Statement Ppt File Background Designs PDF
This slide represents financial statement snapshot for income and expenditure. It includes profit margin, income and expenditure, income of budget, cash at EOM etc. Showcasing this set of slides titled Financial Summary Report Income And Expense Statement Ppt File Background Designs PDF. The topics addressed in these templates are Income, Expenditure, Accounts Receivable, Account Payable. All the content presented in this PPT design is completely editable. Download it and make adjustments in color, background, font etc. as per your unique business setting.
-
Real Estate Management Icon For Revenue Generation Template PDF
Persuade your audience using this Real Estate Management Icon For Revenue Generation Template PDF. This PPT design covers three stages, thus making it a great tool to use. It also caters to a variety of topics including Real Estate Management Icon, Revenue Generation. Download this PPT design now to present a convincing pitch that not only emphasizes the topic but also showcases your presentation skills.
-
Enterprise Saas Vendor Market Share And Earnings Growth Icons PDF
This slide covers saas vendors comparative market share report. It also includes percentage of total annual revenue growth. Pitch your topic with ease and precision using this Enterprise Saas Vendor Market Share And Earnings Growth Icons PDF. This layout presents information on Annual Growth, Market Share, Revenue. It is also available for immediate download and adjustment. So, changes can be made in the color, design, graphics or any other component to create a unique layout.

 Home
Home 


