Finance PowerPoint Icons
-
Roadmap For Financial Accounting Transformation Ppt PowerPoint Presentation Complete Deck With Slides
Pitch yourself both in house and outside by utilizing this complete deck. This roadmap for financial accounting transformation ppt powerpoint presentation complete deck with slides focuses on key fundamentals of the topic, displayed using different slides. With a total of fourty nine slides, this template is the best tool you can use to persuade your audience. It will not only help you create great presentations but also induce strategic thinking because of its well researched content and graphics. You can easily personalize any of the elements to suit your unique business setting. Additionally, it can be saved in PNG, JPG, and PDF formats to save your time and resources.
-
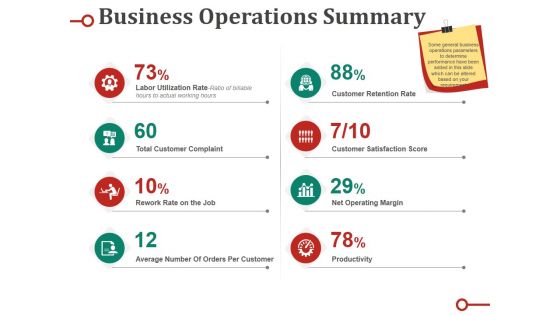
Business Operations Summary Ppt PowerPoint Presentation Infographics Infographic Template
This is a business operations summary ppt powerpoint presentation infographics infographic template. This is a eight stage process. The stages in this process are labor utilization rate, customer retention rate, total customer complaint, customer satisfaction score, rework rate on the job.
-
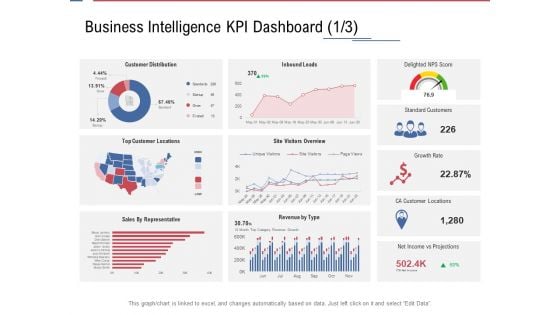
Data Assimilation Business Intelligence KPI Dashboard Score Ppt Graphics PDF
Deliver and pitch your topic in the best possible manner with this data assimilation business intelligence kpi dashboard score ppt graphics pdf. Use them to share invaluable insights on revenue, projections, locations, growth, sales and impress your audience. This template can be altered and modified as per your expectations. So, grab it now.
-
Employee Weekly Efficiency Dashboard Ppt PowerPoint Presentation Icon Backgrounds
This is a employee weekly efficiency dashboard ppt powerpoint presentation icon backgrounds. This is a four stage process. The stages in this process are finance, analysis, business, investment, marketing.
-
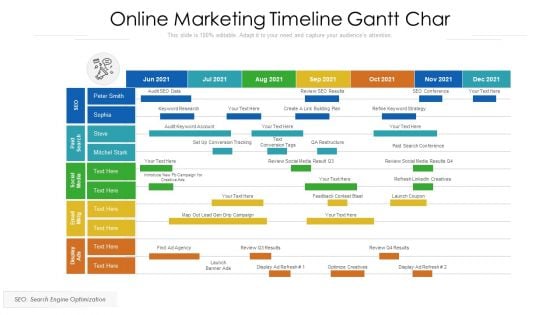
Online Marketing Timeline Gantt Chart Ppt Summary Smartart PDF
Showcasing this set of slides titled online marketing timeline gantt chart ppt summary smartart pdf. The topics addressed in these templates are online marketing timeline gantt chart. All the content presented in this PPT design is completely editable. Download it and make adjustments in color, background, font etc. as per your unique business setting.
-
Management Financial Report Ppt PowerPoint Presentation Diagrams
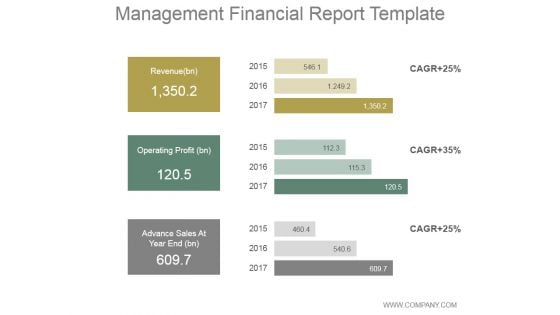
This is a management financial report ppt powerpoint presentation diagrams. This is a three stage process. The stages in this process are revenue, operating profit, advance sales at year end.
-
Business Framework Organization Chart In PowerPoint PowerPoint Presentation
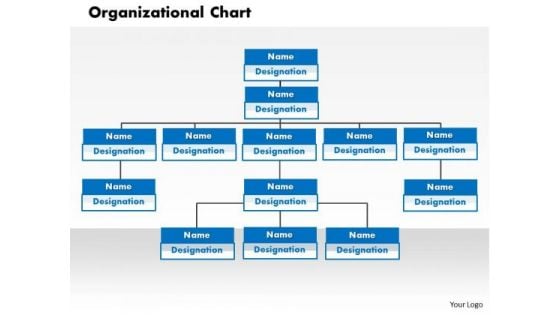
This image slide has been designed with business man icons to display organization chart. Use this image slide, in your presentations to depict business management designations. This image slide will enhance the quality of your presentations.
-
Balanced Scorecard Kpi S Ppt Slide Examples
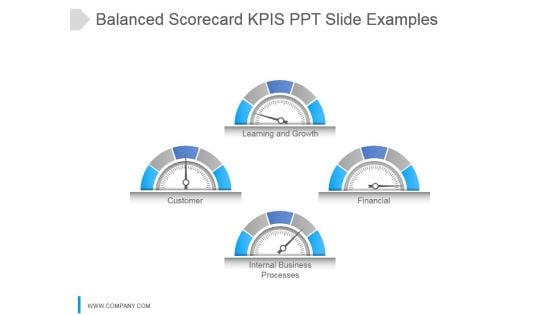
This is a balanced scorecard kpi s ppt slide examples. This is a four stage process. The stages in this process are learning and growth, customer, financial, internal business processes.
-
5 Stage Input Funnel For Results Ppt PowerPoint Presentation Background Designs
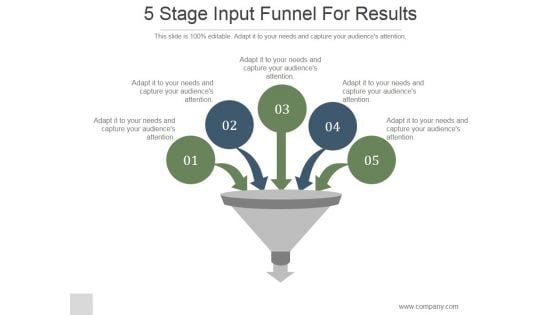
This is a 5 stage input funnel for results ppt powerpoint presentation background designs. This is a five stage process. The stages in this process are adapt it to your needs and capture your audiences attention.
-
Budgeting And Forecasting In Accounting Ppt PowerPoint Presentation Complete Deck With Slides
This is a Budgeting and forecasting in accounting ppt powerpoint presentation complete deck with slides. This is a one stage process. The stages in this process are graph, finance, analysis, marketing, business.
-
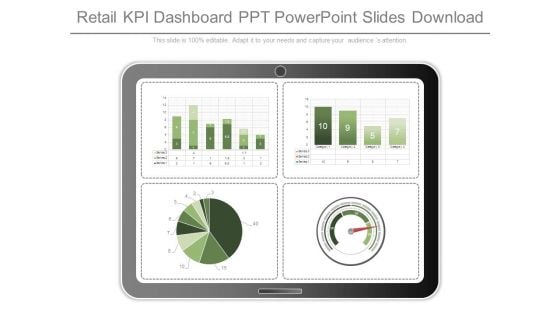
Retail Kpi Dashboard Ppt Powerpoint Slides Download
This is a retail kpi dashboard ppt powerpoint slides download. This is a four stage process. The stages in this process are business, marketing, measure, process, finance.
-
PowerPoint Process Teamwork Flow Process Ppt Design
PowerPoint Process Teamwork Flow Process PPT Design-Explore the various directions and layers existing in your in your plans and processes. Unravel the desired and essential elements of your overall strategy. Explain the relevance of the different layers and stages and directions in getting down to your core competence, ability and desired result.
-
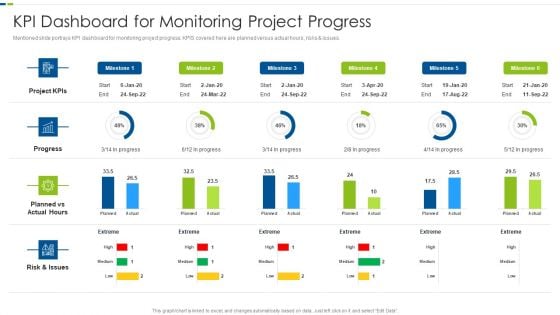
Utilizing Agile Methodology In Data Transformation Project IT KPI Dashboard For Monitoring Template PDF
Mentioned slide portrays KPI dashboard for monitoring project progress. KPIS covered here are planned versus actual hours, risks and issues. Deliver and pitch your topic in the best possible manner with this utilizing agile methodology in data transformation project it kpi dashboard for monitoring template pdf. Use them to share invaluable insights on risk, planned, project and impress your audience. This template can be altered and modified as per your expectations. So, grab it now.
-
World Map With Social Media Icons Powerpoint Slides
This PowerPoint template has been designed with graphics of world map and social media icons. Our professionally designed business diagram is as an effective tool to display social media users in world. Above slide provide ideal backdrop to make business presentations.
-
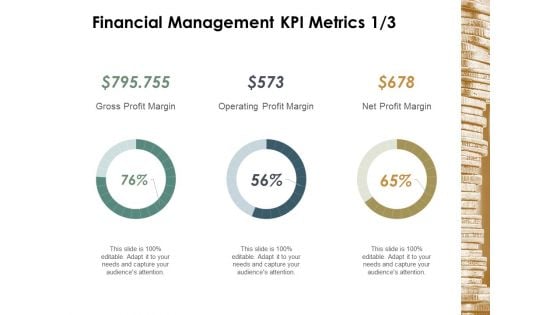
Financial Management Kpi Metrics Business Ppt Powerpoint Presentation Model Example
This is a financial management kpi metrics business ppt powerpoint presentation model example. This is a three stage process. The stages in this process are finance, marketing, management, investment, analysis.
-
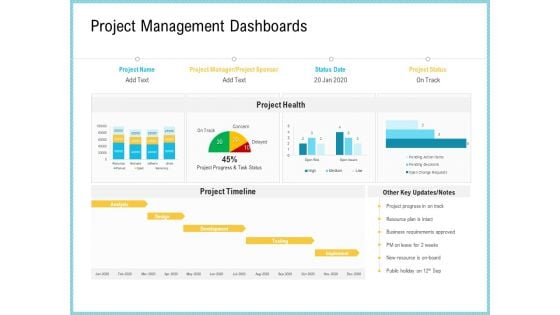
Team Collaboration Of Project Management Dashboards Ppt Inspiration Gallery PDF
Deliver and pitch your topic in the best possible manner with this team collaboration of project management dashboards ppt inspiration gallery pdf. Use them to share invaluable insights on development, analysis, project timeline, business, implement and impress your audience. This template can be altered and modified as per your expectations. So, grab it now.
-
Business Diagram Thermometer Graphics Indicating Progress Presentation Template
This power point template diagram has been designed with graphic of thermometer and bar graph. This PPT contains the concept of growth analysis. Use this PPT for business and marketing related presentations.
-
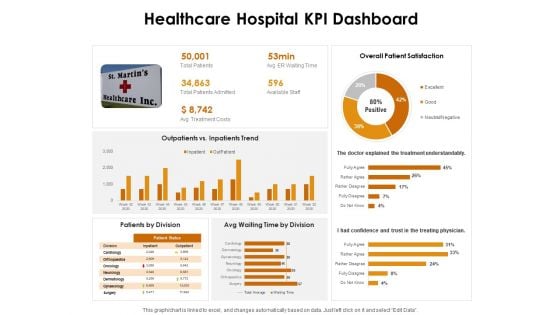
KPI Dashboards Per Industry Healthcare Hospital KPI Dashboard Ppt PowerPoint Presentation Show Infographics PDF
Deliver an awe-inspiring pitch with this creative kpi dashboards per industry healthcare hospital kpi dashboard ppt powerpoint presentation show infographics pdf bundle. Topics like overall patient satisfaction, outpatients vs. inpatients trend, doctor explained the treatment understandably can be discussed with this completely editable template. It is available for immediate download depending on the needs and requirements of the user.
-
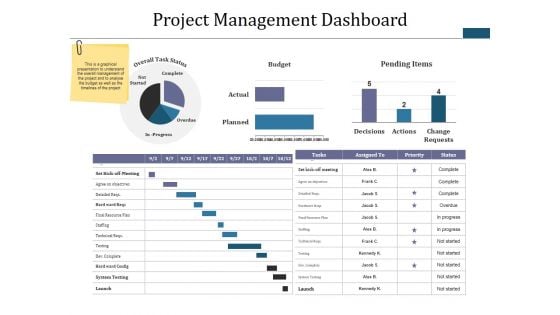
Project Management Dashboard Ppt PowerPoint Presentation Infographic Template Diagrams
This is a project management dashboard ppt powerpoint presentation infographic template diagrams. This is a three stage process. The stages in this process are budget, pending items, complete, overdue, not started.
-
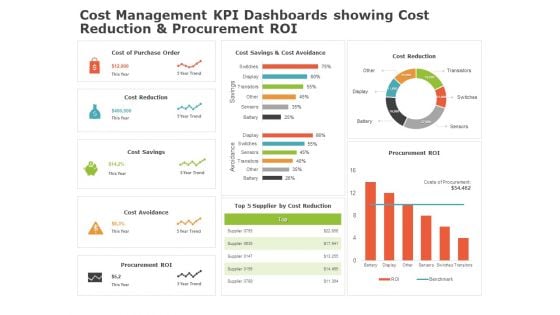
Product Cost Management PCM Cost Management KPI Dashboards Showing Cost Reduction And Procurement ROI Clipart PDF
Deliver and pitch your topic in the best possible manner with this product cost management pcm cost management kpi dashboards showing cost reduction and procurement roi clipart pdf. Use them to share invaluable insights on cost, reduction, procurement and impress your audience. This template can be altered and modified as per your expectations. So, grab it now.
-
Project Progress Status Ppt PowerPoint Presentation Complete Deck With Slides
Boost your confidence and team morale with this well-structured Project Progress Status Ppt PowerPoint Presentation Complete Deck With Slides. This prefabricated set gives a voice to your presentation because of its well-researched content and graphics. Our experts have added all the components very carefully, thus helping you deliver great presentations with a single click. Not only that, it contains a set of twelve slides that are designed using the right visuals, graphics, etc. Various topics can be discussed, and effective brainstorming sessions can be conducted using the wide variety of slides added in this complete deck. Apart from this, our PPT design contains clear instructions to help you restructure your presentations and create multiple variations. The color, format, design anything can be modified as deemed fit by the user. Not only this, it is available for immediate download. So, grab it now.
-
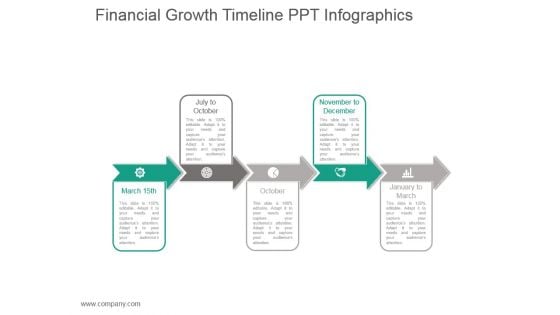
Financial Growth Timeline Ppt Infographics
This is a financial growth timeline ppt infographics. This is a five stage process. The stages in this process are icons, business, arrow, marketing, strategy, process.
-
Status Summary Report Ppt PowerPoint Presentation Complete Deck With Slides
Boost your confidence and team morale with this well-structured Status Summary Report Ppt PowerPoint Presentation Complete Deck With Slides. This prefabricated set gives a voice to your presentation because of its well-researched content and graphics. Our experts have added all the components very carefully, thus helping you deliver great presentations with a single click. Not only that, it contains a set of twelve slides that are designed using the right visuals, graphics, etc. Various topics can be discussed, and effective brainstorming sessions can be conducted using the wide variety of slides added in this complete deck. Apart from this, our PPT design contains clear instructions to help you restructure your presentations and create multiple variations. The color, format, design anything can be modified as deemed fit by the user. Not only this, it is available for immediate download. So, grab it now.
-
Retail KPI Dashboard Showing Revenue Vs Units Sold Ppt PowerPoint Presentation Professional Smartart
This is a retail kpi dashboard showing revenue vs units sold ppt powerpoint presentation professional smartart. This is a four stage process. The stages in this process are finance, analysis, business, investment, marketing.
-
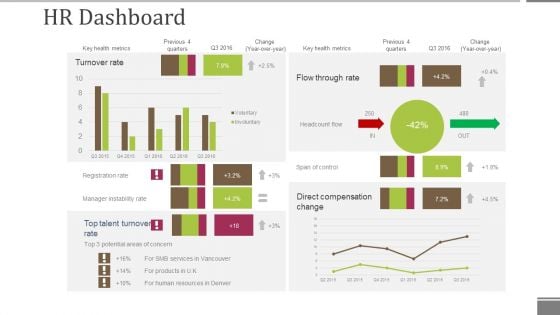
Hr Dashboard Template 2 Ppt PowerPoint Presentation File Grid
This is a hr dashboard template 2 ppt powerpoint presentation file grid. This is a four stage process. The stages in this process are turnover rate, direct compensation change, span of control, headcount flow, flow through rate.
-
KPI Framework Ppt PowerPoint Presentation Complete With Slides
If designing a presentation takes a lot of your time and resources and you are looking for a better alternative, then this kpi framework ppt powerpoint presentation complete with slides is the right fit for you. This is a prefabricated set that can help you deliver a great presentation on the topic. All the twenty two slides included in this sample template can be used to present a birds-eye view of the topic. These slides are also fully editable, giving you enough freedom to add specific details to make this layout more suited to your business setting. Apart from the content, all other elements like color, design, theme are also replaceable and editable. This helps in designing a variety of presentations with a single layout. Not only this, you can use this PPT design in formats like PDF, PNG, and JPG once downloaded. Therefore, without any further ado, download and utilize this sample presentation as per your liking.
-
Financial Statement Analysis Ppt PowerPoint Presentation Complete Deck With Slides
This is a Financial Statement Analysis Ppt powerpoint Presentation Complete Deck With Slides. This is a one stage process. The stages in this process are business, marketing, finance, analysis, management.
-
Financial Analysis Module PPT PowerPoint Presentation Complete Deck With Slides
This is a financial analysis module ppt powerpoint presentation complete deck with slides. This is a one stage process. The stages in this process are table, business, finance, analysis, percentage.
-
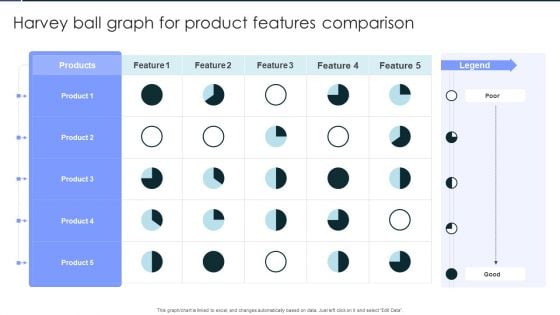
Harvey Ball Graph For Product Features Comparison Rules PDF
Pitch your topic with ease and precision using this Harvey Ball Graph For Product Features Comparison Rules PDF. This layout presents information onHarvey Ball Graph, For Product, Features Comparison. It is also available for immediate download and adjustment. So, changes can be made in the color, design, graphics or any other component to create a unique layout.
-
Cyber Security Risk Management Plan Information Security Risk Management Dashboard Sample PDF
Following slide covers information security risk management dashboard. It include KPIs such as risk analysis progress, percent risk, response progress for risks and number of risks encountered. Deliver an awe inspiring pitch with this creative cyber security risk management plan information security risk management dashboard sample pdf bundle. Topics like vulnerabilities, entities, action plan, risk analysis can be discussed with this completely editable template. It is available for immediate download depending on the needs and requirements of the user.
-
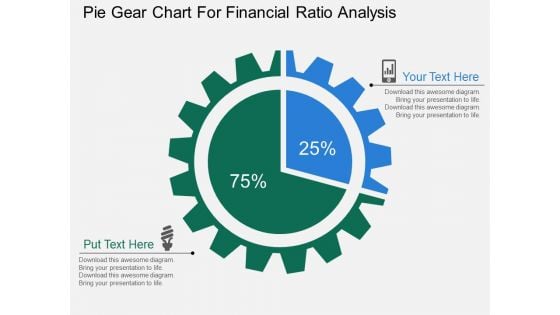
Pie Gear Chart For Financial Ratio Analysis Powerpoint Templates
This PPT slide displays diagram of pie gear chart. This PowerPoint template has been designed to exhibit financial ratio analysis. You can present your opinions using this impressive slide
-
Business Intelligence Dashboard Design Ppt Powerpoint Topics
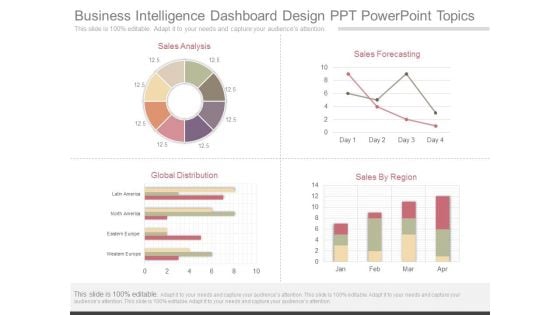
This is a business intelligence dashboard design ppt powerpoint topics. This is a four stage process. The stages in this process are sales analysis, sales forecasting, global distribution, sales by region, latin america, north america, eastern europe, western europe.
-
Database Modeling Data Model Performance Tracking Dashboard Demonstration Pdf
This slide shows the data model performance tracking dashboard. The purpose of this slide is to represent the Information related to the change brought by data models graphically. Do you have to make sure that everyone on your team knows about any specific topic I yes, then you should give Database Modeling Data Model Performance Tracking Dashboard Demonstration Pdf a try. Our experts have put a lot of knowledge and effort into creating this impeccable Database Modeling Data Model Performance Tracking Dashboard Demonstration Pdf. You can use this template for your upcoming presentations, as the slides are perfect to represent even the tiniest detail. You can download these templates from the Slidegeeks website and these are easy to edit. So grab these today
-
Playbook For Successful Project Management Project Management Dashboard Information PDF
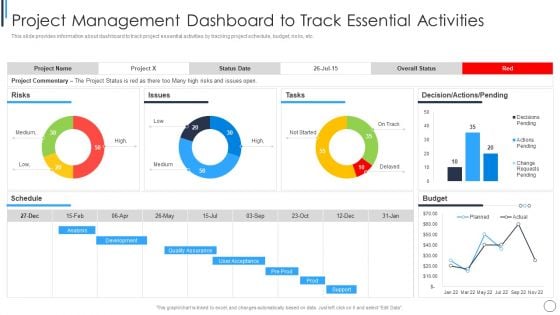
This slide provides information about dashboard to track project essential activities by tracking project schedule, budget, risks, etc.Deliver an awe inspiring pitch with this creative Playbook For Successful Project Management Project Management Dashboard Information PDF bundle. Topics like Quality Assurance, Development, Analysis can be discussed with this completely editable template. It is available for immediate download depending on the needs and requirements of the user.
-
Business Framework Mission Vision And Values PowerPoint Presentation
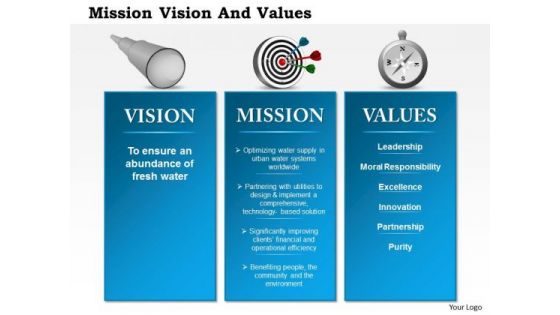
Describe the mission and vision values of any organization with this business framework power point template. This PPT contains the concept of organizational mission and vision with value statement. Use this professional PPT in your introductory presentation for any organi
-
Business Framework Organizational Chart Examples PowerPoint Presentation
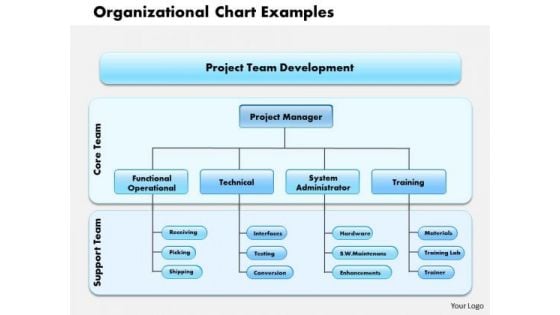
This image slide has been designed to display organizational charts. Use this image slide, in your presentations to depict business management. This image slide will enhance the quality of your presentations and will provide professional appearance to your presentations.
-
Establish Management Team Project Management Dashboards Ppt Icon Ideas PDF
Deliver and pitch your topic in the best possible manner with this establish management team project management dashboards ppt icon ideas pdf. Use them to share invaluable insights on development, testing, implement, design, analysis, project manager and impress your audience. This template can be altered and modified as per your expectations. So, grab it now.
-
Print Media Communication PowerPoint Template
Dow Jones 2
-
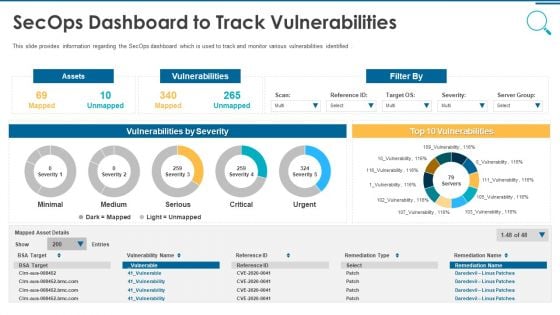
Information And Technology Security Operations Secops Dashboard To Track Vulnerabilities Information PDF
This slide provides information regarding the SecOps dashboard which is used to track and monitor various vulnerabilities identified. Deliver and pitch your topic in the best possible manner with this information and technology security operations secops dashboard to track vulnerabilities information pdf. Use them to share invaluable insights on assets, vulnerabilities, severity and impress your audience. This template can be altered and modified as per your expectations. So, grab it now.
-
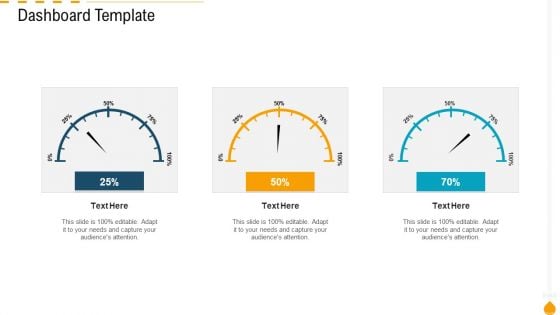
Dashboard Template Formats PDF
Deliver an awe inspiring pitch with this creative dashboard template formats pdf bundle. Topics like dashboard template can be discussed with this completely editable template. It is available for immediate download depending on the needs and requirements of the user.
-
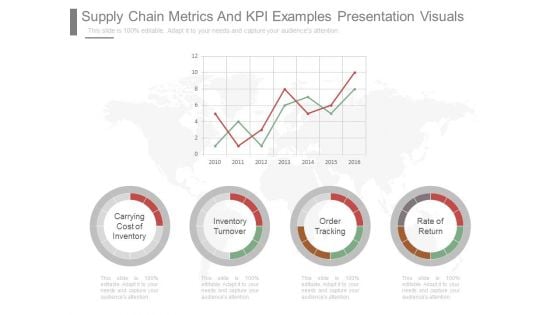
Supply Chain Metrics And Kpi Examples Presentation Visuals
This is a supply chain metrics and kpi examples presentation visuals. This is a four stage process. The stages in this process are carrying cost of inventory, inventory turnover, order tracking, rate of return.
-
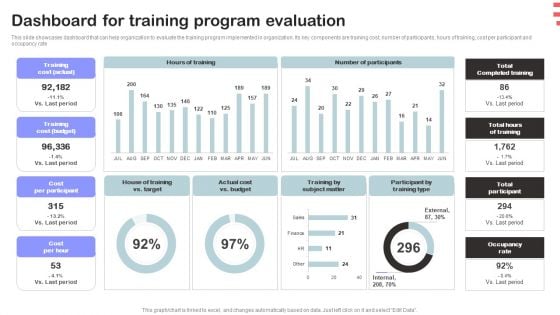
Corporate Training Program Dashboard For Training Program Evaluation Summary PDF
This slide showcases dashboard that can help organization to evaluate the training program implemented in organization. Its key components are training cost, number of participants, hours of training, cost per participant and occupancy rate Are you in need of a template that can accommodate all of your creative concepts This one is crafted professionally and can be altered to fit any style. Use it with Google Slides or PowerPoint. Include striking photographs, symbols, depictions, and other visuals. Fill, move around, or remove text boxes as desired. Test out color palettes and font mixtures. Edit and save your work, or work with colleagues. Download Corporate Training Program Dashboard For Training Program Evaluation Summary PDF and observe how to make your presentation outstanding. Give an impeccable presentation to your group and make your presentation unforgettable.
-
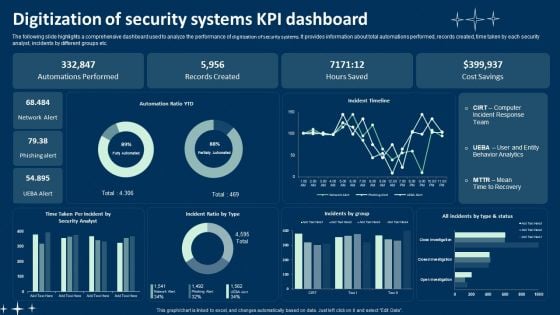
Digitization Of Security Systems KPI Dashboard Ppt Summary Portfolio PDF
The following slide highlights a comprehensive dashboard used to analyze the performance of digitization of security systems. It provides information about total automations performed, records created, time taken by each security analyst, incidents by different groups etc. Showcasing this set of slides titled Digitization Of Security Systems KPI Dashboard Ppt Summary Portfolio PDF. The topics addressed in these templates are Automations Performed, Records Created, Hours Saved. All the content presented in this PPT design is completely editable. Download it and make adjustments in color, background, font etc. as per your unique business setting.
-
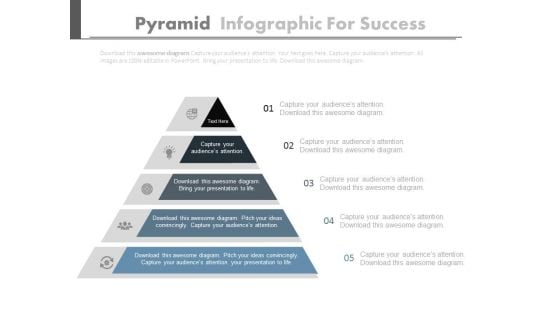
Pyramid Infographics For Marketing Process Powerpoint Slides
This PowerPoint template contains pyramid infographic. You may download this PPT slide design to display steps of marketing process. You can easily customize this template to make it more unique as per your need.
-
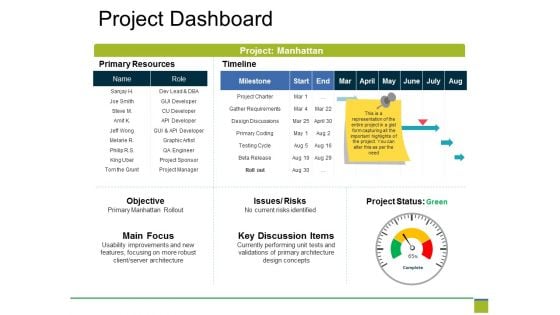
Project Dashboard Ppt PowerPoint Presentation Professional Show
This is a project dashboard ppt powerpoint presentation professional show. This is a six stage process. The stages in this process are primary resources, timeline, objective, main focus, key discussion items.
-
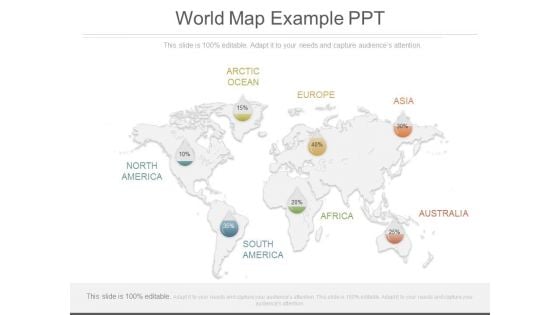
World Map Example Ppt
This is a world map example ppt. This is a seven stage process. The stages in this process are north america, south america, arctic ocean, europe, asia, africa, australia.
-
Pyramid Design For Employees Performance Powerpoint Slides
This PPT slide contains graphics of pyramid diagram. Download this PowerPoint template to depict employee?s performance and analysis. Deliver amazing presentations to mesmerize your audience by using this slide design.
-
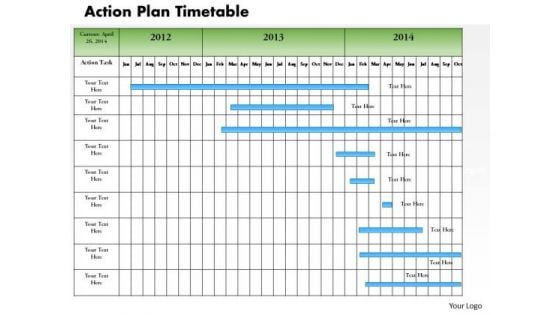
Business Framework Action Plan Timetable PowerPoint Presentation
Use this timetable diagram to illustrate the action plan. Illustrate your action plan for upcoming years with this business diagram. This unique diagram make your presentations more professional.
-
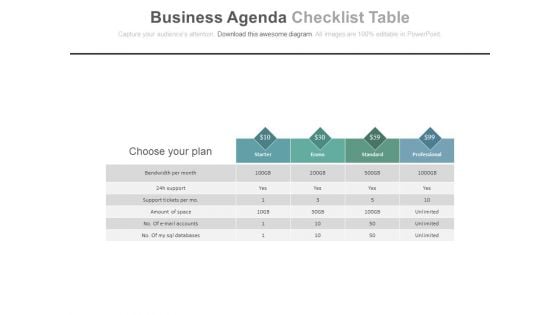
Pricing Package Tags Chart Ppt Slides
This is a pricing package tags chart ppt slides. This is a four stage process. The stages in this process are business, symbol, marketing, finance, success.
-
Four Plan Options Table Diagram Powerpoint Slides
This PowerPoint template contains graphics of four plan options table. You may PowerPoint template download this display different plans. You can easily customize this template to make it more unique as per your need.
-
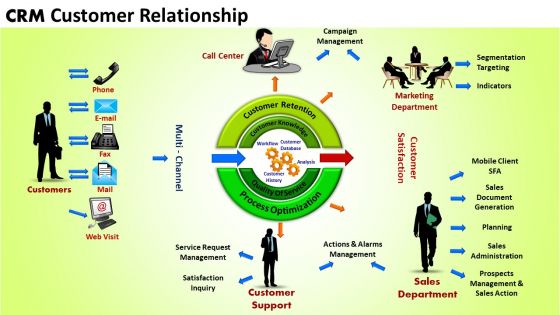
Business Circle Charts PowerPoint Templates Business Crm Customer Relationship Ppt Slides
Business Circle Charts PowerPoint Templates Business crm customer relationship PPT Slides-Use this CRM Diagram in PowerPoint with different circles and colors for customer relationship management projects.-Business Circle Charts PowerPoint Templates Business crm customer relationship PPT Slides-This template can be used for presentations relating to Analysis, Brainstorming, Business, Chart, Concept, Creative, Creativity, Crm, Customer, Diagram, Executive, Flowchart,Hand, Idea, Inspire, Interface, Layout, Legal, Management, Manager, Meeting, Note, Office, Pen, Plan, Presentation, Program, Relationship, Student, Teach, Teamwork, Technical
-
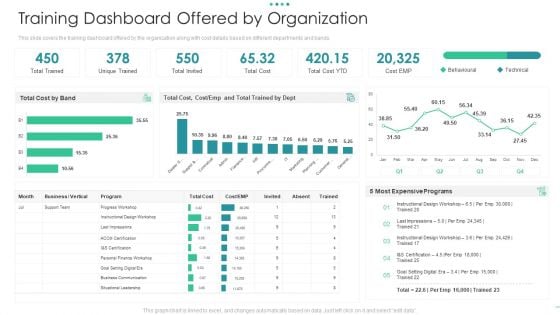
Training Dashboard Offered By Organization Slides PDF
This slide covers the training dashboard offered by the organization along with cost details based on different departments and bands. Deliver and pitch your topic in the best possible manner with this training dashboard offered by organization slides pdf. Use them to share invaluable insights on cost, technical, program and impress your audience. This template can be altered and modified as per your expectations. So, grab it now.
-
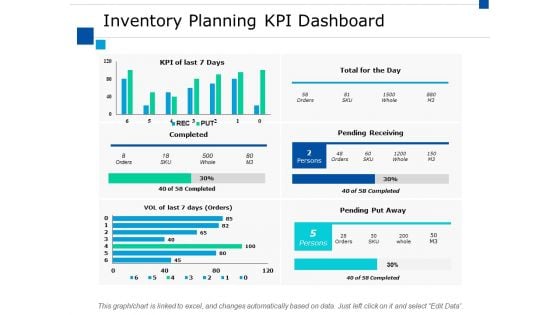
Inventory Planning Kpi Dashboard Ppt PowerPoint Presentation Summary Layout Ideas
This is a inventory planning kpi dashboard ppt powerpoint presentation summary layout ideas. This is a two stage process. The stages in this process are finance, marketing, management, investment, analysis.
-
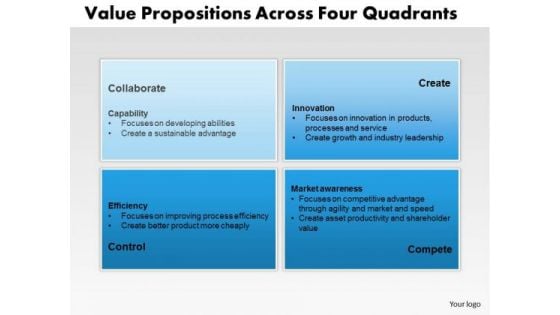
Business Framework Value Propositions Across Four Quadrants PowerPoint Presentation
This diagram displays framework for value propositions across four quadrants. These value propostions are collaborate capability, create innovation, efficiency and market awareness. This template helps you to grab the attention of your listener.
-
Sales Kpi Tracker Ppt PowerPoint Presentation Pictures Layout Ideas
This is a sales kpi tracker ppt powerpoint presentation pictures layout ideas. This is a four stage process. The stages in this process are opportunities won, top products in revenue, leads created, win ratio vs last yr, open deals vs.
-
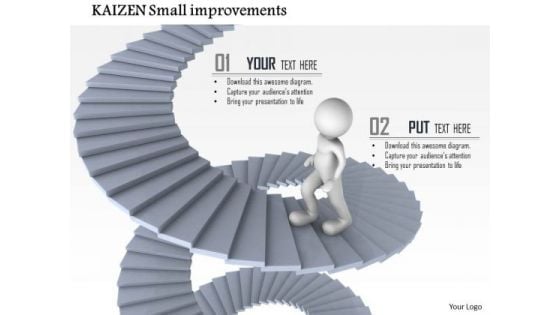
Business Framework Kaizen Small Improvements PowerPoint Presentation
Explain the importance and qualities of Kaizen with this innovative power point template diagram slide. This PPT slide displays small improvements with graphics of stairs and 3d man moving over it. Use this PPT slide for kaizen techniques representation in any business presentation.
-
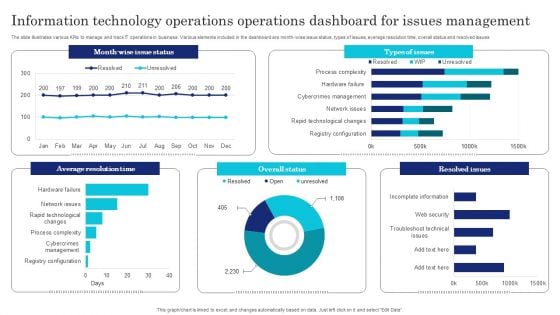
Information Technology Operations Operations Dashboard For Issues Management Infographics PDF
The slide illustrates various KPIs to manage and track IT operations in business. Various elements included in the dashboard are month-wise issue status, types of issues, average resolution time, overall status and resolved issues. Showcasing this set of slides titled Information Technology Operations Operations Dashboard For Issues Management Infographics PDF. The topics addressed in these templates are Information Technology Operations, Operations Dashboard, Issues Management. All the content presented in this PPT design is completely editable. Download it and make adjustments in color, background, font etc. as per your unique business setting.
-
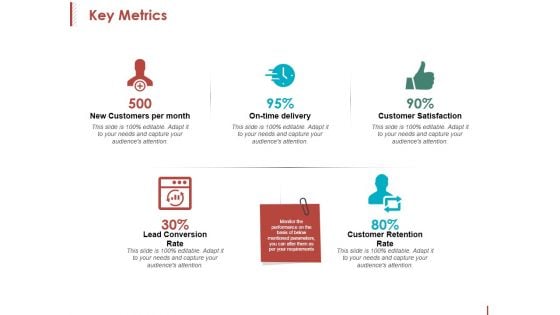
Key Metrics Ppt PowerPoint Presentation Inspiration Format
This is a key metrics ppt powerpoint presentation inspiration format. This is a five stage process. The stages in this process are new customers per month, on time delivery, customer satisfaction, customer retention rate.
-
Sales Pipeline Tracking And Reporting Mockup PDF
This slide shows dashboard to track the performance of sales pipeline. Major points covered under this are number of opportunities, conversion rate, win rate, opportunity status etc. Deliver and pitch your topic in the best possible manner with this Sales Pipeline Tracking And Reporting Mockup PDF. Use them to share invaluable insights on Sales Pipeline Tracking And Reporting and impress your audience. This template can be altered and modified as per your expectations. So, grab it now.
-
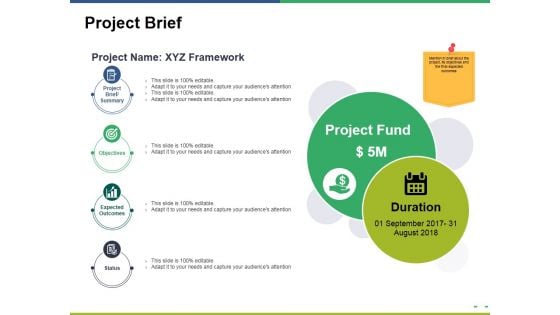
Project Brief Ppt PowerPoint Presentation Model Gallery
This is a project brief ppt powerpoint presentation model gallery. This is a four stage process. The stages in this process are project brief summary, objectives, expected outcomes, status.

 Home
Home 


