Finance PowerPoint Templates
-
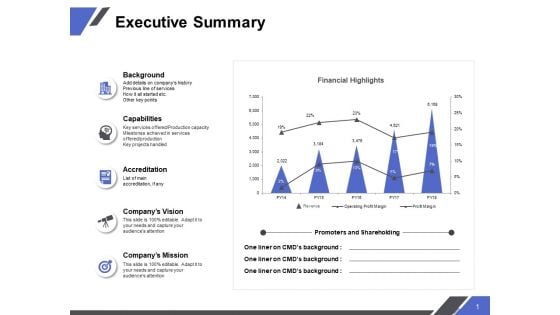
Executive Summary Ppt PowerPoint Presentation Layouts Outline
Presenting this set of slides with name executive summary ppt powerpoint presentation layouts outline. The topics discussed in these slides are background, capabilities, accreditation, companys vision, companys mission, financial highlights. This is a completely editable PowerPoint presentation and is available for immediate download. Download now and impress your audience.
-
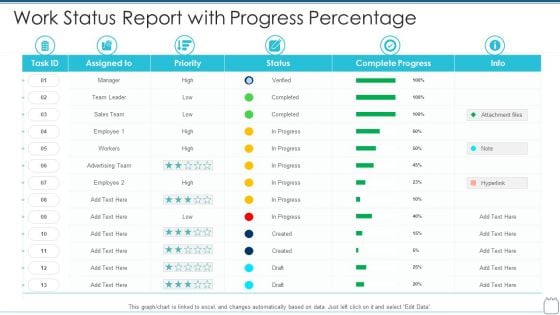
Work Status Report With Progress Percentage Structure PDF
Showcasing this set of slides titled work status report with progress percentage structure pdf . The topics addressed in these templates are work status report with progress percentage . All the content presented in this PPT design is completely editable. Download it and make adjustments in color, background, font etc. as per your unique business setting.
-

Current Challenges And Opportunities Of Digital Payments Strategy Transactions Clipart PDF
This slide provides some of the major challenges and opportunities of digital transactions for business, customers and governments bodies. It incorporates challenges such as technical and financial, loss of transactional revenue, cyberattacks etc. Showcasing this set of slides titled Current Challenges And Opportunities Of Digital Payments Strategy Transactions Clipart PDF. The topics addressed in these templates are Challenges, Opportunities, Technical And Financial. All the content presented in this PPT design is completely editable. Download it and make adjustments in color, background, font etc. as per your unique business setting.
-
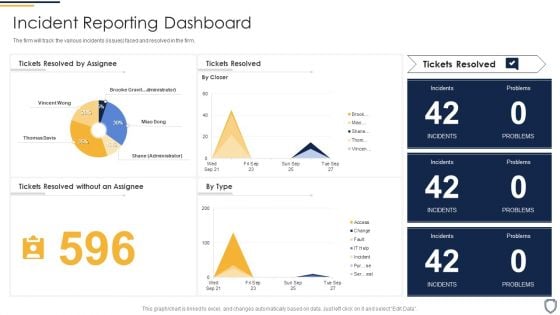
Corporate Security And Risk Management Incident Reporting Dashboard Brochure PDF
The firm will track the various incidents issues faced and resolved in the firm. Deliver and pitch your topic in the best possible manner with this corporate security and risk management incident reporting dashboard brochure pdf. Use them to share invaluable insights on incident reporting dashboard and impress your audience. This template can be altered and modified as per your expectations. So, grab it now.
-
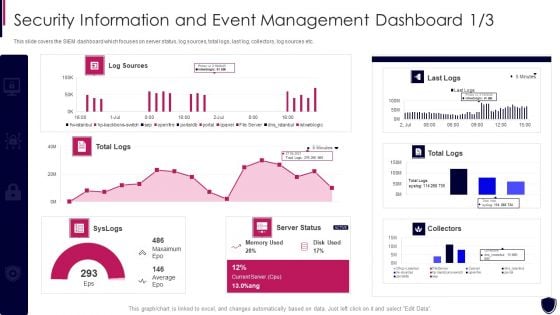
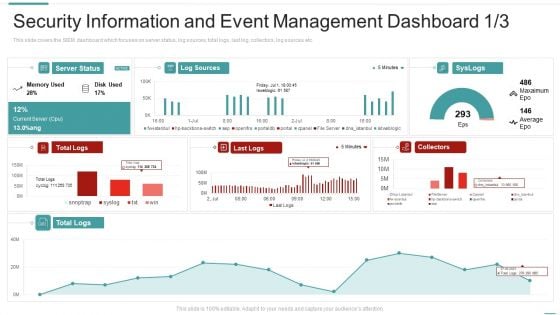
Security Information And Event Dashboard Enhancing Cyber Safety With Vulnerability Administration Formats PDF
This slide covers the SIEM dashboard which focuses on server status, log sources, total logs, last log, collectors, log sources etc. Deliver and pitch your topic in the best possible manner with this security information and event dashboard enhancing cyber safety with vulnerability administration formats pdf. Use them to share invaluable insights on security information and event management dashboard and impress your audience. This template can be altered and modified as per your expectations. So, grab it now.
-
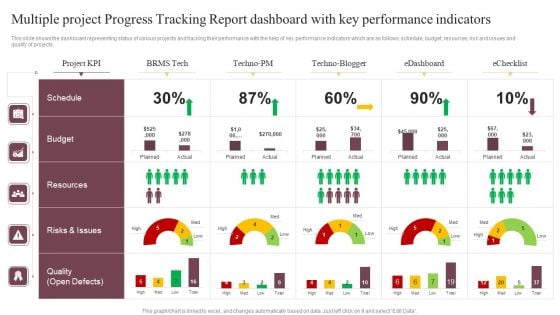
Multiple Project Progress Tracking Report Dashboard With Key Performance Indicators Brochure PDF
This slide shows the dashboard representing status of various projects and tracking their performance with the help of key performance indicators which are as follows schedule, budget, resources, risk and issues and quality of projects.Pitch your topic with ease and precision using this Multiple Project Progress Tracking Report Dashboard With Key Performance Indicators Brochure PDF. This layout presents information on Risks Issues, Quality Open Defects, Techno Blogger. It is also available for immediate download and adjustment. So, changes can be made in the color, design, graphics or any other component to create a unique layout.
-

Three Steps Funnel With Build Awareness And Trust Ppt PowerPoint Presentation Professional Outline
Presenting this set of slides with name three steps funnel with build awareness and trust ppt powerpoint presentation professional outline. This is a three stage process. The stages in this process are growth, conversion, retention, build trust, build awareness, make people stay. This is a completely editable PowerPoint presentation and is available for immediate download. Download now and impress your audience.
-
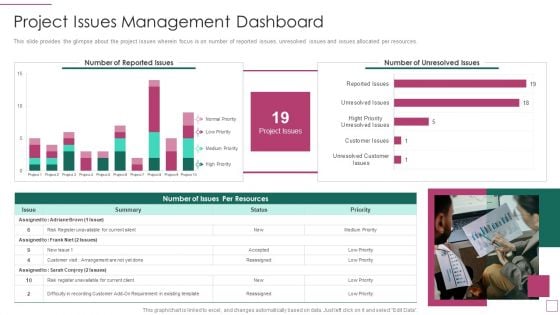
Approach Avoidance Conflict Project Issues Management Dashboard Portrait PDF
This slide provides the glimpse about the project issues wherein focus is on number of reported issues, unresolved issues and issues allocated per resources. Deliver and pitch your topic in the best possible manner with this approach avoidance conflict project issues management dashboard portrait pdf. Use them to share invaluable insights on project issues management dashboard and impress your audience. This template can be altered and modified as per your expectations. So, grab it now.
-
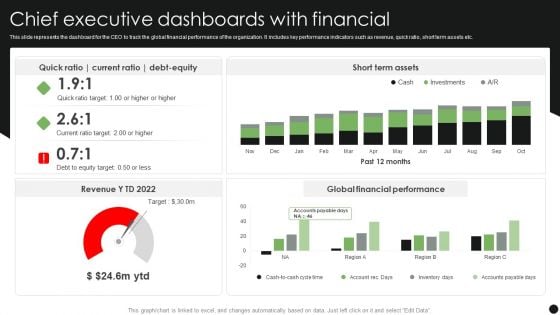
Chief Executive Dashboards With Financial Topics PDF
This slide represents the dashboard for the CEO to track the global financial performance of the organization. It includes key performance indicators such as revenue, quick ratio, short term assets etc. Showcasing this set of slides titled Chief Executive Dashboards With Financial Topics PDF. The topics addressed in these templates are Short Term Assets, Global Financial Performance, Debt Equity. All the content presented in this PPT design is completely editable. Download it and make adjustments in color, background, font etc. as per your unique business setting.
-
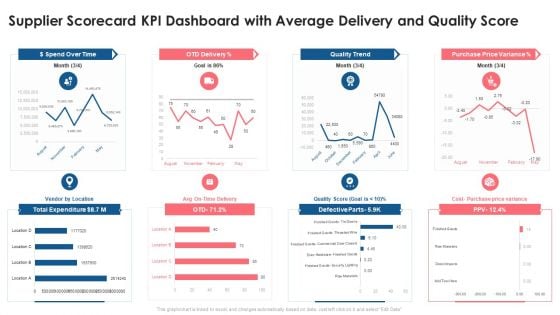
Supplier Scorecard Supplier Scorecard KPI Dashboard With Average Delivery And Quality Score Introduction PDF
This graph or chart is linked to excel, and changes automatically based on data. Just left click on it and select Edit Data. Deliver an awe inspiring pitch with this creative supplier scorecard supplier scorecard kpi dashboard with average delivery and quality score introduction pdf bundle. Topics like dollar spend over time, otd delivery, quality trend, purchase price variance, total expenditure can be discussed with this completely editable template. It is available for immediate download depending on the needs and requirements of the user.
-
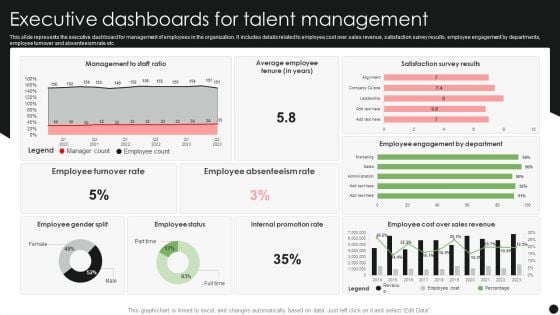
Executive Dashboards For Talent Management Pictures PDF
This slide represents the executive dashboard for management of employees in the organization. It includes details related to employee cost over sales revenue, satisfaction survey results, employee engagement by departments, employee turnover and absenteeism rate etc. Showcasing this set of slides titled Executive Dashboards For Talent Management Pictures PDF. The topics addressed in these templates are Employee Turnover Rate, Employee Absenteeism Rate, Internal Promotion Rate. All the content presented in this PPT design is completely editable. Download it and make adjustments in color, background, font etc. as per your unique business setting.
-
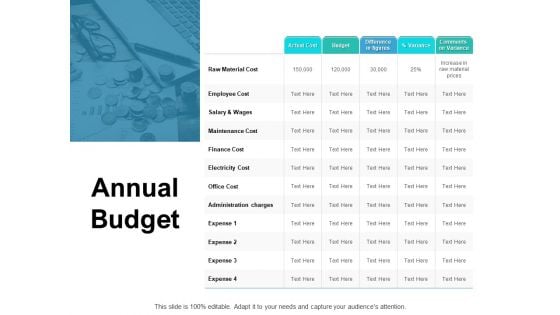
Annual Budget Ppt PowerPoint Presentation Layouts Graphics Pictures
Presenting this set of slides with name annual budget ppt powerpoint presentation layouts graphics pictures. This is a one stage process. The stages in this process are raw material cost, employee cost, maintenance cost, finance cost, electricity cost. This is a completely editable PowerPoint presentation and is available for immediate download. Download now and impress your audience.
-
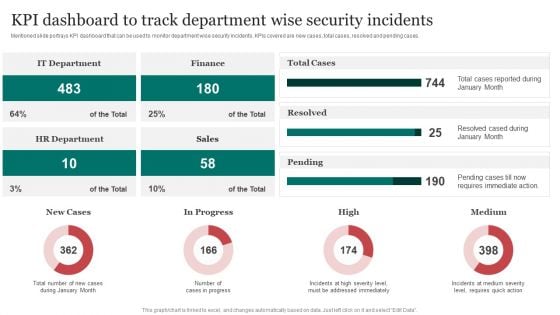
Kpi Dashboard To Track Department Wise Improving Cybersecurity With Incident Guidelines PDF
Mentioned slide portrays KPI dashboard that can be used to monitor department wise security incidents. KPIs covered are new cases, total cases, resolved and pending cases.This Kpi Dashboard To Track Department Wise Improving Cybersecurity With Incident Guidelines PDF is perfect for any presentation, be it in front of clients or colleagues. It is a versatile and stylish solution for organizing your meetings. The Kpi Dashboard To Track Department Wise Improving Cybersecurity With Incident Guidelines PDF features a modern design for your presentation meetings. The adjustable and customizable slides provide unlimited possibilities for acing up your presentation. Slidegeeks has done all the homework before launching the product for you. So, do not wait, grab the presentation templates today
-
Revenue Tactics Ppt PowerPoint Presentation Complete Deck With Slides
This Revenue Tactics Ppt PowerPoint Presentation Complete Deck With Slides acts as backup support for your ideas, vision, thoughts, etc. Use it to present a thorough understanding of the topic. This PPT slideshow can be utilized for both in-house and outside presentations depending upon your needs and business demands. Entailing twelve slides with a consistent design and theme, this template will make a solid use case. As it is intuitively designed, it suits every business vertical and industry. All you have to do is make a few tweaks in the content or any other component to design unique presentations. The biggest advantage of this complete deck is that it can be personalized multiple times once downloaded. The color, design, shapes, and other elements are free to modify to add personal touches. You can also insert your logo design in this PPT layout. Therefore a well-thought and crafted presentation can be delivered with ease and precision by downloading this Revenue Tactics Ppt PowerPoint Presentation Complete Deck With Slides PPT slideshow.
-
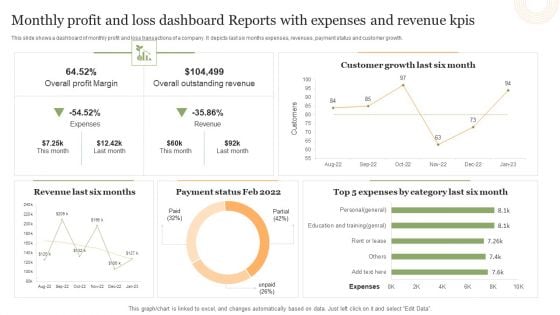
Monthly Profit And Loss Dashboard Reports With Expenses And Revenue Kpis Portrait PDF
This slide shows a dashboard of monthly profit and loss transactions of a company. It depicts last six months expenses, revenues, payment status and customer growth.Showcasing this set of slides titled Monthly Profit And Loss Dashboard Reports With Expenses And Revenue Kpis Portrait PDF. The topics addressed in these templates are Overall Profit Margin, Overall Outstanding Revenue, Customer Growth. All the content presented in this PPT design is completely editable. Download it and make adjustments in color, background, font etc. as per your unique business setting.
-
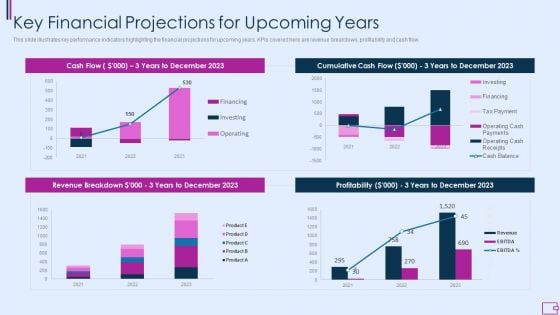
Capital Fundraising And Financial Forecast Pitch Deck Key Financial Projections For Upcoming Years Portrait PDF
This slide illustrates key performance indicators highlighting the financial projections for upcoming years. KPIs covered here are revenue breakdown, profitability and cash flow. Deliver an awe inspiring pitch with this creative capital fundraising and financial forecast pitch deck key financial projections for upcoming years portrait pdf bundle. Topics like key financial projections for upcoming years can be discussed with this completely editable template. It is available for immediate download depending on the needs and requirements of the user.
-
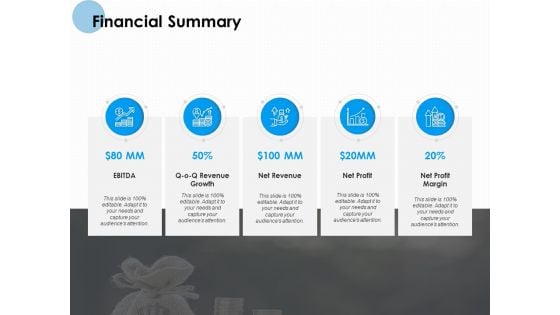
Financial Summary Ppt PowerPoint Presentation Slides Layout Ideas
Presenting this set of slides with name financial summary ppt powerpoint presentation slides layout ideas. This is a five stage process. The stages in this process are revenue growth, net revenue, net profit, net profit margin. This is a completely editable PowerPoint presentation and is available for immediate download. Download now and impress your audience.
-
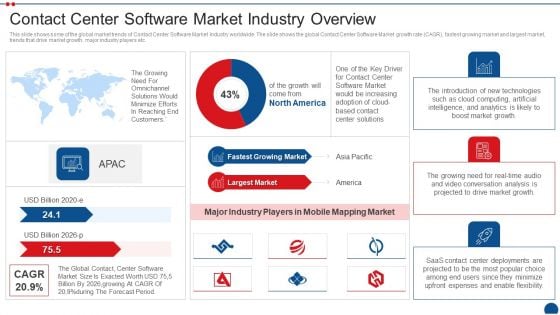
Call Center Application Market Industry Contact Center Software Market Industry Overview Background PDF
This slide shows some of the global market trends of Contact Center Software Market Industry worldwide. The slide shows the global Contact Center Software Market growth rate CAGR, fastest growing market and largest market, trends that drive market growth, major industry players etc. Deliver and pitch your topic in the best possible manner with this call center application market industry contact center software market industry overview background pdf. Use them to share invaluable insights on contact center software market industry overview and impress your audience. This template can be altered and modified as per your expectations. So, grab it now.
-
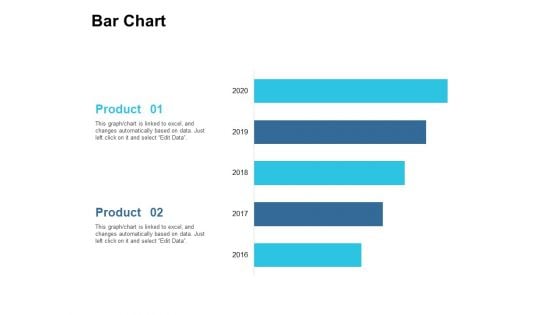
Bar Chart Ppt PowerPoint Presentation Icon Maker
Presenting this set of slides with name bar chart ppt powerpoint presentation icon maker. The topics discussed in these slide is bar chart . This is a completely editable PowerPoint presentation and is available for immediate download. Download now and impress your audience.
-
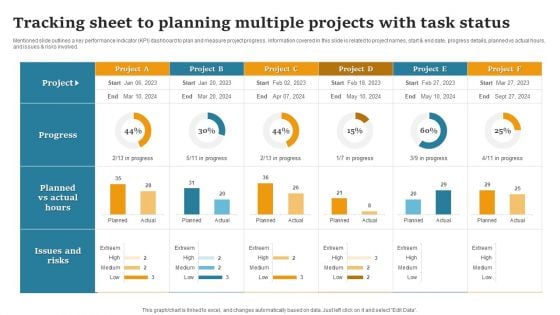
Tracking Sheet To Planning Multiples Projects With Task Status Information PDF
Mentioned slide outlines a key performance indicator KPI dashboard to plan and measure project progress . Information covered in this slide is related to project names, start and end date, progress details, planned vs actual hours, and issues and risks involved. Showcasing this set of slides titled Tracking Sheet To Planning Multiples Projects With Task Status Information PDF. The topics addressed in these templates are Progress, Issues And Risks, Project. All the content presented in this PPT design is completely editable. Download it and make adjustments in color, background, font etc. as per your unique business setting.
-
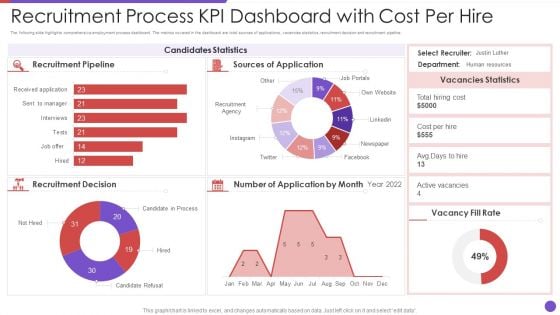
Recruitment Process KPI Dashboard With Cost Per Hire Demonstration PDF
The following slide highlights comprehensive employment process dashboard. The metrics covered in the dashboard are total sources of applications, vacancies statistics, recruitment decision and recruitment pipeline. Showcasing this set of slides titled recruitment process kpi dashboard with cost per hire demonstration pdf. The topics addressed in these templates are recruitment pipeline, resources, cost. All the content presented in this PPT design is completely editable. Download it and make adjustments in color, background, font etc. as per your unique business setting.
-
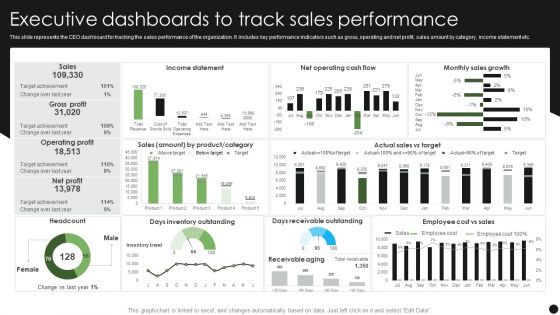
Executive Dashboards To Track Sales Performance Guidelines PDF
This slide represents the CEO dashboard for tracking the sales performance of the organization. It includes key performance indicators such as gross, operating and net profit, sales amount by category, income statement etc. Pitch your topic with ease and precision using this Executive Dashboards To Track Sales Performance Guidelines PDF. This layout presents information on Income Statement, Monthly Sales Growth, Days Receivable Outstanding. It is also available for immediate download and adjustment. So, changes can be made in the color, design, graphics or any other component to create a unique layout.
-

Handling Cyber Threats Digital Era Risk Management KPI Dashboard With Loss Ppt Slides PDF
Following slide illustrates a risk management KPI dashboard. KPIs covered are top ten risks, loss events, actions, key risk indicators and compliance. Deliver an awe inspiring pitch with this creative handling cyber threats digital era risk management kpi dashboard with loss ppt slides pdf bundle. Topics like gement kpi dashboard with loss events and actions can be discussed with this completely editable template. It is available for immediate download depending on the needs and requirements of the user.
-
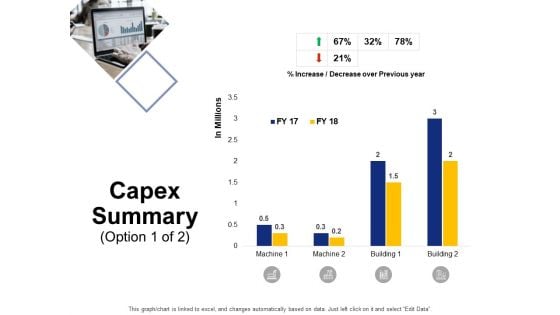
Capex Summary Option Ppt PowerPoint Presentation Summary Clipart
Presenting this set of slides with name capex summary option ppt powerpoint presentation summary clipart. The topics discussed in these slides are capex summary increase, decrease, building, machine. This is a completely editable PowerPoint presentation and is available for immediate download. Download now and impress your audience.
-
Risk Recognition Automation Security Information And Event Management Dashboard Ppt Model Elements PDF
This slide covers the SIEM dashboard which focuses on security events, event categories, data sources, logger event, multiple events, etc. Deliver an awe inspiring pitch with this creative risk recognition automation security information and event management dashboard ppt model elements pdf bundle. Topics like security information and event management dashboard can be discussed with this completely editable template. It is available for immediate download depending on the needs and requirements of the user.
-
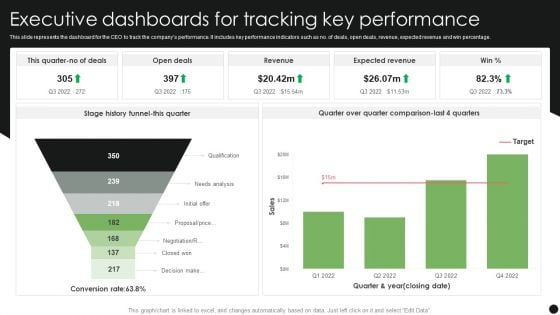
Executive Dashboards For Tracking Key Performance Icons PDF
This slide represents the dashboard for the CEO to track the companys performance. It includes key performance indicators such as no. of deals, open deals, revenue, expected revenue and win percentage. Showcasing this set of slides titled Executive Dashboards For Tracking Key Performance Icons PDF. The topics addressed in these templates are Pen Deals, Revenue, Expected Revenue. All the content presented in this PPT design is completely editable. Download it and make adjustments in color, background, font etc. as per your unique business setting.
-
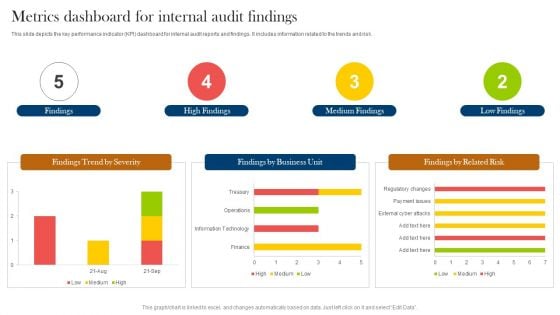
Metrics Dashboard For Internal Audit Findings Ppt Styles Gallery PDF
This slide depicts the key performance indicator KPI dashboard for internal audit reports and findings. It includes information related to the trends and risk. Pitch your topic with ease and precision using this Metrics Dashboard For Internal Audit Findings Ppt Styles Gallery PDF. This layout presents information on Findings, High Findings, Medium Findings, Low Findings. It is also available for immediate download and adjustment. So, changes can be made in the color, design, graphics or any other component to create a unique layout.
-
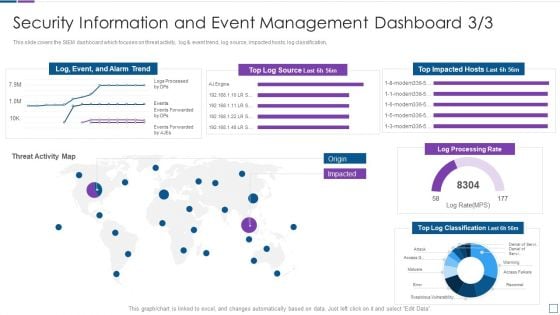
Security Information And Event Management Real Time Assessment Of Security Threats Template PDF
This slide covers the SIEM dashboard which focuses on threat activity, log and event trend, log source, impacted hosts, log classification. Deliver an awe inspiring pitch with this creative security information and event management real time assessment of security threats template pdf bundle. Topics like security information and event management dashboard can be discussed with this completely editable template. It is available for immediate download depending on the needs and requirements of the user.
-
Organizational Workforce Salary Hike Icon Portrait PDF
Persuade your audience using this organizational workforce salary hike icon portrait pdf. This PPT design covers four stages, thus making it a great tool to use. It also caters to a variety of topics including organizational workforce salary hike icon. Download this PPT design now to present a convincing pitch that not only emphasizes the topic but also showcases your presentation skills.
-
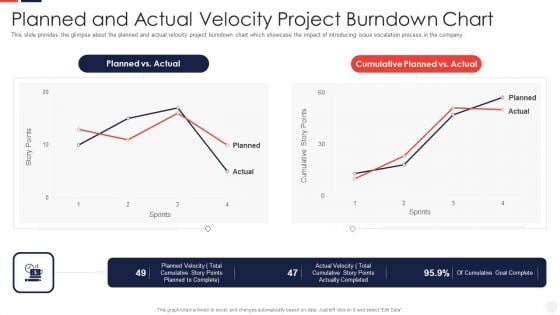
Escalation Administration System Planned And Actual Velocity Project Sample PDF
This slide provides the glimpse about the planned and actual velocity project burndown chart which showcase the impact of introducing issue escalation process in the company. Deliver and pitch your topic in the best possible manner with this escalation administration system planned and actual velocity project sample pdf. Use them to share invaluable insights on planned and actual velocity project burndown chart and impress your audience. This template can be altered and modified as per your expectations. So, grab it now.
-
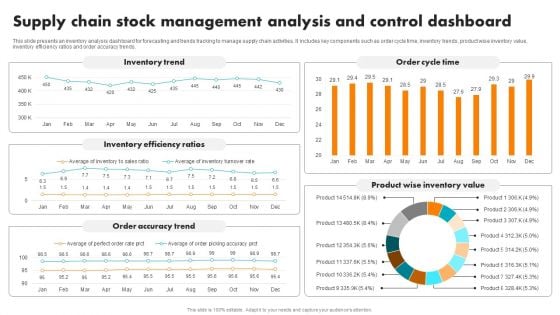
Supply Chain Stock Management Analysis And Control Dashboard Brochure PDF
This slide presents an inventory analysis dashboard for forecasting and trends tracking to manage supply chain activities. It includes key components such as order cycle time, inventory trends, product wise inventory value, inventory efficiency ratios and order accuracy trends. Pitch your topic with ease and precision using this Supply Chain Stock Management Analysis And Control Dashboard Brochure PDF. This layout presents information on Inventory Trend, Inventory Efficiency Ratios, Order Accuracy Trend, Order Cycle Time, Product Wise Inventory Value. It is also available for immediate download and adjustment. So, changes can be made in the color, design, graphics or any other component to create a unique layout.
-
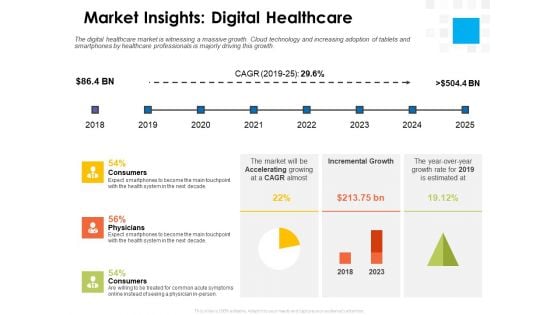
Digital Transformation Strategy Roadmap Market Insights Digital Healthcare Ppt PowerPoint Presentation Layouts Slides PDF
Presenting this set of slides with name digital transformation strategy roadmap market insights digital healthcare ppt powerpoint presentation layouts slides pdf. The topics discussed in these slides are consumers, physicians, consumers, incremental growth, accelerating, growth rate. This is a completely editable PowerPoint presentation and is available for immediate download. Download now and impress your audience.
-
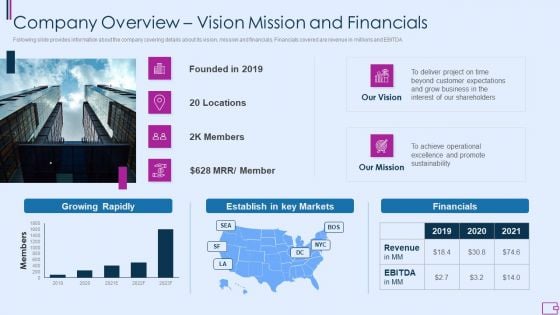
Capital Fundraising And Financial Forecast Pitch Deck Company Overview Vision Mission And Financials Elements PDF
Following slide provides information about the company covering details about its vision, mission and financials. Financials covered are revenue in millions and EBITDA. Deliver an awe inspiring pitch with this creative capital fundraising and financial forecast pitch deck company overview vision mission and financials elements pdf bundle. Topics like company overview vision mission and financials can be discussed with this completely editable template. It is available for immediate download depending on the needs and requirements of the user.
-
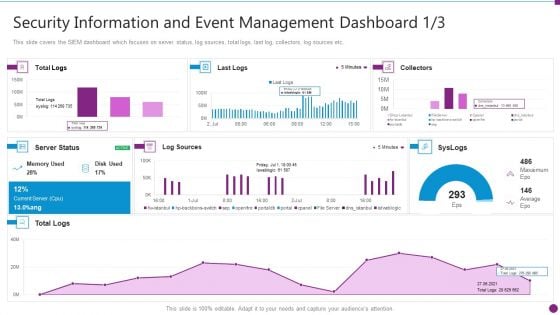
Security Information And Event Management Dashboard Server Slides PDF
This slide covers the SIEM dashboard which focuses on server status, log sources, total logs, last log, collectors, log sources etc. Deliver and pitch your topic in the best possible manner with this security information and event management dashboard server slides pdf. Use them to share invaluable insights on security information and event management dashboard and impress your audience. This template can be altered and modified as per your expectations. So, grab it now.
-
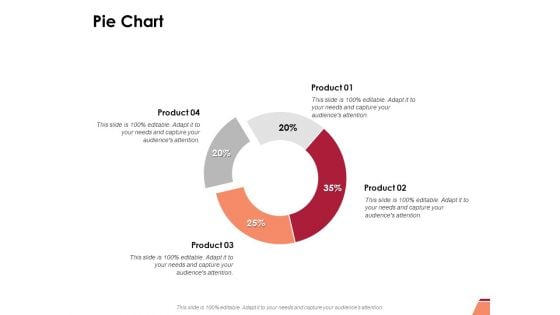
Pie Chart Ppt PowerPoint Presentation Professional Model
Presenting this set of slides with name pie chart ppt powerpoint presentation professional model. The topics discussed in these slide is pie chart. This is a completely editable PowerPoint presentation and is available for immediate download. Download now and impress your audience.
-
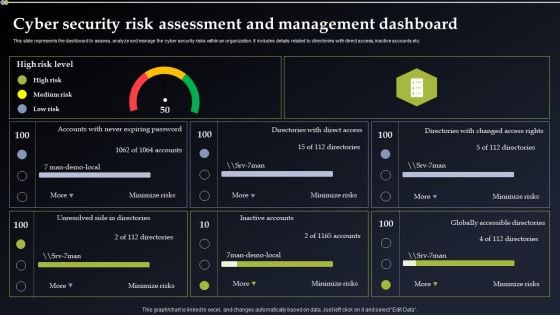
Deploying Cyber Security Incident Response Administration Cyber Security Risk Assessment Portrait PDF
This slide represents the dashboard to assess, analyze and manage the cyber security risks within an organization. It includes details related to directories with direct access, inactive accounts etc. Present like a pro with Deploying Cyber Security Incident Response Administration Cyber Security Risk Assessment Portrait PDF Create beautiful presentations together with your team, using our easy to use presentation slides. Share your ideas in real time and make changes on the fly by downloading our templates. So whether you are in the office, on the go, or in a remote location, you can stay in sync with your team and present your ideas with confidence. With Slidegeeks presentation got a whole lot easier. Grab these presentations today.
-
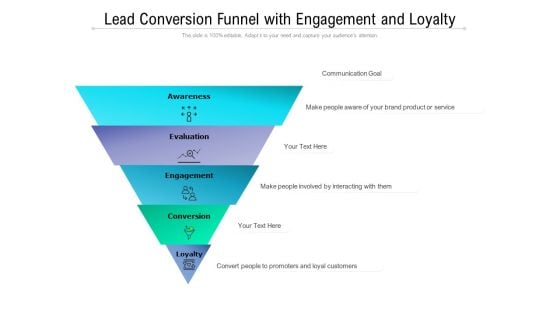
Lead Conversion Funnel With Engagement And Loyalty Ppt PowerPoint Presentation Show
Presenting this set of slides with name lead conversion funnel with engagement and loyalty ppt powerpoint presentation show. This is a five stage process. The stages in this process are awareness, evaluation, engagement, conversion, loyalty. This is a completely editable PowerPoint presentation and is available for immediate download. Download now and impress your audience.
-
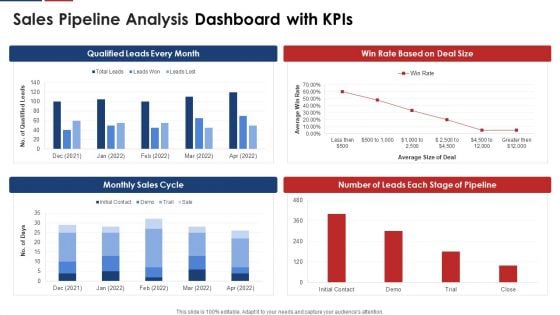
Sales Pipeline Analysis Dashboard With Kpis Structure PDF
Showcasing this set of slides titled sales pipeline analysis dashboard with kpis structure pdf. The topics addressed in these templates are sales pipeline analysis dashboard with kpis. All the content presented in this PPT design is completely editable. Download it and make adjustments in color, background, font etc. as per your unique business setting.
-
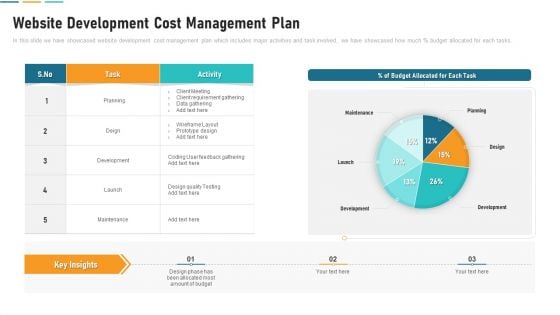
Website Development Cost Management Plan Diagrams PDF
In this slide we have showcased website development cost management plan which includes major activities and task involved, we have showcased how much percentage budget allocated for each tasks. Pitch your topic with ease and precision using this website development cost management plan diagrams pdf. This layout presents information on planning, development, maintenance. It is also available for immediate download and adjustment. So, changes can be made in the color, design, graphics or any other component to create a unique layout
-
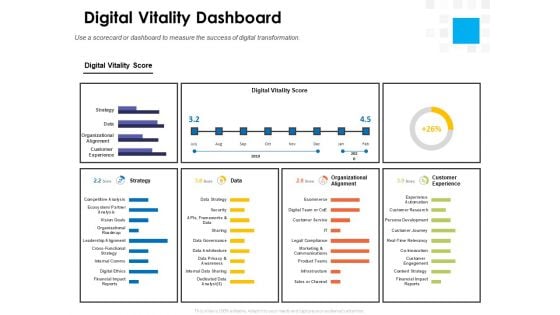
Digital Transformation Strategy Roadmap Digital Vitality Dashboard Ppt PowerPoint Presentation Icon Background Images PDF
Presenting this set of slides with name digital transformation strategy roadmap digital vitality dashboard ppt powerpoint presentation icon background images pdf. The topics discussed in these slides are digital vitality score, strategy, data, organizational alignment, customer experience. This is a completely editable PowerPoint presentation and is available for immediate download. Download now and impress your audience.
-
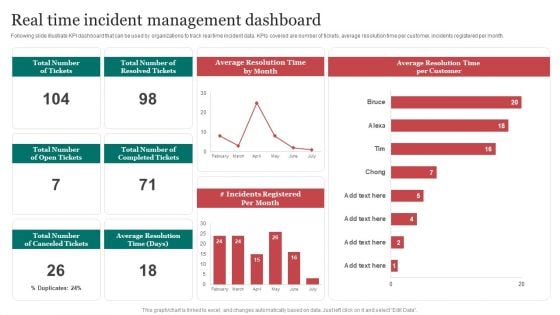
Real Time Incident Management Improving Cybersecurity With Incident Professional PDF
Following slide illustrate KPI dashboard that can be used by organizations to track real time incident data. KPIs covered are number of tickets, average resolution time per customer, incidents registered per month. The Real Time Incident Management Improving Cybersecurity With Incident Professional PDF is a compilation of the most recent design trends as a series of slides. It is suitable for any subject or industry presentation, containing attractive visuals and photo spots for businesses to clearly express their messages. This template contains a variety of slides for the user to input data, such as structures to contrast two elements, bullet points, and slides for written information. Slidegeeks is prepared to create an impression.
-
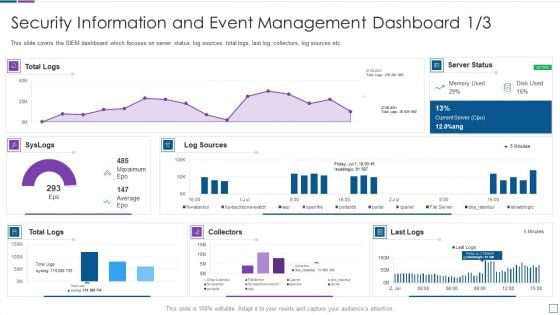
Real Time Assessment Of Security Threats Security Information And Event Management Microsoft PDF
This slide covers the SIEM dashboard which focuses on server status, log sources, total logs, last log, collectors, log sources etc. Deliver and pitch your topic in the best possible manner with this real time assessment of security threats security information and event management microsoft pdf. Use them to share invaluable insights on security information and event management dashboard and impress your audience. This template can be altered and modified as per your expectations. So, grab it now.
-

Agile Group For Product Development Action Plan For Cross Functional Product Teams Ideas PDF
This slide shows action plan for cross functional product teams which includes goal, number of completed tasks and percentage of completed goals, action, responsible person, required resources, status, etc. Deliver an awe inspiring pitch with this creative agile group for product development action plan for cross functional product teams ideas pdf bundle. Topics like salesforce account info, software subscription, survey software can be discussed with this completely editable template. It is available for immediate download depending on the needs and requirements of the user.
-
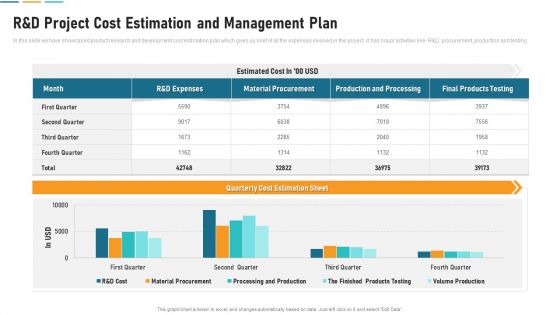
R And D Project Cost Estimation And Management Plan Icons PDF
In this slide we have showcased product research and development cost estimation plan which gives us brief of all the expenses involved in the project. It has major activities like- R and D, procurement, production and testing. Showcasing this set of slides titled r and d project cost estimation and management plan icons pdf. The topics addressed in these templates are r and d project cost estimation and management plan. All the content presented in this PPT design is completely editable. Download it and make adjustments in color, background, font etc. as per your unique business setting.
-
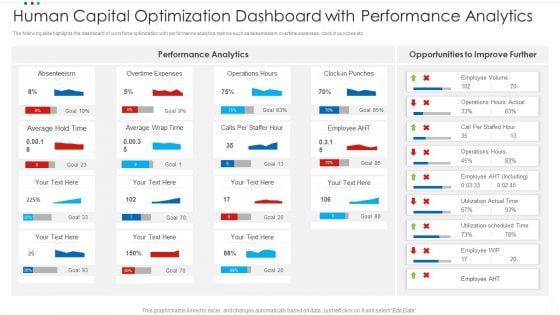
Human Capital Optimization Dashboard With Performance Analytics Infographics PDF
The following slide highlights the dashboard of workforce optimization with performance analytics metrics such as absenteeism, overtime expenses, clock in punches etc. Showcasing this set of slides titled human capital optimization dashboard with performance analytics infographics pdf. The topics addressed in these templates are average, overtime expenses, absenteeism. All the content presented in this PPT design is completely editable. Download it and make adjustments in color, background, font etc. as per your unique business setting.
-
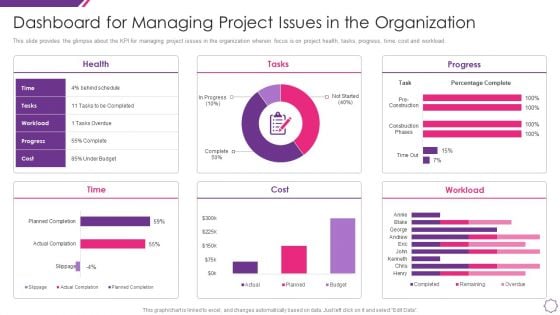
Handle Project Escalations Dashboard For Managing Project Issues In The Organization Ppt Professional Images PDF
This slide provides the glimpse about the KPI for managing project issues in the organization wherein focus is on project health, tasks, progress, time, cost and workload. Deliver and pitch your topic in the best possible manner with this handle project escalations dashboard for managing project issues in the organization ppt professional images pdf. Use them to share invaluable insights on health, tasks, progress, cost, time and impress your audience. This template can be altered and modified as per your expectations. So, grab it now.
-
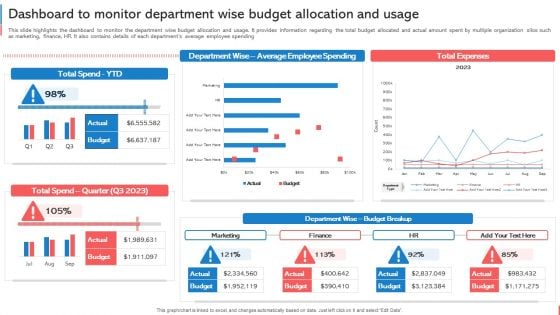
Company Budget Analysis Dashboard To Monitor Department Wise Budget Allocation Microsoft PDF
This slide highlights the dashboard to monitor the department wise budget allocation and usage. It provides information regarding the total budget allocated and actual amount spent by multiple organization silos such as marketing, finance, HR. It also contains details of each departments average employee spending Slidegeeks is one of the best resources for PowerPoint templates. You can download easily and regulate Company Budget Analysis Dashboard To Monitor Department Wise Budget Allocation Microsoft PDF for your personal presentations from our wonderful collection. A few clicks is all it takes to discover and get the most relevant and appropriate templates. Use our Templates to add a unique zing and appeal to your presentation and meetings. All the slides are easy to edit and you can use them even for advertisement purposes.
-
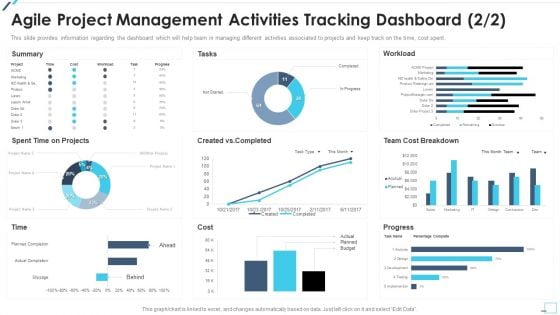
Agile Project Playbook Presentation Agile Project Management Activities Tracking Dashboard Tasks Designs PDF
This slide provides information regarding the dashboard which will help team in managing different activities associated to agile projects and keep track on the time, task summary, etc. Deliver and pitch your topic in the best possible manner with this agile project playbook presentation agile project management activities tracking dashboard tasks designs pdf. Use them to share invaluable insights on agile project management activities tracking dashboard and impress your audience. This template can be altered and modified as per your expectations. So, grab it now.
-
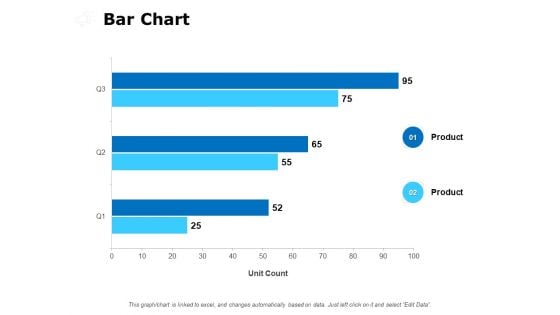
Bar Chart Ppt PowerPoint Presentation File Diagrams
Presenting this set of slides with name bar chart ppt powerpoint presentation file diagrams. The topics discussed in these slide is bar chart. This is a completely editable PowerPoint presentation and is available for immediate download. Download now and impress your audience.
-
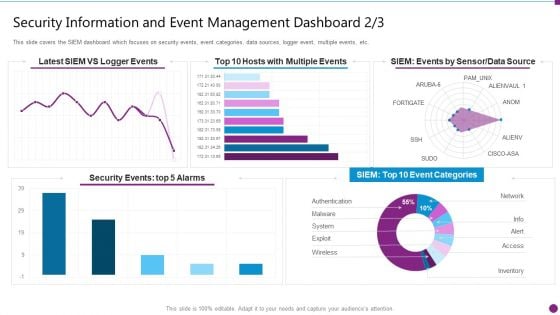
Security Information And Event Management Dashboard Events Ideas PDF
This slide covers the SIEM dashboard which focuses on security events, event categories, data sources, logger event, multiple events, etc. Deliver an awe inspiring pitch with this creative security information and event management dashboard events ideas pdf bundle. Topics like security events, data source, event categories can be discussed with this completely editable template. It is available for immediate download depending on the needs and requirements of the user.
-
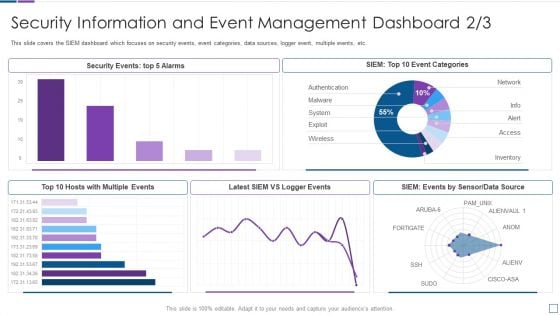
Real Time Assessment Of Security Threats Security Information And Event Management Dashboard Infographics PDF
This slide covers the SIEM dashboard which focuses on security events, event categories, data sources, logger event, multiple events, etc. Deliver an awe inspiring pitch with this creative real time assessment of security threats security information and event management dashboard infographics pdf bundle. Topics like security information and event management dashboard can be discussed with this completely editable template. It is available for immediate download depending on the needs and requirements of the user.
-
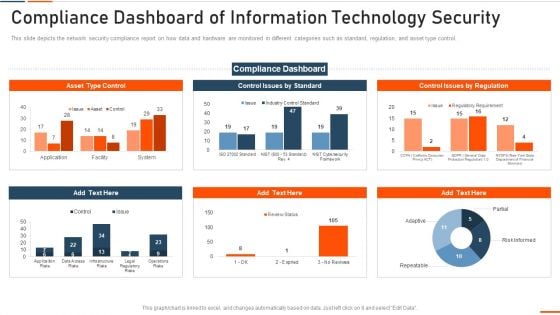
Compliance Dashboard Of Information Technology Security Ppt Inspiration Microsoft PDF
This slide depicts the network security compliance report on how data and hardware are monitored in different categories such as standard, regulation, and asset type control. Deliver an awe inspiring pitch with this creative compliance dashboard of information technology security ppt inspiration microsoft pdf bundle. Topics like compliance dashboard of information technology security can be discussed with this completely editable template. It is available for immediate download depending on the needs and requirements of the user.
-
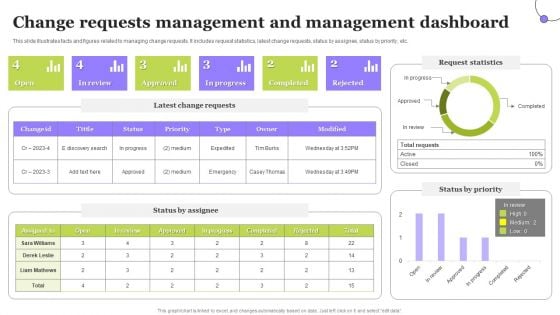
Change Requests Management And Management Dashboard Clipart PDF
This slide illustrates facts and figures related to managing change requests. It includes request statistics, latest change requests, status by assignee, status by priority, etc. Pitch your topic with ease and precision using this Change Requests Management And Management Dashboard Clipart PDF. This layout presents information on Status By Assignee, Status By Priority, Request Statistics. It is also available for immediate download and adjustment. So, changes can be made in the color, design, graphics or any other component to create a unique layout.
-
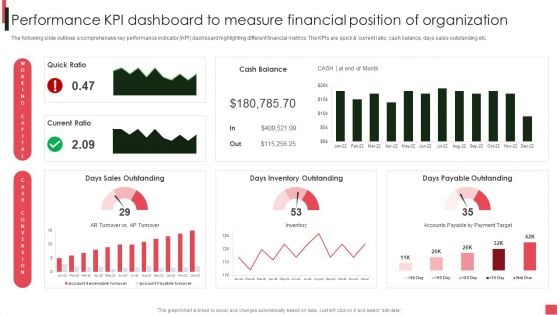
Overview Of Organizational Performance Kpi Dashboard To Measure Financial Position Sample PDF
The following slide outlines a comprehensive key performance indicator KPI dashboard highlighting different financial metrics. The KPIs are quick and current ratio, cash balance, days sales outstanding etc. Welcome to our selection of the Overview Of Organizational Performance Kpi Dashboard To Measure Financial Position Sample PDF. These are designed to help you showcase your creativity and bring your sphere to life. Planning and Innovation are essential for any business that is just starting out. This collection contains the designs that you need for your everyday presentations. All of our PowerPoints are 100 percent editable, so you can customize them to suit your needs. This multi-purpose template can be used in various situations. Grab these presentation templates today.
-
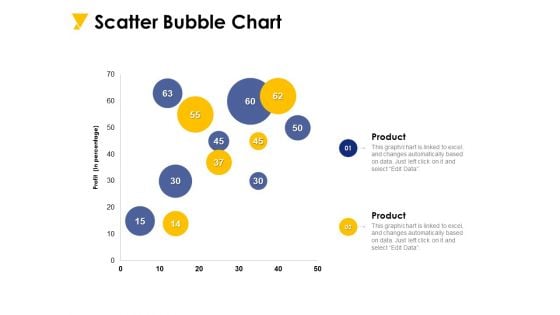
Scatter Bubble Chart Ppt PowerPoint Presentation Styles Mockup
Presenting this set of slides with name scatter bubble chart ppt powerpoint presentation styles mockup. The topics discussed in these slide is scatter bubble chart. This is a completely editable PowerPoint presentation and is available for immediate download. Download now and impress your audience.
-

Investment Pitch For Aftermarket Investment Pitch For Aftermarket Agenda For Secondary Market Funding Summary
Presenting this set of slides with name investment pitch for aftermarket investment pitch for aftermarket agenda for secondary market funding summary. This is a four stage process. The stages in this process are performance, financial overview, expanding banks operations, financial overview. This is a completely editable PowerPoint presentation and is available for immediate download. Download now and impress your audience.
-

Employee Training Playbook Determine Workforce Training Performance Tracking Dashboard Themes PDF
This slide provides information regarding workforce training performance tracking dashboard with training cost, number of participants, hours of training, etc. Deliver and pitch your topic in the best possible manner with this employee training playbook determine workforce training performance tracking dashboard themes pdf. Use them to share invaluable insights on determine workforce training performance tracking dashboard and impress your audience. This template can be altered and modified as per your expectations. So, grab it now.
-
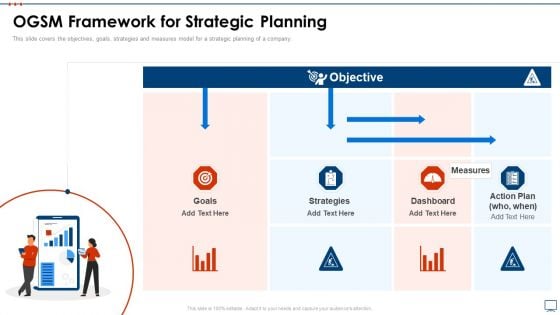
Strategic Business Plan Effective Tools Ogsm Framework For Strategic Planning Icons PDF
This slide covers the objectives, goals, strategies and measures model for a strategic planning of a company. Presenting strategic business plan effective tools ogsm framework for strategic planning icons pdf to provide visual cues and insights. Share and navigate important information on four stages that need your due attention. This template can be used to pitch topics like objective, goals, strategies, dashboard, action plan, measures. In addtion, this PPT design contains high resolution images, graphics, etc, that are easily editable and available for immediate download.
-
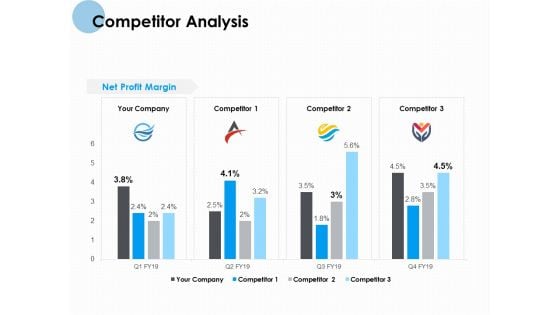
Competitor Analysis Profit Ppt PowerPoint Presentation Pictures Display
Presenting this set of slides with name competitor analysis profit ppt powerpoint presentation pictures display. The topics discussed in these slides are competitor analysis profit. This is a completely editable PowerPoint presentation and is available for immediate download. Download now and impress your audience.
-
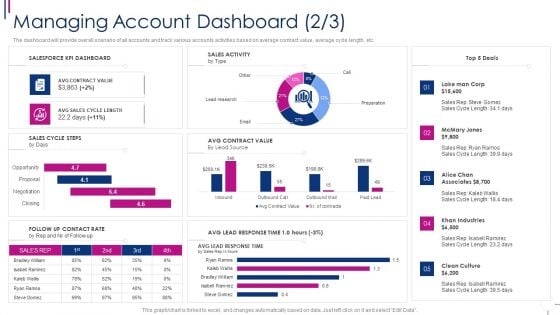
Successful Account Oriented Marketing Techniques Managing Account Dashboard Microsoft PDF
The dashboard will provide overall scenario of all accounts and track various accounts activities based on average contract value, average cycle length, etc. Deliver an awe inspiring pitch with this creative successful account oriented marketing techniques managing account dashboard microsoft pdf bundle. Topics like managing account dashboard can be discussed with this completely editable template. It is available for immediate download depending on the needs and requirements of the user.

 Home
Home 
