Finance
-

Business Diagram Organizational Chart PowerPoint Ppt Presentation
Our Business Diagram Organizational Chart PowerPoint PPT Presentation PowerPoint Templates Abhor Doodling. They Never Let The Interest Flag.
-
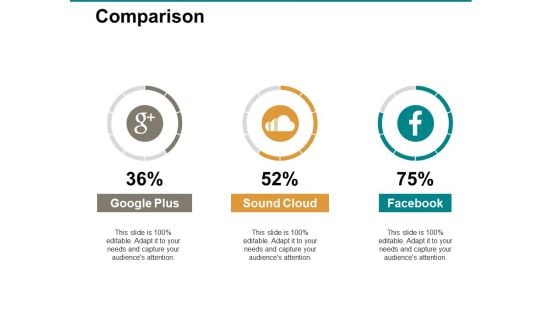
Comparison Ppt PowerPoint Presentation Microsoft
This is a comparison ppt powerpoint presentation microsoft. This is a three stage process. The stages in this process are compare, business, marketing, management.
-

Managing Employee Turnover Dashboard For Employee Retention Polices Ideas PDF
Purpose of the following slide is to show the Employee Attrition dashboard as it highlights the Employee turnover rate, average seniority of employees in months, year-over-year turnover rate etc.Deliver an awe inspiring pitch with this creative Managing Employee Turnover Dashboard For Employee Retention Polices Ideas PDF bundle. Topics like Turnover Rate, Employees These, Actual Seniority can be discussed with this completely editable template. It is available for immediate download depending on the needs and requirements of the user.
-
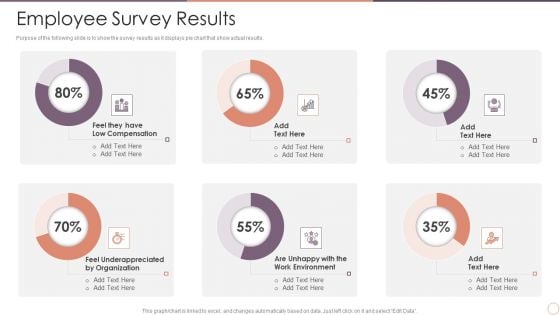
Managing Employee Turnover Employee Survey Results Microsoft PDF
Purpose of the following slide is to show the survey results as it displays pie chart that show actual results. Deliver an awe inspiring pitch with this creative Managing Employee Turnover Employee Survey Results Microsoft PDF bundle. Topics like Low Compensation, Underappreciated, Work Environment can be discussed with this completely editable template. It is available for immediate download depending on the needs and requirements of the user.
-

Analyzing And Deploying HR Analytics System In Enterprise Ppt PowerPoint Presentation Complete Deck With Slides
This fiften slide Analyzing And Deploying HR Analytics System In Enterprise Ppt PowerPoint Presentation Complete Deck With Slides is your content ready tool to impress the stakeholders with your business planning and its manner of execution. Showcase your ideas and how you plan to make them real in detail with this PPT Template Bundle. The slides have the conceptual bandwidth to present the crucial aspects of your plan, such as funding, marketing, resource allocation, timeline, roadmap, and more. When you present your plans with this PPT Layout, the stakeholders are sure to come on board because you will be able to present a succinct, thought-out, winning project. Download this Complete Deck now to take control into your hands. The 100 percent customizable offer is just too good to be resisted.
-
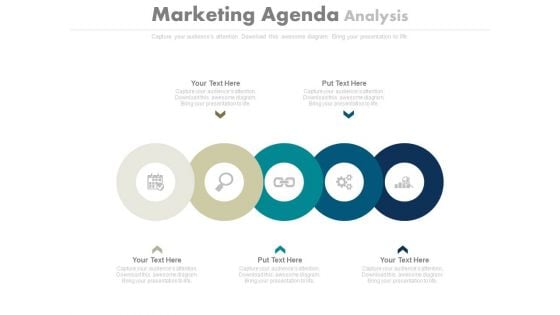
Circles For Marketing Agenda Analysis Powerpoint Slides
This PowerPoint template contains five circles in linear flow with icons. You may download this slide to display marketing agenda analysis. You can easily customize this template to make it more unique as per your need.
-
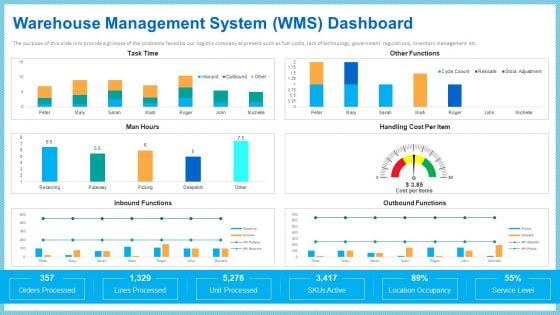
Warehouse Management System Functions Structure PDF
The purpose of this slide is to provide a glimpse of the problems faced by our logistic company at present such as fuel costs, lack of technology, government regulations, inventory management etc. Deliver an awe inspiring pitch with this creative warehouse management system functions structure pdf bundle. Topics like warehouse management system wms dashboard can be discussed with this completely editable template. It is available for immediate download depending on the needs and requirements of the user.
-

Warehouse Management System Wms Dashboard Mockup PDF
The purpose of this slide is to provide a glimpse of the problems faced by our logistic company at present such as fuel costs, lack of technology, government regulations, inventory management etc. Deliver and pitch your topic in the best possible manner with this warehouse management system wms dashboard mockup pdf. Use them to share invaluable insights on order status graph, warehouse capacity, warehouse status and impress your audience. This template can be altered and modified as per your expectations. So, grab it now.
-
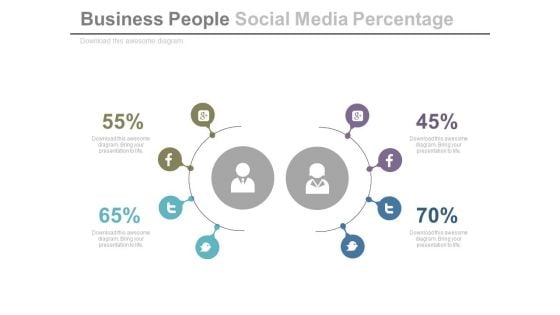
Ratio Of Social Media Users Powerpoint Slides
This PowerPoint template contains diagram of social media icons with percentage ratios. You may download this PPT slide design to display ratio of social media users. You can easily customize this template to make it more unique as per your need.
-
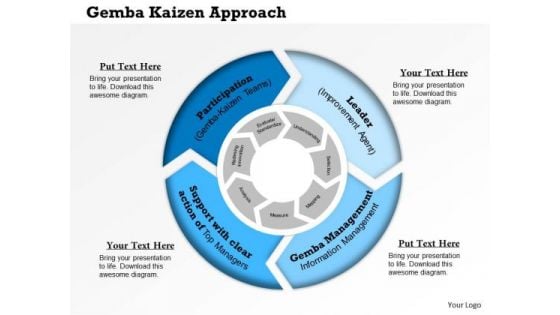
Business Framework Gemba Kaizen Approach PowerPoint Presentation
This image slide has been designed to displays Gemba kaizen common sense low cost approach to management diagram. Use this image slide, in presentations to strategic business management. This image slide will help you make professional presentations.
-
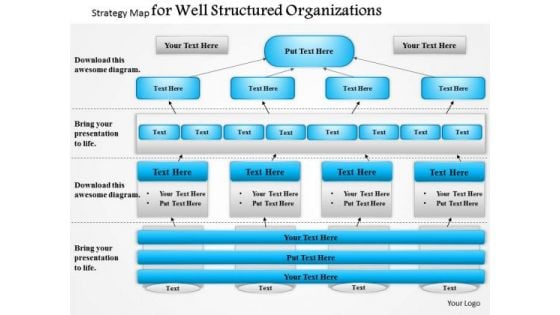
Business Framework Strategy Map For Well Structured Organizations PowerPoint Presentation
A strategy map has been used to decorate this power point template slide. This PPT slide contains the concept of well structured organization. Use this PPT slide and build an innovative presentation for organization related presentations.
-

Implementing Cyber Security Incident Cyber Security Systems Monitoring Report Icons PDF
This slide represents the report to effectively monitor the networks and systems of the organization. It includes KPIs such as total intrusion attempts, mean detect team, mean resolve time etc. Present like a pro with Implementing Cyber Security Incident Cyber Security Systems Monitoring Report Icons PDF Create beautiful presentations together with your team, using our easy to use presentation slides. Share your ideas in real time and make changes on the fly by downloading our templates. So whether you are in the office, on the go, or in a remote location, you can stay in sync with your team and present your ideas with confidence. With Slidegeeks presentation got a whole lot easier. Grab these presentations today.
-
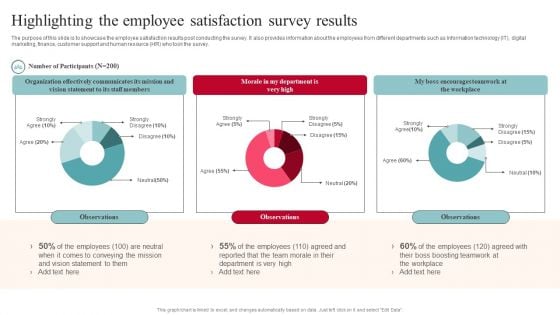
Highlighting The Employee Satisfaction Survey Results Introduction PDF
The purpose of this slide is to showcase the employee satisfaction results post conducting the survey. It also provides information about the employees from different departments such as Information technology IT, digital marketing, finance, customer support and human resource HR who took the survey. Create an editable Highlighting The Employee Satisfaction Survey Results Introduction PDF that communicates your idea and engages your audience. Whether youre presenting a business or an educational presentation, pre designed presentation templates help save time. Highlighting The Employee Satisfaction Survey Results Introduction PDF is highly customizable and very easy to edit, covering many different styles from creative to business presentations. Slidegeeks has creative team members who have crafted amazing templates. So, go and get them without any delay.
-
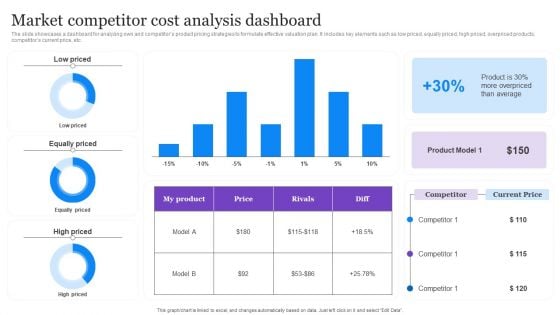
Market Competitor Cost Analysis Dashboard Graphics PDF
The slide showcases a dashboard for analyzing own and competitors product pricing strategies to formulate effective valuation plan. It includes key elements such as low priced, equally priced, high priced, overpriced products, competitors current price, etc. Pitch your topic with ease and precision using this Market Competitor Cost Analysis Dashboard Graphics PDF. This layout presents information on Average, Product Model, Cost Analysis Dashboard. It is also available for immediate download and adjustment. So, changes can be made in the color, design, graphics or any other component to create a unique layout.
-
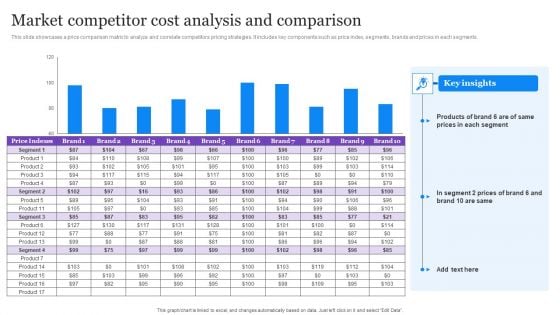
Market Competitor Cost Analysis And Comparison Demonstration PDF
This slide showcases a price comparison matrix to analyze and correlate competitors pricing strategies. It includes key components such as price index, segments, brands and prices in each segments. Showcasing this set of slides titled Market Competitor Cost Analysis And Comparison Demonstration PDF. The topics addressed in these templates are Market Competitor, Cost Analysis And Comparison. All the content presented in this PPT design is completely editable. Download it and make adjustments in color, background, font etc. as per your unique business setting.
-
Competitors Cost Comparison And Analysis Icon Guidelines PDF
Presenting Competitors Cost Comparison And Analysis Icon Guidelines PDF to dispense important information. This template comprises four stages. It also presents valuable insights into the topics including Competitors Cost Comparison, Analysis Icon. This is a completely customizable PowerPoint theme that can be put to use immediately. So, download it and address the topic impactfully.
-
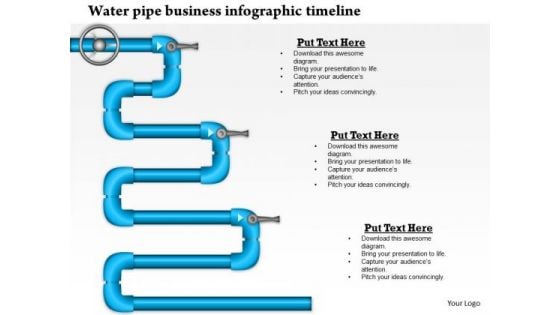
Business Framework Water Pipeline Business Infographic Design PowerPoint Presentation
This slide contains a water pipeline business infographic design. This water pipe business infographic may be used for business and sales related presentations. This interesting pipeline diagram may also be used to display timeline.
-
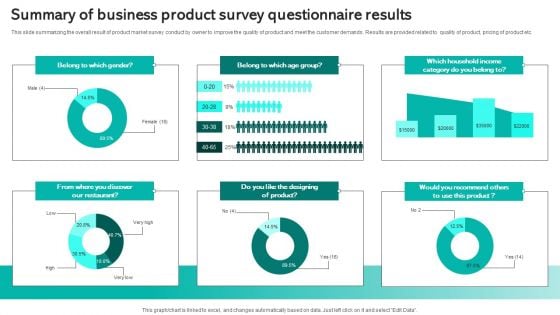
Summary Of Business Product Survey Questionnaire Results Survey SS
This slide summarizing the overall result of product market survey conduct by owner to improve the quality of product and meet the customer demands . Results are provided related to quality of product, pricing of product etc. Pitch your topic with ease and precision using this Summary Of Business Product Survey Questionnaire Results Survey SS. This layout presents information on Summary Of Business, Product Survey, Questionnaire Results. It is also available for immediate download and adjustment. So, changes can be made in the color, design, graphics or any other component to create a unique layout.
-
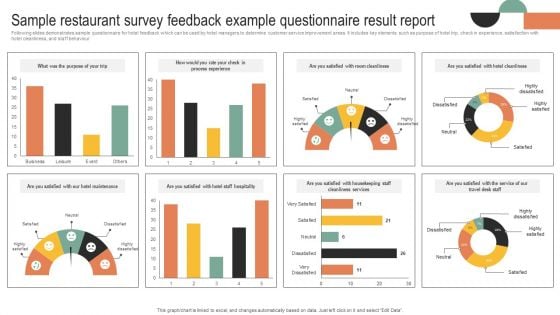
Sample Restaurant Survey Feedback Example Questionnaire Result Report Survey SS
Following slides demonstrates sample questionnaire for hotel feedback which can be used by hotel managers to determine customer service improvement areas. It includes key elements such as purpose of hotel trip, check in experience, satisfaction with hotel cleanliness, and staff behaviour. Pitch your topic with ease and precision using this Sample Restaurant Survey Feedback Example Questionnaire Result Report Survey SS. This layout presents information on Maintenance, Staff Hospitality, Cleanliness Services . It is also available for immediate download and adjustment. So, changes can be made in the color, design, graphics or any other component to create a unique layout.
-
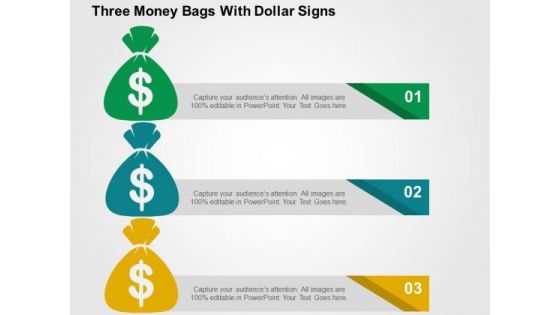
Three Money Bags With Dollar Signs PowerPoint Templates
This unique template displays diagram of three money bags with dollar symbol. This professional slide helps to represent financial planning and execution. This graphic slide is an effective tool to make your clients understand the topic.
-
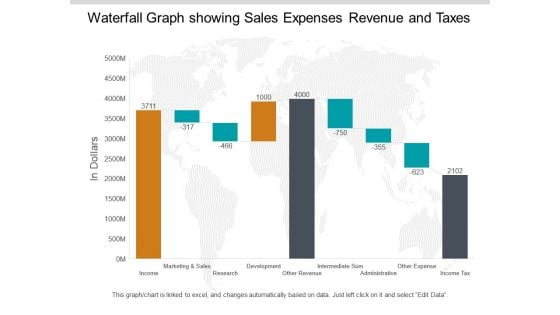
Waterfall Graph Showing Sales Expenses Revenue And Taxes Ppt PowerPoint Presentation Pictures Summary
This is a waterfall graph showing sales expenses revenue and taxes ppt powerpoint presentation pictures summary. This is a three stage process. The stages in this process are profit and loss, balance sheet, income statement, benefit and loss.
-
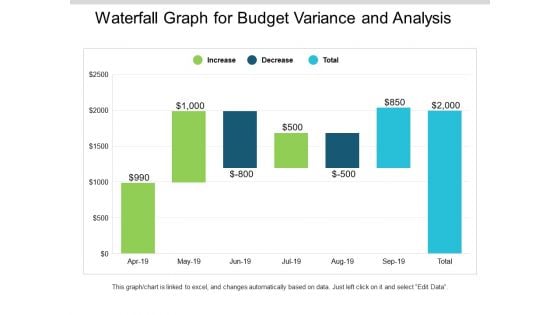
Waterfall Graph For Budget Variance And Analysis Ppt PowerPoint Presentation Slides Mockup
This is a waterfall graph for budget variance and analysis ppt powerpoint presentation slides mockup. This is a three stage process. The stages in this process are profit and loss, balance sheet, income statement, benefit and loss.
-
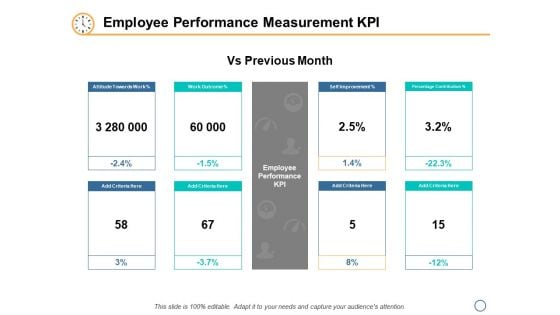
Employee Performance Measurement KPI Ppt PowerPoint Presentation Inspiration Influencers
This is a employee performance measurement kpi ppt powerpoint presentation inspiration influencers. This is a eight stage process. The stages in this process are finance, analysis, business, investment, marketing.
-
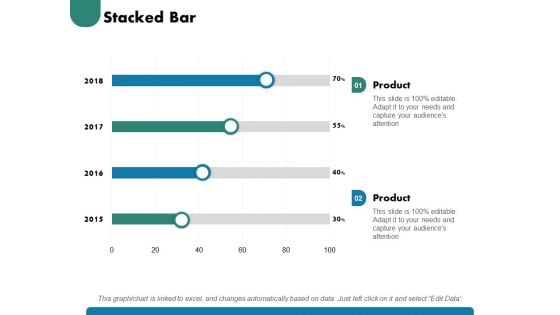
Stacked Bar Ppt PowerPoint Presentation Slides Demonstration
This is a stacked bar ppt powerpoint presentation slides demonstration. This is a two stage process. The stages in this process are stacked bar, finance, marketing, management, investment, analysis.
-

Capability Development Ppt PowerPoint Presentation Complete Deck With Slides
This is a capability development ppt powerpoint presentation complete deck with slides. This is a one stage process. The stages in this process are capability development, marketing, business, management, strategy.
-
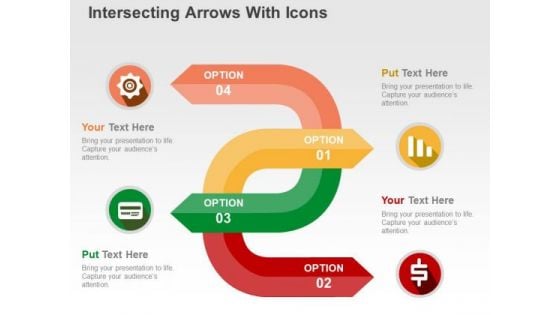
Intersecting Arrows With Icons PowerPoint Template
This business slide displays intersecting arrows with icons. This diagram depicts the concept of communication and connection. Use this business diagram to build unique presentations.
-
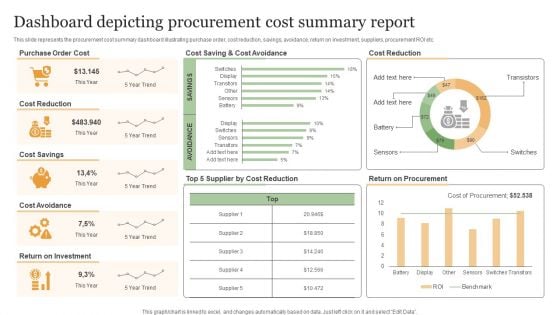
Dashboard Depicting Procurement Cost Summary Report Microsoft PDF
This slide represents the procurement cost summary dashboard illustrating purchase order, cost reduction, savings, avoidance, return on investment, suppliers, procurement ROI etc. Pitch your topic with ease and precision using this Dashboard Depicting Procurement Cost Summary Report Microsoft PDF. This layout presents information on Purchase Order Cost, Cost Reduction, Cost Savings. It is also available for immediate download and adjustment. So, changes can be made in the color, design, graphics or any other component to create a unique layout.
-
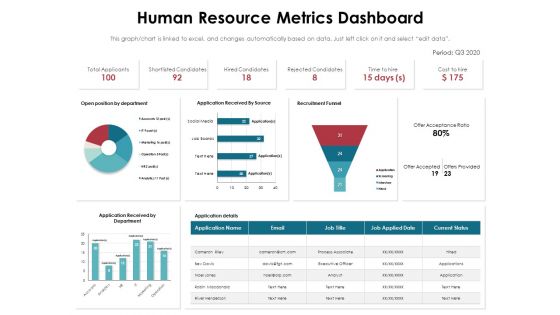
Human Resource Metrics Dashboard Ppt PowerPoint Presentation Layouts Icons PDF
Presenting this set of slides with name human resource metrics dashboard ppt powerpoint presentation layouts icons pdf. The topics discussed in these slide is total applicants, shortlisted candidates, hired candidates, rejected candidates, time to hire, cost to hire. This is a completely editable PowerPoint presentation and is available for immediate download. Download now and impress your audience.
-
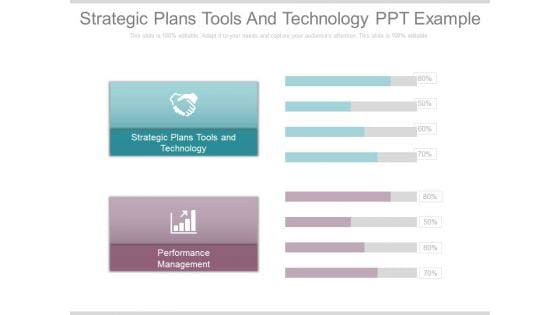
Strategic Plans Tools And Technology Ppt Example
This is a strategic plans tools and technology ppt example. This is a two stage process. The stages in this process are technology, business, finance, marketing.
-

Economies Of Scale Powerpoint Presentation Templates
This is an economies of scale powerpoint presentation templates. This is a five stage process. The stages in this process are economies of scale, economies of scale, capital requirements, product differentiation, access to distribution channels.
-
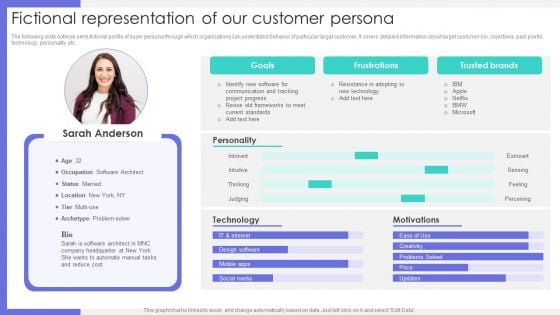
Fictional Representation Of Our Customer Persona Ppt Inspiration Deck PDF
The following slide outlines semi-fictional profile of buyer persona through which organizations can understand behavior of particular target customer. It covers detailed information about target customer bio, objectives, pain points, technology, personality, etc. Coming up with a presentation necessitates that the majority of the effort goes into the content and the message you intend to convey. The visuals of a PowerPoint presentation can only be effective if it supplements and supports the story that is being told. Keeping this in mind our experts created Fictional Representation Of Our Customer Persona Ppt Inspiration Deck PDF to reduce the time that goes into designing the presentation. This way, you can concentrate on the message while our designers take care of providing you with the right template for the situation.
-
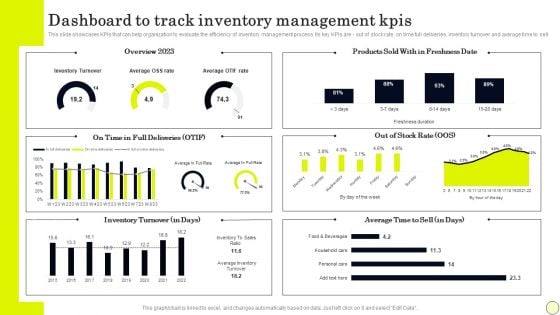
Dashboard To Track Inventory Management Kpis Portrait PDF
This slide showcases KPIs that can help organization to evaluate the efficiency of inventory management process. Its key KPIs are out of stock rate, on time full deliveries, inventory turnover and average time to sell. Here you can discover an assortment of the finest PowerPoint and Google Slides templates. With these templates, you can create presentations for a variety of purposes while simultaneously providing your audience with an eye catching visual experience. Download Dashboard To Track Inventory Management Kpis Portrait PDF to deliver an impeccable presentation. These templates will make your job of preparing presentations much quicker, yet still, maintain a high level of quality. Slidegeeks has experienced researchers who prepare these templates and write high quality content for you. Later on, you can personalize the content by editing the Dashboard To Track Inventory Management Kpis Portrait PDF.
-
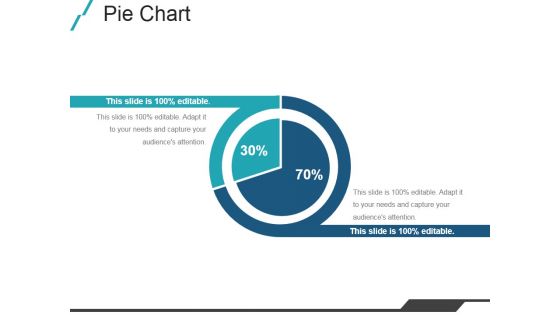
Pie Chart Ppt PowerPoint Presentation Design Templates
This is a pie chart ppt powerpoint presentation design templates. This is a two stage process. The stages in this process are pie chart, finance, business, marketing, percentage.
-
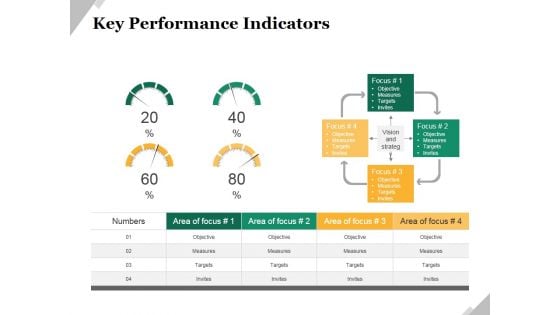
Key Performance Indicators Template 2 Ppt PowerPoint Presentation Model Example
This is a key performance indicators template 2 ppt powerpoint presentation model example. This is a four stage process. The stages in this process are objective, measures, targets, invites, indicators.
-

Hr Dashboard Template 2 Ppt PowerPoint Presentation Microsoft
This is a hr dashboard template 2 ppt powerpoint presentation microsoft. This is a four stage process. The stages in this process are open positions by divisions, key metrics, total employees, employee churn.
-
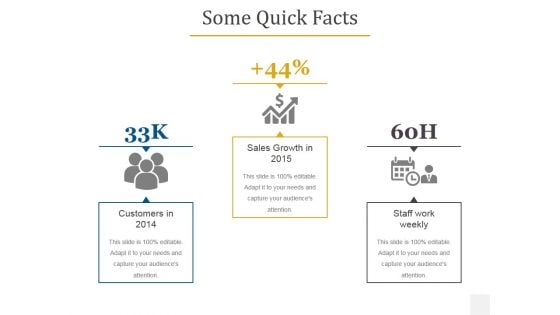
Some Quick Facts Ppt PowerPoint Presentation Layouts Icons
This is a some quick facts ppt powerpoint presentation layouts icons. This is a three stage process. The stages in this process are customers, sales growth, staff work weekly.
-
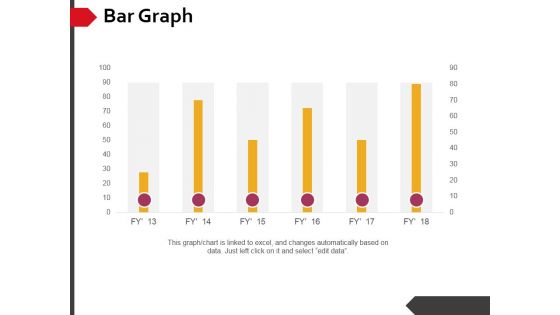
Bar Graph Ppt PowerPoint Presentation Professional Clipart
This is a bar graph ppt powerpoint presentation professional clipart. This is a six stage process. The stages in this process are bar graph, finance, marketing, strategy, business.
-
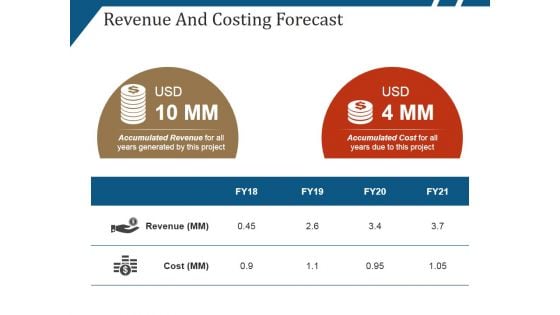
Revenue And Costing Forecast Ppt PowerPoint Presentation Gallery Slides
This is a revenue and costing forecast ppt powerpoint presentation gallery slides. This is a two stage process. The stages in this process are revenue, cost, dollar, symbol.
-
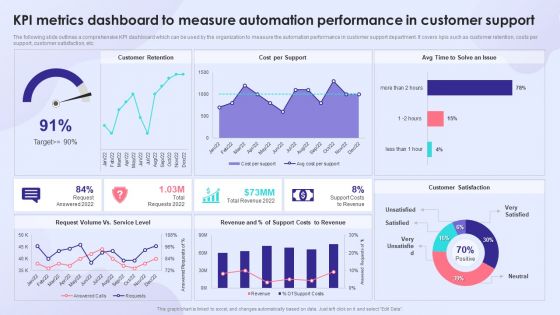
KPI Metrics Dashboard To Measure Automation Performance In Customer Support Professional PDF
The following slide outlines a comprehensive KPI dashboard which can be used by the organization to measure the automation performance in customer support department. It covers kpis such as customer retention, costs per support, customer satisfaction, etc. Deliver and pitch your topic in the best possible manner with this KPI Metrics Dashboard To Measure Automation Performance In Customer Support Professional PDF. Use them to share invaluable insights on Customer Retention, Cost Per Support, Support Costs To Revenue and impress your audience. This template can be altered and modified as per your expectations. So, grab it now.
-
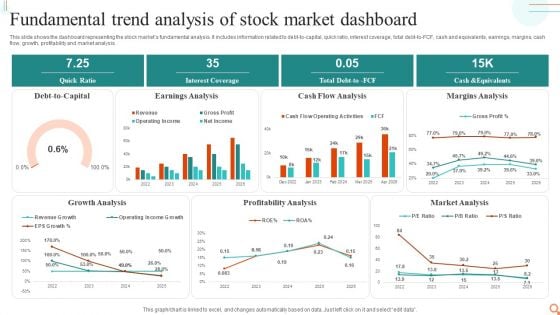
Fundamental Trend Analysis Of Stock Market Dashboard Professional PDF
This slide shows the dashboard representing the stock markets fundamental analysis. It includes information related to debt-to-capital, quick ratio, interest coverage, total debt-to-FCF, cash and equivalents, earnings, margins, cash flow, growth, profitability and market analysis.Showcasing this set of slides titled Fundamental Trend Analysis Of Stock Market Dashboard Professional PDF. The topics addressed in these templates are Earnings Analysis, Cash Flow Analysis, Margins Analysis. All the content presented in this PPT design is completely editable. Download it and make adjustments in color, background, font etc. as per your unique business setting.
-
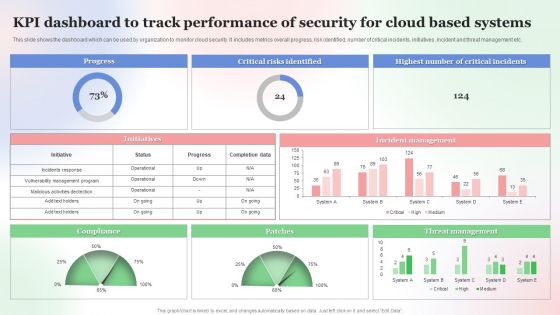
KPI Dashboard To Track Performance Of Security For Cloud Based Systems Clipart PDF
This slide shows the dashboard which can be used by organization to monitor cloud security. It includes metrics overall progress, risk identified, number of critical incidents, initiatives, incident and threat management etc. Showcasing this set of slides titled KPI Dashboard To Track Performance Of Security For Cloud Based Systems Clipart PDF. The topics addressed in these templates are Kpi Dashboard To Track, Performance Of Security, Cloud Based Systems . All the content presented in this PPT design is completely editable. Download it and make adjustments in color, background, font etc. as per your unique business setting.
-
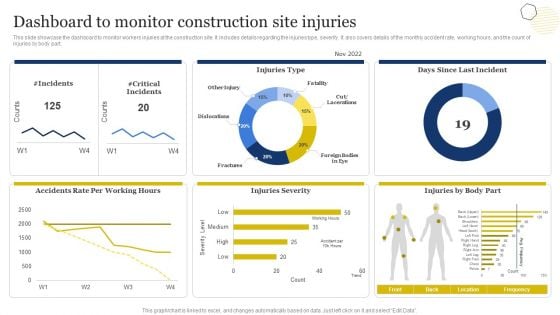
Improvement Of Safety Performance At Construction Site Dashboard To Monitor Construction Mockup PDF
This slide showcase the dashboard to monitor workers injuries at the construction site. It includes details regarding the injuries type, severity. It also covers details of the monthly accident rate, working hours, and the count of injuries by body part. Do you have an important presentation coming up Are you looking for something that will make your presentation stand out from the rest Look no further than Improvement Of Safety Performance At Construction Site Dashboard To Monitor Construction Mockup PDF. With our professional designs, you can trust that your presentation will pop and make delivering it a smooth process. And with Slidegeeks, you can trust that your presentation will be unique and memorable. So why wait Grab Improvement Of Safety Performance At Construction Site Dashboard To Monitor Construction Mockup PDF today and make your presentation stand out from the rest
-

Improvement Of Safety Performance At Construction Site Kpi Dashboard To Track Safety Program Microsoft PDF
This slide reflects the key performance indicator dashboard to track the performance of safety program. It includes information regarding the total manpower, manhours, unsafe conditions, lost time injuries frequency, injuries severity rate, along with the training hours. Make sure to capture your audiences attention in your business displays with our gratis customizable Improvement Of Safety Performance At Construction Site Kpi Dashboard To Track Safety Program Microsoft PDF. These are great for business strategies, office conferences, capital raising or task suggestions. If you desire to acquire more customers for your tech business and ensure they stay satisfied, create your own sales presentation with these plain slides.
-
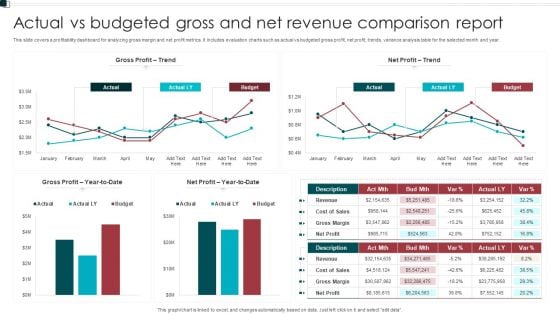
Actual Vs Budgeted Gross And Net Revenue Comparison Report Sample PDF
This slide covers a profitability dashboard for analyzing gross margin and net profit metrics. It includes evaluation charts such as actual vs budgeted gross profit, net profit, trends, variance analysis table for the selected month and year. Pitch your topic with ease and precision using this Actual Vs Budgeted Gross And Net Revenue Comparison Report Sample PDF. This layout presents information on Gross Profit, Net Profit, Budget. It is also available for immediate download and adjustment. So, changes can be made in the color, design, graphics or any other component to create a unique layout.
-
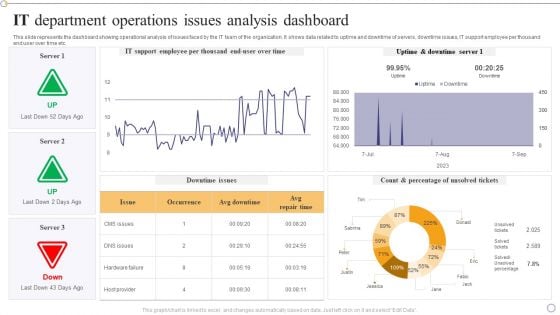
IT Department Operations Issues Analysis Dashboard Designs PDF
This slide represents the dashboard showing operational analysis of issues faced by the IT team of the organization. It shows data related to uptime and downtime of servers, downtime issues, IT support employee per thousand end user over time etc.Pitch your topic with ease and precision using this IT Department Operations Issues Analysis Dashboard Designs PDF. This layout presents information on Support Employee, Uptime Downtime, Percentage Unsolved. It is also available for immediate download and adjustment. So, changes can be made in the color, design, graphics or any other component to create a unique layout.
-
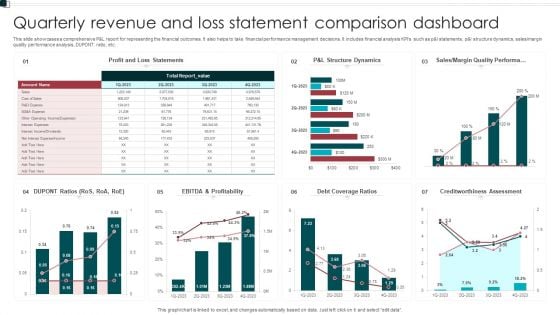
Quarterly Revenue And Loss Statement Comparison Dashboard Portrait PDF
This slide showcases a comprehensive P and L report for representing the financial outcomes. It also helps to take financial performance management decisions. It includes financial analysis KPIs such as p and l statements, p and l structure dynamics, sales or margin quality performance analysis, DUPONT ratio, etc. Showcasing this set of slides titled Quarterly Revenue And Loss Statement Comparison Dashboard Portrait PDF. The topics addressed in these templates are Profitability, Debt Coverage Ratios, Margin Quality Performa. All the content presented in this PPT design is completely editable. Download it and make adjustments in color, background, font etc. as per your unique business setting.
-
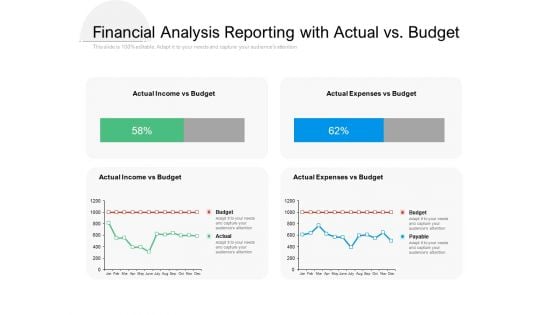
Financial Analysis Reporting With Actual Vs Budget Ppt PowerPoint Presentation Styles Format Ideas
Presenting this set of slides with name financial analysis reporting with actual vs budget ppt powerpoint presentation styles format ideas. The topics discussed in these slides are actual income vs budget, actual expenses vs budget . This is a completely editable PowerPoint presentation and is available for immediate download. Download now and impress your audience.
-
3 Stages To Explain Process Starting Small Business PowerPoint Slides
We present our 3 stages to explain process starting small business PowerPoint Slides.Present our Finance PowerPoint Templates because Our PowerPoint Templates and Slides team portray an attitude of elegance. Personify this quality by using them regularly. Use our Arrows PowerPoint Templates because You can Inspire your team with our PowerPoint Templates and Slides. Let the force of your ideas flow into their minds. Use our Business PowerPoint Templates because You canTake a leap off the starting blocks with our PowerPoint Templates and Slides. They will put you ahead of the competition in quick time. Download our Process and Flows PowerPoint Templates because Our PowerPoint Templates and Slides will give good value for money. They also have respect for the value of your time. Download our Success PowerPoint Templates because You should Bet on your luck with our PowerPoint Templates and Slides. Be assured that you will hit the jackpot.Use these PowerPoint slides for presentations relating to 3d, Arrow, Banner, Business, Business Concept, Chart, Description, Development, Diagram, Direction, Element, Empty, Financial, Flow, Flowchart, Future, Gradient, Graph, Graphic, Illustration, Isolated, Mirrored, Object, Placeholder, Presentation, Process, Section, Segment, Set, Shape, Sign, Steps, Symbol, Template, Topic, Vector. The prominent colors used in the PowerPoint template are Pink, Green, Yellow. Presenters tell us our 3 stages to explain process starting small business PowerPoint Slides are incredible easy to use. We assure you our Concept PowerPoint templates and PPT Slides provide you with a vast range of viable options. Select the appropriate ones and just fill in your text. Professionals tell us our 3 stages to explain process starting small business PowerPoint Slides are second to none. We assure you our Business PowerPoint templates and PPT Slides are aesthetically designed to attract attention. We guarantee that they will grab all the eyeballs you need. People tell us our 3 stages to explain process starting small business PowerPoint Slides are aesthetically designed to attract attention. We guarantee that they will grab all the eyeballs you need. The feedback we get is that our Development PowerPoint templates and PPT Slides will save the presenter time.
-
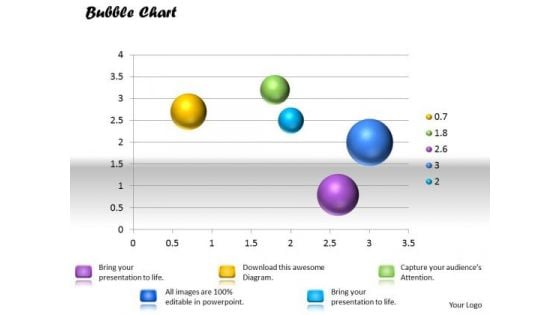
Business Framework PowerPoint Bubble Chart PowerPoint Presentation
This innovative image slide has been designed with graphic of bubble chart to depict any information which requires visual presentation. This image slide is 100% editable. You may change color, size and orientation of any icon to your liking. This image slide may be used in school, business and social presentations. Make your presentations interesting using this image slide.
-
Computer Screen With Cloud Icon Ppt Powerpoint Presentation Infographics Display
This is a computer screen with cloud icon ppt powerpoint presentation infographics display. This is a three stage process. The stages in this process are data visualization icon, data management icon.
-
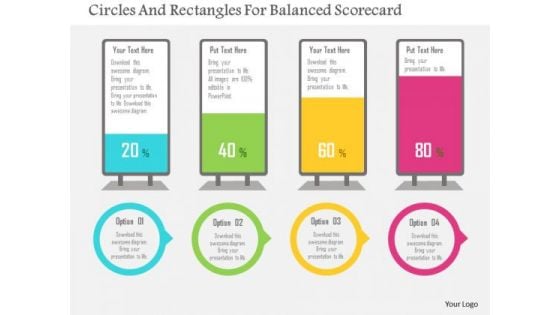
Business Diagram Circles And Rectangles For Balanced Scorecard Presentation Template
This business slide displays diagram of circles and rectangles. It helps to depict workflow or a process. This diagram offers a way for your audience to visually conceptualize the process.
-
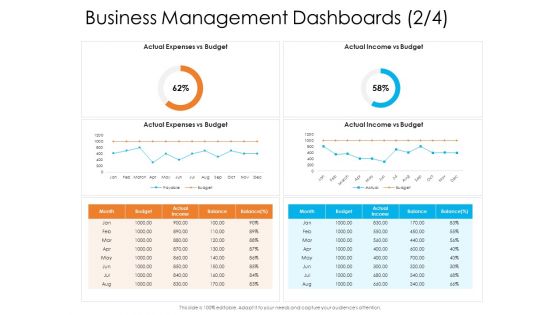
Enterprise Governance Business Management Dashboards Mar Download PDF
Deliver and pitch your topic in the best possible manner with this enterprise governance business management dashboards mar download pdf. Use them to share invaluable insights on actual expenses vs budget, actual income vs budget and impress your audience. This template can be altered and modified as per your expectations. So, grab it now.
-
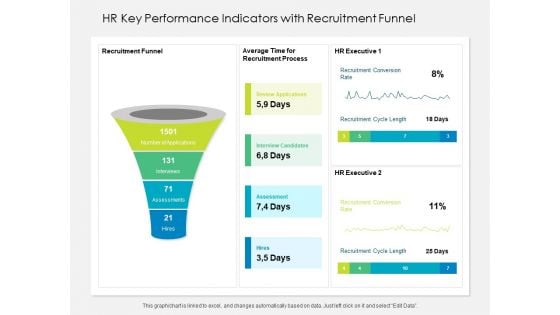
HR Key Performance Indicators With Recruitment Funnel Ppt PowerPoint Presentation File Formats PDF
Presenting this set of slides with name hr key performance indicators with recruitment funnel ppt powerpoint presentation file formats pdf. The topics discussed in these slides are funnel, process, recruitment. This is a completely editable PowerPoint presentation and is available for immediate download. Download now and impress your audience.
-

Financial Investigation Ppt PowerPoint Presentation Complete Deck With Slides
This is a financial investigation ppt powerpoint presentation complete deck with slides. This is a one stage process. The stages in this process are finance, analysis, invest, planning, marketing.
-
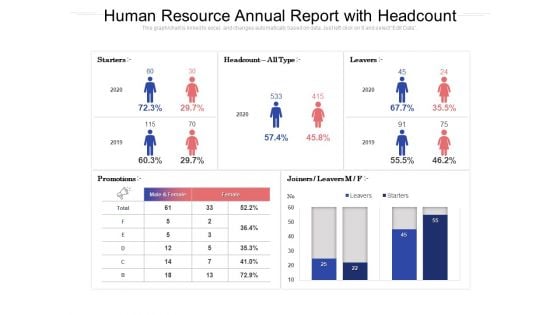
Human Resource Annual Report With Headcount Ppt PowerPoint Presentation Icon Influencers PDF
Presenting this set of slides with name human resource annual report with headcount ppt powerpoint presentation icon influencers pdf. The topics discussed in these slides are starters, headcount, leavers, promotions, male, female, 2019 to 2020. This is a completely editable PowerPoint presentation and is available for immediate download. Download now and impress your audience.
-
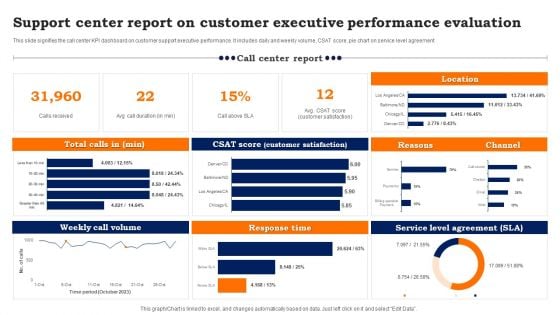
Support Center Report On Customer Executive Performance Evaluation Background PDF
This slide signifies the call center KPI dashboard on customer support executive performance. It includes daily and weekly volume, CSAT score, pie chart on service level agreement. Pitch your topic with ease and precision using this Support Center Report On Customer Executive Performance Evaluation Background PDF. This layout presents information on Weekly Call Volume, Response Time, Service Level Agreement. It is also available for immediate download and adjustment. So, changes can be made in the color, design, graphics or any other component to create a unique layout.
-
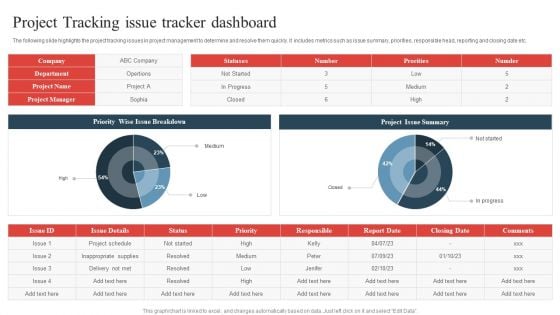
Project Tracking Issue Tracker Dashboard Rules PDF
The following slide highlights the project tracking issues in project management to determine and resolve them quickly. It includes metrics such as issue summary, priorities, responsible head, reporting and closing date etc. Showcasing this set of slides titled Project Tracking Issue Tracker Dashboard Rules PDF. The topics addressed in these templates are Inappropriate Supplies, Project, Tracker Dashboard. All the content presented in this PPT design is completely editable. Download it and make adjustments in color, background, font etc. as per your unique business setting.
-
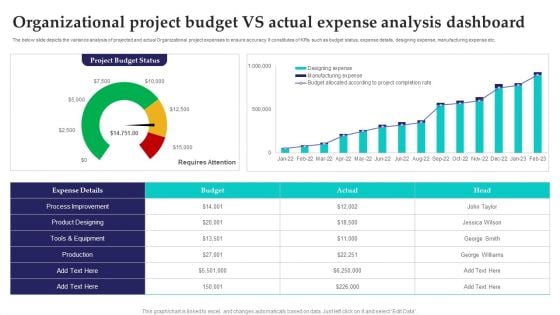
Organizational Project Budget Vs Actual Expense Analysis Dashboard Sample PDF
Showcasing this set of slides titled Organizational Project Budget Vs Actual Expense Analysis Dashboard Sample PDF. The topics addressed in these templates are Process Improvement, Equipment, Budget. All the content presented in this PPT design is completely editable. Download it and make adjustments in color, background, font etc. as per your unique business setting.
-
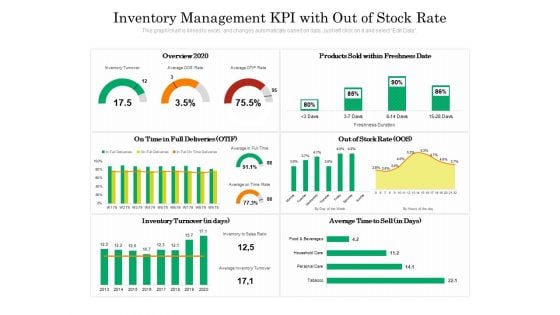
Inventory Management KPI With Out Of Stock Rate Ppt PowerPoint Presentation Gallery Background PDF
Presenting this set of slides with name inventory management kpi with out of stock rate ppt powerpoint presentation gallery background pdf. The topics discussed in these slides are inventor, average, deliveries. This is a completely editable PowerPoint presentation and is available for immediate download. Download now and impress your audience.
-
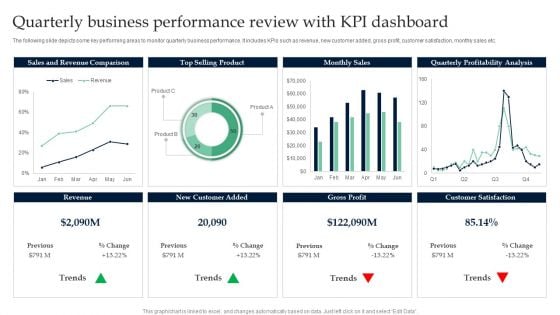
Quarterly Business Performance Review With KPI Dashboard Infographics PDF
Pitch your topic with ease and precision using this Quarterly Business Performance Review With KPI Dashboard Infographics PDF. This layout presents information on Sales And Revenue Comparison, Top Selling Product. It is also available for immediate download and adjustment. So, changes can be made in the color, design, graphics or any other component to create a unique layout.

 Home
Home 

