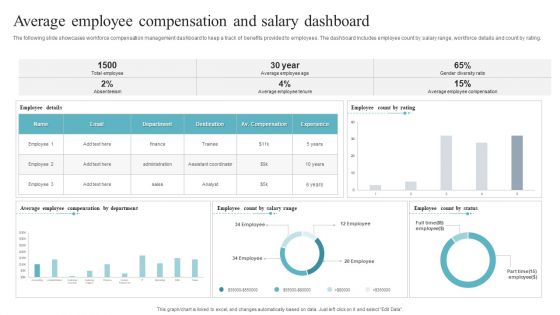
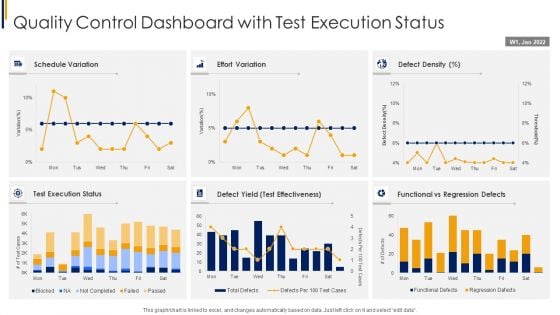
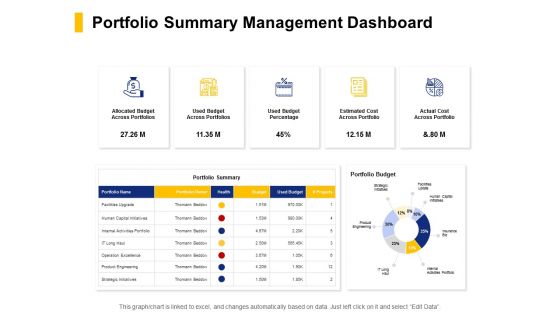
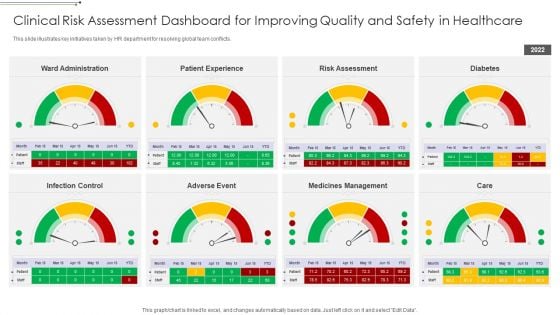
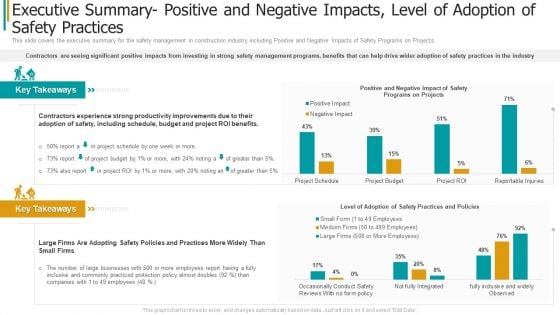
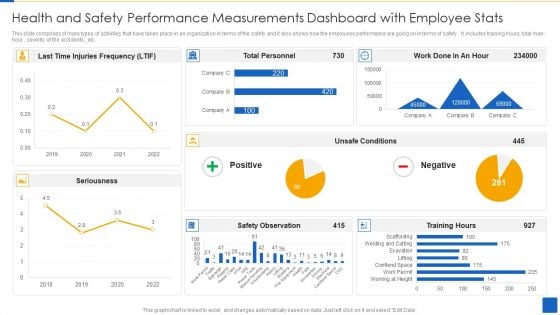
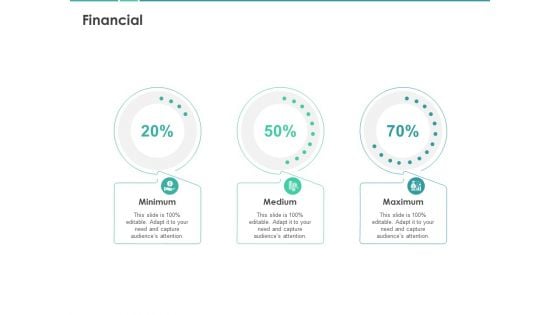
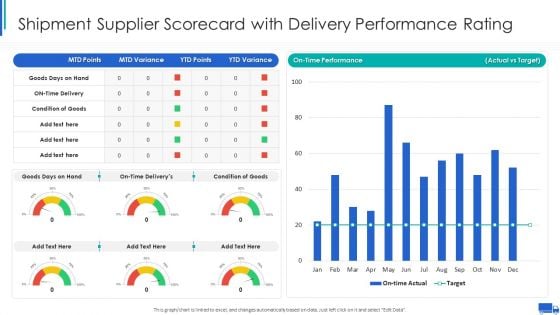
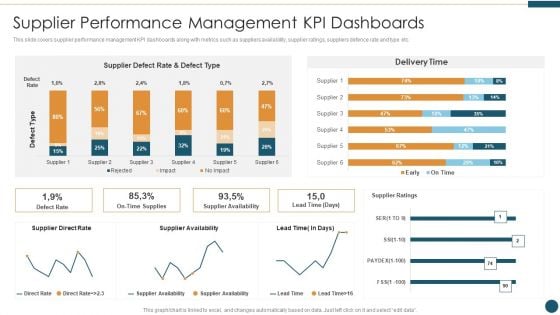
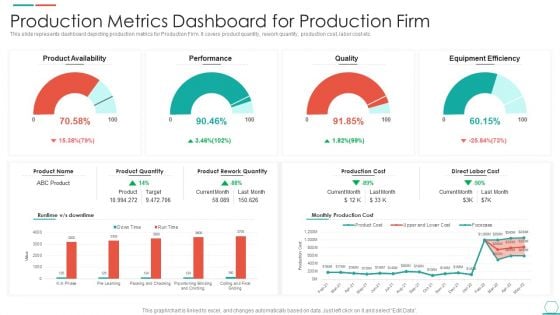
Finance
-
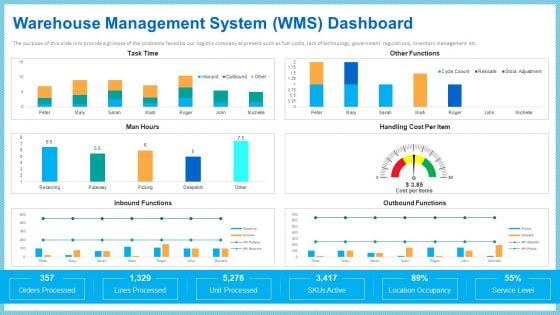
Warehouse Management System Functions Structure PDF
The purpose of this slide is to provide a glimpse of the problems faced by our logistic company at present such as fuel costs, lack of technology, government regulations, inventory management etc. Deliver an awe inspiring pitch with this creative warehouse management system functions structure pdf bundle. Topics like warehouse management system wms dashboard can be discussed with this completely editable template. It is available for immediate download depending on the needs and requirements of the user.
-
Analyzing And Deploying HR Analytics System In Enterprise Ppt PowerPoint Presentation Complete Deck With Slides
This fiften slide Analyzing And Deploying HR Analytics System In Enterprise Ppt PowerPoint Presentation Complete Deck With Slides is your content ready tool to impress the stakeholders with your business planning and its manner of execution. Showcase your ideas and how you plan to make them real in detail with this PPT Template Bundle. The slides have the conceptual bandwidth to present the crucial aspects of your plan, such as funding, marketing, resource allocation, timeline, roadmap, and more. When you present your plans with this PPT Layout, the stakeholders are sure to come on board because you will be able to present a succinct, thought-out, winning project. Download this Complete Deck now to take control into your hands. The 100 percent customizable offer is just too good to be resisted.
-
Lead Generation Dashboard For Tracking Conversion Rates Improving Lead Generation Process Background PDF
This slide covers the KPI dashboard for tracking lead conversion rates. It includes metrics such as visitors, average session rate, per visit, bounce rate, page views, etc. Slidegeeks has constructed Lead Generation Dashboard For Tracking Conversion Rates Improving Lead Generation Process Background PDF after conducting extensive research and examination. These presentation templates are constantly being generated and modified based on user preferences and critiques from editors. Here, you will find the most attractive templates for a range of purposes while taking into account ratings and remarks from users regarding the content. This is an excellent jumping off point to explore our content and will give new users an insight into our top notch PowerPoint Templates.
-
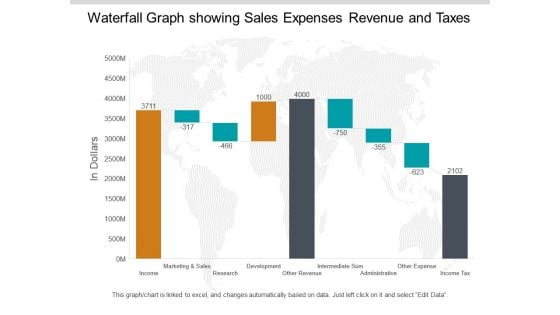
Waterfall Graph Showing Sales Expenses Revenue And Taxes Ppt PowerPoint Presentation Pictures Summary
This is a waterfall graph showing sales expenses revenue and taxes ppt powerpoint presentation pictures summary. This is a three stage process. The stages in this process are profit and loss, balance sheet, income statement, benefit and loss.
-
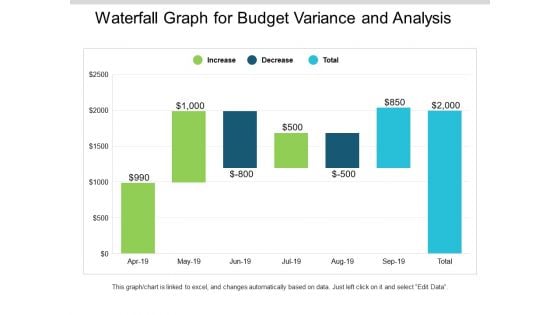
Waterfall Graph For Budget Variance And Analysis Ppt PowerPoint Presentation Slides Mockup
This is a waterfall graph for budget variance and analysis ppt powerpoint presentation slides mockup. This is a three stage process. The stages in this process are profit and loss, balance sheet, income statement, benefit and loss.
-
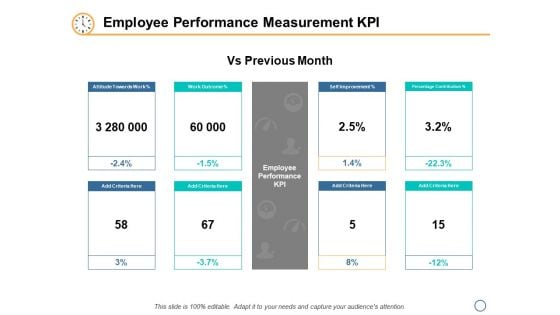
Employee Performance Measurement KPI Ppt PowerPoint Presentation Inspiration Influencers
This is a employee performance measurement kpi ppt powerpoint presentation inspiration influencers. This is a eight stage process. The stages in this process are finance, analysis, business, investment, marketing.
-
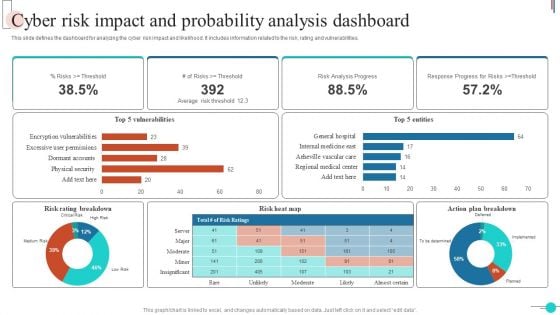
Cyber Risk Impact And Probability Analysis Dashboard Brochure PDF
This slide defines the dashboard for analyzing the cyber risk impact and likelihood. It includes information related to the risk, rating and vulnerabilities. Showcasing this set of slides titled Cyber Risk Impact And Probability Analysis Dashboard Brochure PDF. The topics addressed in these templates are Risk Heat Map, Risk Rating Breakdown, Vulnerabilities. All the content presented in this PPT design is completely editable. Download it and make adjustments in color, background, font etc. as per your unique business setting.
-
Four Positioning Strategies In Marketing Powerpoint Slides
This PowerPoint template has been designed with linear circles with finance icons. This PPT slide can be used to display four positioning strategies in marketing. You can download finance PowerPoint template to prepare awesome presentations.
-
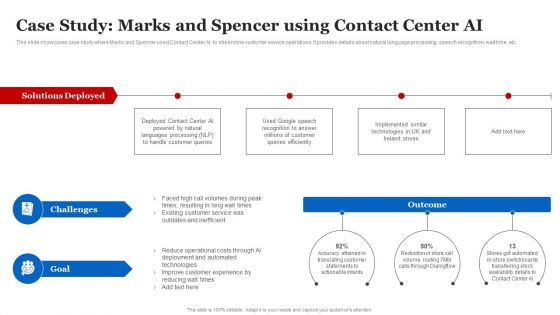
Case Study Marks And Spencer Using Contact Center AI Summary PDF
This slide showcases case study where Marks and Spencer used Contact Center AI to streamline customer service operations. It provides details about natural language processing, speech recognition, wait time, etc. Do you have to make sure that everyone on your team knows about any specific topic I yes, then you should give Case Study Marks And Spencer Using Contact Center AI Summary PDF a try. Our experts have put a lot of knowledge and effort into creating this impeccable Case Study Marks And Spencer Using Contact Center AI Summary PDF. You can use this template for your upcoming presentations, as the slides are perfect to represent even the tiniest detail. You can download these templates from the Slidegeeks website and these are easy to edit. So grab these today
-
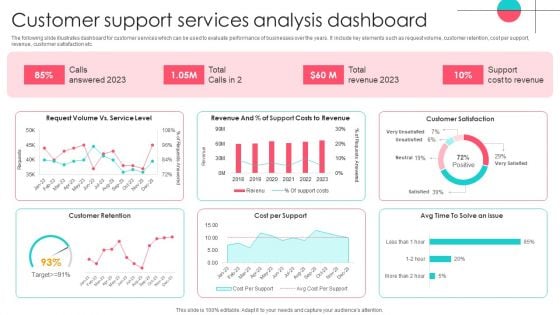
Customer Support Services Analysis Dashboard Template PDF
The following slide illustrates dashboard for customer services which can be used to evaluate performance of businesses over the years. It include key elements such as request volume, customer retention, cost per support, revenue, customer satisfaction etc. Showcasing this set of slides titled Customer Support Services Analysis Dashboard Template PDF. The topics addressed in these templates are Customer Support Services, Analysis Dashboard. All the content presented in this PPT design is completely editable. Download it and make adjustments in color, background, font etc. as per your unique business setting.
-
Financial Services Analysist Program Icon Elements PDF
Presenting Financial Services Analysist Program Icon Elements PDF to dispense important information. This template comprises three stages. It also presents valuable insights into the topics including Financial Services, Analysist Program Icon. This is a completely customizable PowerPoint theme that can be put to use immediately. So, download it and address the topic impactfully.
-
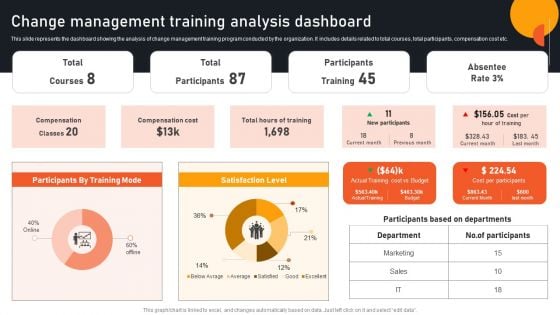
Transform Management Instruction Schedule Change Management Training Analysis Pictures PDF
This slide represents the dashboard showing the analysis of change management training program conducted by the organization. It includes details related to total courses, total participants, compensation cost etc. Coming up with a presentation necessitates that the majority of the effort goes into the content and the message you intend to convey. The visuals of a PowerPoint presentation can only be effective if it supplements and supports the story that is being told. Keeping this in mind our experts created Transform Management Instruction Schedule Change Management Training Analysis Pictures PDF to reduce the time that goes into designing the presentation. This way, you can concentrate on the message while our designers take care of providing you with the right template for the situation.
-
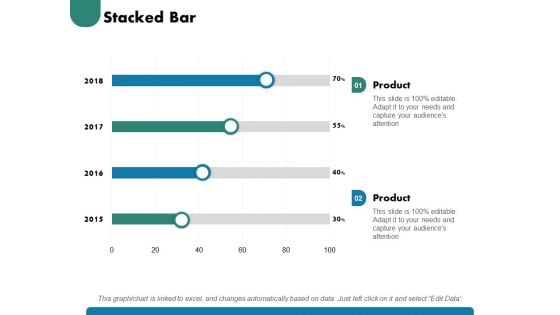
Stacked Bar Ppt PowerPoint Presentation Slides Demonstration
This is a stacked bar ppt powerpoint presentation slides demonstration. This is a two stage process. The stages in this process are stacked bar, finance, marketing, management, investment, analysis.
-
Capability Development Ppt PowerPoint Presentation Complete Deck With Slides
This is a capability development ppt powerpoint presentation complete deck with slides. This is a one stage process. The stages in this process are capability development, marketing, business, management, strategy.
-
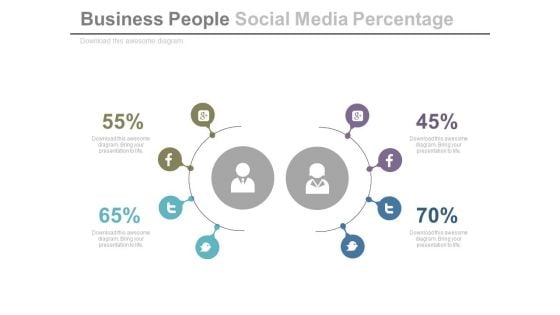
Ratio Of Social Media Users Powerpoint Slides
This PowerPoint template contains diagram of social media icons with percentage ratios. You may download this PPT slide design to display ratio of social media users. You can easily customize this template to make it more unique as per your need.
-
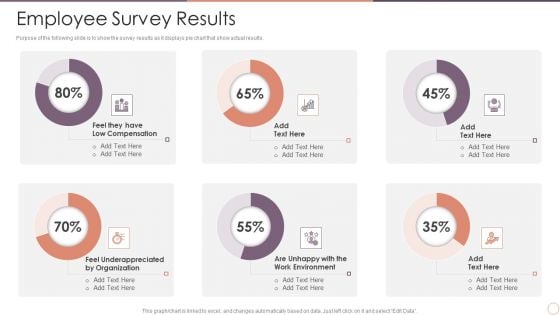
Managing Employee Turnover Employee Survey Results Microsoft PDF
Purpose of the following slide is to show the survey results as it displays pie chart that show actual results. Deliver an awe inspiring pitch with this creative Managing Employee Turnover Employee Survey Results Microsoft PDF bundle. Topics like Low Compensation, Underappreciated, Work Environment can be discussed with this completely editable template. It is available for immediate download depending on the needs and requirements of the user.
-
Managing Employee Turnover Dashboard For Employee Retention Polices Ideas PDF
Purpose of the following slide is to show the Employee Attrition dashboard as it highlights the Employee turnover rate, average seniority of employees in months, year-over-year turnover rate etc.Deliver an awe inspiring pitch with this creative Managing Employee Turnover Dashboard For Employee Retention Polices Ideas PDF bundle. Topics like Turnover Rate, Employees These, Actual Seniority can be discussed with this completely editable template. It is available for immediate download depending on the needs and requirements of the user.
-
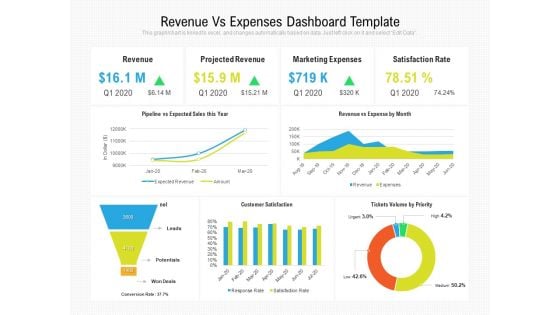
Revenue Vs Expenses Dashboard Template Ppt PowerPoint Presentation Slides Tips PDF
Presenting this set of slides with name revenue vs expenses dashboard template ppt powerpoint presentation slides tips pdf. The topics discussed in these slides are revenue, projected revenue, marketing expenses, satisfaction rate, pipeline vs expected sales this year, revenue vs expense by month, customer satisfaction, tickets volume by priority. This is a completely editable PowerPoint presentation and is available for immediate download. Download now and impress your audience.
-
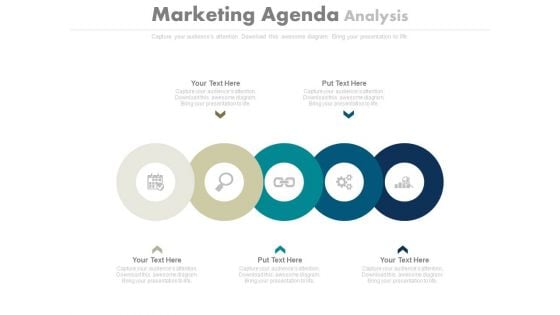
Circles For Marketing Agenda Analysis Powerpoint Slides
This PowerPoint template contains five circles in linear flow with icons. You may download this slide to display marketing agenda analysis. You can easily customize this template to make it more unique as per your need.
-
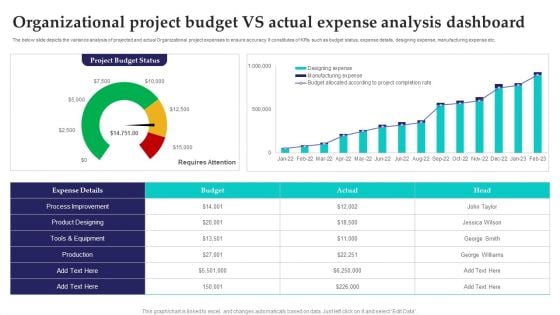
Organizational Project Budget Vs Actual Expense Analysis Dashboard Sample PDF
Showcasing this set of slides titled Organizational Project Budget Vs Actual Expense Analysis Dashboard Sample PDF. The topics addressed in these templates are Process Improvement, Equipment, Budget. All the content presented in this PPT design is completely editable. Download it and make adjustments in color, background, font etc. as per your unique business setting.
-
Economies Of Scale Powerpoint Presentation Templates
This is an economies of scale powerpoint presentation templates. This is a five stage process. The stages in this process are economies of scale, economies of scale, capital requirements, product differentiation, access to distribution channels.
-
Project Tracking Issue Tracker Dashboard Rules PDF
The following slide highlights the project tracking issues in project management to determine and resolve them quickly. It includes metrics such as issue summary, priorities, responsible head, reporting and closing date etc. Showcasing this set of slides titled Project Tracking Issue Tracker Dashboard Rules PDF. The topics addressed in these templates are Inappropriate Supplies, Project, Tracker Dashboard. All the content presented in this PPT design is completely editable. Download it and make adjustments in color, background, font etc. as per your unique business setting.
-
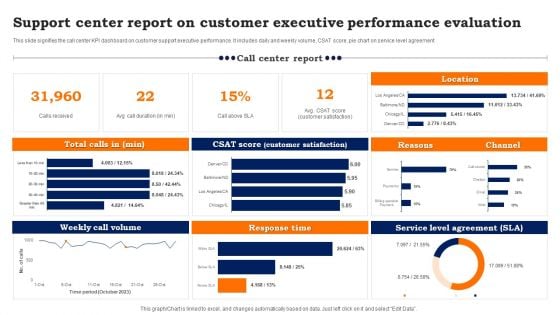
Support Center Report On Customer Executive Performance Evaluation Background PDF
This slide signifies the call center KPI dashboard on customer support executive performance. It includes daily and weekly volume, CSAT score, pie chart on service level agreement. Pitch your topic with ease and precision using this Support Center Report On Customer Executive Performance Evaluation Background PDF. This layout presents information on Weekly Call Volume, Response Time, Service Level Agreement. It is also available for immediate download and adjustment. So, changes can be made in the color, design, graphics or any other component to create a unique layout.
-
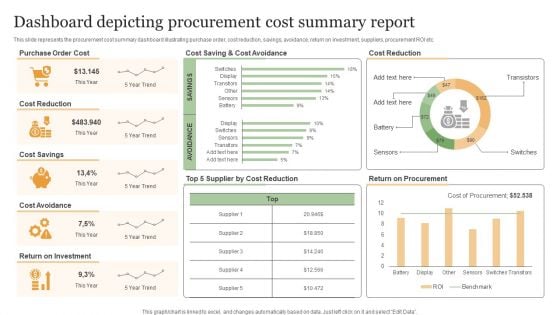
Dashboard Depicting Procurement Cost Summary Report Microsoft PDF
This slide represents the procurement cost summary dashboard illustrating purchase order, cost reduction, savings, avoidance, return on investment, suppliers, procurement ROI etc. Pitch your topic with ease and precision using this Dashboard Depicting Procurement Cost Summary Report Microsoft PDF. This layout presents information on Purchase Order Cost, Cost Reduction, Cost Savings. It is also available for immediate download and adjustment. So, changes can be made in the color, design, graphics or any other component to create a unique layout.
-
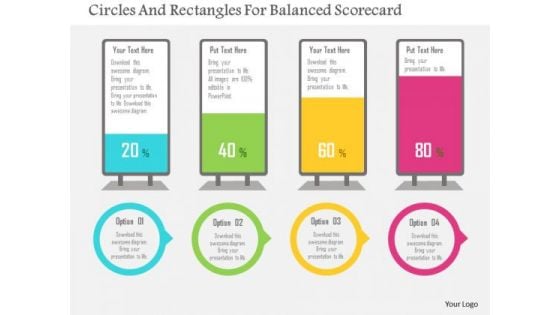
Business Diagram Circles And Rectangles For Balanced Scorecard Presentation Template
This business slide displays diagram of circles and rectangles. It helps to depict workflow or a process. This diagram offers a way for your audience to visually conceptualize the process.
-
Hr Dashboard Template 2 Ppt PowerPoint Presentation Microsoft
This is a hr dashboard template 2 ppt powerpoint presentation microsoft. This is a four stage process. The stages in this process are open positions by divisions, key metrics, total employees, employee churn.
-
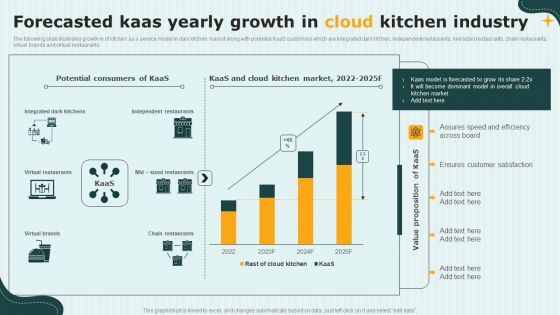
International Cloud Kitchen Industry Analysis Forecasted Kaas Yearly Growth In Cloud Kitchen Industry Slides PDF
The following slide illustrates growth in of kitchen as a service model in dark kitchen market along with potential KaaS customers which are integrated dark kitchen, independent restaurants, mid sized restaurants, chain restaurants, virtual brands and virtual restaurants. Coming up with a presentation necessitates that the majority of the effort goes into the content and the message you intend to convey. The visuals of a PowerPoint presentation can only be effective if it supplements and supports the story that is being told. Keeping this in mind our experts created International Cloud Kitchen Industry Analysis Forecasted Kaas Yearly Growth In Cloud Kitchen Industry Slides PDF to reduce the time that goes into designing the presentation. This way, you can concentrate on the message while our designers take care of providing you with the right template for the situation.
-
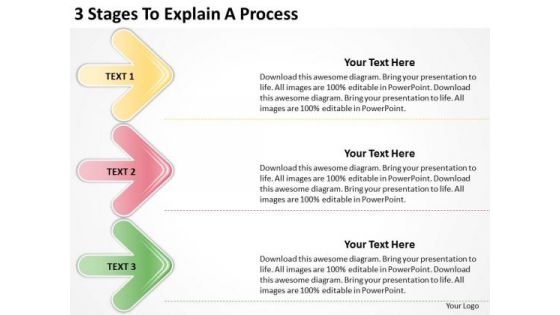
3 Stages To Explain Process Starting Small Business PowerPoint Slides
We present our 3 stages to explain process starting small business PowerPoint Slides.Present our Finance PowerPoint Templates because Our PowerPoint Templates and Slides team portray an attitude of elegance. Personify this quality by using them regularly. Use our Arrows PowerPoint Templates because You can Inspire your team with our PowerPoint Templates and Slides. Let the force of your ideas flow into their minds. Use our Business PowerPoint Templates because You canTake a leap off the starting blocks with our PowerPoint Templates and Slides. They will put you ahead of the competition in quick time. Download our Process and Flows PowerPoint Templates because Our PowerPoint Templates and Slides will give good value for money. They also have respect for the value of your time. Download our Success PowerPoint Templates because You should Bet on your luck with our PowerPoint Templates and Slides. Be assured that you will hit the jackpot.Use these PowerPoint slides for presentations relating to 3d, Arrow, Banner, Business, Business Concept, Chart, Description, Development, Diagram, Direction, Element, Empty, Financial, Flow, Flowchart, Future, Gradient, Graph, Graphic, Illustration, Isolated, Mirrored, Object, Placeholder, Presentation, Process, Section, Segment, Set, Shape, Sign, Steps, Symbol, Template, Topic, Vector. The prominent colors used in the PowerPoint template are Pink, Green, Yellow. Presenters tell us our 3 stages to explain process starting small business PowerPoint Slides are incredible easy to use. We assure you our Concept PowerPoint templates and PPT Slides provide you with a vast range of viable options. Select the appropriate ones and just fill in your text. Professionals tell us our 3 stages to explain process starting small business PowerPoint Slides are second to none. We assure you our Business PowerPoint templates and PPT Slides are aesthetically designed to attract attention. We guarantee that they will grab all the eyeballs you need. People tell us our 3 stages to explain process starting small business PowerPoint Slides are aesthetically designed to attract attention. We guarantee that they will grab all the eyeballs you need. The feedback we get is that our Development PowerPoint templates and PPT Slides will save the presenter time.
-
Some Quick Facts Ppt PowerPoint Presentation Layouts Icons
This is a some quick facts ppt powerpoint presentation layouts icons. This is a three stage process. The stages in this process are customers, sales growth, staff work weekly.
-
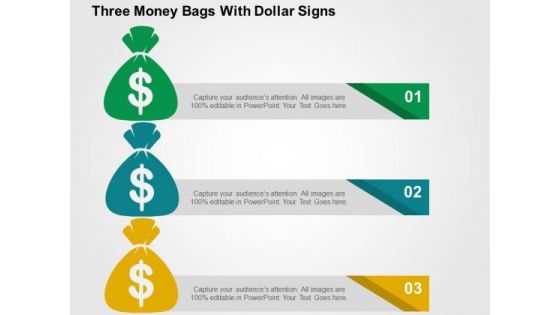
Three Money Bags With Dollar Signs PowerPoint Templates
This unique template displays diagram of three money bags with dollar symbol. This professional slide helps to represent financial planning and execution. This graphic slide is an effective tool to make your clients understand the topic.
-
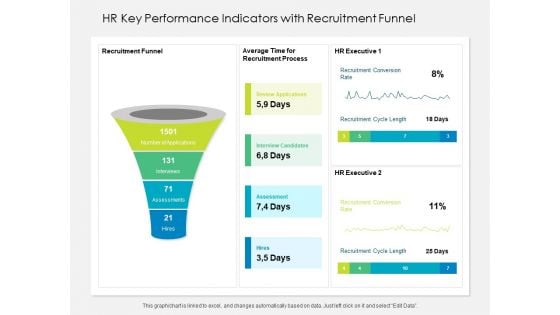
HR Key Performance Indicators With Recruitment Funnel Ppt PowerPoint Presentation File Formats PDF
Presenting this set of slides with name hr key performance indicators with recruitment funnel ppt powerpoint presentation file formats pdf. The topics discussed in these slides are funnel, process, recruitment. This is a completely editable PowerPoint presentation and is available for immediate download. Download now and impress your audience.
-
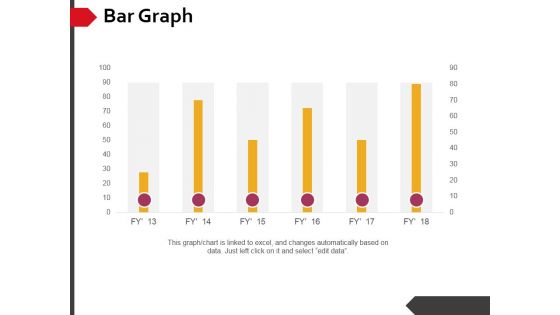
Bar Graph Ppt PowerPoint Presentation Professional Clipart
This is a bar graph ppt powerpoint presentation professional clipart. This is a six stage process. The stages in this process are bar graph, finance, marketing, strategy, business.
-
Human Resource Annual Report With Headcount Ppt PowerPoint Presentation Icon Influencers PDF
Presenting this set of slides with name human resource annual report with headcount ppt powerpoint presentation icon influencers pdf. The topics discussed in these slides are starters, headcount, leavers, promotions, male, female, 2019 to 2020. This is a completely editable PowerPoint presentation and is available for immediate download. Download now and impress your audience.
-
Financial Investigation Ppt PowerPoint Presentation Complete Deck With Slides
This is a financial investigation ppt powerpoint presentation complete deck with slides. This is a one stage process. The stages in this process are finance, analysis, invest, planning, marketing.
-
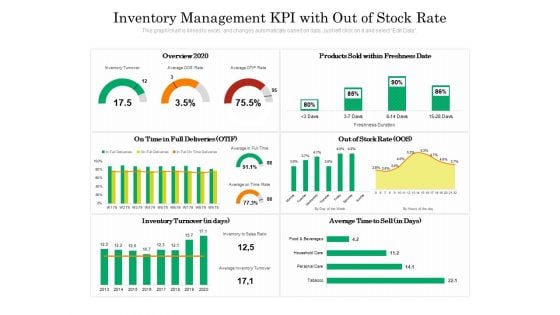
Inventory Management KPI With Out Of Stock Rate Ppt PowerPoint Presentation Gallery Background PDF
Presenting this set of slides with name inventory management kpi with out of stock rate ppt powerpoint presentation gallery background pdf. The topics discussed in these slides are inventor, average, deliveries. This is a completely editable PowerPoint presentation and is available for immediate download. Download now and impress your audience.
-
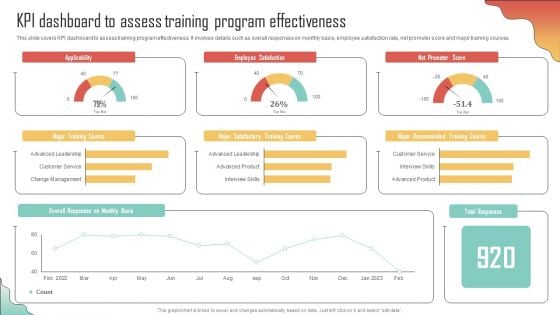
KPI Dashboard Assess Training Program Effectiveness Enhancing Organization Productivity By Implementing Graphics PDF
This slide covers KPI dashboard to assess training program effectiveness. It involves details such as overall responses on monthly basis, employee satisfaction rate, net promoter score and major training courses. If you are looking for a format to display your unique thoughts, then the professionally designed KPI Dashboard Assess Training Program Effectiveness Enhancing Organization Productivity By Implementing Graphics PDF is the one for you. You can use it as a Google Slides template or a PowerPoint template. Incorporate impressive visuals, symbols, images, and other charts. Modify or reorganize the text boxes as you desire. Experiment with shade schemes and font pairings. Alter, share or cooperate with other people on your work. Download KPI Dashboard Assess Training Program Effectiveness Enhancing Organization Productivity By Implementing Graphics PDF and find out how to give a successful presentation. Present a perfect display to your team and make your presentation unforgettable.
-
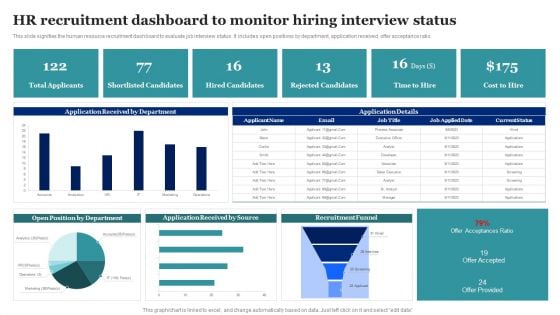
Human Resource Metrics Dashboard Ppt PowerPoint Presentation Layouts Icons PDF
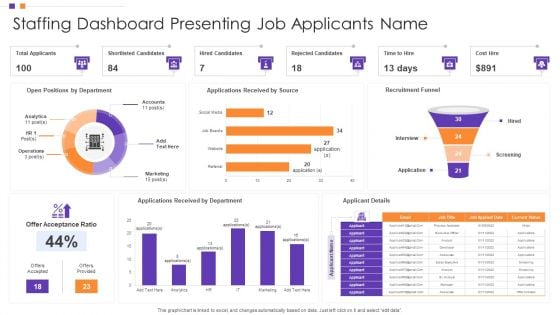
Presenting this set of slides with name human resource metrics dashboard ppt powerpoint presentation layouts icons pdf. The topics discussed in these slide is total applicants, shortlisted candidates, hired candidates, rejected candidates, time to hire, cost to hire. This is a completely editable PowerPoint presentation and is available for immediate download. Download now and impress your audience.
-
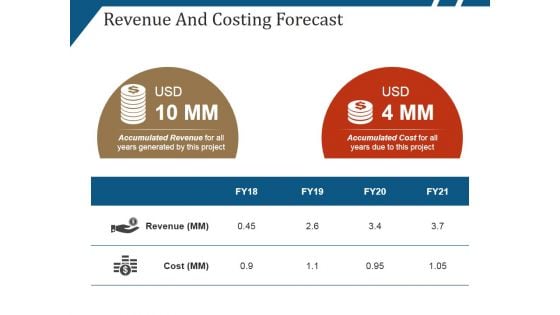
Revenue And Costing Forecast Ppt PowerPoint Presentation Gallery Slides
This is a revenue and costing forecast ppt powerpoint presentation gallery slides. This is a two stage process. The stages in this process are revenue, cost, dollar, symbol.
-
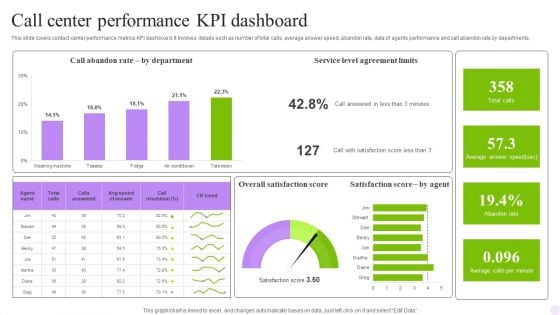
Call Center Performance KPI Dashboard Formats PDF
This slide covers contact center performance metrics KPI dashboard. It involves details such as number of total calls, average answer speed, abandon rate, data of agents performance and call abandon rate by departments. Showcasing this set of slides titled Call Center Performance KPI Dashboard Formats PDF. The topics addressed in these templates are Department, Dashboard, Agreement Limits. All the content presented in this PPT design is completely editable. Download it and make adjustments in color, background, font etc. as per your unique business setting.
-
Intersecting Arrows With Icons PowerPoint Template
This business slide displays intersecting arrows with icons. This diagram depicts the concept of communication and connection. Use this business diagram to build unique presentations.
-
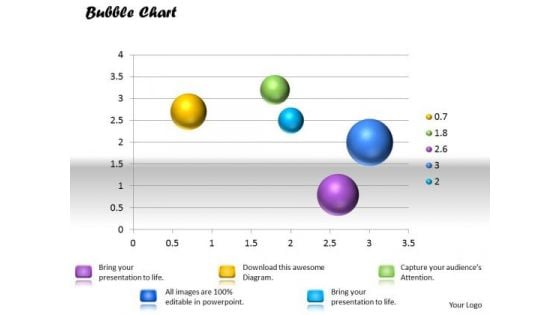
Business Framework PowerPoint Bubble Chart PowerPoint Presentation
This innovative image slide has been designed with graphic of bubble chart to depict any information which requires visual presentation. This image slide is 100% editable. You may change color, size and orientation of any icon to your liking. This image slide may be used in school, business and social presentations. Make your presentations interesting using this image slide.
-
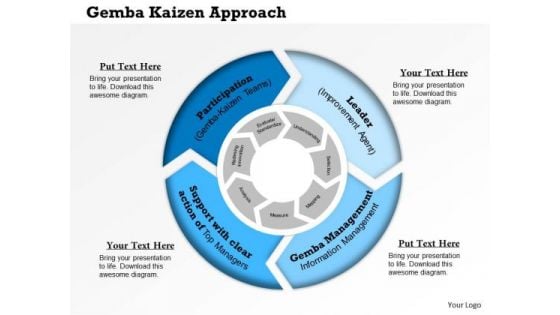
Business Framework Gemba Kaizen Approach PowerPoint Presentation
This image slide has been designed to displays Gemba kaizen common sense low cost approach to management diagram. Use this image slide, in presentations to strategic business management. This image slide will help you make professional presentations.
-
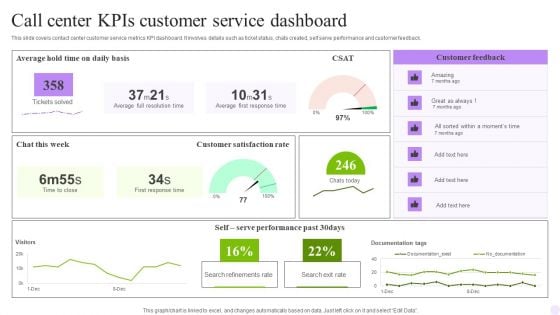
Call Center Kpis Customer Service Dashboard Pictures PDF
This slide covers contact center customer service metrics KPI dashboard. It involves details such as ticket status, chats created, self serve performance and customer feedback. Pitch your topic with ease and precision using this Call Center Kpis Customer Service Dashboard Pictures PDF. This layout presents information on Response Time, Customer, Dashboard. It is also available for immediate download and adjustment. So, changes can be made in the color, design, graphics or any other component to create a unique layout.
-
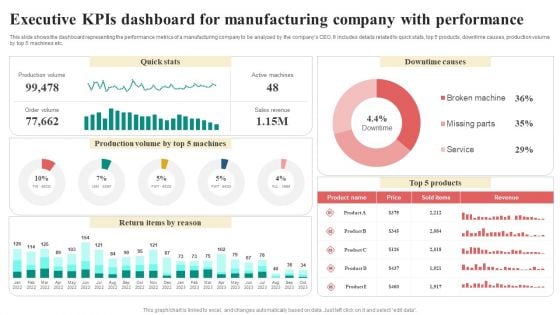
Executive Kpis Dashboard For Manufacturing Company With Performance Infographics PDF
This slide shows the dashboard representing the performance metrics of a manufacturing company to be analyzed by the companys CEO. It includes details related to quick stats, top 5 products, downtime causes, production volume by top 5 machines etc. Showcasing this set of slides titled Executive Kpis Dashboard For Manufacturing Company With Performance Infographics PDF. The topics addressed in these templates are Return Items By Reason, Quick Stats, Downtime Causes, Revenue. All the content presented in this PPT design is completely editable. Download it and make adjustments in color, background, font etc. as per your unique business setting.
-
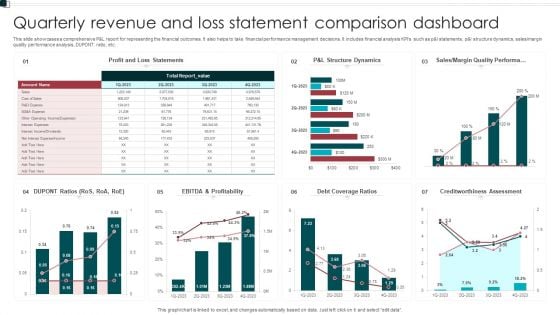
Quarterly Revenue And Loss Statement Comparison Dashboard Portrait PDF
This slide showcases a comprehensive P and L report for representing the financial outcomes. It also helps to take financial performance management decisions. It includes financial analysis KPIs such as p and l statements, p and l structure dynamics, sales or margin quality performance analysis, DUPONT ratio, etc. Showcasing this set of slides titled Quarterly Revenue And Loss Statement Comparison Dashboard Portrait PDF. The topics addressed in these templates are Profitability, Debt Coverage Ratios, Margin Quality Performa. All the content presented in this PPT design is completely editable. Download it and make adjustments in color, background, font etc. as per your unique business setting.
-
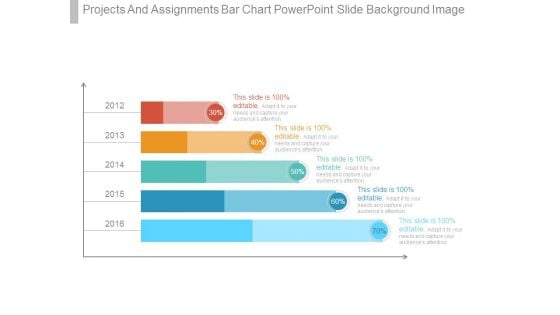
Projects And Assignments Bar Chart Powerpoint Slide Background Image
This is a projects and assignments bar chart powerpoint slide background image. This is a five stage process. The stages in this process are finance, presentation, business, strategy, marketing.
-
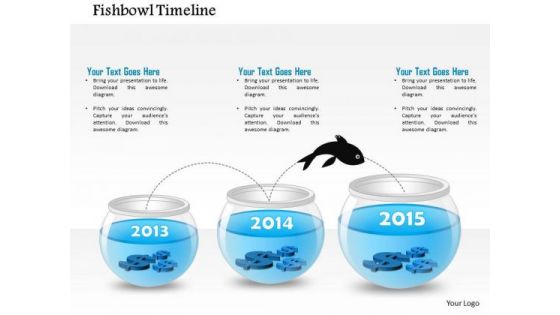
Business Diagram Three Staged Fish Bowl Diagram For 2013 To 2015 Year Text Presentation Template
This business slide depicts six staged spiral diagram. This diagram provides an effective way of displaying information you can edit text, color, shade and style as per you need. Present your views using this innovative slide and be assured of leaving a lasting impression.
-
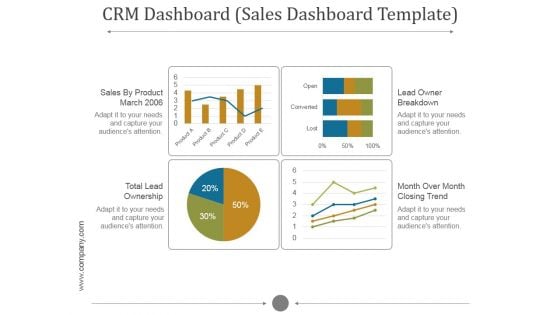
Crm Dashboard Sales Dashboard Template Ppt PowerPoint Presentation Inspiration
This is a crm dashboard sales dashboard template ppt powerpoint presentation inspiration. This is a five stage process. The stages in this process are sales by product march, lead owner breakdown, total lead ownership, month over month closing trend.
-
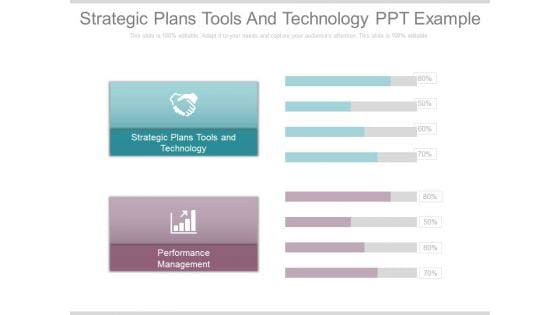
Strategic Plans Tools And Technology Ppt Example
This is a strategic plans tools and technology ppt example. This is a two stage process. The stages in this process are technology, business, finance, marketing.
-
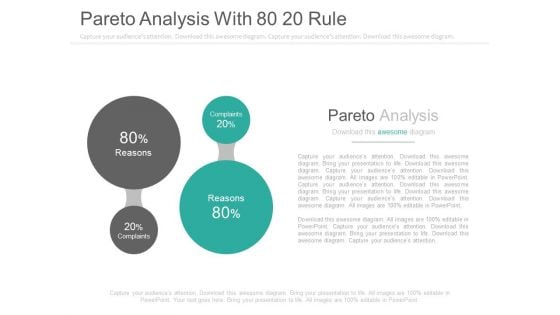
Pareto Analysis With 80 20 Rule Ppt Slides
This is a pareto analysis with 80 20 rule ppt slides. This is a two stage process. The stages in this process are finance, business.\n\n
-
Real Estate Sales Strategy Ppt PowerPoint Presentation Complete Deck With Slides
This is a real estate sales strategy ppt powerpoint presentation complete deck with slides. This is a one stage process. The stages in this process are business, marketing, finance, sales strategy, planning.
-
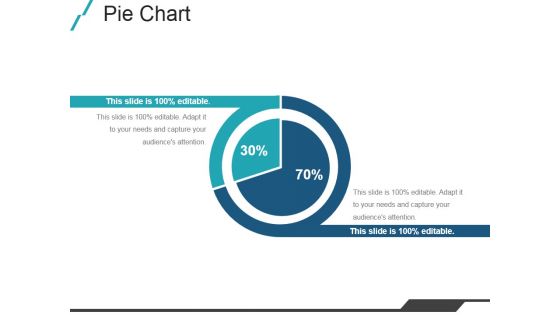
Pie Chart Ppt PowerPoint Presentation Design Templates
This is a pie chart ppt powerpoint presentation design templates. This is a two stage process. The stages in this process are pie chart, finance, business, marketing, percentage.
-
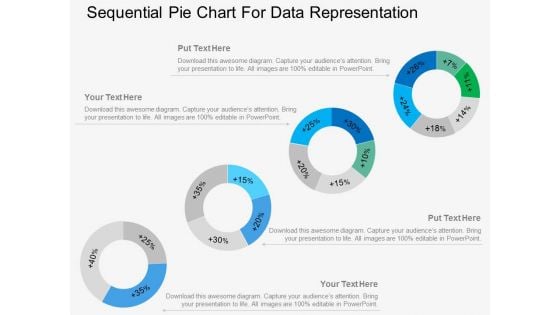
Four Sequential Pie Charts For Data Representation Powerpoint Template
Our above PowerPoint template displays infographic diagram of sequential pie chart. This diagram slide may be used for data representation in visual manner. Above slide provide ideal backdrop to make business presentations.
-
Curve Line Diagram With Icons Powerpoint Template
Our above slide contains diagram of curve line infographic. This infographic slide helps to exhibit business analysis. Use this diagram to impart more clarity to data and to create more sound impact on viewers.
-
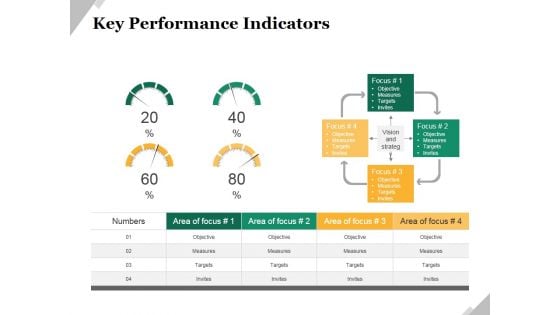
Key Performance Indicators Template 2 Ppt PowerPoint Presentation Model Example
This is a key performance indicators template 2 ppt powerpoint presentation model example. This is a four stage process. The stages in this process are objective, measures, targets, invites, indicators.
-
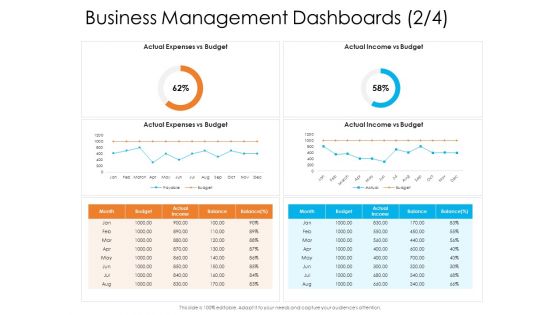
Enterprise Governance Business Management Dashboards Mar Download PDF
Deliver and pitch your topic in the best possible manner with this enterprise governance business management dashboards mar download pdf. Use them to share invaluable insights on actual expenses vs budget, actual income vs budget and impress your audience. This template can be altered and modified as per your expectations. So, grab it now.
-
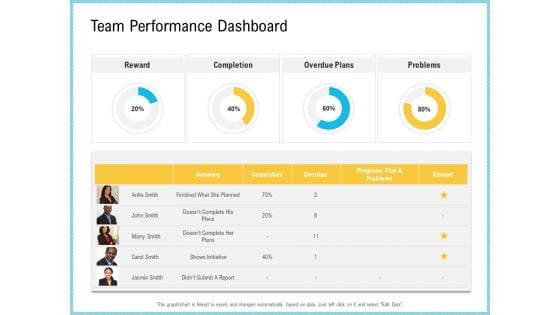
Team Collaboration Of Project Management Team Performance Dashboard Inspiration PDF
Deliver an awe-inspiring pitch with this creative team collaboration of project management team performance dashboard inspiration pdf bundle. Topics like completion, overdue plans, completion, progress, reward can be discussed with this completely editable template. It is available for immediate download depending on the needs and requirements of the user.
-
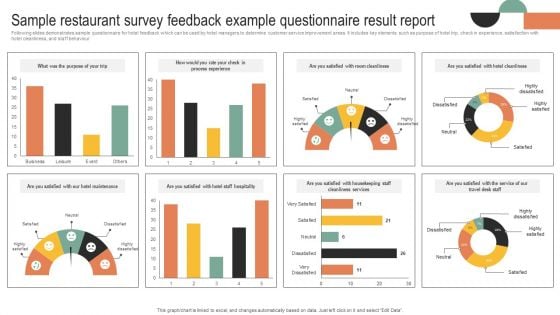
Sample Restaurant Survey Feedback Example Questionnaire Result Report Survey SS
Following slides demonstrates sample questionnaire for hotel feedback which can be used by hotel managers to determine customer service improvement areas. It includes key elements such as purpose of hotel trip, check in experience, satisfaction with hotel cleanliness, and staff behaviour. Pitch your topic with ease and precision using this Sample Restaurant Survey Feedback Example Questionnaire Result Report Survey SS. This layout presents information on Maintenance, Staff Hospitality, Cleanliness Services . It is also available for immediate download and adjustment. So, changes can be made in the color, design, graphics or any other component to create a unique layout.
-
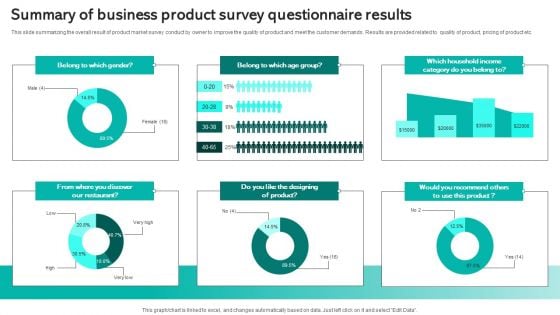
Summary Of Business Product Survey Questionnaire Results Survey SS
This slide summarizing the overall result of product market survey conduct by owner to improve the quality of product and meet the customer demands . Results are provided related to quality of product, pricing of product etc. Pitch your topic with ease and precision using this Summary Of Business Product Survey Questionnaire Results Survey SS. This layout presents information on Summary Of Business, Product Survey, Questionnaire Results. It is also available for immediate download and adjustment. So, changes can be made in the color, design, graphics or any other component to create a unique layout.
-
Competitors Cost Comparison And Analysis Icon Guidelines PDF
Presenting Competitors Cost Comparison And Analysis Icon Guidelines PDF to dispense important information. This template comprises four stages. It also presents valuable insights into the topics including Competitors Cost Comparison, Analysis Icon. This is a completely customizable PowerPoint theme that can be put to use immediately. So, download it and address the topic impactfully.
-
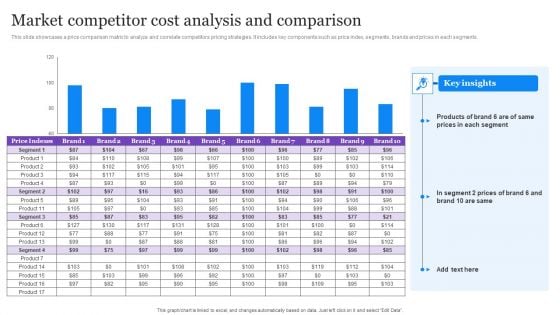
Market Competitor Cost Analysis And Comparison Demonstration PDF
This slide showcases a price comparison matrix to analyze and correlate competitors pricing strategies. It includes key components such as price index, segments, brands and prices in each segments. Showcasing this set of slides titled Market Competitor Cost Analysis And Comparison Demonstration PDF. The topics addressed in these templates are Market Competitor, Cost Analysis And Comparison. All the content presented in this PPT design is completely editable. Download it and make adjustments in color, background, font etc. as per your unique business setting.
-
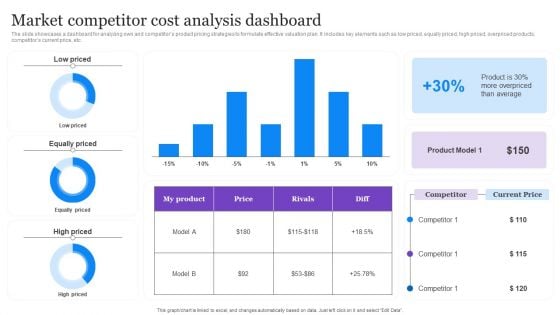
Market Competitor Cost Analysis Dashboard Graphics PDF
The slide showcases a dashboard for analyzing own and competitors product pricing strategies to formulate effective valuation plan. It includes key elements such as low priced, equally priced, high priced, overpriced products, competitors current price, etc. Pitch your topic with ease and precision using this Market Competitor Cost Analysis Dashboard Graphics PDF. This layout presents information on Average, Product Model, Cost Analysis Dashboard. It is also available for immediate download and adjustment. So, changes can be made in the color, design, graphics or any other component to create a unique layout.
-
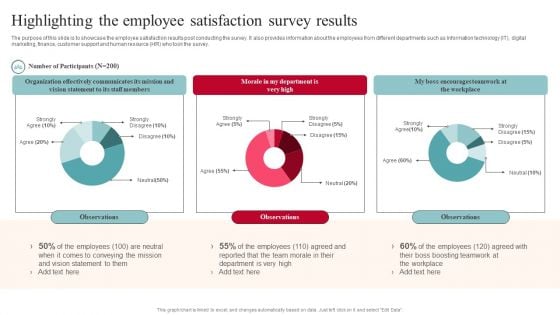
Highlighting The Employee Satisfaction Survey Results Introduction PDF
The purpose of this slide is to showcase the employee satisfaction results post conducting the survey. It also provides information about the employees from different departments such as Information technology IT, digital marketing, finance, customer support and human resource HR who took the survey. Create an editable Highlighting The Employee Satisfaction Survey Results Introduction PDF that communicates your idea and engages your audience. Whether youre presenting a business or an educational presentation, pre designed presentation templates help save time. Highlighting The Employee Satisfaction Survey Results Introduction PDF is highly customizable and very easy to edit, covering many different styles from creative to business presentations. Slidegeeks has creative team members who have crafted amazing templates. So, go and get them without any delay.
-
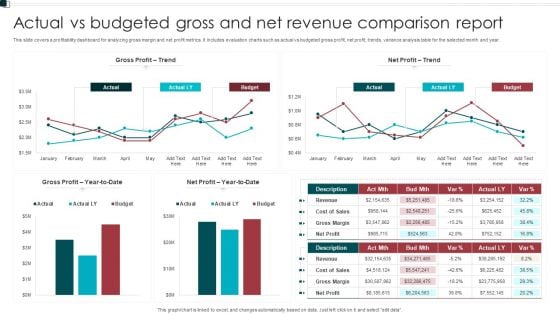
Actual Vs Budgeted Gross And Net Revenue Comparison Report Sample PDF
This slide covers a profitability dashboard for analyzing gross margin and net profit metrics. It includes evaluation charts such as actual vs budgeted gross profit, net profit, trends, variance analysis table for the selected month and year. Pitch your topic with ease and precision using this Actual Vs Budgeted Gross And Net Revenue Comparison Report Sample PDF. This layout presents information on Gross Profit, Net Profit, Budget. It is also available for immediate download and adjustment. So, changes can be made in the color, design, graphics or any other component to create a unique layout.
-
Implementing Cyber Security Incident Cyber Security Systems Monitoring Report Icons PDF
This slide represents the report to effectively monitor the networks and systems of the organization. It includes KPIs such as total intrusion attempts, mean detect team, mean resolve time etc. Present like a pro with Implementing Cyber Security Incident Cyber Security Systems Monitoring Report Icons PDF Create beautiful presentations together with your team, using our easy to use presentation slides. Share your ideas in real time and make changes on the fly by downloading our templates. So whether you are in the office, on the go, or in a remote location, you can stay in sync with your team and present your ideas with confidence. With Slidegeeks presentation got a whole lot easier. Grab these presentations today.
-
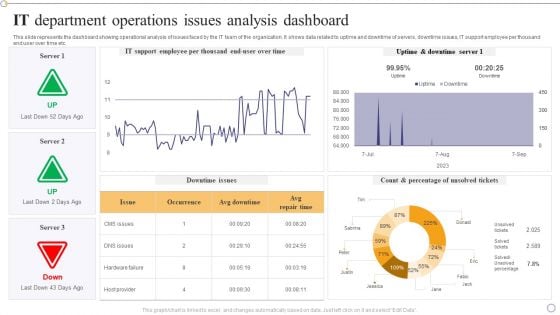
IT Department Operations Issues Analysis Dashboard Designs PDF
This slide represents the dashboard showing operational analysis of issues faced by the IT team of the organization. It shows data related to uptime and downtime of servers, downtime issues, IT support employee per thousand end user over time etc.Pitch your topic with ease and precision using this IT Department Operations Issues Analysis Dashboard Designs PDF. This layout presents information on Support Employee, Uptime Downtime, Percentage Unsolved. It is also available for immediate download and adjustment. So, changes can be made in the color, design, graphics or any other component to create a unique layout.
-
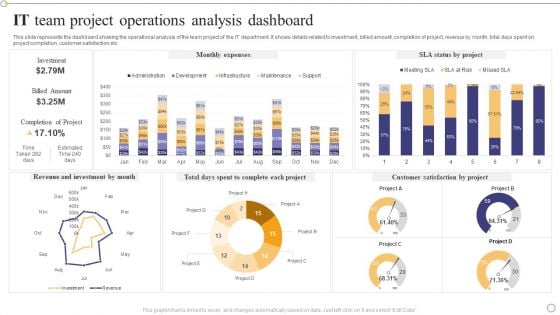
IT Team Project Operations Analysis Dashboard Clipart PDF
This slide represents the dashboard showing the operational analysis of the team project of the IT department. It shows details related to investment, billed amount, completion of project, revenue by month, total days spent on project completion, customer satisfaction etc.Showcasing this set of slides titled IT Team Project Operations Analysis Dashboard Clipart PDF. The topics addressed in these templates are Revenue Investment, Complete Each Project, Customer Satisfaction. All the content presented in this PPT design is completely editable. Download it and make adjustments in color, background, font etc. as per your unique business setting.
-
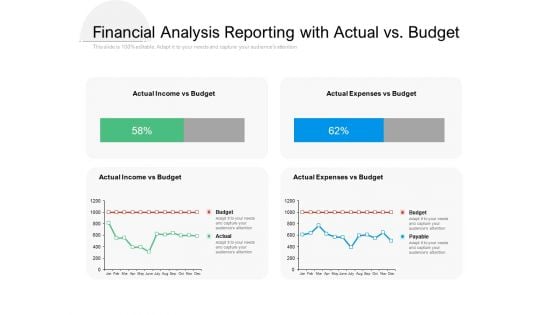
Financial Analysis Reporting With Actual Vs Budget Ppt PowerPoint Presentation Styles Format Ideas
Presenting this set of slides with name financial analysis reporting with actual vs budget ppt powerpoint presentation styles format ideas. The topics discussed in these slides are actual income vs budget, actual expenses vs budget . This is a completely editable PowerPoint presentation and is available for immediate download. Download now and impress your audience.
-
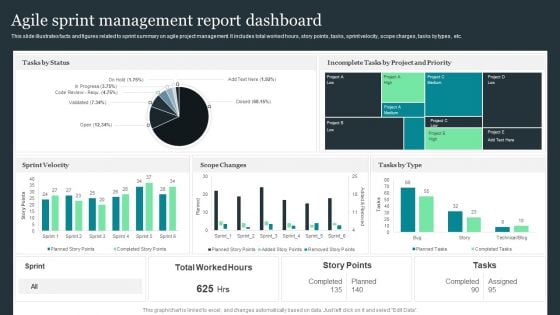
Agile Sprint Management Report Dashboard Pictures PDF
This slide illustrates facts and figures related to sprint summary on agile project management. It includes total worked hours, story points, tasks, sprint velocity, scope charges, tasks by types, etc. Pitch your topic with ease and precision using this Agile Sprint Management Report Dashboard Pictures PDF. This layout presents information on Tasks By Status, Sprint Velocity, Scope Changes. It is also available for immediate download and adjustment. So, changes can be made in the color, design, graphics or any other component to create a unique layout.
-
Performance Assessment Ppt PowerPoint Presentation Complete Deck
Boost your confidence and team morale with this well structured Performance Assessment Ppt PowerPoint Presentation Complete Deck. This prefabricated set gives a voice to your presentation because of its well-researched content and graphics. Our experts have added all the components very carefully, thus helping you deliver great presentations with a single click. Not only that, it contains a set of Twelve slides that are designed using the right visuals, graphics, etc. Various topics can be discussed, and effective brainstorming sessions can be conducted using the wide variety of slides added in this complete deck. Apart from this, our PPT design contains clear instructions to help you restructure your presentations and create multiple variations. The color, format, design anything can be modified as deemed fit by the user. Not only this, it is available for immediate download. So, grab it now.
-
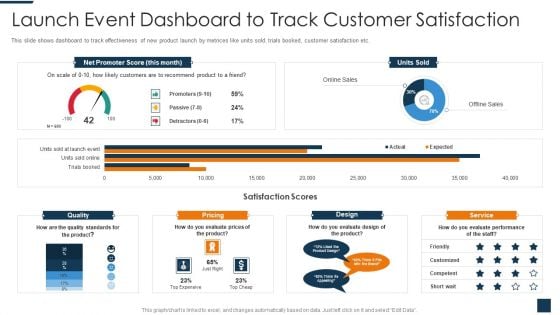
Go To Market Strategy For New Product Launch Event Dashboard To Track Customer Satisfaction Introduction PDF
This slide shows dashboard to track effectiveness of new product launch by metrices like units sold, trials booked, customer satisfaction etc. Deliver and pitch your topic in the best possible manner with this go to market strategy for new product launch event dashboard to track customer satisfaction introduction pdf. Use them to share invaluable insights on net promoter score, units sold, quality, pricing, design, service and impress your audience. This template can be altered and modified as per your expectations. So, grab it now.
-
Improvement Of Safety Performance At Construction Site Kpi Dashboard To Track Safety Program Microsoft PDF
This slide reflects the key performance indicator dashboard to track the performance of safety program. It includes information regarding the total manpower, manhours, unsafe conditions, lost time injuries frequency, injuries severity rate, along with the training hours. Make sure to capture your audiences attention in your business displays with our gratis customizable Improvement Of Safety Performance At Construction Site Kpi Dashboard To Track Safety Program Microsoft PDF. These are great for business strategies, office conferences, capital raising or task suggestions. If you desire to acquire more customers for your tech business and ensure they stay satisfied, create your own sales presentation with these plain slides.
-
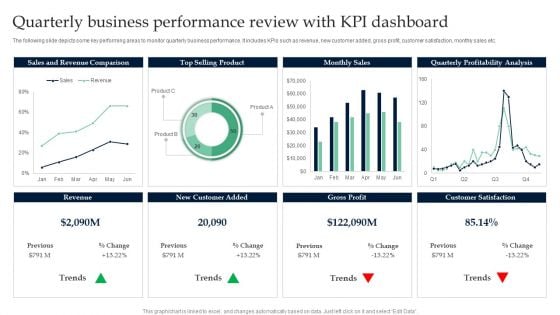
Quarterly Business Performance Review With KPI Dashboard Infographics PDF
Pitch your topic with ease and precision using this Quarterly Business Performance Review With KPI Dashboard Infographics PDF. This layout presents information on Sales And Revenue Comparison, Top Selling Product. It is also available for immediate download and adjustment. So, changes can be made in the color, design, graphics or any other component to create a unique layout.
-
Improvement Of Safety Performance At Construction Site Dashboard To Monitor Construction Mockup PDF
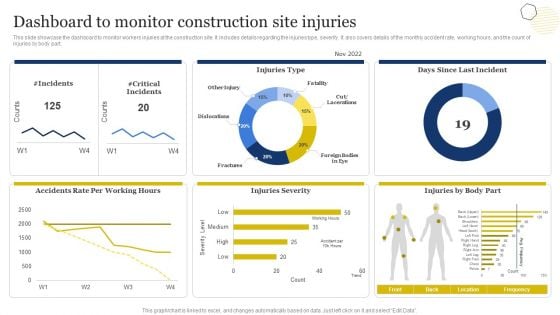
This slide showcase the dashboard to monitor workers injuries at the construction site. It includes details regarding the injuries type, severity. It also covers details of the monthly accident rate, working hours, and the count of injuries by body part. Do you have an important presentation coming up Are you looking for something that will make your presentation stand out from the rest Look no further than Improvement Of Safety Performance At Construction Site Dashboard To Monitor Construction Mockup PDF. With our professional designs, you can trust that your presentation will pop and make delivering it a smooth process. And with Slidegeeks, you can trust that your presentation will be unique and memorable. So why wait Grab Improvement Of Safety Performance At Construction Site Dashboard To Monitor Construction Mockup PDF today and make your presentation stand out from the rest
-
Mobile Device Management Solutions For Employees Ppt PowerPoint Presentation Complete Deck With Slides
You will save yourself your energy and hours of time when you choose to use this impactful PowerPoint Deck. This Mobile Device Management Solutions For Employees Ppt PowerPoint Presentation Complete Deck With Slides has been tailor-made to your business needs which ensures that you will always be prepared for that next meeting. Worry cant touch you when you present in your area of expertise using this PPT Template Bundle. With a modern design and easy to follow structure, this PowerPoint Presentation has sixty one slides, which ensures that you can cover you need to without much work. Create your next presentation using this PPT Theme to deliver a memorable performance.
-
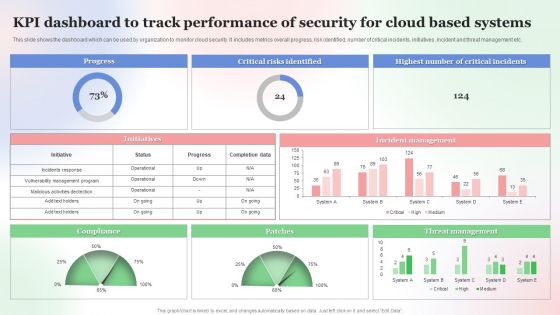
KPI Dashboard To Track Performance Of Security For Cloud Based Systems Clipart PDF
This slide shows the dashboard which can be used by organization to monitor cloud security. It includes metrics overall progress, risk identified, number of critical incidents, initiatives, incident and threat management etc. Showcasing this set of slides titled KPI Dashboard To Track Performance Of Security For Cloud Based Systems Clipart PDF. The topics addressed in these templates are Kpi Dashboard To Track, Performance Of Security, Cloud Based Systems . All the content presented in this PPT design is completely editable. Download it and make adjustments in color, background, font etc. as per your unique business setting.
-
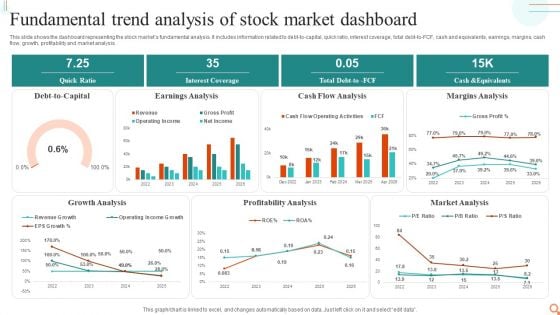
Fundamental Trend Analysis Of Stock Market Dashboard Professional PDF
This slide shows the dashboard representing the stock markets fundamental analysis. It includes information related to debt-to-capital, quick ratio, interest coverage, total debt-to-FCF, cash and equivalents, earnings, margins, cash flow, growth, profitability and market analysis.Showcasing this set of slides titled Fundamental Trend Analysis Of Stock Market Dashboard Professional PDF. The topics addressed in these templates are Earnings Analysis, Cash Flow Analysis, Margins Analysis. All the content presented in this PPT design is completely editable. Download it and make adjustments in color, background, font etc. as per your unique business setting.
-
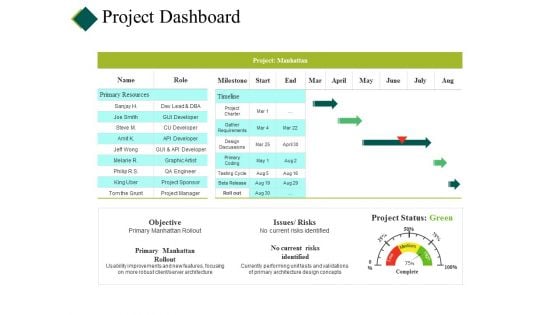
Project Dashboard Ppt PowerPoint Presentation Pictures Backgrounds
This is a project dashboard ppt powerpoint presentation pictures backgrounds. This is a four stage process. The stages in this process are cost, planning, table, project report, data management.
-
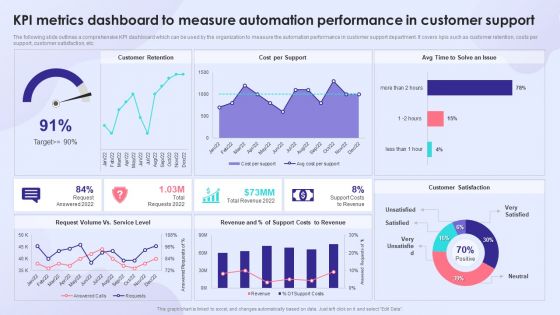
KPI Metrics Dashboard To Measure Automation Performance In Customer Support Professional PDF
The following slide outlines a comprehensive KPI dashboard which can be used by the organization to measure the automation performance in customer support department. It covers kpis such as customer retention, costs per support, customer satisfaction, etc. Deliver and pitch your topic in the best possible manner with this KPI Metrics Dashboard To Measure Automation Performance In Customer Support Professional PDF. Use them to share invaluable insights on Customer Retention, Cost Per Support, Support Costs To Revenue and impress your audience. This template can be altered and modified as per your expectations. So, grab it now.
-
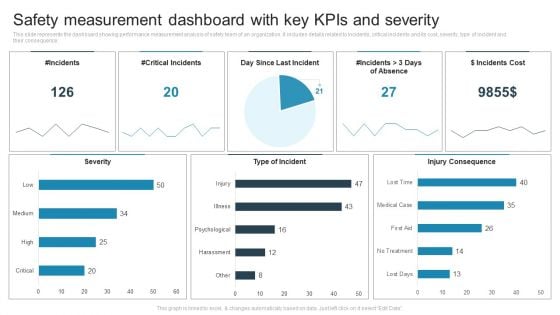
Safety Measurement Dashboard With Key Kpis And Severity Sample PDF
This slide represents the dashboard showing performance measurement analysis of safety team of an organization. It includes details related to incidents, critical incidents and its cost, severity, type of incident and their consequence. Showcasing this set of slides titled Safety Measurement Dashboard With Key Kpis And Severity Sample PDF. The topics addressed in these templates are Incidents, Critical Incidents, Day Since Last Incident. All the content presented in this PPT design is completely editable. Download it and make adjustments in color, background, font etc. as per your unique business setting.
-
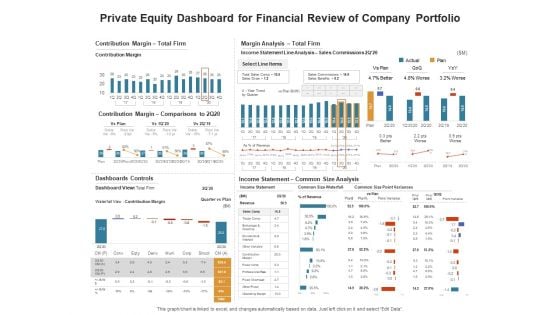
Venture Capitalist Control Board Private Equity Dashboard For Financial Review Of Company Portfolio Plan Elements PDF
Presenting this set of slides with name venture capitalist control board private equity dashboard for financial review of company portfolio plan elements pdf. The topics discussed in these slides are nav performance, key statistics, asset allocation, portfolio company. This is a completely editable PowerPoint presentation and is available for immediate download. Download now and impress your audience.
-
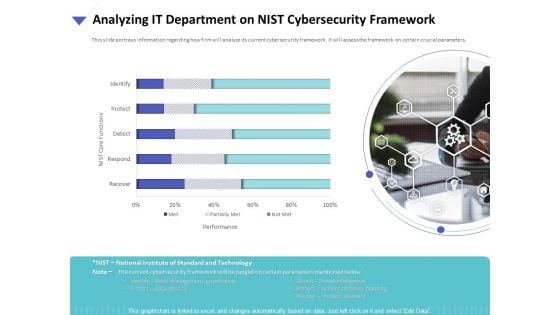
Strategies To Mitigate Cyber Security Risks Analyzing IT Department On NIST Cybersecurity Framework Ppt Slides Background Designs PDF
Presenting this set of slides with name strategies to mitigate cyber security risks analyzing it department on nist cybersecurity framework ppt slides background designs pdf. The topics discussed in these are performance, nist core functions, identify, protect, detect, recover, respond. This is a completely editable PowerPoint presentation and is available for immediate download. Download now and impress your audience.
-
Computer Screen With Cloud Icon Ppt Powerpoint Presentation Infographics Display
This is a computer screen with cloud icon ppt powerpoint presentation infographics display. This is a three stage process. The stages in this process are data visualization icon, data management icon.
-
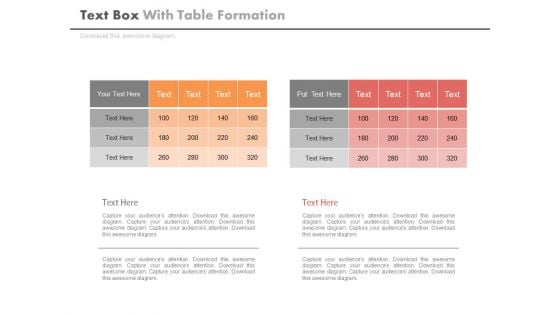
Two Table Charts For Business Data Powerpoint Slides
This PowerPoint template contains two tables chart. You may download this PPT slide to display statistical analysis. You can easily customize this template to make it more unique as per your need.
-
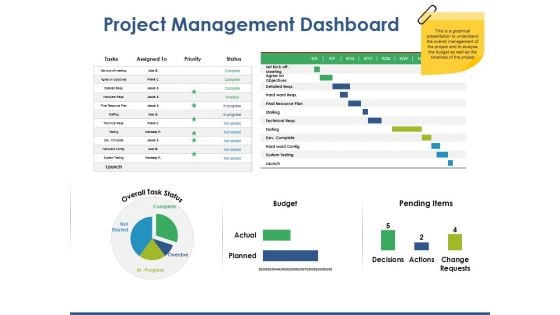
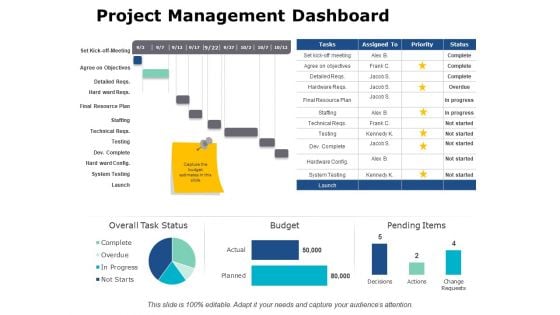
Project Management Dashboard Ppt PowerPoint Presentation Model Outline
This is a project management dashboard ppt powerpoint presentation model outline. This is a three stage process. The stages in this process are finance, business, analysis, marketing, management.
-
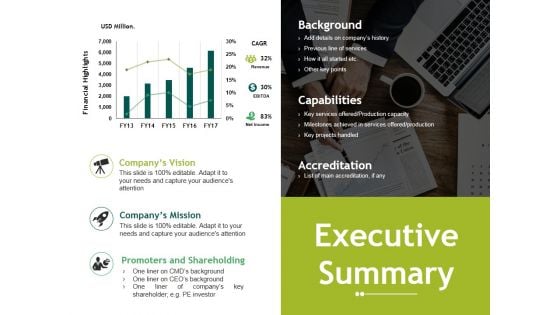
Executive Summary Ppt PowerPoint Presentation Good
This is a executive summary ppt powerpoint presentation good. This is a three stage process. The stages in this process are company s vision, company s mission, promoters and shareholding.
-
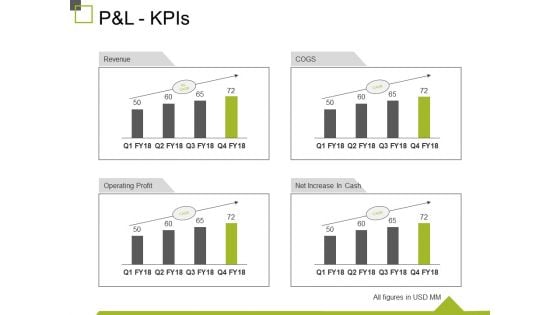
P And L Kpis Ppt PowerPoint Presentation Show Design Inspiration
This is a p and l kpis ppt powerpoint presentation show design inspiration. This is a four stage process. The stages in this process are revenue, operating profit, cogs, net increase in cash, business.
-
Digital Client Service Convenience Ppt PowerPoint Presentation Complete Deck With Slides
Share a great deal of information on the topic by deploying this digital client service convenience ppt powerpoint presentation complete deck with slides. Support your ideas and thought process with this prefabricated set. It includes a set of twelve slides, all fully modifiable and editable. Each slide can be restructured and induced with the information and content of your choice. You can add or remove large content boxes as well, to make this PPT slideshow more personalized. Its high-quality graphics and visuals help in presenting a well-coordinated pitch. This PPT template is also a resourceful tool to take visual cues from and implement the best ideas to help your business grow and expand. The main attraction of this well-formulated deck is that everything is editable, giving you the freedom to adjust it to your liking and choice. Changes can be made in the background and theme as well to deliver an outstanding pitch. Therefore, click on the download button now to gain full access to this multifunctional set.
-
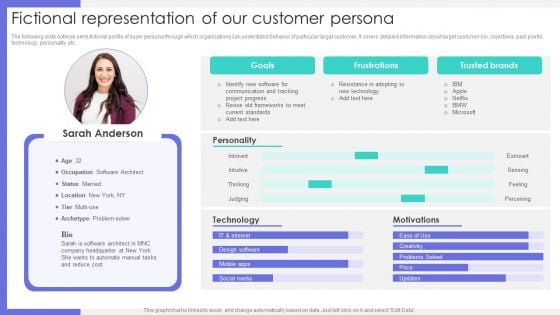
Fictional Representation Of Our Customer Persona Ppt Inspiration Deck PDF
The following slide outlines semi-fictional profile of buyer persona through which organizations can understand behavior of particular target customer. It covers detailed information about target customer bio, objectives, pain points, technology, personality, etc. Coming up with a presentation necessitates that the majority of the effort goes into the content and the message you intend to convey. The visuals of a PowerPoint presentation can only be effective if it supplements and supports the story that is being told. Keeping this in mind our experts created Fictional Representation Of Our Customer Persona Ppt Inspiration Deck PDF to reduce the time that goes into designing the presentation. This way, you can concentrate on the message while our designers take care of providing you with the right template for the situation.
-
Project Cost Benefits Assessment Powerpoint Slides
This is a project cost benefits assessment powerpoint slides. This is a two stage process. The stages in this process are compare, business, finance, marketing, strategy.
-
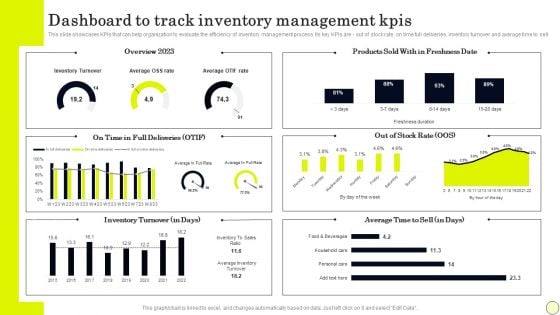
Dashboard To Track Inventory Management Kpis Portrait PDF
This slide showcases KPIs that can help organization to evaluate the efficiency of inventory management process. Its key KPIs are out of stock rate, on time full deliveries, inventory turnover and average time to sell. Here you can discover an assortment of the finest PowerPoint and Google Slides templates. With these templates, you can create presentations for a variety of purposes while simultaneously providing your audience with an eye catching visual experience. Download Dashboard To Track Inventory Management Kpis Portrait PDF to deliver an impeccable presentation. These templates will make your job of preparing presentations much quicker, yet still, maintain a high level of quality. Slidegeeks has experienced researchers who prepare these templates and write high quality content for you. Later on, you can personalize the content by editing the Dashboard To Track Inventory Management Kpis Portrait PDF.
-
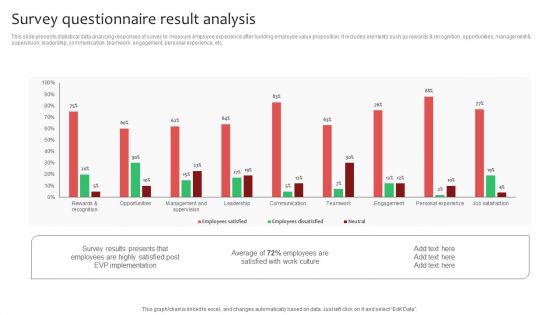
Survey Questionnaire Result Analysis Ppt Ideas Show PDF
This slide presents statistical data analyzing responses of survey to measure employee experience after building employee value proposition. It includes elements such as rewards and recognition, opportunities, management and supervision, leadership, communication, teamwork, engagement, personal experience, etc. Do you have an important presentation coming up Are you looking for something that will make your presentation stand out from the rest Look no further than Survey Questionnaire Result Analysis Ppt Ideas Show PDF. With our professional designs, you can trust that your presentation will pop and make delivering it a smooth process. And with Slidegeeks, you can trust that your presentation will be unique and memorable. So why wait Grab Survey Questionnaire Result Analysis Ppt Ideas Show PDF today and make your presentation stand out from the rest.
-
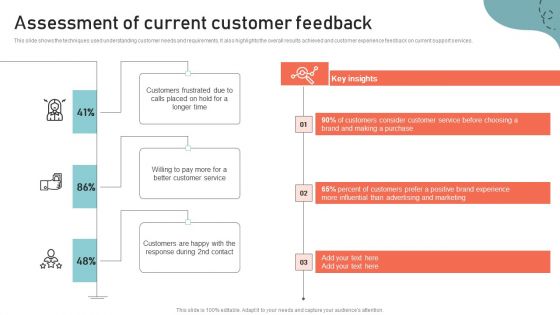
Optimizing Multichannel Strategy To Improve User Experience Assessment Of Current Customer Guidelines PDF
This slide highlight the results of current customer support services that represents the key major concerns such as poor customer service, low retention rate, and increasing call duration time etc. Get a simple yet stunning designed Optimizing Multichannel Strategy To Improve User Experience Assessment Of Current Customer Guidelines PDF. It is the best one to establish the tone in your meetings. It is an excellent way to make your presentations highly effective. So, download this PPT today from Slidegeeks and see the positive impacts. Our easy to edit Optimizing Multichannel Strategy To Improve User Experience Assessment Of Current Customer Guidelines PDF can be your go to option for all upcoming conferences and meetings. So, what are you waiting for Grab this template today.
-
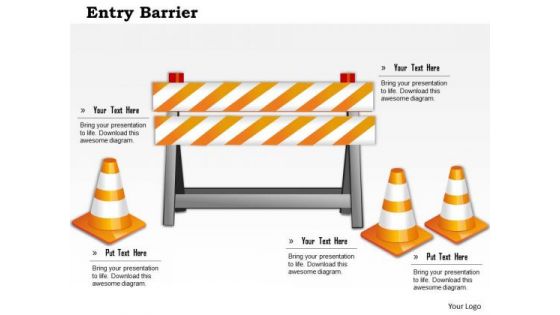
Business Framework Entry Barrier 1 PowerPoint Presentation
This business framework PPT diagram has been designed with graphic of traffic cones and barrier. This PPT diagram contains the concept of security and construction. Use this PPT diagram for your road safety and traffic rules related presentations.
-
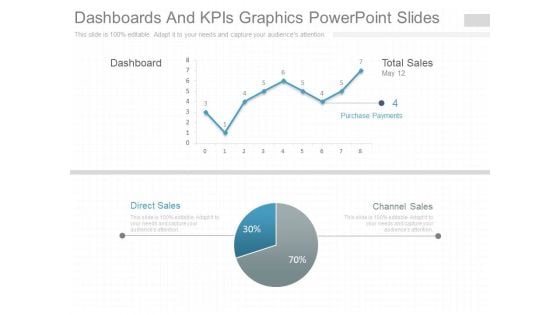
Dashboards And Kpis Graphics Powerpoint Slides
This is a dashboards and kpis graphics powerpoint slides. This is a two stage process. The stages in this process are dashboard, total sales, channel sales, direct sales, purchase payments.
-
How To Implement Cloud Collaboration Tracking Progress Of Project Management Tasks Themes PDF
The following slide illustrates task management tool for tracking project status. It provides information about requirements, coding, development, knowledge, user acceptance testing, standup meeting, etc. Deliver and pitch your topic in the best possible manner with this How To Implement Cloud Collaboration Tracking Progress Of Project Management Tasks Themes PDF. Use them to share invaluable insights on Detailed Requirements, Design Delivery, Daily Project and impress your audience. This template can be altered and modified as per your expectations. So, grab it now.
-
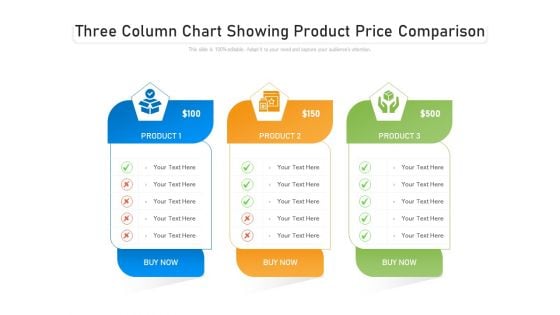
Three Column Chart Showing Product Price Comparison Ppt PowerPoint Presentation Ideas Deck PDF
Persuade your audience using this three column chart showing product price comparison ppt powerpoint presentation ideas deck pdf. This PPT design covers three stages, thus making it a great tool to use. It also caters to a variety of topics including three column chart showing product price comparison. Download this PPT design now to present a convincing pitch that not only emphasizes the topic but also showcases your presentation skills.
-
HR Coaching Playbook Determine Workforce Training Performance Tracking Dashboard Guidelines PDF
This slide provides information regarding workforce training performance tracking dashboard with training cost, number of participants, hours of training, etc. Deliver an awe inspiring pitch with this creative HR Coaching Playbook Determine Workforce Training Performance Tracking Dashboard Guidelines PDF bundle. Topics like Participant Training, Completed Training, Training Cost can be discussed with this completely editable template. It is available for immediate download depending on the needs and requirements of the user.
-
ROI On Digital Marketing Marketing Ppt PowerPoint Presentation Icon Rules
Presenting this set of slides with name roi on digital marketing marketing ppt powerpoint presentation icon rules. The topics discussed in these slides are finance, marketing, management, investment, analysis. This is a completely editable PowerPoint presentation and is available for immediate download. Download now and impress your audience.
-
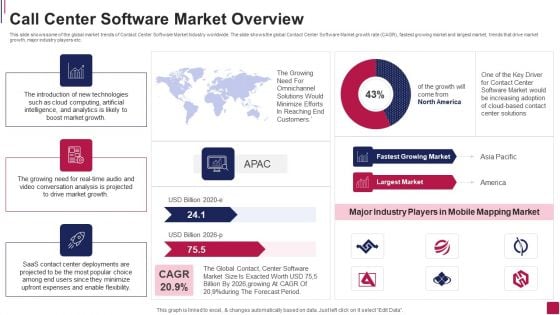
Call Center Software Market Overview Ideas PDF
This slide shows some of the global market trends of Contact Center Software Market Industry worldwide. The slide shows the global Contact Center Software Market growth rate CAGR, fastest growing market and largest market, trends that drive market growth, major industry players etc.Deliver an awe inspiring pitch with this creative Call Center Software Market Overview Ideas PDF bundle. Topics like Technologies Such, Computing Artificial, Enter Deployments can be discussed with this completely editable template. It is available for immediate download depending on the needs and requirements of the user.
-
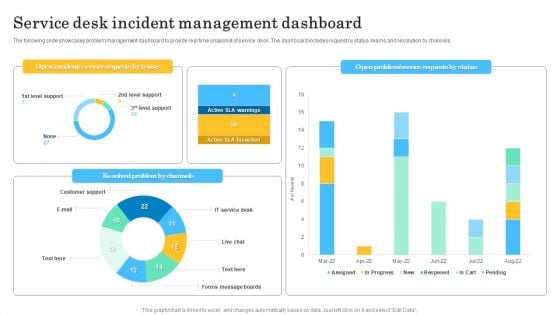
Service Desk Incident Management Dashboard Summary PDF
The following slide showcases problem management dashboard to provide real time snapshot of service desk. The dashboard includes request by status, teams and resolution by channels. Showcasing this set of slides titled Service Desk Incident Management Dashboard Summary PDF. The topics addressed in these templates are Open Incidents Service, Requests By Teams. All the content presented in this PPT design is completely editable. Download it and make adjustments in color, background, font etc. as per your unique business setting.
-
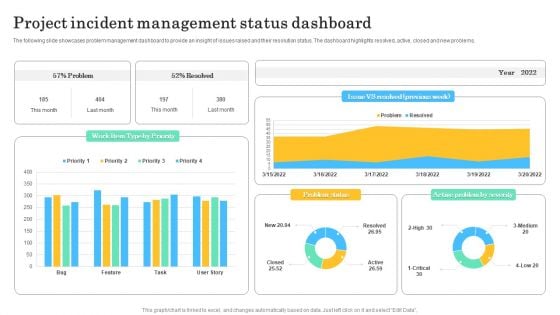
Project Incident Management Status Dashboard Sample PDF
The following slide showcases problem management dashboard to provide an insight of issues raised and their resolution status. The dashboard highlights resolved, active, closed and new problems. Pitch your topic with ease and precision using this Project Incident Management Status Dashboard Sample PDF. This layout presents information on Project Incident, Management Status Dashboard. It is also available for immediate download and adjustment. So, changes can be made in the color, design, graphics or any other component to create a unique layout.
-
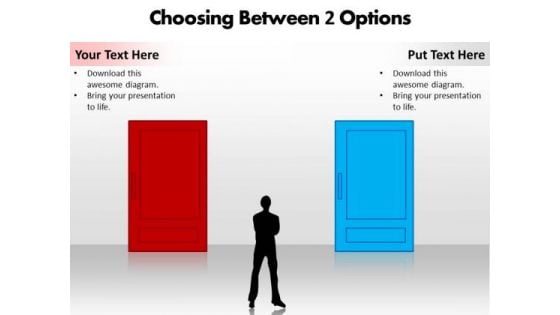
Choosing Between 2 Options Editable PowerPoint Templates
We present our choosing between 2 options editable powerpoint templates.Download our Future PowerPoint Templates because our PowerPoint templates designed for your ideas to sell. Download our Shapes PowerPoint Templates because it can bring your ideas to the fore so that all around can know. Dissect each idea to the core and select the best. Present our Business PowerPoint Templates because this template can project the path to sucess that you have charted. Use our Success PowerPoint Templates because you have come up with a brilliant breakthrough idea. you can also visualise the interest it will generate. Use our Finance PowerPoint Templates because you can outline your targets to your team.Use these PowerPoint slides for presentations relating to Adult, Business, Businessman, Businessperson, Choice, Choose, Close, Concept, Confused, Confusion, Corporate, Debate, Decide, Decision, Direction, Doors, Doubt, Fear, Future, Hands, Indecision, Interior, Looking, Making, Man, New, Nowhere, Office, One, Opportunity, Opposite, Option, Path, Person, Pick, Professional, Question, Searching, Select, Standing, Strategy, Stuck, Success, Two, Undecided. The prominent colors used in the PowerPoint template are Black, Blue, Red. Presenters tell us our choosing between 2 options editable powerpoint templates are specially created by a professional team with vast experience. They diligently strive to come up with the right vehicle for your brilliant Ideas. We assure you our Businessman PowerPoint templates and PPT Slides are Romantic. The feedback we get is that our choosing between 2 options editable powerpoint templates are Colorful. The feedback we get is that our Confused PowerPoint templates and PPT Slides are Bold. The feedback we get is that our choosing between 2 options editable powerpoint templates look good visually. Professionals tell us our Choose PowerPoint templates and PPT Slides are Swanky.
-
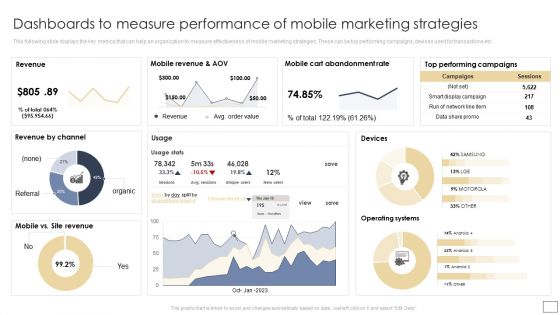
Dashboards To Measure Performance Of Mobile Marketing Strategies Graphics PDF
This following slide displays the key metrics that can help an organization to measure effectiveness of mobile marketing strategies. These can be top performing campaigns, devises used for transactions etc. There are so many reasons you need a Dashboards To Measure Performance Of Mobile Marketing Strategies Graphics PDF. The first reason is you can not spend time making everything from scratch, Thus, Slidegeeks has made presentation templates for you too. You can easily download these templates from our website easily.
-
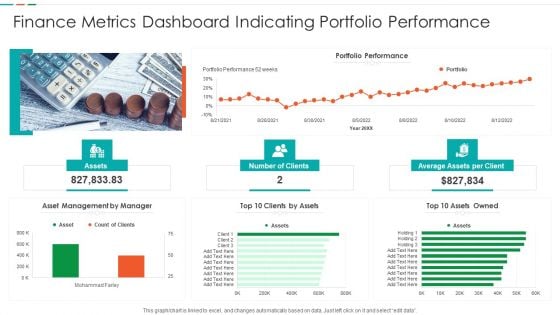
Finance Metrics Dashboard Indicating Portfolio Performance Microsoft PDF
This graph or chart is linked to excel, and changes automatically based on data. Just left click on it and select edit data. Pitch your topic with ease and precision using this Finance Metrics Dashboard Indicating Portfolio Performance Microsoft PDF. This layout presents information on Portfolio Performance Portfolio, Asset Management Manager, Top 10 Assets. It is also available for immediate download and adjustment. So, changes can be made in the color, design, graphics or any other component to create a unique layout.
-
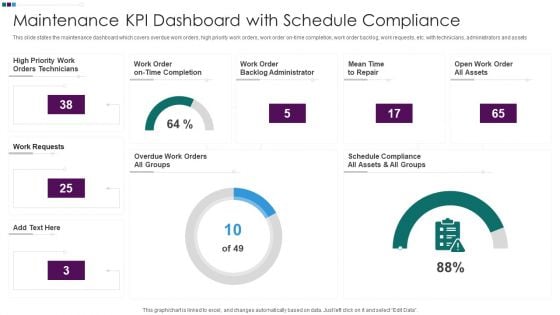
Maintenance KPI Dashboard With Schedule Compliance Ppt Styles Demonstration PDF
This slide states the maintenance dashboard which covers overdue work orders, high priority work orders, work order on-time completion, work order backlog, work requests, etc. with technicians, administrators and assets. Pitch your topic with ease and precision using this Maintenance KPI Dashboard With Schedule Compliance Ppt Styles Demonstration PDF. This layout presents information on High Priority Work, Work Order Backlog, Mean Time Repair, Open Work Order. It is also available for immediate download and adjustment. So, changes can be made in the color, design, graphics or any other component to create a unique layout.
-
Sales Kpi Tracker Ppt PowerPoint Presentation Pictures Designs
This is a sales kpi tracker ppt powerpoint presentation pictures designs. This is a two stage process. The stages in this process are leads created, sales ratio, opportunities won, top products in revenue, win ratio vs last yr.
-
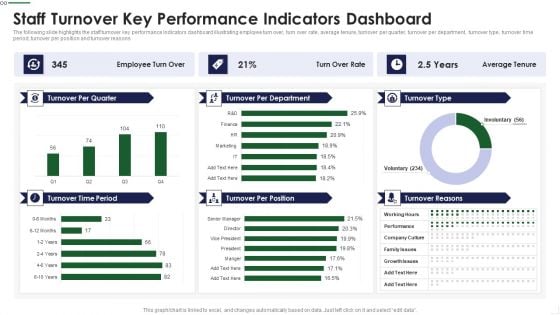
Staff Turnover Key Performance Indicators Dashboard Sample PDF
The following slide highlights the staff turnover key performance Indicators dashboard illustrating employee turn over, turn over rate, average tenure, turnover per quarter, turnover per department, turnover type, turnover time period, turnover per position and turnover reasons Deliver and pitch your topic in the best possible manner with this Staff Turnover Key Performance Indicators Dashboard Sample PDF Use them to share invaluable insights on Management Goals, Subjective Appraisal, Product Defects and impress your audience. This template can be altered and modified as per your expectations. So, grab it now.
-
IT Security Evaluation Scorecard Ppt PowerPoint Presentation Complete Deck With Slides
This complete deck covers various topics and highlights important concepts. It has PPT slides which cater to your business needs. This complete deck presentation emphasizes IT Security Evaluation Scorecard Ppt PowerPoint Presentation Complete Deck With Slides and has templates with professional background images and relevant content. This deck consists of total of twenty nine slides. Our designers have created customizable templates, keeping your convenience in mind. You can edit the colour, text and font size with ease. Not just this, you can also add or delete the content if needed. Get access to this fully editable complete presentation by clicking the download button below.
-
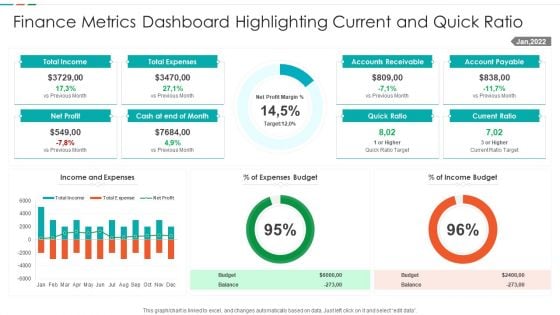
Finance Metrics Dashboard Highlighting Current And Quick Ratio Template PDF
This graph or chart is linked to excel, and changes automatically based on data. Just left click on it and select edit data. Showcasing this set of slides titled Finance Metrics Dashboard Highlighting Current And Quick Ratio Template PDF. The topics addressed in these templates are Total Income Budget, Total Expenses Balance, Net Profit Quick, Ratio Current Ratio. All the content presented in this PPT design is completely editable. Download it and make adjustments in color, background, font etc. as per your unique business setting.
-
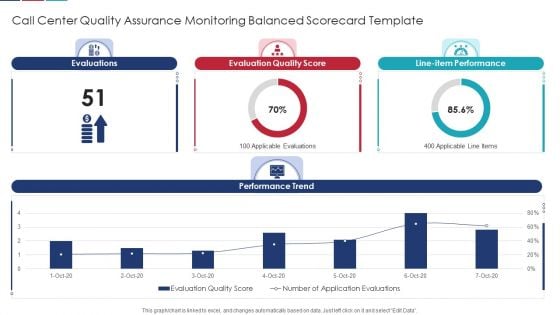
Call Center Quality Assurance Monitoring Balanced Scorecard Template Formats PDF
Deliver and pitch your topic in the best possible manner with this Call Center Quality Assurance Monitoring Balanced Scorecard Template Formats PDF Use them to share invaluable insights on Evaluation Quality, Line Performance, Evaluations and impress your audience. This template can be altered and modified as per your expectations. So, grab it now.
-
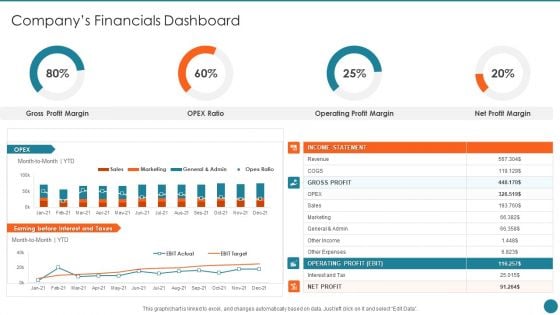
Business Overview Of An Information Technology Company Companys Financials Dashboard Themes PDF
Deliver an awe inspiring pitch with this creative Business Overview Of An Information Technology Company Companys Financials Dashboard Themes PDF bundle. Topics like Gross Profit, Operating Profit, Profit Margin can be discussed with this completely editable template. It is available for immediate download depending on the needs and requirements of the user.
-
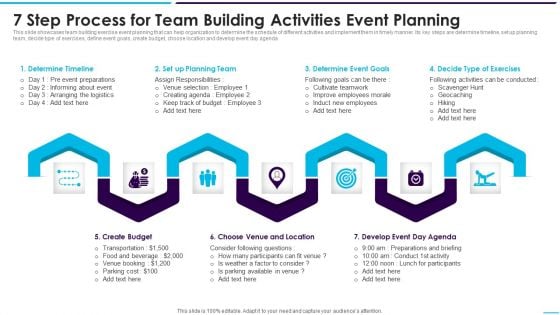
7 Step Process For Team Building Activities Event Planning Background PDF
Pitch your topic with ease and precision using this 7 Step Process For Team Building Activities Event Planning Background PDF This layout presents information on Determine Timeline, Determine Event, Create Budget It is also available for immediate download and adjustment. So, changes can be made in the color, design, graphics or any other component to create a unique layout.
-
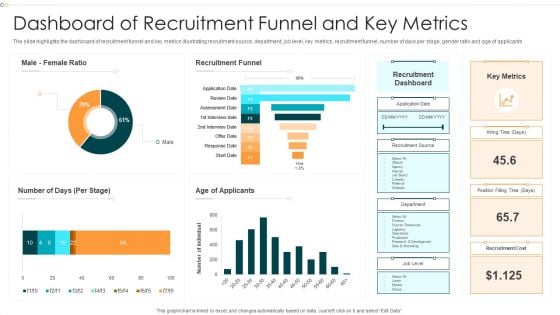
Dashboard Of Recruitment Funnel And Key Metrics Information PDF
The slide highlights the dashboard of recruitment funnel and key metrics illustrating recruitment source, department, job level, key metrics, recruitment funnel, number of days per stage, gender ratio and age of applicants.Pitch your topic with ease and precision using this Dashboard Of Recruitment Funnel And Key Metrics Information PDF This layout presents information on Recruitment Funnel, Recruitment Dashboard, Recruitment Cost It is also available for immediate download and adjustment. So, changes can be made in the color, design, graphics or any other component to create a unique layout.
-
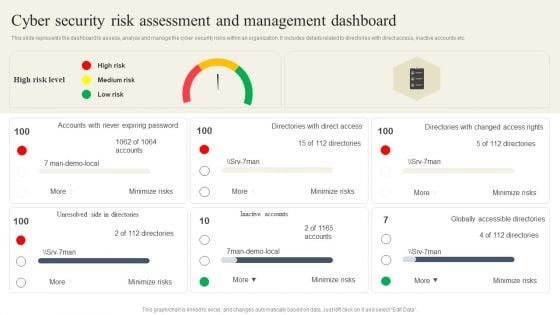
CYBER Security Breache Response Strategy Cyber Security Risk Assessment And Management Dashboard Summary PDF
This slide represents the dashboard to assess, analyze and manage the cyber security risks within an organization. It includes details related to directories with direct access, inactive accounts etc. This CYBER Security Breache Response Strategy Cyber Security Risk Assessment And Management Dashboard Summary PDF is perfect for any presentation, be it in front of clients or colleagues. It is a versatile and stylish solution for organizing your meetings. The CYBER Security Breache Response Strategy Cyber Security Risk Assessment And Management Dashboard Summary PDF features a modern design for your presentation meetings. The adjustable and customizable slides provide unlimited possibilities for acing up your presentation. Slidegeeks has done all the homework before launching the product for you. So, do not wait, grab the presentation templates today
-
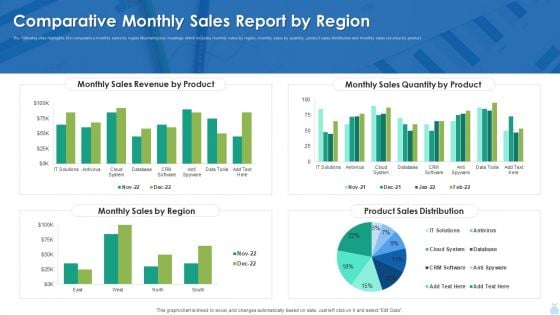
Comparative Monthly Sales Report By Region Graphics PDF
The following slide highlights the comparative monthly sales by region illustrating key headings which includes monthly sales by region, monthly sales by quantity, product sales distribution and monthly sales revenue by product. Showcasing this set of slides titled Comparative Monthly Sales Report By Region Graphics PDF. The topics addressed in these templates are Sales Revenue, Monthly Sales Quantity, Product Sales Distribution. All the content presented in this PPT design is completely editable. Download it and make adjustments in color, background, font etc. as per your unique business setting.
-
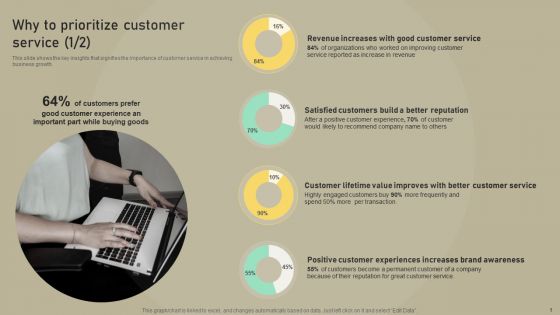
Customer Experience Optimization Why To Prioritize Customer Service Formats PDF
This slide shows the key insights that signifies the importance of customer service in achieving business growth. If you are looking for a format to display your unique thoughts, then the professionally designed Customer Experience Optimization Why To Prioritize Customer Service Formats PDF is the one for you. You can use it as a Google Slides template or a PowerPoint template. Incorporate impressive visuals, symbols, images, and other charts. Modify or reorganize the text boxes as you desire. Experiment with shade schemes and font pairings. Alter, share or cooperate with other people on your work. Download Customer Experience Optimization Why To Prioritize Customer Service Formats PDF and find out how to give a successful presentation. Present a perfect display to your team and make your presentation unforgettable.
-
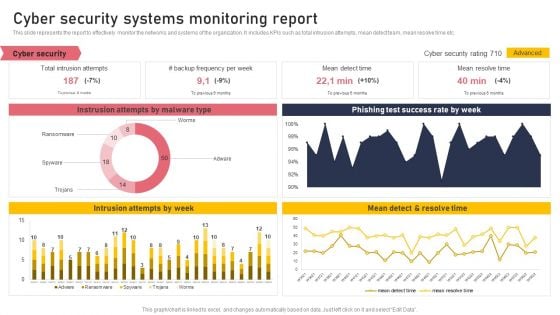
Cyber Security Systems Monitoring Report Formats PDF
This slide represents the report to effectively monitor the networks and systems of the organization. It includes KPIs such as total intrusion attempts, mean detect team, mean resolve time etc. Boost your pitch with our creative Cyber Security Systems Monitoring Report Formats PDF. Deliver an awe-inspiring pitch that will mesmerize everyone. Using these presentation templates you will surely catch everyones attention. You can browse the ppts collection on our website. We have researchers who are experts at creating the right content for the templates. So you do not have to invest time in any additional work. Just grab the template now and use them.
-
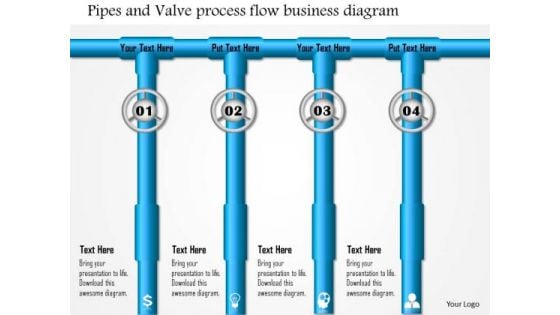
Business Framework Pipes And Valve Process Flow Business Diagram PowerPoint Presentation
This business framework image slide has been designed with pipes and valve process flow diagram with icons. Use this image slide to express views on processes, procedure and steps in your presentations. This image slide will impart professional appearance to your presentations.
-
Application Performance Dashboard Ppt Icon Template PDF
This slide covers application performance in market KPIs and metrics such as impressions, clicks, searches for app, conversion rate etc. This Application Performance Dashboard Ppt Icon Template PDF from Slidegeeks makes it easy to present information on your topic with precision. It provides customization options, so you can make changes to the colors, design, graphics, or any other component to create a unique layout. It is also available for immediate download, so you can begin using it right away. Slidegeeks has done good research to ensure that you have everything you need to make your presentation stand out. Make a name out there for a brilliant performance.
-
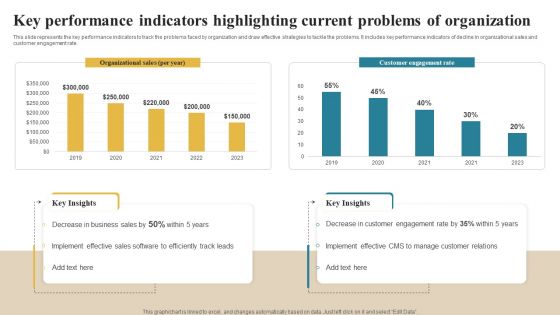
Software Implementation Technique Key Performance Indicators Highlighting Current Problems Elements PDF
This slide represents the key performance indicators to track the problems faced by organization and draw effective strategies to tackle the problems. It includes key performance indicators of decline in organizational sales and customer engagement rate. Make sure to capture your audiences attention in your business displays with our gratis customizable Software Implementation Technique Key Performance Indicators Highlighting Current Problems Elements PDF. These are great for business strategies, office conferences, capital raising or task suggestions. If you desire to acquire more customers for your tech business and ensure they stay satisfied, create your own sales presentation with these plain slides.
-
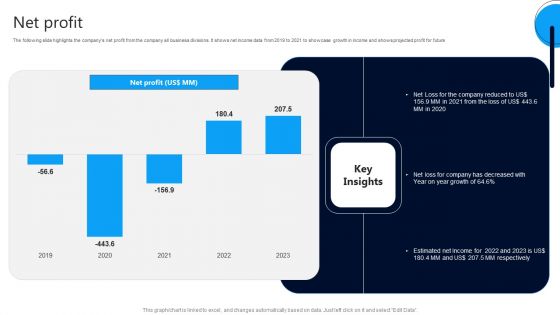
Market Research Evaluation Company Outline Net Profit Graphics PDF
The following slide highlights the companys net profit from the company all business divisions. It shows net income data from 2019 to 2021 to showcase growth in income and shows projected profit for future. Find highly impressive Market Research Evaluation Company Outline Net Profit Graphics PDF on Slidegeeks to deliver a meaningful presentation. You can save an ample amount of time using these presentation templates. No need to worry to prepare everything from scratch because Slidegeeks experts have already done a huge research and work for you. You need to download Market Research Evaluation Company Outline Net Profit Graphics PDF for your upcoming presentation. All the presentation templates are 100 percent editable and you can change the color and personalize the content accordingly. Download now.
-
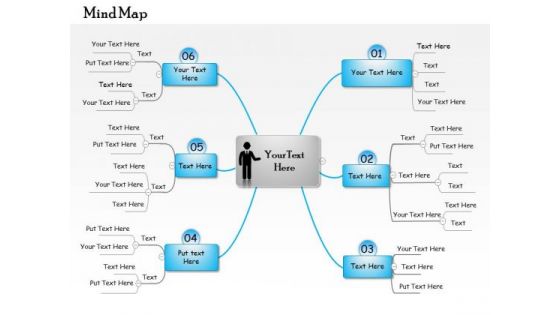
Business Framework Mindmap Download 2 PowerPoint Presentation
This business framework contains the concept of visually organizing the information. This mind map is generally based on single concept. Add this mind map PPT in your presentation and explain single concept with visual effect.
-
Market Research Evaluation Company Outline Ppt PowerPoint Presentation Complete Deck With Slides
Here is another predesigned PowerPoint Template for professionals looking to bring global recall and recognition to this business. Use this content-ready Market Research Evaluation Company Outline Ppt PowerPoint Presentation Complete Deck With Slides to introduce your business to the larger audience. This readily available complete deck has fourty eight slides and is perfect for helping you give a brief background on your business, specialties, services, etc. Use this aesthetically pleasing PPT Template to streamline your efforts. The presentation template is also equipped to do this with its 100 percent editable and customizable capability. Download now
-
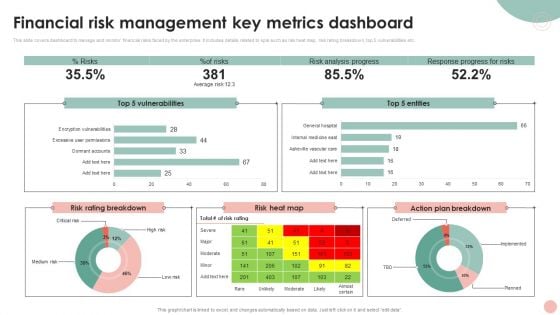
Company Risk Assessment Plan Financial Risk Management Key Metrics Dashboard Brochure PDF
This slide covers dashboard to manage and monitor financial risks faced by the enterprise. It includes details related to kpis such as risk heat map, risk rating breakdown, top 5 vulnerabilities etc. Crafting an eye catching presentation has never been more straightforward. Let your presentation shine with this tasteful yet straight forward Company Risk Assessment Plan Financial Risk Management Key Metrics Dashboard Brochure PDF template. It offers a minimalistic and classy look that is great for making a statement. The colors have been employed intelligently to add a bit of playfulness while still remaining professional. Construct the ideal Company Risk Assessment Plan Financial Risk Management Key Metrics Dashboard Brochure PDF that effortlessly grabs the attention of your audience. Begin now and be certain to wow your customers.
-
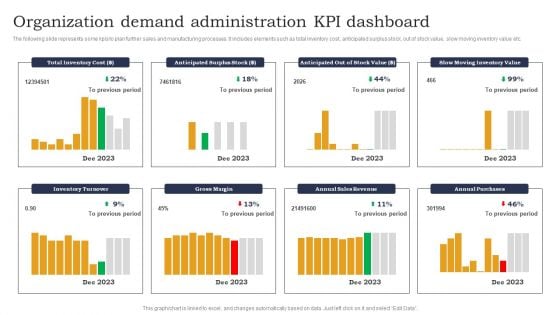
Organization Demand Administration KPI Dashboard Designs PDF
The following slide represents some kpis to plan further sales and manufacturing processes. It includes elements such as total inventory cost, anticipated surplus stock, out of stock value, slow moving inventory value etc. Pitch your topic with ease and precision using this Organization Demand Administration KPI Dashboard Designs PDF. This layout presents information on Anticipated Surplus Stock, Out Of Stock, Slow Moving Inventory. It is also available for immediate download and adjustment. So, changes can be made in the color, design, graphics or any other component to create a unique layout.
-
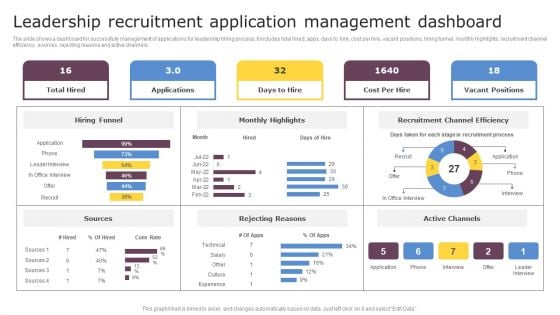
Leadership Recruitment Application Management Dashboard Introduction PDF
The slide shows a dashboard for successfully management of applications for leadership hiring process. It includes total hired, apps, days to hire, cost per hire, vacant positions, hiring funnel, monthly highlights, recruitment channel efficiency, sources, rejecting reasons and active channels. Showcasing this set of slides titled Leadership Recruitment Application Management Dashboard Introduction PDF. The topics addressed in these templates are Leadership Recruitment, Application Management Dashboard. All the content presented in this PPT design is completely editable. Download it and make adjustments in color, background, font etc. as per your unique business setting.
-
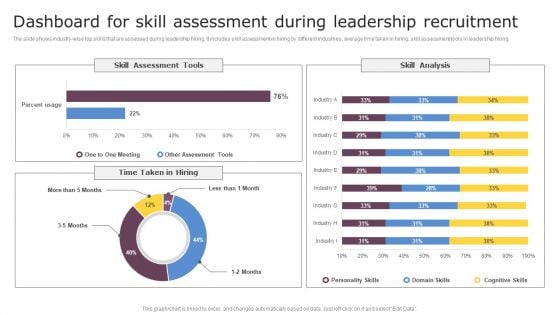
Dashboard For Skill Assessment During Leadership Recruitment Infographics PDF
The slide shows industry wise top skills that are assessed during leadership hiring. It includes skill assessment in hiring by different industries, average time taken in hiring, skill assessment tools in leadership hiring. Showcasing this set of slides titled Dashboard For Skill Assessment During Leadership Recruitment Infographics PDF. The topics addressed in these templates are Skill Assessment Tools, Skill Analysis. All the content presented in this PPT design is completely editable. Download it and make adjustments in color, background, font etc. as per your unique business setting.
-
Business Framework Cobit 5 Model PowerPoint Presentation
This image slide displays business framework of COBIT five model. This image slide has been crafted to depict process assessment model. Use this image slide, in your presentations to express views on business strategic planning process. This image slide will enhance the quality of your presentations.
-
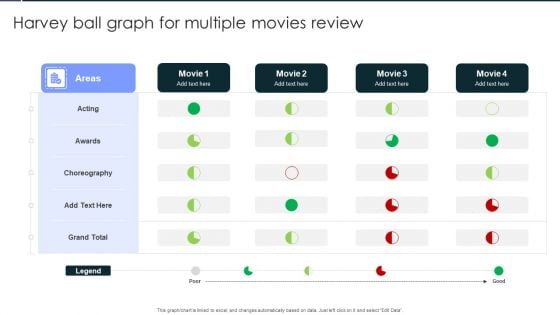
Harvey Ball Graph For Multiple Movies Review Template PDF
Showcasing this set of slides titled Harvey Ball Graph For Multiple Movies Review Template PDF. The topics addressed in these templates are Acting, Awards, Choreography. All the content presented in this PPT design is completely editable. Download it and make adjustments in color, background, font etc. as per your unique business setting.
-
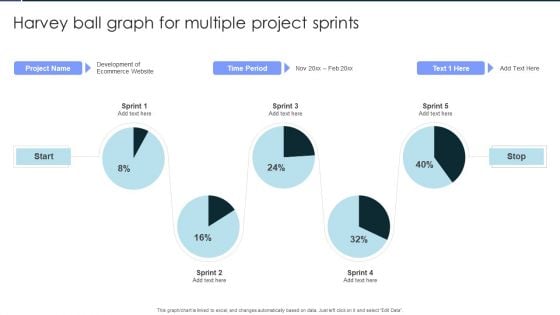
Harvey Ball Graph For Multiple Project Sprints Background PDF
Pitch your topic with ease and precision using this Harvey Ball Graph For Multiple Project Sprints Background PDF. This layout presents information on Harvey Ball Graph, For Multiple, Project Sprints. It is also available for immediate download and adjustment. So, changes can be made in the color, design, graphics or any other component to create a unique layout.
-
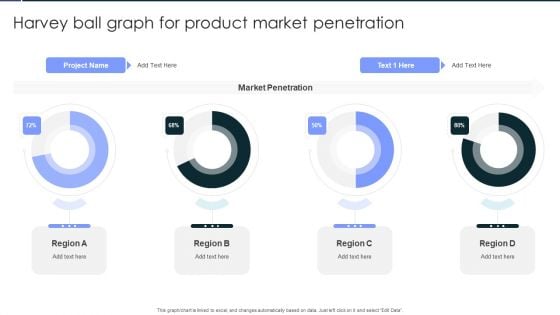
Harvey Ball Graph For Product Market Penetration Clipart PDF
Showcasing this set of slides titled Harvey Ball Graph For Product Market Penetration Clipart PDF. The topics addressed in these templates are Harvey Ball Graph, For Product, Market Penetration. All the content presented in this PPT design is completely editable. Download it and make adjustments in color, background, font etc. as per your unique business setting.
-
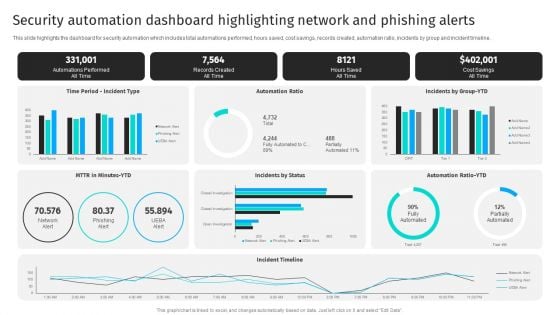
Security Automation Dashboard Highlighting Network And Phishing Alerts Professional PDF
This slide highlights the dashboard for security automation which includes total automations performed, hours saved, cost savings, records created, automation ratio, incidents by group and incident timeline.Get a simple yet stunning designed Security Automation Dashboard Highlighting Network And Phishing Alerts Professional PDF. It is the best one to establish the tone in your meetings. It is an excellent way to make your presentations highly effective. So, download this PPT today from Slidegeeks and see the positive impacts. Our easy-to-edit Security Automation Dashboard Highlighting Network And Phishing Alerts Professional PDF can be your go-to option for all upcoming conferences and meetings. So, what are you waiting for Grab this template today.
-
Dashboard To Monitor Department Wise Budget Allocation And Usage Icons PDF
This slide highlights the dashboard to monitor the department wise budget allocation and usage. It provides information regarding the total budget allocated and actual amount spent by multiple organization silos such as marketing, finance, HR. It also contains details of each departments average employee spending, Make sure to capture your audiences attention in your business displays with our gratis customizable Dashboard To Monitor Department Wise Budget Allocation And Usage Icons PDF. These are great for business strategies, office conferences, capital raising or task suggestions. If you desire to acquire more customers for your tech business and ensure they stay satisfied, create your own sales presentation with these plain slides.
-
Financial Dashboard For Organization Scenario Analysis Ppt Show Ideas PDF
This slide represents the key financial performance indicators of a business to analyze and plan its scenario. It includes KPIs such as cash conversion cycle, working capital and current ratio. Showcasing this set of slides titled Financial Dashboard For Organization Scenario Analysis Ppt Show Ideas PDF. The topics addressed in these templates are Current Working Capital, Current Liabilities, Current Assets. All the content presented in this PPT design is completely editable. Download it and make adjustments in color, background, font etc. as per your unique business setting.
-
Average Employee Compensation And Salary Dashboard Download PDF
The following slide showcases workforce compensation management dashboard to keep a track of benefits provided to employees. The dashboard includes employee count by salary range, workforce details and count by rating. Showcasing this set of slides titled Average Employee Compensation And Salary Dashboard Download PDF. The topics addressed in these templates are Average Employee Compensation, Salary Dashboard. All the content presented in this PPT design is completely editable. Download it and make adjustments in color, background, font etc. as per your unique business setting.
-
HR Recruitment Dashboard To Monitor Hiring Interview Status Ideas PDF
This slide signifies the human resource recruitment dashboard to evaluate job interview status. It includes open positions by department, application received, offer acceptance ratio. Showcasing this set of slides titled HR Recruitment Dashboard To Monitor Hiring Interview Status Ideas PDF. The topics addressed in these templates are Application Received Department, Total Applicants, Shortlisted Candidates, Hired Candidates. All the content presented in this PPT design is completely editable. Download it and make adjustments in color, background, font etc. as per your unique business setting.
-
Data Science Learning Ppt PowerPoint Presentation Complete Deck With Slides
If designing a presentation takes a lot of your time and resources and you are looking for a better alternative, then this Data Science Learning Ppt PowerPoint Presentation Complete Deck With Slides is the right fit for you. This is a prefabricated set that can help you deliver a great presentation on the topic. All the seventeen slides included in this sample template can be used to present a birds-eye view of the topic. These slides are also fully editable, giving you enough freedom to add specific details to make this layout more suited to your business setting. Apart from the content, all other elements like color, design, theme are also replaceable and editable. This helps in designing a variety of presentations with a single layout. Not only this, you can use this PPT design in formats like PDF, PNG, and JPG once downloaded. Therefore, without any further ado, download and utilize this sample presentation as per your liking.
-
Quality Control Dashboard With Test Execution Status Themes PDF
Pitch your topic with ease and precision using this Quality Control Dashboard With Test Execution Status Themes PDF. This layout presents information on Schedule Variation, Defect Density, Regression Defects. It is also available for immediate download and adjustment. So, changes can be made in the color, design, graphics or any other component to create a unique layout.
-
Portfolio Summary Management Dashboard Ppt PowerPoint Presentation Infographics Templates
Presenting this set of slides with name portfolio summary management dashboard ppt powerpoint presentation infographics templates. The topics discussed in these slides are human capital initiatives, internal activities portfolio, operation excellence. This is a completely editable PowerPoint presentation and is available for immediate download. Download now and impress your audience.
-
Business Framework Brick By Brick Development PowerPoint Presentation
This business framework displays graphic of bricks taking shape of wall. This business slide depicts concept of progress and development. Use this editable slide to make impressive presentations.
-
Enhanced Customer Banking Experience With Mobile Branch Scoreboard KPI Dashboard Graphics PDF
This slide portrays branch scoreboard dashboard covering metrics such as accounts opened and closed, deposits to goal, accounts by type, expense to budget and referrals by product.Deliver an awe inspiring pitch with this creative Enhanced Customer Banking Experience With Mobile Branch Scoreboard KPI Dashboard Graphics PDF bundle. Topics like Branch Scoreboard KPI Dashboard can be discussed with this completely editable template. It is available for immediate download depending on the needs and requirements of the user.
-
Pie Of Pie Marketing Ppt Powerpoint Presentation Inspiration Designs
This is a pie of pie marketing ppt powerpoint presentation inspiration designs. This is a three stage process. The stages in this process are finance, pie chart, product, marketing, percentage.
-
Training Timeline Ppt PowerPoint Presentation Outline Templates
This is a training timeline ppt powerpoint presentation outline templates. This is a five stage process. The stages in this process are finance, marketing, management, investment, analysis.
-
Project Management Dashboard Ppt PowerPoint Presentation Outline Designs
This is a project management dashboard ppt powerpoint presentation outline designs. This is a four stage process. The stages in this process are finance, analysis, business, investment, marketing.
-
Portfolio Summary Management Dashboard Ppt PowerPoint Presentation Pictures Visuals
This is a portfolio summary management dashboard ppt powerpoint presentation pictures visuals. This is a six stage process. The stages in this process are finance, marketing, management, investment.
-
Resource Capacity Planning Percentage Chart Ppt Slides
This is a resource capacity planning percentage chart ppt slides. This is a four stage process. The stages in this process are business, finance, marketing.
-
Key Investment Highlights Highly Effective Strategy Timeline Ppt Slide
This is a key investment highlights highly effective strategy timeline ppt slide. This is a four stage process. The stages in this process are business, marketing.
-
Key Evaluation Metrics Ppt PowerPoint Presentation Layouts Icons
This is a key evaluation metrics ppt powerpoint presentation layouts icons. This is a five stage process. The stages in this process are business, icons, marketing, strategy, finance, analysis.
-
Performance Metrics For Project Management Office Ppt PowerPoint Presentation Complete Deck With Slides
This Performance Metrics For Project Management Office Ppt PowerPoint Presentation Complete Deck With Slides acts as backup support for your ideas, vision, thoughts, etc. Use it to present a thorough understanding of the topic. This PPT slideshow can be utilized for both in-house and outside presentations depending upon your needs and business demands. Entailing twelve slides with a consistent design and theme, this template will make a solid use case. As it is intuitively designed, it suits every business vertical and industry. All you have to do is make a few tweaks in the content or any other component to design unique presentations. The biggest advantage of this complete deck is that it can be personalized multiple times once downloaded. The color, design, shapes, and other elements are free to modify to add personal touches. You can also insert your logo design in this PPT layout. Therefore a well-thought and crafted presentation can be delivered with ease and precision by downloading this Performance Metrics For Project Management Office Ppt PowerPoint Presentation Complete Deck With Slides PPT slideshow.
-
Risk PowerPoint Icon C
risk in financial business investment is dangerous
-
Clinical Risk Assessment Dashboard For Improving Quality And Safety In Healthcare Brochure PDF
This slide illustrates key initiatives taken by HR department for resolving global team conflicts. Pitch your topic with ease and precision using this Clinical Risk Assessment Dashboard For Improving Quality And Safety In Healthcare Brochure PDF This layout presents information on Ward Administration, Patient Experience, Risk Assessment It is also available for immediate download and adjustment. So, changes can be made in the color, design, graphics or any other component to create a unique layout.
-
Construction Sector Project Risk Management Executive Summary Positive And Negative Impacts Level Of Adoption Of Safety Practices Graphics PDF
This slide covers the executive summary for the safety management in construction industry including Positive and Negative Impacts of Safety Programs on Projects. Deliver and pitch your topic in the best possible manner with this construction sector project risk management executive summary positive and negative impacts level of adoption of safety practices graphics pdf. Use them to share invaluable insights on improvements, policies, businesses, budget and impress your audience. This template can be altered and modified as per your expectations. So, grab it now.
-
Health And Safety Performance Measurements Dashboard With Employee Stats Template PDF
This slide comprises of many types of activities that have taken place in an organization in terms of the safety and it also shows how the employees performance are going on in terms of safety . It includes training hours, total man-hour , severity of the accidents , etc.Pitch your topic with ease and precision using this Health And Safety Performance Measurements Dashboard With Employee Stats Template PDF This layout presents information on Safety Observation, Injuries Frequency, Unsafe Conditions It is also available for immediate download and adjustment. So, changes can be made in the color, design, graphics or any other component to create a unique layout.
-
Cost Breakdown Human Resource Ppt PowerPoint Presentation Complete Deck With Slides
If designing a presentation takes a lot of your time and resources and you are looking for a better alternative, then this cost breakdown human resource ppt powerpoint presentation complete deck with slides is the right fit for you. This is a prefabricated set that can help you deliver a great presentation on the topic. All the twenty nine slides included in this sample template can be used to present a birds-eye view of the topic. These slides are also fully editable, giving you enough freedom to add specific details to make this layout more suited to your business setting. Apart from the content, all other elements like color, design, theme are also replaceable and editable. This helps in designing a variety of presentations with a single layout. Not only this, you can use this PPT design in formats like PDF, PNG, and JPG once downloaded. Therefore, without any further ado, download and utilize this sample presentation as per your liking.
-
Staffing Dashboard Presenting Job Applicants Name Background PDF
Showcasing this set of slides titled Staffing Dashboard Presenting Job Applicants Name Background PDF The topics addressed in these templates are Shortlisted Candidates, Received By Department, Recruitment Funnel All the content presented in this PPT design is completely editable. Download it and make adjustments in color, background, font etc. as per your unique business setting.
-
Hamburger Commerce Company Analysis Company Profile Mcdonalds Professional PDF
The purpose of this slide is to provide glimpse about the company profile of major player in the industry with its financial performance, product offering, etc Deliver an awe inspiring pitch with this creative Hamburger Commerce Company Analysis Company Profile Mcdonalds Professional PDF bundle. Topics like Business Description, Customers Or Partners, Key Management can be discussed with this completely editable template. It is available for immediate download depending on the needs and requirements of the user.
-
Adopting Multiple Tactics To Improve Inventory Optimization Managing Stock In Warehouse With Abc Analysis Method Brochure PDF
This modern and well arranged Adopting Multiple Tactics To Improve Inventory Optimization Managing Stock In Warehouse With Abc Analysis Method Brochure PDF provides lots of creative possibilities. It is very simple to customize and edit with the Powerpoint Software. Just drag and drop your pictures into the shapes. All facets of this template can be edited with Powerpoint no extra software is necessary. Add your own material, put your images in the places assigned for them, adjust the colors, and then you can show your slides to the world, with an animated slide included.
-
Overview Of Native Ads With Major Facts And Figures Ppt File Ideas PDF
This slide covers the brief introduction about the native ads with some major facts and figures. It includes the functions of native ads along with spending figures, native ads in social media, native ads spending in US, etc. Are you searching for a Overview Of Native Ads With Major Facts And Figures Ppt File Ideas PDF that is uncluttered, straightforward, and original Its easy to edit, and you can change the colors to suit your personal or business branding. For a presentation that expresses how much effort you have put in, this template is ideal. With all of its features, including tables, diagrams, statistics, and lists, its perfect for a business plan presentation. Make your ideas more appealing with these professional slides. Download Overview Of Native Ads With Major Facts And Figures Ppt File Ideas PDF from Slidegeeks today.
-
Team Mentoring Analysis And Productivity Dashboard Template PDF
This slide elaborates how coaching the employees or workers in an organization can lead to better productivity and boost the morale of employees . It also includes the top employees and groups, team pulse and productivity level.Showcasing this set of slides titled Team Mentoring Analysis And Productivity Dashboard Template PDF The topics addressed in these templates are Productivity Of Employees, Coaching Increased, Productivity All the content presented in this PPT design is completely editable. Download it and make adjustments in color, background, font etc. as per your unique business setting.
-
Scorecard Measure Digital Shift Progress Financial Ppt Outline Influencers PDF
Presenting this set of slides with name scorecard measure digital shift progress financial ppt outline influencers pdf. This is a three stage process. The stages in this process are minimum, medium, maximum. This is a completely editable PowerPoint presentation and is available for immediate download. Download now and impress your audience.
-
Shipment Supplier Scorecard With Delivery Performance Rating Ppt Ideas Graphic Tips PDF
This graph or chart is linked to excel, and changes automatically based on data. Just left click on it and select Edit Data. Deliver an awe inspiring pitch with this creative Shipment Supplier Scorecard With Delivery Performance Rating Ppt Ideas Graphic Tips PDF bundle. Topics like On Time Performance, Actual Vs Target, Goods Days Hand can be discussed with this completely editable template. It is available for immediate download depending on the needs and requirements of the user.
-
HR Dashboard Indicating Weekly Professional Counselling Kpis Icons PDF
This slide illustrates HR career counselling dashboard. It provides information about hours of consultation, satisfaction rate, per consultant rate, popular counselors, etc. Showcasing this set of slides titled HR Dashboard Indicating Weekly Professional Counselling Kpis Icons PDF. The topics addressed in these templates are Specialization, Hours Of Consultation, Popular Counselors. All the content presented in this PPT design is completely editable. Download it and make adjustments in color, background, font etc. as per your unique business setting.
-
Supplier Relationship Management Supplier Performance Management KPI Dashboards Information PDF
This slide covers supplier performance management KPI dashboards along with metrics such as suppliers availability, supplier ratings, suppliers defence rate and type etc. Deliver an awe inspiring pitch with this creative Supplier Relationship Management Supplier Performance Management KPI Dashboards Information PDF bundle. Topics like Supplier Performance Management Kpi Dashboards can be discussed with this completely editable template. It is available for immediate download depending on the needs and requirements of the user.
-
Production Metrics Dashboard For Production Firm Rules PDF
This slide represents dashboard depicting production metrics for Production Firm. It covers product quantity, rework quantity, production cost, labor cost etc. Showcasing this set of slides titled Production Metrics Dashboard For Production Firm Rules PDF. The topics addressed in these templates are Equipment Efficiency, Product Availability, Production Cost. All the content presented in this PPT design is completely editable. Download it and make adjustments in color, background, font etc. as per your unique business setting.
-
Disadvantages Associated With Multi Brand Strategy Mockup PDF
This slide showcases disadvantages of multi brand strategy in market. Key drawbacks are consumer expectations, difficulty in brand management and overlapping of brands. Boost your pitch with our creative Disadvantages Associated With Multi Brand Strategy Mockup PDF. Deliver an awe inspiring pitch that will mesmerize everyone. Using these presentation templates you will surely catch everyones attention. You can browse the ppts collection on our website. We have researchers who are experts at creating the right content for the templates. So you do not have to invest time in any additional work. Just grab the template now and use them.
-
Financial Dashboard For Month Closing Income And Expenses Ideas PDF
This slide illustrates facts and figures related to month end financials of a corporation. It includes income statement graph, profit margin, income and expenditure graph etc.Showcasing this set of slides titled Financial Dashboard For Month Closing Income And Expenses Ideas PDF The topics addressed in these templates are Accounts Receivable, Income Statement, Expenditure All the content presented in this PPT design is completely editable. Download it and make adjustments in color, background, font etc. as per your unique business setting.
-
Sand Clock With Gold Coins Powerpoint Template
Our professionally designed business diagram is as an effective tool for communicating business ideas and strategies for corporate planning. This PPT slide contains sand clock with gold coins. Download this template to build interactive presentation.
-
Business Framework Education And Technology PowerPoint Presentation
This image slide displays TPACK (Technological Pedagogical And Content Knowledge) diagram. The framework describes the knowledge teachers need to have to effective integrate technology into their education. The knowledge domains in the framework are: content knowledge (CK), pedagogical knowledge (PK) and technological knowledge (TK). Use this image slide to enhance the quality of your presentations.
-
Two Data Driven Comparison Charts Powerpoint Slides
This PowerPoint template contains diagram of two data driven charts. You may use this PPT slide to depict strategic analysis for business. The color coding of this template is specifically designed to highlight you points.
-
Possible Target Audiences Ppt Diagrams
This is a possible target audiences ppt diagrams. This is a seven stage process. The stages in this process are growth, business, marketing, percentage.
-
Realestate Value With Money Balance Powerpoint Template
This power point template contains graphics of balancing scale with house on one side and money on other side. Display real estate value and money balance concepts in your presentation by using this creative diagram.
-
Four Linear Steps And Icons Powerpoint Slides
This PPT slide has been designed with four linear text boxes with icons. This PowerPoint template helps to exhibit process of business planning. Use this diagram slide to build an exclusive presentation.
-
Pie Charts For Percentage Value Analysis Powerpoint Slides
Our above PPT slide displays graphics of Pie charts. This PowerPoint template may be used to display percentage value analysis. Download this template to leave permanent impression on your audience.
-
Fishbone Diagrams PowerPoint Templates
FishBone Diagrams PowerPoint templates-These high quality powerpoint pre-designed slides and powerpoint templates have been carefully created by our professional team to help you impress your audience. All slides have been created and are 100% editable in powerpoint. Each and every property of any graphic - color, size, orientation, shading, outline etc. can be modified to help you build an effective powerpoint presentation. Any text can be entered at any point in the powerpoint template or slide. Simply DOWNLOAD, TYPE and PRESENT!
-
Globe With Four Points For Business Strategy Powerpoint Slides
This PowerPoint map template has been designed with graphics of globe and four points. Use this PPT slide to display global business strategy in your presentations. Any text can be entered at any point in the PowerPoint map slide.
-
Fishbone Analysis PowerPoint Templates
FishBone Analysis PowerPoint templates-These high quality powerpoint pre-designed slides and powerpoint templates have been carefully created by our professional team to help you impress your audience. All slides have been created and are 100% editable in powerpoint. Each and every property of any graphic - color, size, orientation, shading, outline etc. can be modified to help you build an effective powerpoint presentation. Any text can be entered at any point in the powerpoint template or slide. Simply DOWNLOAD, TYPE and PRESENT!
-
Table Chart For Business Plan Powerpoint Slides
Table chart has been used to design this power point template. This diagram may be used to display business plan. Download this template to leave permanent impression on your audience.
-
Businessman And Run Up Success PowerPoint Templates And PowerPoint Backgrounds 1011
Microsoft PowerPoint Template and Background with man moving up on graph chart business growth
-
Business Framework Flow Charts Examples PowerPoint Presentation
Graphic of flow chart has been used to decorate this PPT diagram. This business diagram contain the concept of business management. Use this PPT diagram for your business presentations.

 Home
Home 


