Financial analysis PowerPoint Templates
-
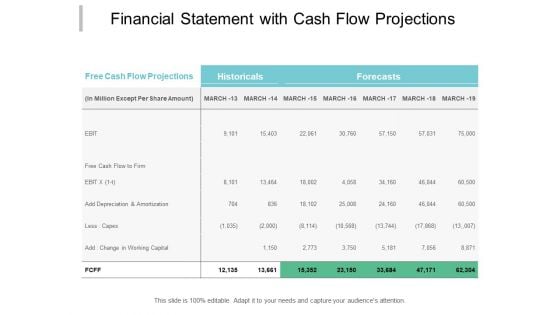
Financial Statement With Cash Flow Projections Ppt PowerPoint Presentation Infographics Brochure
Presenting this set of slides with name financial statement with cash flow projections ppt powerpoint presentation infographics brochure. The topics discussed in these slides are financial analysis, balance sheet, income statement. This is a completely editable PowerPoint presentation and is available for immediate download. Download now and impress your audience.
-
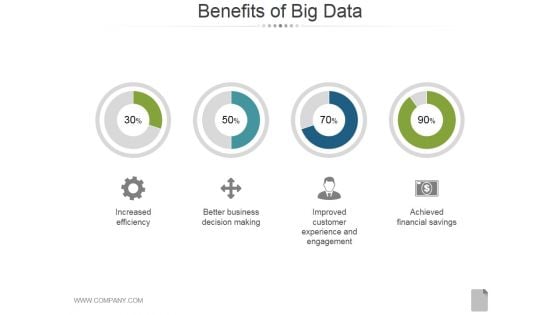
Benefits Of Big Data Ppt PowerPoint Presentation Inspiration
This is a benefits of big data ppt powerpoint presentation inspiration. This is a four stage process. The stages in this process are increased efficiency, better business decision making, improved customer experience and engagement, achieved financial savings.
-
Companies Clients I Worked For Ppt PowerPoint Presentation Sample
This is a companies clients i worked for ppt powerpoint presentation sample. This is a four stage process. The stages in this process are business, strategy, analysis, success, location, geography.
-
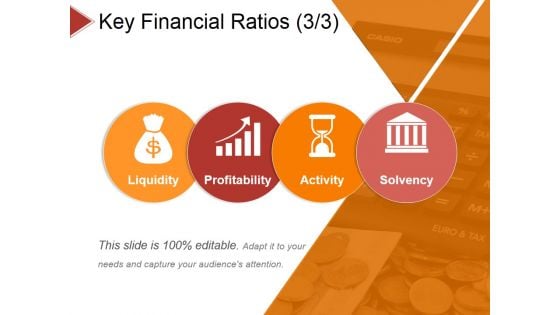
Key Financial Ratios Template 3 Ppt PowerPoint Presentation Summary Sample
This is a key financial ratios template 3 ppt powerpoint presentation summary sample. This is a four stage process. The stages in this process are liquidity, profitability, activity, solvency.
-
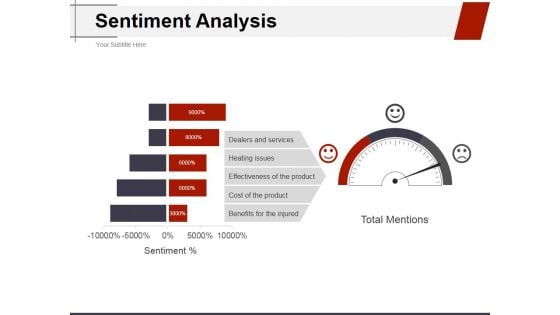
Sentiment Analysis Ppt PowerPoint Presentation Ideas Structure
This is a sentiment analysis ppt powerpoint presentation ideas structure. This is a three stage process. The stages in this process are dealers and services, heating issues, effectiveness of the product, cost of the product, benefits for the injured.
-
Executive Summary Market Overview Ppt PowerPoint Presentation Templates
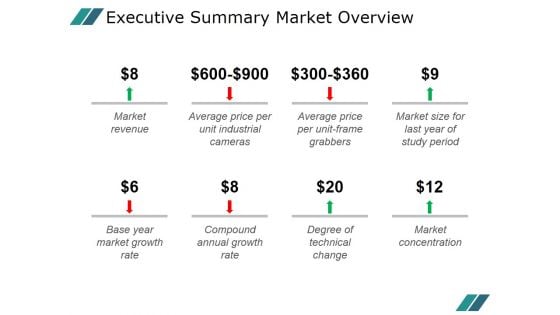
This is a executive summary market overview ppt powerpoint presentation templates. This is a eight stage process. The stages in this process are market revenue, average price per unit industrial cameras, average price per unit frame grabbers, market size for last year of study period, base year market growth rate, compound annual growth rate, degree of technical change.
-
Production Costs Template 1 Ppt PowerPoint Presentation Layout
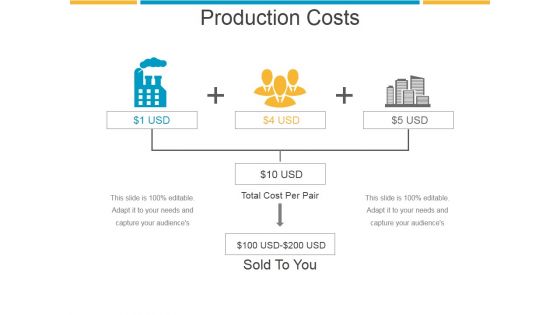
This is a production costs template 1 ppt powerpoint presentation layout. This is a two stage process. The stages in this process are cots, product, business, marketing, strategy.
-
Idea Screening Level 6 Will The Product Be Profitable Ppt PowerPoint Presentation Ideas
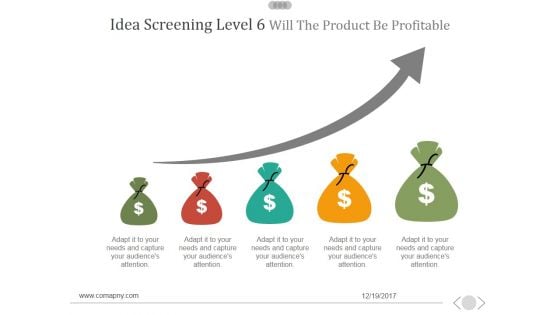
This is a idea screening level 6 will the product be profitable ppt powerpoint presentation ideas. This is a five stage process. The stages in this process are business, marketing, success, currency, finance.
-
Hiring Plan Ppt PowerPoint Presentation Pictures Graphic Images
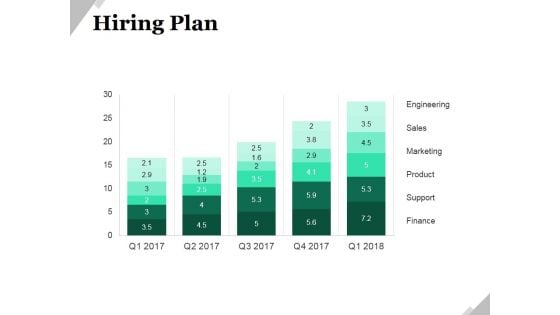
This is a hiring plan ppt powerpoint presentation pictures graphic images. This is a five stage process. The stages in this process are engineering, sales, marketing, product, support, finance.
-
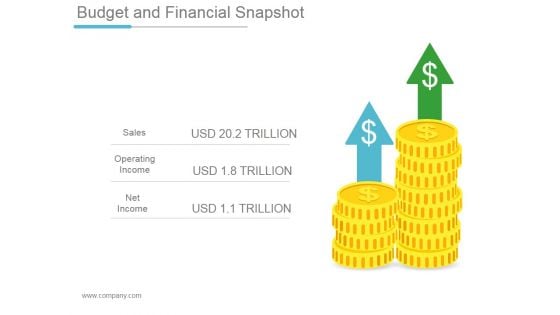
Budget And Financial Snapshot Ppt PowerPoint Presentation Example
This is a budget and financial snapshot ppt powerpoint presentation example. This is a two stage process. The stages in this process are sales, operating income, net income.
-
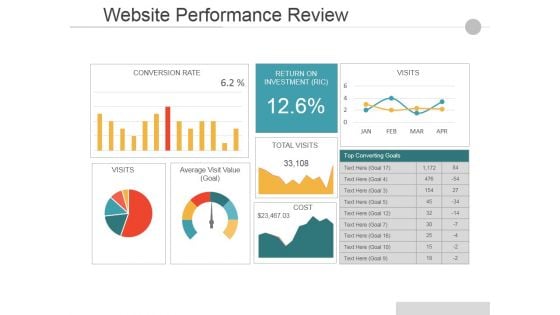
Website Performance Review Template Ppt PowerPoint Presentation Show Inspiration
This is a website performance review template ppt powerpoint presentation show inspiration. This is a six stage process. The stages in this process are average visit time, organic branded, conversion rate, site consumption time, online transaction, traffic source.
-
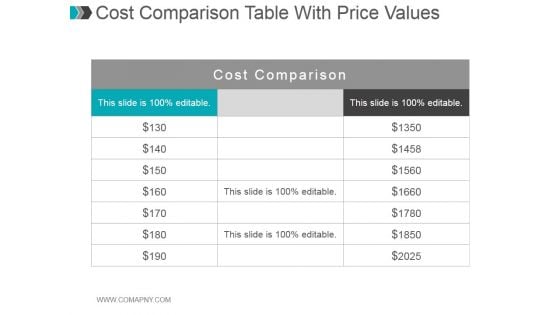
Cost Comparison Table With Price Values Ppt PowerPoint Presentation Graphics
This is a cost comparison table with price values ppt powerpoint presentation graphics. This is a three stage process. The stages in this process are cost comparison.
-
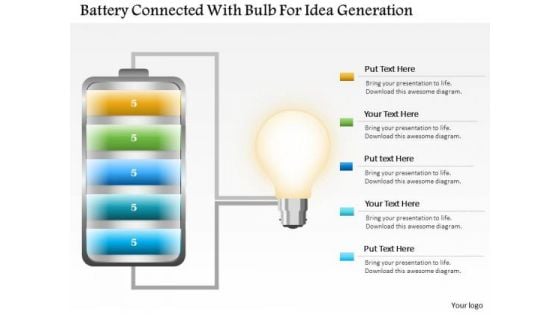
Business Diagram Battery Connected With Bulb For Idea Generation PowerPoint Slide
This business slide displays battery icon connected with bulb. This diagram is a data visualization tool that gives you a simple way to present statistical information. This slide helps your audience examine and interpret the data you present.
-
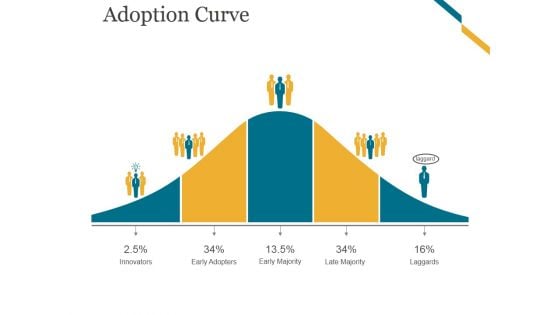
Adoption Curve Ppt PowerPoint Presentation Designs
This is a adoption curve ppt powerpoint presentation designs. This is a five stage process. The stages in this process are innovators, early adopters, early majority, late majority, laggards.
-
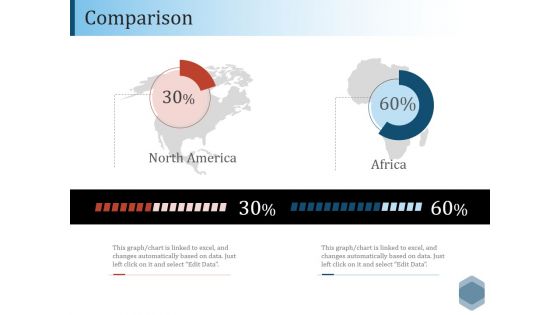
Comparison Ppt PowerPoint Presentation Summary Slideshow
This is a comparison ppt powerpoint presentation summary slideshow. This is a two stage process. The stages in this process are north america, africa, compare, finance, analysis.
-
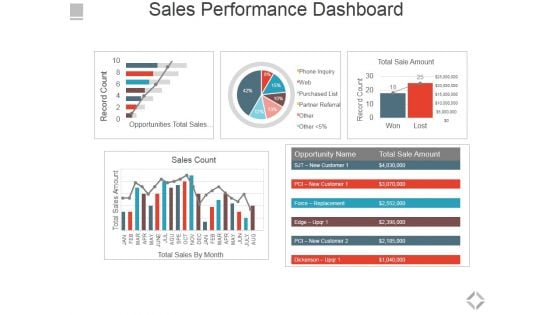
Sales Performance Dashboard Ppt PowerPoint Presentation File Graphics Pictures
This is a sales performance dashboard ppt powerpoint presentation file graphics pictures. This is a five stage process. The stages in this process are total sales by month, sales count, opportunities total sales by probability, total sale amount.
-
Business Diagram Hour Glass With 3d Man And Icons PowerPoint Slide
This diagram displays 3d man with hour glass and icons. This diagram contains concept of communication and technology. Use this diagram to display business process workflows in any presentations.
-
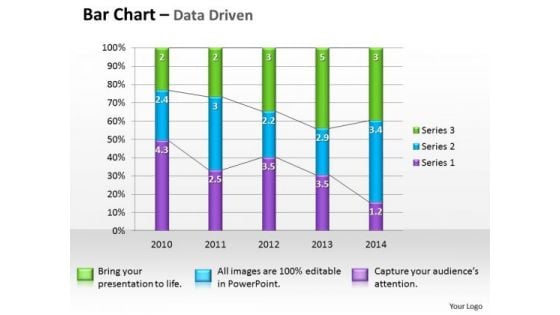
Microsoft Excel Data Analysis Bar Graph PowerPoint Templates
Double The Impact With Our microsoft excel data analysis bar graph Powerpoint Templates . Your Thoughts Will Have An Imposing Effect.
-
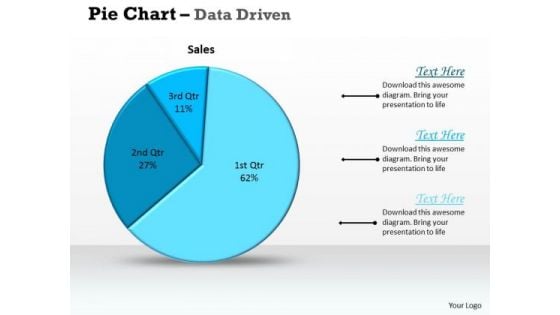
Data Analysis Excel Driven Pie Chart For Sales Process PowerPoint Slides Templates
Deliver The Right Dose With Our data analysis excel driven pie chart for sales process powerpoint slides Templates . Your Ideas Will Get The Correct Illumination.
-
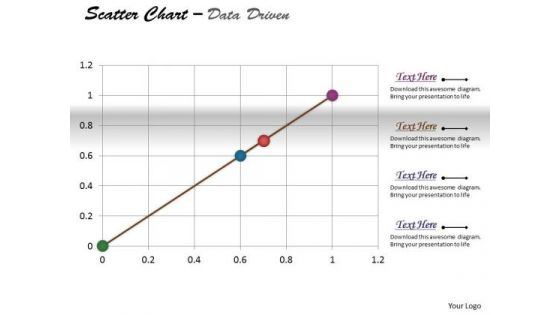
Excel Data Analysis Data Methods Statistical Tool Survey Driven PowerPoint Slides Templates
Be The Duke Of The Dais With Our excel data analysis data methods statistical tool survey driven powerpoint slides Templates . Acquire Royalty Status With Your Thoughts.
-
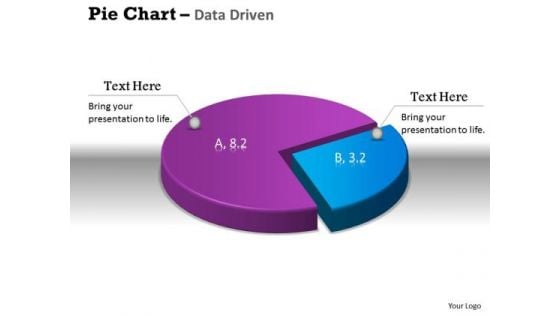
Data Analysis Excel 3d Pie Chart Shows Relative Size Of PowerPoint Templates
Get The Doers Into Action. Activate Them With Our data analysis excel 3d pie chart shows relative size of Powerpoint Templates.
-
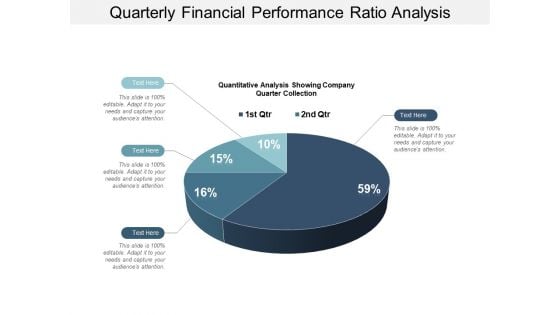
Quarterly Financial Performance Ratio Analysis Ppt PowerPoint Presentation Model Format Ideas
This is a quarterly financial performance ratio analysis ppt powerpoint presentation model format ideas. This is a four stage process. The stages in this process are financial analysis, quantitative, statistical modelling.
-
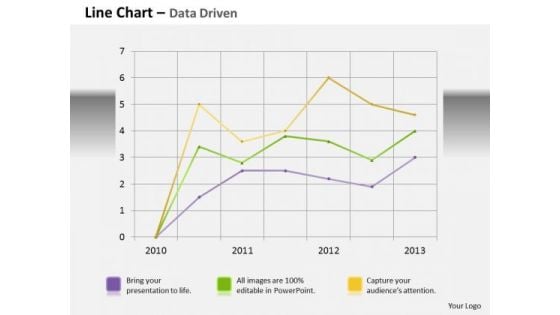
Data Analysis Template Driven Line Chart Business Graph PowerPoint Slides Templates
Bottle Your Thoughts In Our data analysis template driven line chart business graph powerpoint slides Templates . Pass It Around For Your Audience To Sip.
-
Project Health Card Ppt PowerPoint Presentation Icon Grid
This is a project health card ppt powerpoint presentation icon grid. This is a six stage process. The stages in this process are cost, planning, table, project report, data management.
-
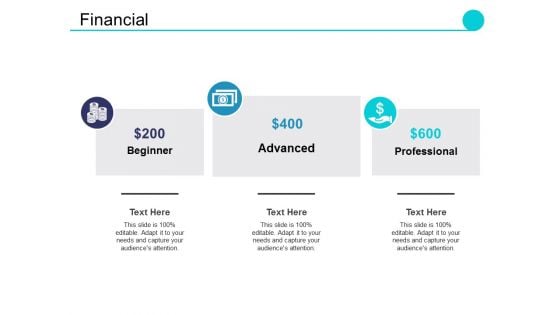
Financial Ppt PowerPoint Presentation Infographic Template Infographics
This is a financial ppt powerpoint presentation infographic template infographics. This is a three stage process. The stages in this process are beginner, advanced, professional.
-
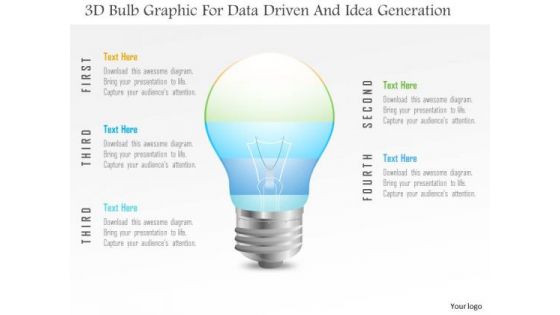
Business Diagram 3d Bulb Graphic For Data Driven And Idea Generation PowerPoint Slide
This Power Point template has been designed with 3d bulb graphic. Use this slide to represent technology idea and strategy concepts. Download this diagram for your business presentations and get exclusive comments on your efforts.
-
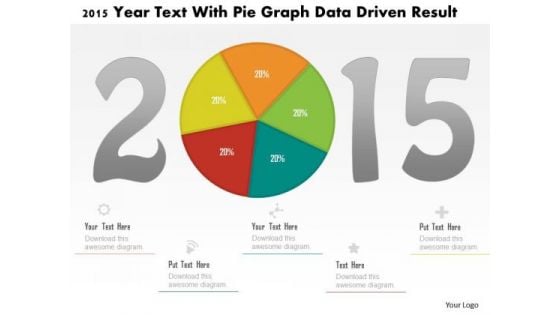
Business Diagram 2015 Year Text With Pie Graph Data Driven Result PowerPoint Slide
This business diagram displays 2015 year numbers with pie chart. This diagram is suitable to display business strategy for year 2015. Download this professional slide to present information in an attractive manner
-
Revenue Model Template Ppt PowerPoint Presentation Ideas Structure
This is a revenue model template ppt powerpoint presentation ideas structure. This is a six stage process. The stages in this process are icons, marketing, strategy, planning, shapes.
-
Business Diagram Three Heads With Pie For Data Driven Technology PowerPoint Slide
This business diagram displays three human faces with pie charts. This Power Point template has been designed to compare and present business data. You may use this diagram to impart professional appearance to your presentations.
-
Competitive Intelligence Ppt PowerPoint Presentation Microsoft
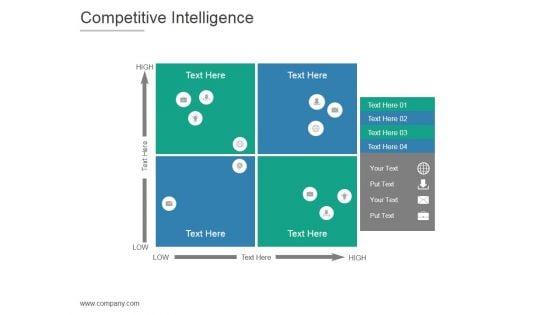
This is a competitive intelligence ppt powerpoint presentation microsoft. This is a four stage process. The stages in this process are high, low.
-
Financial Projection Graph Template 2 Ppt PowerPoint Presentation Graphics
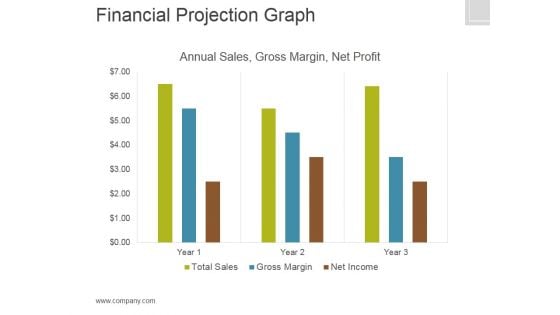
This is a financial projection graph template 2 ppt powerpoint presentation graphics. This is a three stage process. The stages in this process are annual sales, gross margin, net profit, finance.
-
Our Research Results Ppt PowerPoint Presentation Model
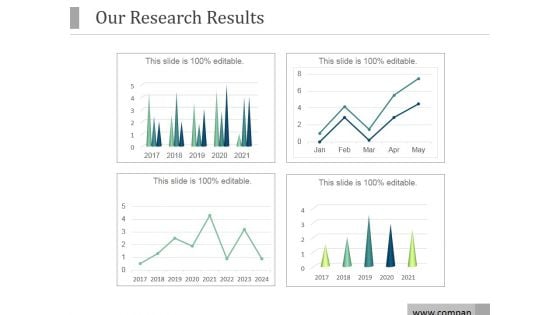
This is a our research results ppt powerpoint presentation model. This is a four stage process. The stages in this process are research, financials, business, marketing, management, success.
-
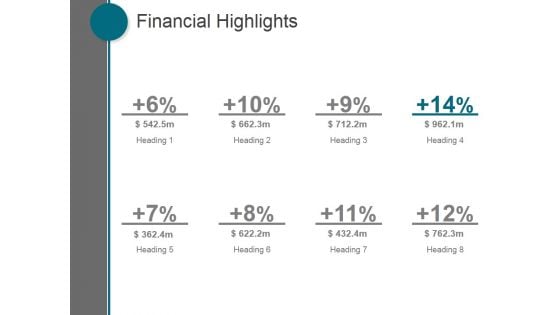
Financial Highlights Ppt PowerPoint Presentation Visual Aids
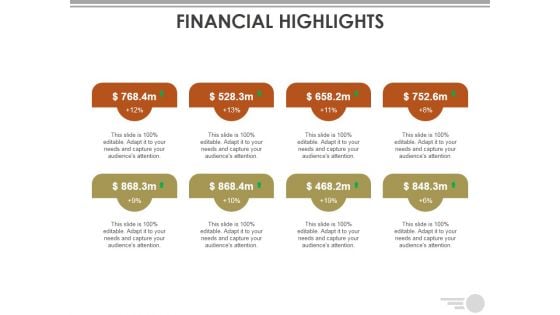
This is a financial highlights ppt powerpoint presentation visual aids. This is a eight stage process. The stages in this process are business, marketing, management, finance, strategy.
-
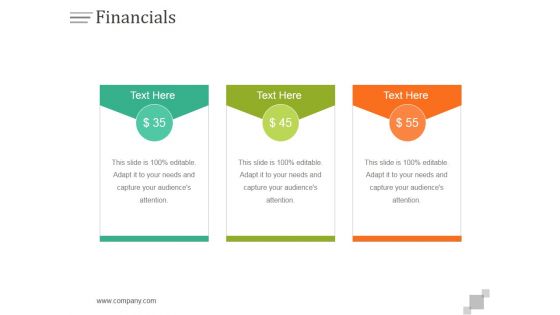
Financials Ppt PowerPoint Presentation Diagrams
This is a financials ppt powerpoint presentation diagrams. This is a three stage process. The stages in this process are business, finance, marketing, strategy, investment, success.
-
Business Model Template 2 Ppt PowerPoint Presentation Ideas
This is a business model template 2 ppt powerpoint presentation ideas. This is a three stage process. The stages in this process are business, marketing, management, finance, planning.
-
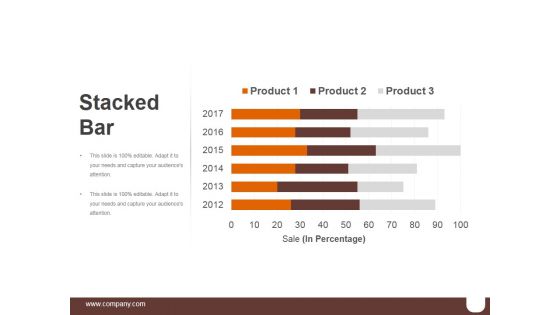
Stacked Bar Ppt PowerPoint Presentation Model
This is a stacked bar ppt powerpoint presentation model. This is a six stage process. The stages in this process are finance, analysis, business, marketing, strategy.
-
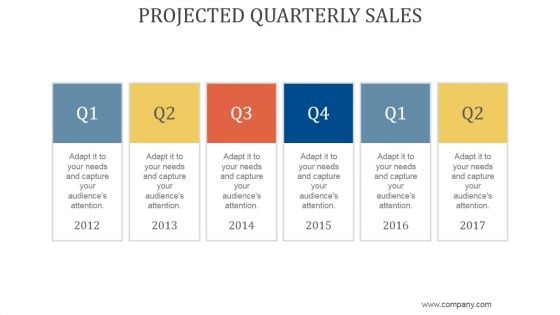
Projected Quarterly Sales Ppt PowerPoint Presentation Files
This is a projected quarterly sales ppt powerpoint presentation files. This is a six stage process. The stages in this process are business, strategy, marketing, analysis, liner process.
-
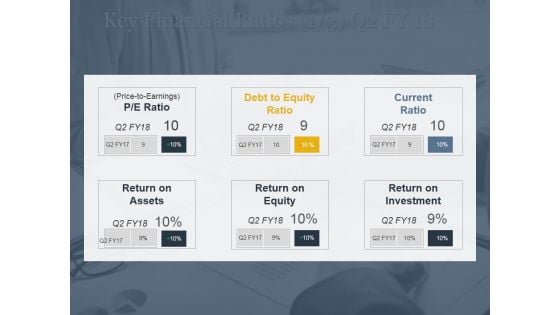
Key Financial Ratios Ppt PowerPoint Presentation Model Objects
This is a key financial ratios ppt powerpoint presentation model objects. This is a three stage process. The stages in this process are p e ratio, price to earnings, debt, equity ratio, current, ratio.
-
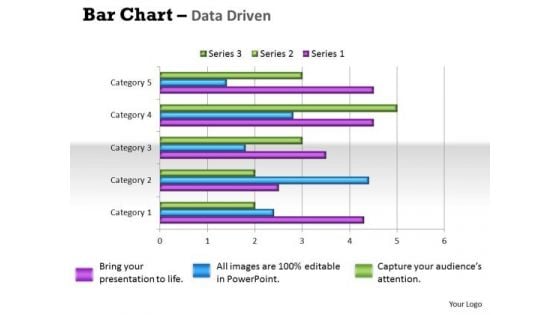
Quantitative Data Analysis Bar Chart For Different Categories PowerPoint Templates
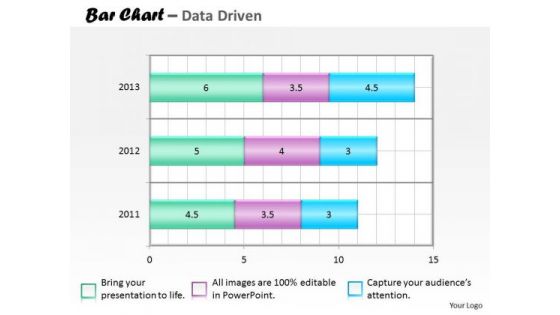
Make Some Dough With Our quantitative data analysis bar chart for different categories Powerpoint Templates . Your Assets Will Rise Significantly.
-
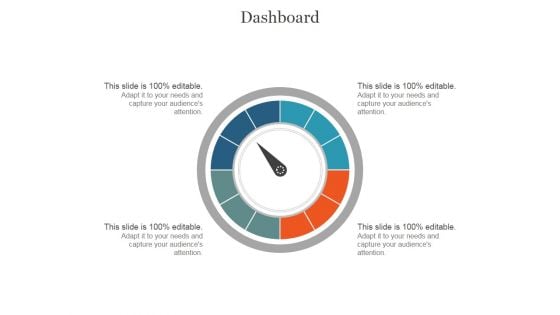
Dashboard Ppt PowerPoint Presentation Portfolio
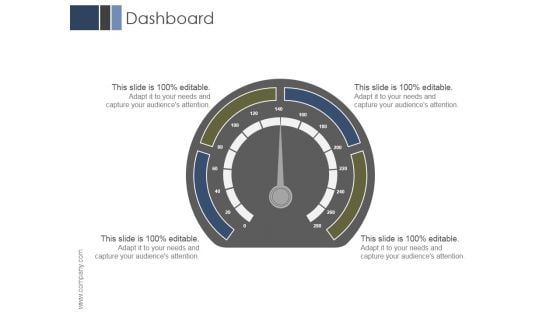
This is a dashboard ppt powerpoint presentation portfolio. This is a four stage process. The stages in this process are business, marketing, management, dashboard, finance.
-
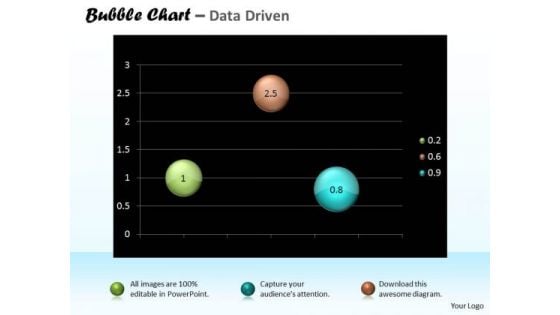
Data Analysis Excel Bubble Chart For Business Tasks PowerPoint Templates
Doll Up Your Thoughts With Our data analysis excel bubble chart for business tasks Powerpoint Templates. They Will Make A Pretty Picture.
-
Revenue Model Ppt PowerPoint Presentation Visual Aids
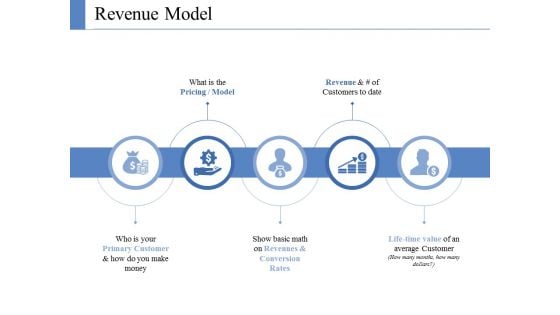
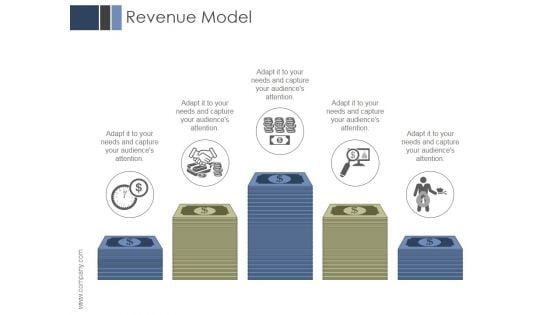
This is a revenue model ppt powerpoint presentation visual aids. This is a five stage process. The stages in this process are business, marketing, management, finance, planning.
-
Data Analysis Excel 3d Process Variation Column Chart PowerPoint Templates
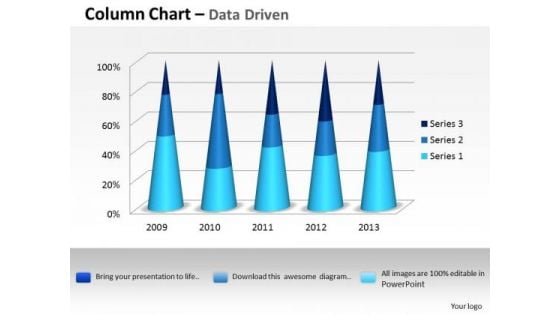
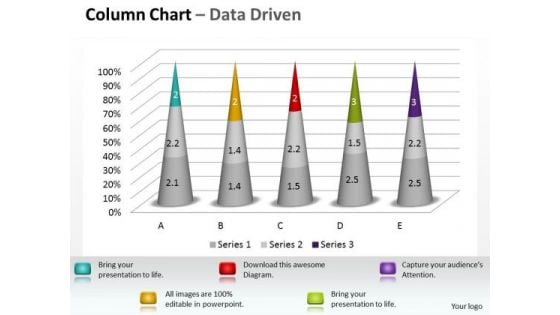
Put In A Dollop Of Our data analysis excel 3d process variation column chart Powerpoint Templates. Give Your Thoughts A Distinctive Flavor.
-
Financial Statement Ppt PowerPoint Presentation Guide
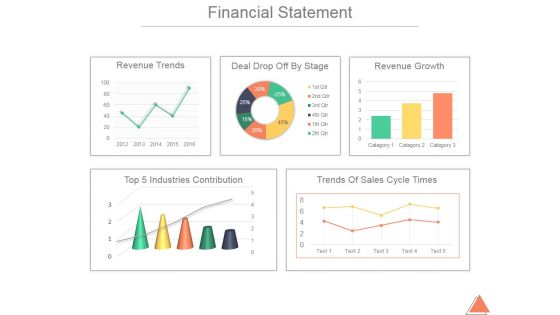
This is a financial statement ppt powerpoint presentation guide. This is a five stage process. The stages in this process are top 5 industries contribution, trends of sales cycle times, revenue trends, deal drop off by stage, revenue growth.
-
Change Curve Ppt PowerPoint Presentation Background Designs
This is a change curve ppt powerpoint presentation background designs. This is a five stage process. The stages in this process are satisfaction, denial, exploration, hope, commitment.
-
Business Performance Comparison Ppt PowerPoint Presentation Examples
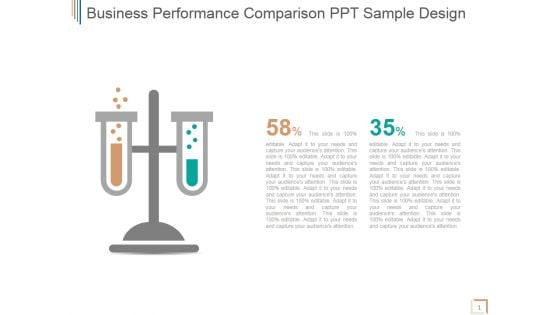
This is a business performance comparison ppt powerpoint presentation examples. This is a two stage process. The stages in this process are business, performance, comparison, strategy, marketing.
-
Comparison Ppt PowerPoint Presentation Icon Information
This is a comparison ppt powerpoint presentation icon information. This is a three stage process. The stages in this process are business, marketing, comparison, finance, management.
-
Dashboard Ppt PowerPoint Presentation Graphics
This is a dashboard ppt powerpoint presentation graphics. This is a four stage process. The stages in this process are business, marketing, management, dashboard, analysis.
-
Financial Highlights Ppt PowerPoint Presentation Slides Example File
This is a financial highlights ppt powerpoint presentation slides example file. This is a three stage process. The stages in this process are business, marketing, finance, analysis, strategy.
-
Marketing Roadmap Ppt PowerPoint Presentation Portfolio Examples
This is a marketing roadmap ppt powerpoint presentation portfolio examples. This is a seven stage process. The stages in this process are marketing roadmap, business, marketing, success, strategy, management.
-
Crm Dashboard Intranet Dashboard Ppt PowerPoint Presentation Outline Professional
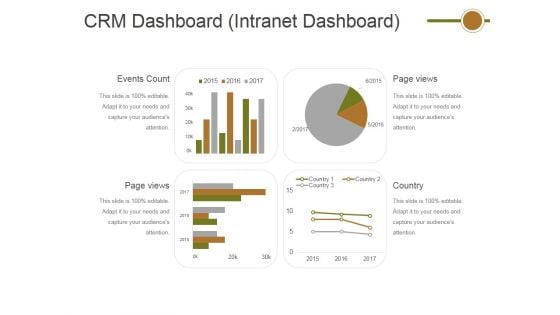
This is a crm dashboard intranet dashboard ppt powerpoint presentation outline professional. This is a four stage process. The stages in this process are events count, page views, page views, country.
-
Financial Data Analysis Bar Chart For Collection Of PowerPoint Templates
Our financial data analysis bar chart for collection of Powerpoint Templates Team Are A Dogged Lot. They Keep At It Till They Get It Right.
-
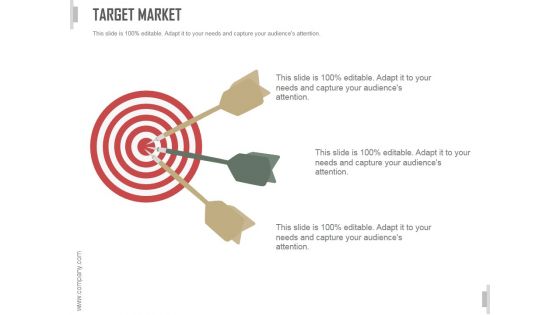
Target Market Ppt PowerPoint Presentation Backgrounds
This is a target market ppt powerpoint presentation backgrounds. This is a two stage process. The stages in this process are business, strategy, marketing, analysis, target market share, finance.
-
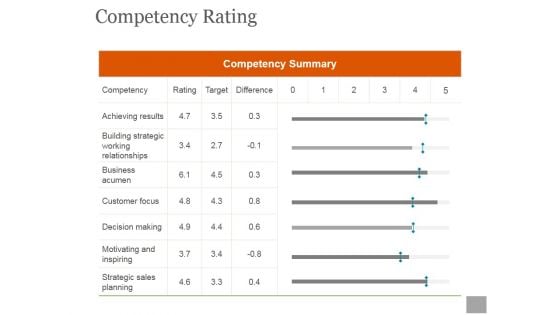
Competency Rating Ppt PowerPoint Presentation Designs
This is a competency rating ppt powerpoint presentation designs. This is a eight stage process. The stages in this process are managerial efficiency, resource planning, develop and implements, financial accounting, financial analysis.
-
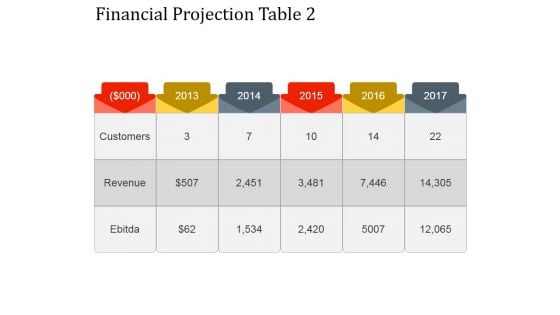
Financial Projection Table 2 Ppt PowerPoint Presentation Layouts
This is a financial projection table 2 ppt powerpoint presentation layouts. This is a five stage process. The stages in this process are customers, revenue, ebitda.
-
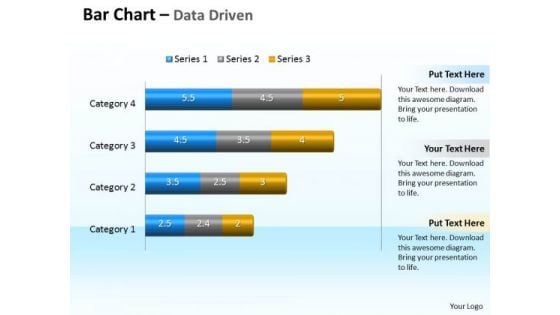
Data Analysis Programs 3d Bar Chart To Compare Categories PowerPoint Templates
Discover Decisive Moments With Our data analysis programs 3d bar chart to compare categories Powerpoint Templates . They Help Make That Crucial Difference.
-
Comparison Ppt PowerPoint Presentation Outline
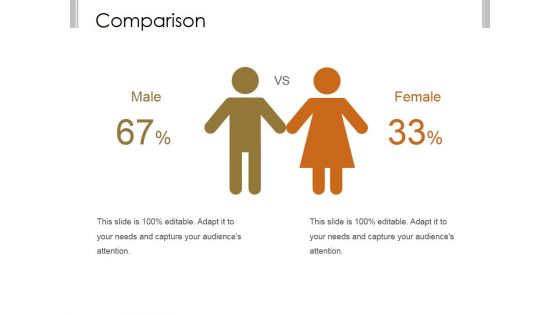
This is a comparison ppt powerpoint presentation outline. This is a two stage process. The stages in this process are business, strategy, marketing, analysis, finance, compare.
-
Staff Acquisition Cost Per Hire Ppt PowerPoint Presentation Show Microsoft
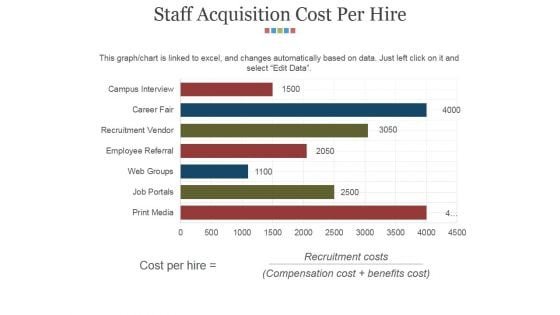
This is a staff acquisition cost per hire ppt powerpoint presentation show microsoft. This is a seven stage process. The stages in this process are recruitment costs, business, marketing, finance, success.
-
Key Driver Analytics Template Ppt PowerPoint Presentation Examples
This is a key driver analytics template ppt powerpoint presentation examples. This is a four stage process. The stages in this process are business, strategy, marketing, analysis, success, finance.
-
Excel Data Analysis Data Tools Data Methods Statistical Tool Survey 3d Chart PowerPoint Templates
Dumbfound Them With Our excel data analysis data tools data methods statistical tool survey 3d chart Powerpoint Templates . Your Audience Will Be Astounded With Your Ideas.

 Home
Home 


