Financial analysis
-
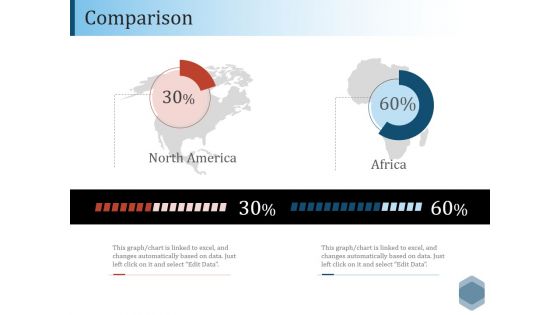
Comparison Ppt PowerPoint Presentation Summary Slideshow
This is a comparison ppt powerpoint presentation summary slideshow. This is a two stage process. The stages in this process are north america, africa, compare, finance, analysis.
-
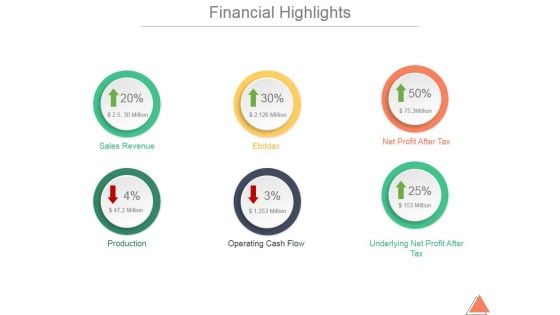
Financial Highlights Template 2 Ppt PowerPoint Presentation Inspiration
This is a financial highlights template 2 ppt powerpoint presentation inspiration. This is a six stage process. The stages in this process are sales revenue, ebitdax, net profit after tax, production, operating cash flow, underlying net profit, after tax.
-
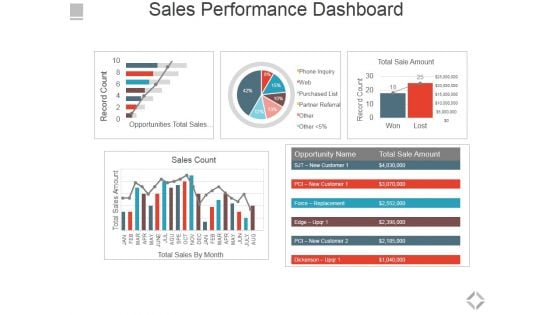
Sales Performance Dashboard Ppt PowerPoint Presentation File Graphics Pictures
This is a sales performance dashboard ppt powerpoint presentation file graphics pictures. This is a five stage process. The stages in this process are total sales by month, sales count, opportunities total sales by probability, total sale amount.
-
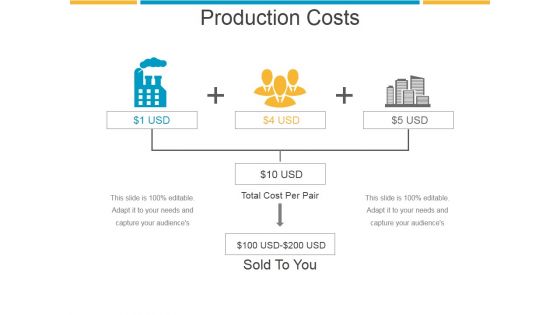
Production Costs Template 1 Ppt PowerPoint Presentation Layout
This is a production costs template 1 ppt powerpoint presentation layout. This is a two stage process. The stages in this process are cots, product, business, marketing, strategy.
-
Business Diagram Hour Glass With 3d Man And Icons PowerPoint Slide
This diagram displays 3d man with hour glass and icons. This diagram contains concept of communication and technology. Use this diagram to display business process workflows in any presentations.
-
Companies Clients I Worked For Ppt PowerPoint Presentation Sample
This is a companies clients i worked for ppt powerpoint presentation sample. This is a four stage process. The stages in this process are business, strategy, analysis, success, location, geography.
-
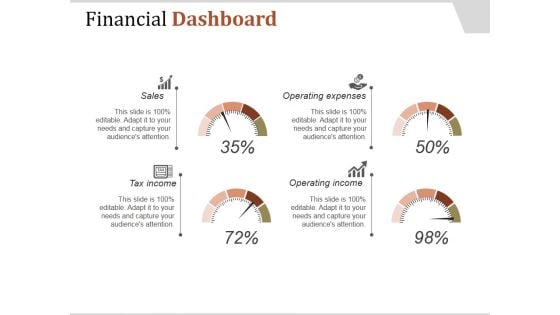
Financial Dashboard Ppt PowerPoint Presentation Influencers
This is a financial dashboard ppt powerpoint presentation influencers. This is a four stage process. The stages in this process are sales, tax income, operating income, operating expenses.
-
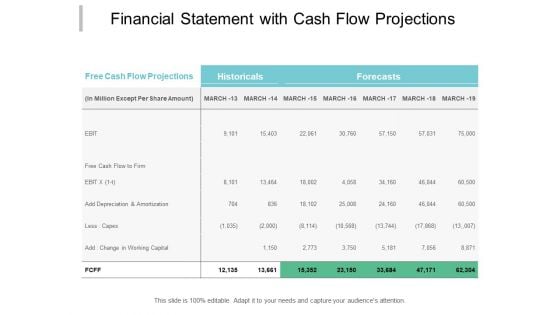
Financial Statement With Cash Flow Projections Ppt PowerPoint Presentation Infographics Brochure
Presenting this set of slides with name financial statement with cash flow projections ppt powerpoint presentation infographics brochure. The topics discussed in these slides are financial analysis, balance sheet, income statement. This is a completely editable PowerPoint presentation and is available for immediate download. Download now and impress your audience.
-
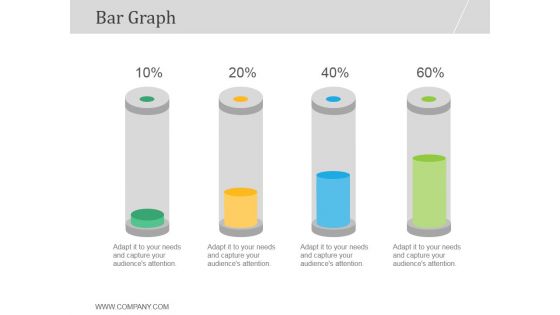
Bar Graph Ppt PowerPoint Presentation Good
This is a bar graph ppt powerpoint presentation good. This is a four stage process. The stages in this process are bar graph, growth, business, marketing, management, percentage.
-
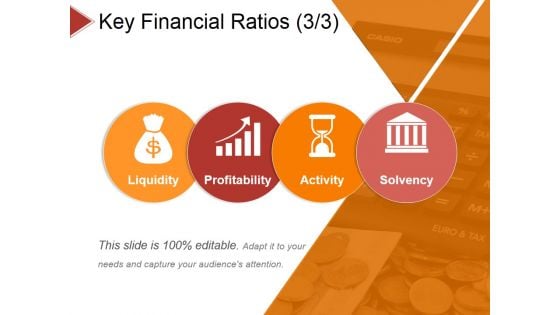
Key Financial Ratios Template 3 Ppt PowerPoint Presentation Summary Sample
This is a key financial ratios template 3 ppt powerpoint presentation summary sample. This is a four stage process. The stages in this process are liquidity, profitability, activity, solvency.
-
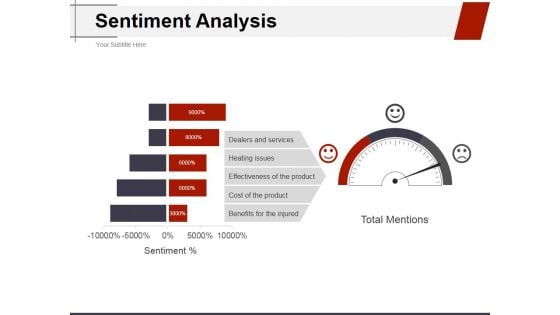
Sentiment Analysis Ppt PowerPoint Presentation Ideas Structure
This is a sentiment analysis ppt powerpoint presentation ideas structure. This is a three stage process. The stages in this process are dealers and services, heating issues, effectiveness of the product, cost of the product, benefits for the injured.
-
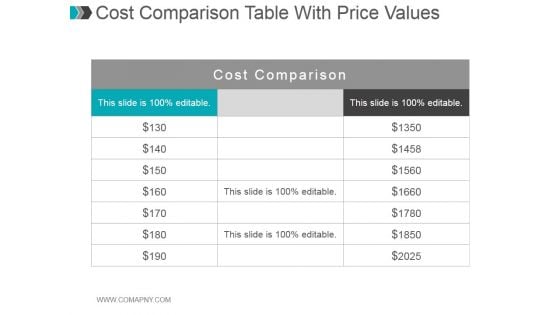
Cost Comparison Table With Price Values Ppt PowerPoint Presentation Graphics
This is a cost comparison table with price values ppt powerpoint presentation graphics. This is a three stage process. The stages in this process are cost comparison.
-
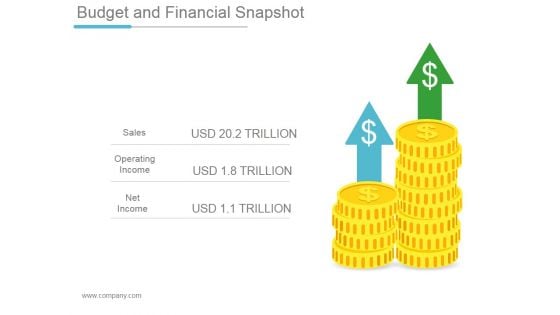
Budget And Financial Snapshot Ppt PowerPoint Presentation Example
This is a budget and financial snapshot ppt powerpoint presentation example. This is a two stage process. The stages in this process are sales, operating income, net income.
-
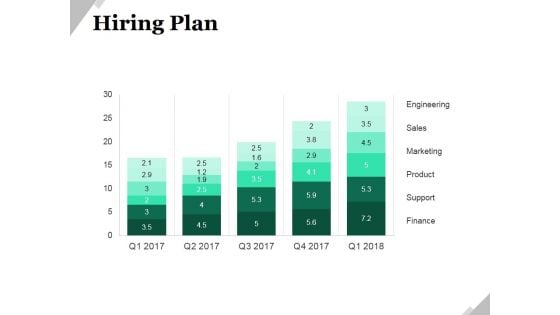
Hiring Plan Ppt PowerPoint Presentation Pictures Graphic Images
This is a hiring plan ppt powerpoint presentation pictures graphic images. This is a five stage process. The stages in this process are engineering, sales, marketing, product, support, finance.
-
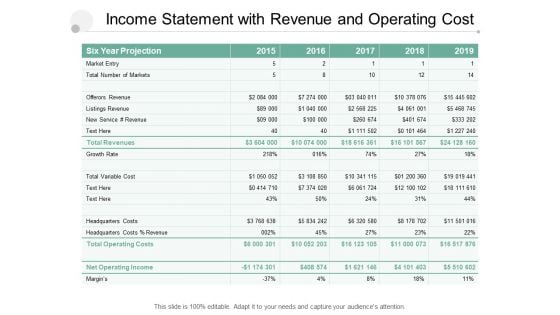
Income Statement With Revenue And Operating Cost Ppt PowerPoint Presentation Inspiration Guidelines
Presenting this set of slides with name income statement with revenue and operating cost ppt powerpoint presentation inspiration guidelines. The topics discussed in these slides are financial analysis, balance sheet, income statement. This is a completely editable PowerPoint presentation and is available for immediate download. Download now and impress your audience.
-
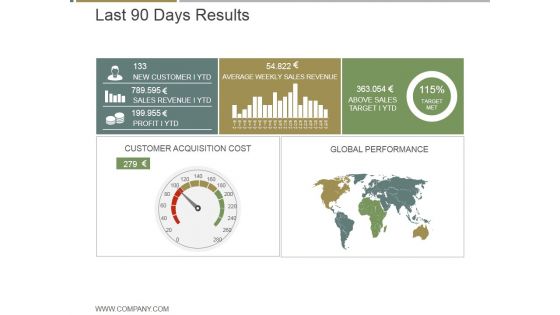
Last 90 Days Results Ppt PowerPoint Presentation Graphics
This is a last 90 days results ppt powerpoint presentation graphics. This is a five stage process. The stages in this process are new customer ytd, average weekly sales revenue, above sales target i ytd, customer acquisition cost, global performance.
-
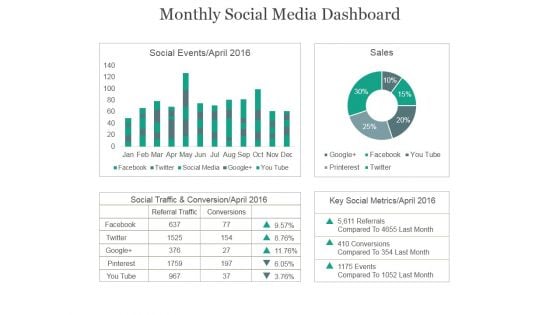
Monthly Social Media Dashboard Ppt PowerPoint Presentation Example 2015
This is a monthly social media dashboard ppt powerpoint presentation example 2015. This is a four stage process. The stages in this process are social events, sales, social traffic, conservation, key social metrics.
-
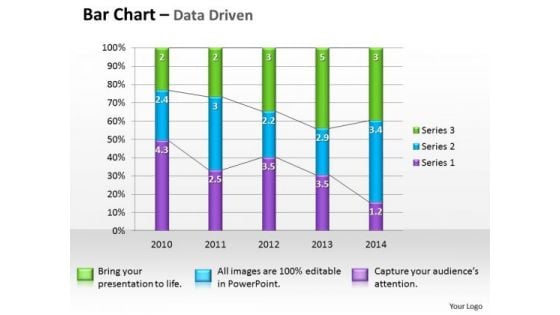
Microsoft Excel Data Analysis Bar Graph PowerPoint Templates
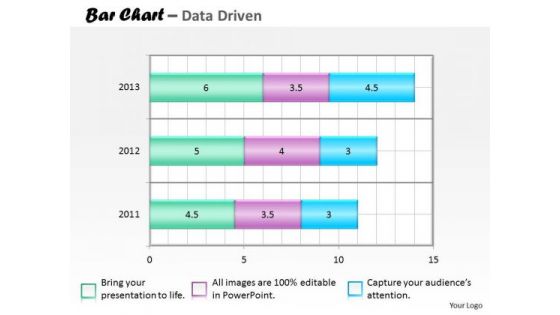
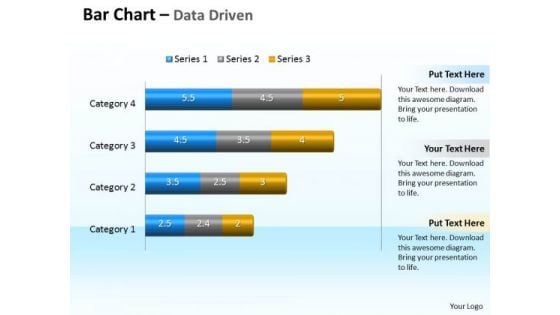
Double The Impact With Our microsoft excel data analysis bar graph Powerpoint Templates . Your Thoughts Will Have An Imposing Effect.
-
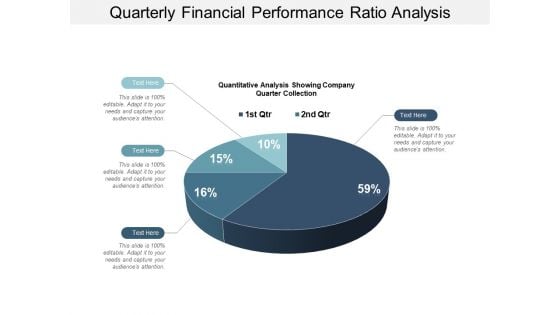
Quarterly Financial Performance Ratio Analysis Ppt PowerPoint Presentation Model Format Ideas
This is a quarterly financial performance ratio analysis ppt powerpoint presentation model format ideas. This is a four stage process. The stages in this process are financial analysis, quantitative, statistical modelling.
-
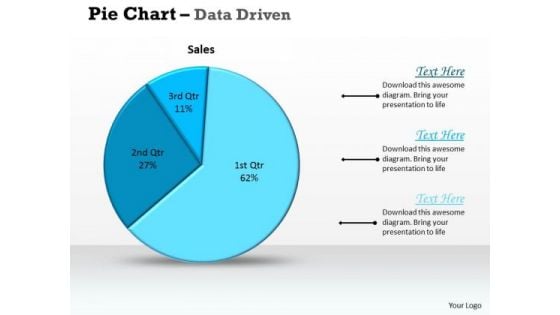
Data Analysis Excel Driven Pie Chart For Sales Process PowerPoint Slides Templates
Deliver The Right Dose With Our data analysis excel driven pie chart for sales process powerpoint slides Templates . Your Ideas Will Get The Correct Illumination.
-
Excel Data Analysis Data Methods Statistical Tool Survey Driven PowerPoint Slides Templates
Be The Duke Of The Dais With Our excel data analysis data methods statistical tool survey driven powerpoint slides Templates . Acquire Royalty Status With Your Thoughts.
-
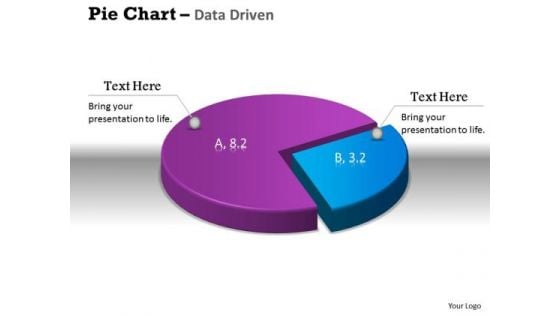
Data Analysis Excel 3d Pie Chart Shows Relative Size Of PowerPoint Templates
Get The Doers Into Action. Activate Them With Our data analysis excel 3d pie chart shows relative size of Powerpoint Templates.
-
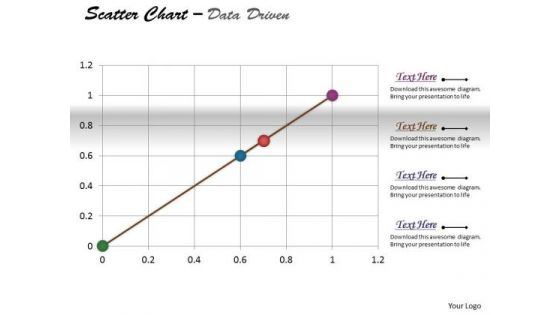
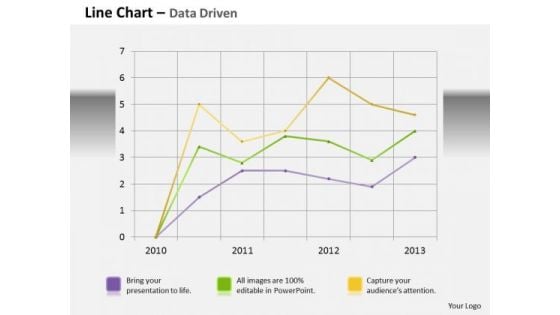
Data Analysis Template Driven Line Chart Business Graph PowerPoint Slides Templates
Bottle Your Thoughts In Our data analysis template driven line chart business graph powerpoint slides Templates . Pass It Around For Your Audience To Sip.
-
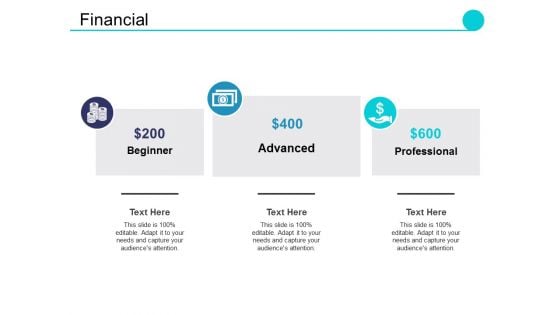
Financial Ppt PowerPoint Presentation Infographic Template Infographics
This is a financial ppt powerpoint presentation infographic template infographics. This is a three stage process. The stages in this process are beginner, advanced, professional.
-
Business Diagram Three Heads With Pie For Data Driven Technology PowerPoint Slide
This business diagram displays three human faces with pie charts. This Power Point template has been designed to compare and present business data. You may use this diagram to impart professional appearance to your presentations.
-
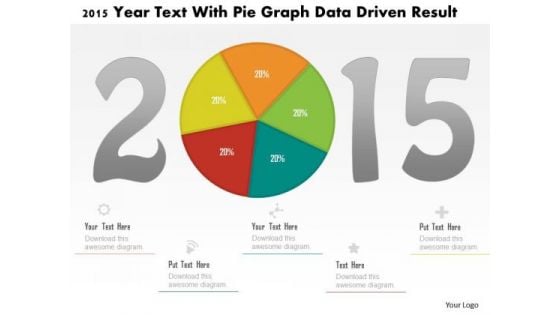
Business Diagram 2015 Year Text With Pie Graph Data Driven Result PowerPoint Slide
This business diagram displays 2015 year numbers with pie chart. This diagram is suitable to display business strategy for year 2015. Download this professional slide to present information in an attractive manner
-
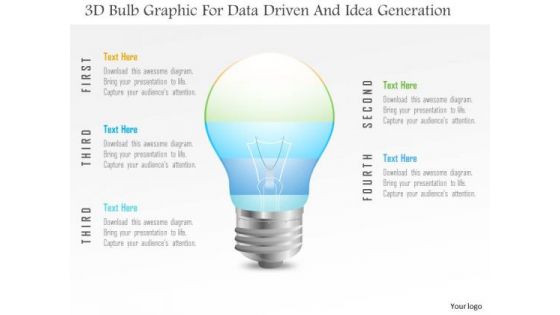
Business Diagram 3d Bulb Graphic For Data Driven And Idea Generation PowerPoint Slide
This Power Point template has been designed with 3d bulb graphic. Use this slide to represent technology idea and strategy concepts. Download this diagram for your business presentations and get exclusive comments on your efforts.
-
Revenue Model Template Ppt PowerPoint Presentation Ideas Structure
This is a revenue model template ppt powerpoint presentation ideas structure. This is a six stage process. The stages in this process are icons, marketing, strategy, planning, shapes.
-
Project Health Card Ppt PowerPoint Presentation Icon Grid
This is a project health card ppt powerpoint presentation icon grid. This is a six stage process. The stages in this process are cost, planning, table, project report, data management.
-
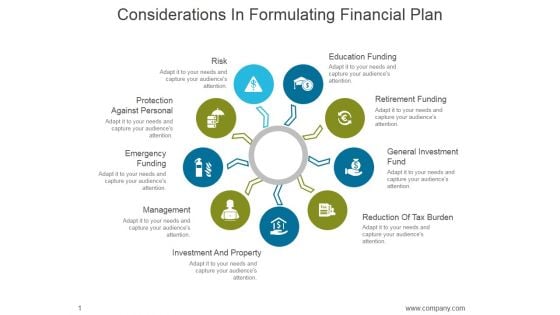
Considerations In Formulating Financial Plan Ppt PowerPoint Presentation Design Templates
This is a considerations in formulating financial plan ppt powerpoint presentation design templates. This is a nine stage process. The stages in this process are education funding, retirement funding, general investment fund, reduction of tax burden, investment and property, management, emergency funding, protection against personal, risk.
-
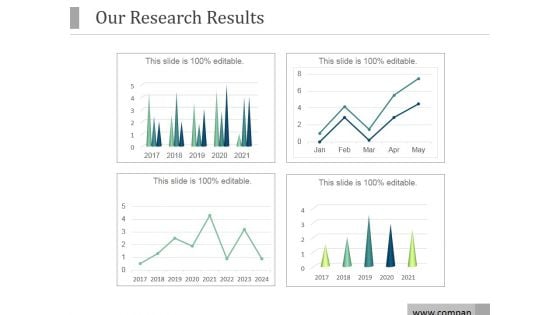
Our Research Results Ppt PowerPoint Presentation Model
This is a our research results ppt powerpoint presentation model. This is a four stage process. The stages in this process are research, financials, business, marketing, management, success.
-
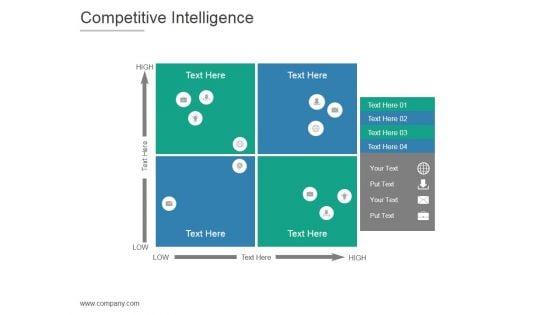
Competitive Intelligence Ppt PowerPoint Presentation Microsoft
This is a competitive intelligence ppt powerpoint presentation microsoft. This is a four stage process. The stages in this process are high, low.
-
Financial Data Analysis Bar Chart For Collection Of PowerPoint Templates
Our financial data analysis bar chart for collection of Powerpoint Templates Team Are A Dogged Lot. They Keep At It Till They Get It Right.
-
Change Curve Ppt PowerPoint Presentation Background Designs
This is a change curve ppt powerpoint presentation background designs. This is a five stage process. The stages in this process are satisfaction, denial, exploration, hope, commitment.
-
Excel Data Analysis Data Tools Data Methods Statistical Tool Survey 3d Chart PowerPoint Templates
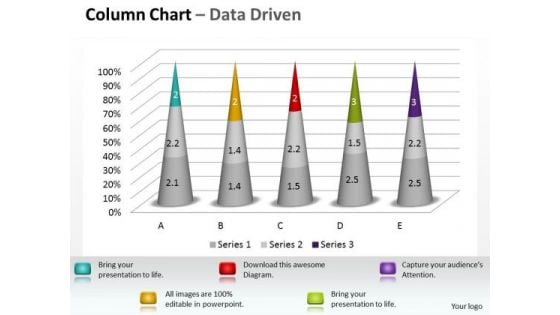
Dumbfound Them With Our excel data analysis data tools data methods statistical tool survey 3d chart Powerpoint Templates . Your Audience Will Be Astounded With Your Ideas.
-
Excel Data Analysis Data Tools Data Methods Statistical Driven PowerPoint Slides Templates
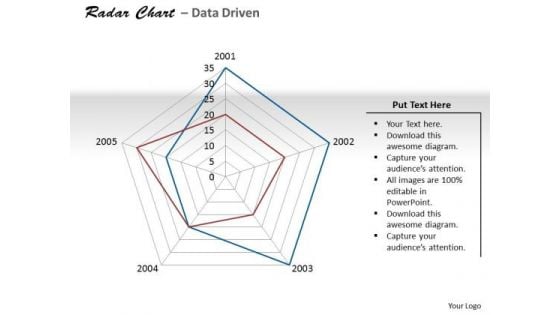
There Is No Subject Too Dull For Our excel data analysis data tools data methods statistical driven powerpoint slides Templates . They Will Always Generate Keenness.
-
Target Market Ppt PowerPoint Presentation Backgrounds
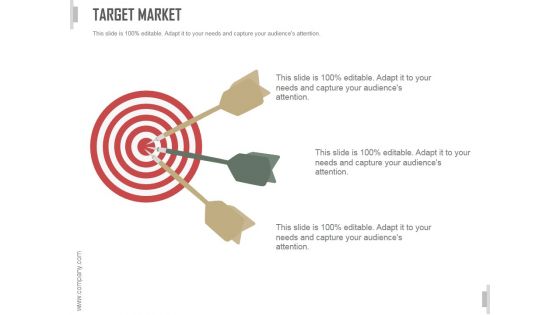
This is a target market ppt powerpoint presentation backgrounds. This is a two stage process. The stages in this process are business, strategy, marketing, analysis, target market share, finance.
-
Financial Highlights Ppt PowerPoint Presentation Slides Example File
This is a financial highlights ppt powerpoint presentation slides example file. This is a three stage process. The stages in this process are business, marketing, finance, analysis, strategy.
-
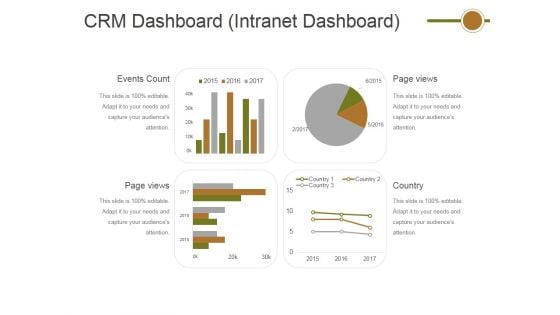
Crm Dashboard Intranet Dashboard Ppt PowerPoint Presentation Outline Professional
This is a crm dashboard intranet dashboard ppt powerpoint presentation outline professional. This is a four stage process. The stages in this process are events count, page views, page views, country.
-
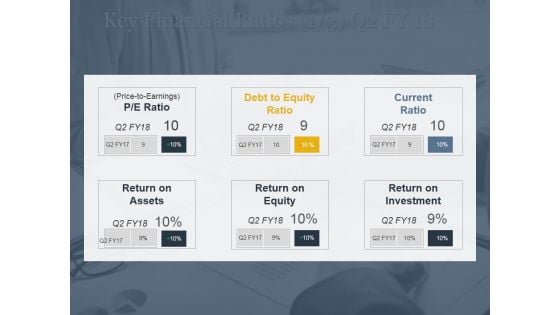
Key Financial Ratios Ppt PowerPoint Presentation Model Objects
This is a key financial ratios ppt powerpoint presentation model objects. This is a three stage process. The stages in this process are p e ratio, price to earnings, debt, equity ratio, current, ratio.
-
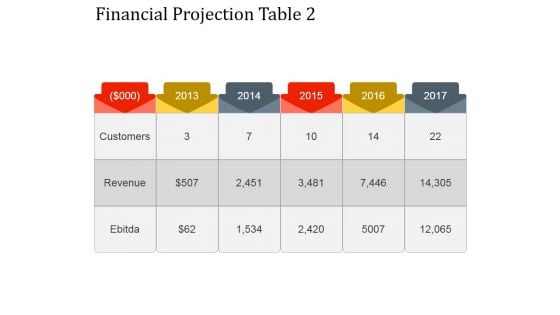
Financial Projection Table 2 Ppt PowerPoint Presentation Layouts
This is a financial projection table 2 ppt powerpoint presentation layouts. This is a five stage process. The stages in this process are customers, revenue, ebitda.
-
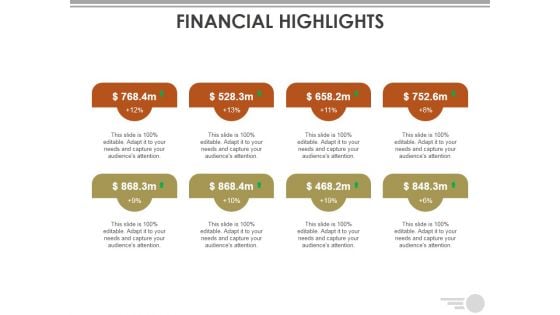
Financial Highlights Ppt PowerPoint Presentation Visual Aids
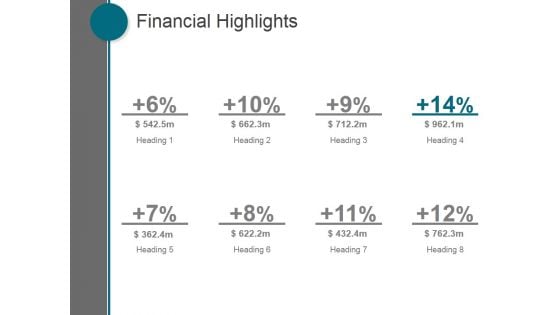
This is a financial highlights ppt powerpoint presentation visual aids. This is a eight stage process. The stages in this process are business, marketing, management, finance, strategy.
-
Key Driver Analytics Template Ppt PowerPoint Presentation Examples
This is a key driver analytics template ppt powerpoint presentation examples. This is a four stage process. The stages in this process are business, strategy, marketing, analysis, success, finance.
-
Financials Ppt PowerPoint Presentation Diagrams
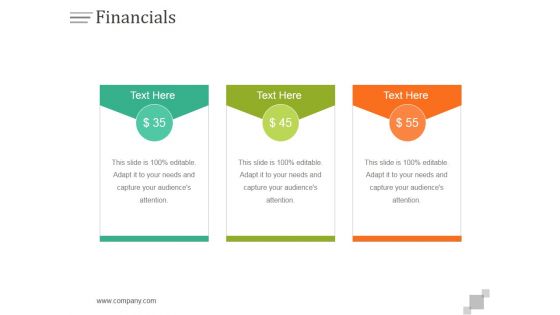
This is a financials ppt powerpoint presentation diagrams. This is a three stage process. The stages in this process are business, finance, marketing, strategy, investment, success.
-
Force Field Analysis Template 1 Ppt PowerPoint Presentation Pictures
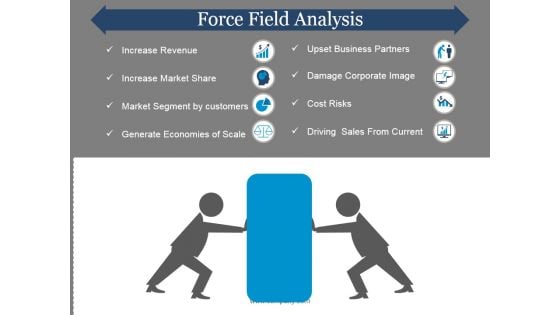
This is a force field analysis template 1 ppt powerpoint presentation pictures. This is a two stage process. The stages in this process are increase revenue, increase market sharel, market segment by customers, generate economies of scale.
-
Stacked Bar Ppt PowerPoint Presentation Model
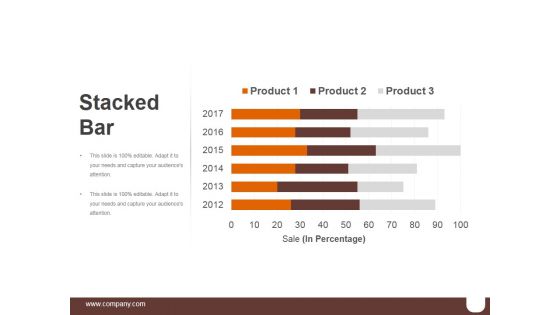
This is a stacked bar ppt powerpoint presentation model. This is a six stage process. The stages in this process are finance, analysis, business, marketing, strategy.
-
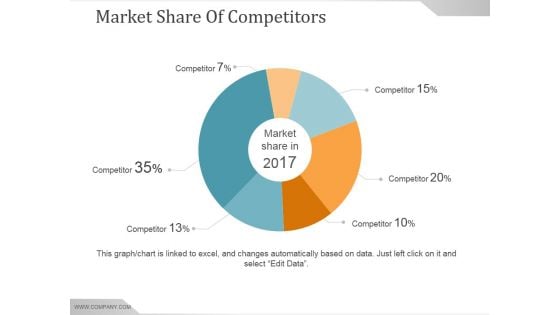
Market Share Of Competitors Ppt PowerPoint Presentation Slides
This is a market share of competitors ppt powerpoint presentation slides. This is a six stage process. The stages in this process are market share in, competitor, pie, finance, percentage.
-
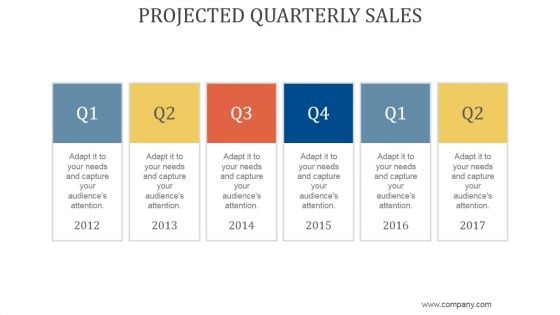
Projected Quarterly Sales Ppt PowerPoint Presentation Files
This is a projected quarterly sales ppt powerpoint presentation files. This is a six stage process. The stages in this process are business, strategy, marketing, analysis, liner process.
-
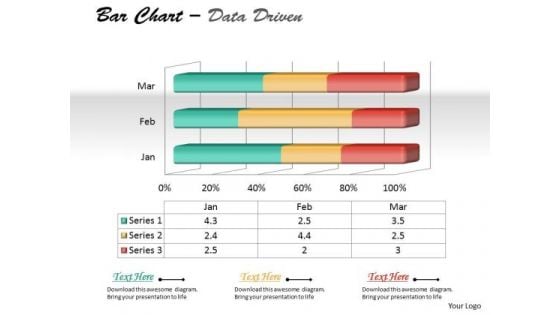
Data Analysis On Excel 3d Chart To Represent Quantitative Differences PowerPoint Templates
Draft It Out On Our data analysis on excel 3d chart to represent quantitative differences Powerpoint Templates . Give The Final Touches With Your Ideas.
-
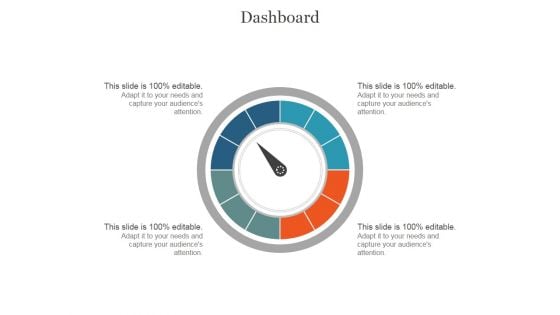
Dashboard Ppt PowerPoint Presentation Portfolio
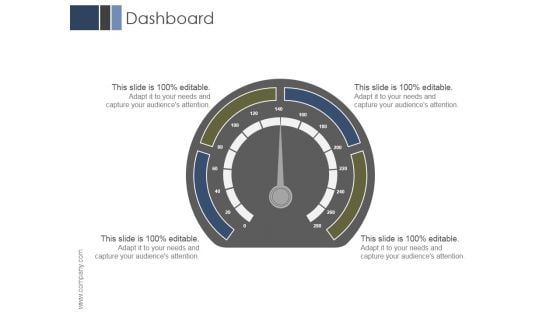
This is a dashboard ppt powerpoint presentation portfolio. This is a four stage process. The stages in this process are business, marketing, management, dashboard, finance.
-
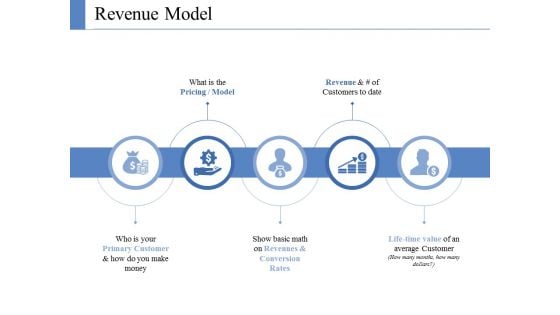
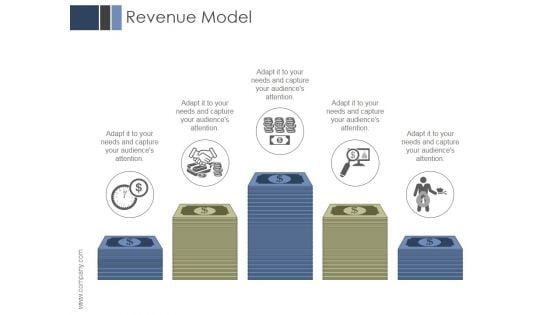
Revenue Model Ppt PowerPoint Presentation Visual Aids
This is a revenue model ppt powerpoint presentation visual aids. This is a five stage process. The stages in this process are business, marketing, management, finance, planning.
-
Business Model Template 2 Ppt PowerPoint Presentation Ideas
This is a business model template 2 ppt powerpoint presentation ideas. This is a three stage process. The stages in this process are business, marketing, management, finance, planning.
-
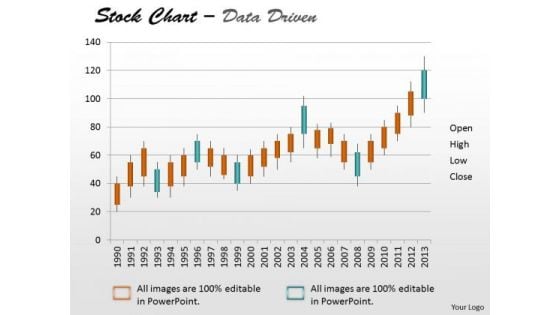
Data Analysis Template Driven Stock Chart For Market Trends PowerPoint Slides Templates
Drive Your Team Along The Road To Success. Take The Wheel With Our data analysis template driven stock chart for market trends powerpoint slides Templates .
-
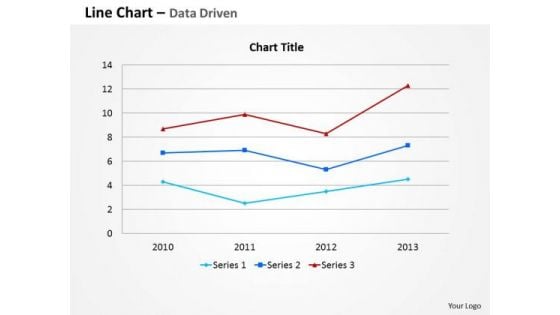
Data Analysis Template Driven Line Chart For Business Information PowerPoint Slides Templates
Your Thoughts Are Dripping With Wisdom. Lace It With Our data analysis template driven line chart for business information powerpoint slides Templates .
-
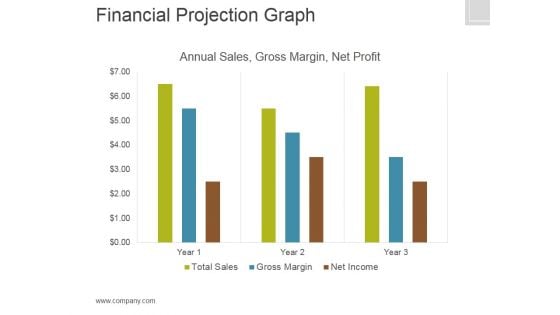
Financial Projection Graph Template 2 Ppt PowerPoint Presentation Graphics
This is a financial projection graph template 2 ppt powerpoint presentation graphics. This is a three stage process. The stages in this process are annual sales, gross margin, net profit, finance.
-
Data Analysis Programs 3d Bar Chart To Compare Categories PowerPoint Templates
Discover Decisive Moments With Our data analysis programs 3d bar chart to compare categories Powerpoint Templates . They Help Make That Crucial Difference.
-
Data Analysis Excel 3d Process Variation Column Chart PowerPoint Templates
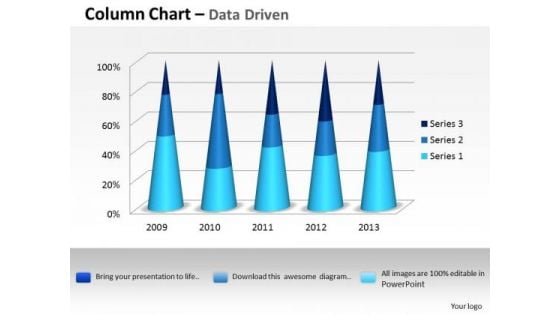
Put In A Dollop Of Our data analysis excel 3d process variation column chart Powerpoint Templates. Give Your Thoughts A Distinctive Flavor.
-
Data Analysis Excel Bubble Chart For Business Tasks PowerPoint Templates
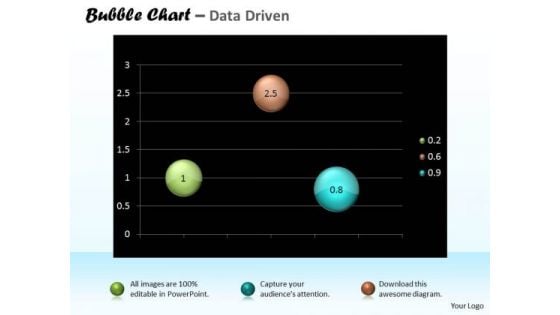
Doll Up Your Thoughts With Our data analysis excel bubble chart for business tasks Powerpoint Templates. They Will Make A Pretty Picture.
-
Dashboard Ppt PowerPoint Presentation Graphics
This is a dashboard ppt powerpoint presentation graphics. This is a four stage process. The stages in this process are business, marketing, management, dashboard, analysis.
-
Dashboard Ppt PowerPoint Presentation Inspiration Icons
This is a dashboard ppt powerpoint presentation inspiration icons. This is a four stage process. The stages in this process are business, marketing, finance, planning, analysis.

 Home
Home 


