Financial analysis
-
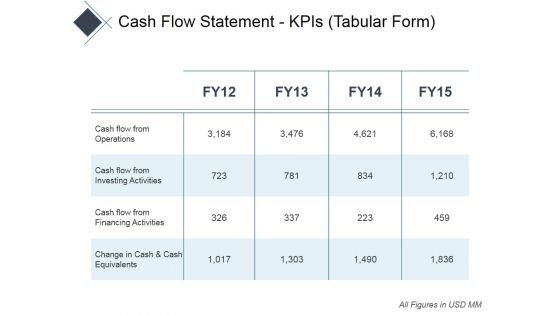
Cash Flow Statement Kpis Tabular Form Ppt PowerPoint Presentation Infographics Professional
This is a cash flow statement kpis tabular form ppt powerpoint presentation infographics professional. This is a four stage process. The stages in this process are operations, financing activities, investing activities, net increase in cash.
-
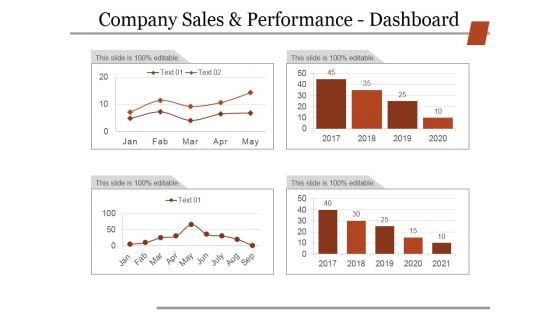
Company Sales And Performance Dashboard Ppt PowerPoint Presentation Slides Grid
This is a company sales and performance dashboard ppt powerpoint presentation slides grid. This is a four stage process. The stages in this process are business, strategy, marketing, finance, analysis.
-
Taxation Ppt PowerPoint Presentation Infographics Graphics Example
This is a taxation ppt powerpoint presentation infographics graphics example. This is a one stage process. The stages in this process are finance, marketing, strategy, management, planning.
-
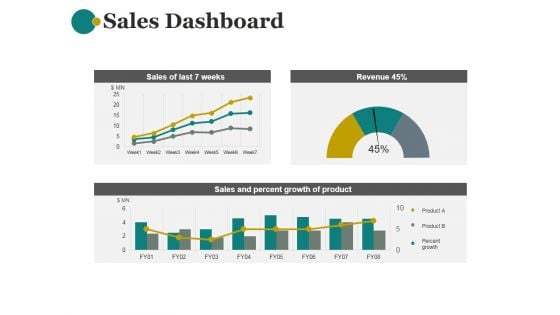
Sales Dashboard Template 1 Ppt PowerPoint Presentation Show
This is a sales dashboard template 1 ppt powerpoint presentation show. This is a three stage process. The stages in this process are sales of last 7 weeks, revenue, sales and percent growth of product.
-
Email Marketing Report Ppt PowerPoint Presentation Icon Graphics Tutorials
This is a email marketing report ppt powerpoint presentation icon graphics tutorials. This is a two stage process. The stages in this process are opens, bounces, unopened, click rate.
-
Financial Due Diligence Ppt PowerPoint Presentation Infographic Template Backgrounds
This is a financial due diligence ppt powerpoint presentation infographic template backgrounds. This is a one stage process. The stages in this process are business, marketing, strategy, planning, finance.
-
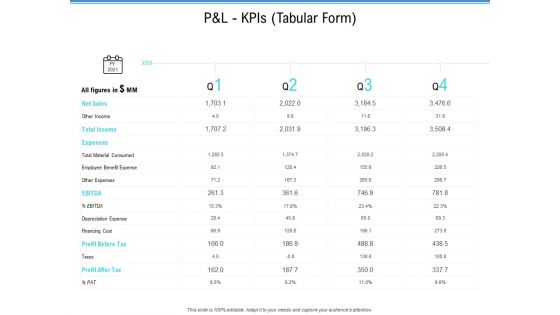
Enterprise Analysis P And L Kpis Tabular Form Ppt Slides Graphics Download PDF
Deliver and pitch your topic in the best possible manner with this enterprise analysis p and l kpis tabular form ppt slides graphics download pdf. Use them to share invaluable insights on operating profit, net profit, cogs, revenue and impress your audience. This template can be altered and modified as per your expectations. So, grab it now.
-
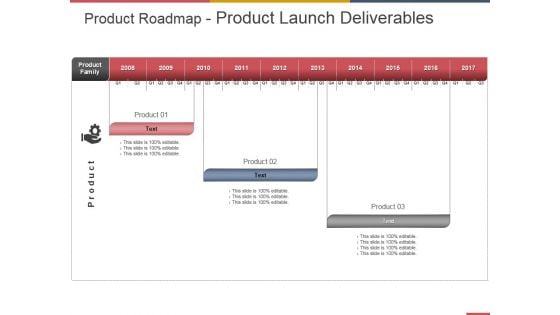
Product Roadmap Product Launch Deliverables Template 1 Ppt PowerPoint Presentation Ideas
This is a product roadmap product launch deliverables template 1 ppt powerpoint presentation ideas. This is a three stage process. The stages in this process are business, strategy, marketing, analysis, product family.
-
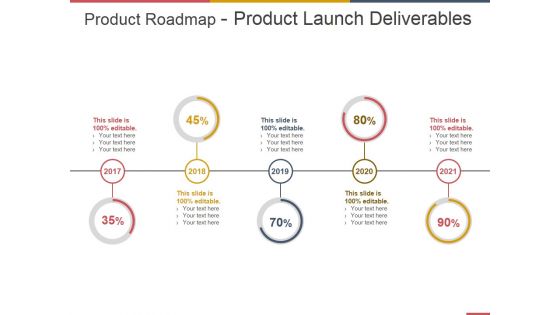
Product Roadmap Product Launch Deliverables Template 2 Ppt PowerPoint Presentation Inspiration Portrait
This is a product roadmap product launch deliverables template 2 ppt powerpoint presentation inspiration portrait. This is a five stage process. The stages in this process are product roadmap, product launch deliverables.
-
Financial Ppt PowerPoint Presentation Model Styles
This is a financial ppt powerpoint presentation model styles. This is a four stage process. The stages in this process are finance, marketing, strategy, planning, management.
-
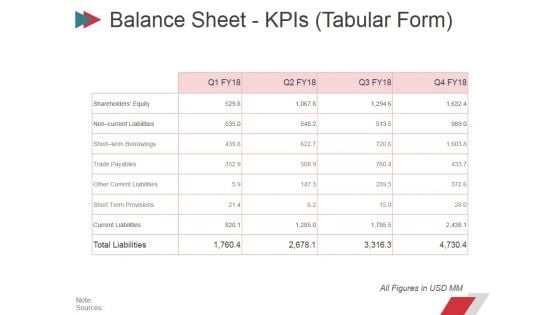
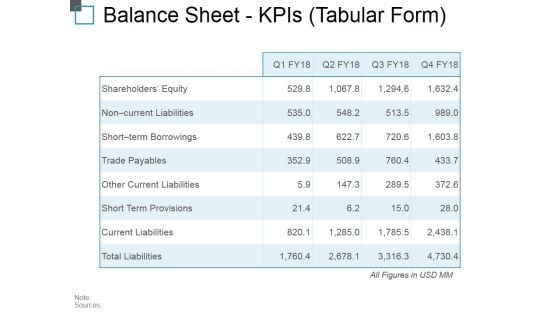
Balance Sheet Kpis Tabular Form Ppt PowerPoint Presentation Professional Display
This is a balance sheet kpis tabular form ppt powerpoint presentation professional display. This is a four stage process. The stages in this process are current assets, current liabilities, total assets, total liabilities.
-
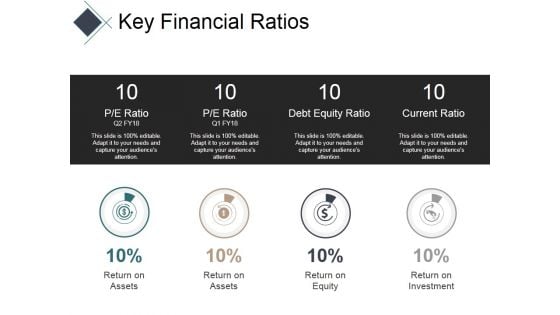
Key Financial Ratios Ppt PowerPoint Presentation Summary Inspiration
This is a key financial ratios ppt powerpoint presentation summary inspiration. This is a four stage process. The stages in this process are pe ratio, debt equity ratio, current ratio.
-
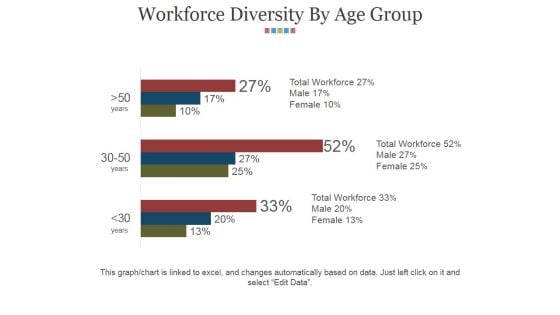
Workforce Diversity By Age Group Ppt PowerPoint Presentation Infographics Slides
This is a workforce diversity by age group ppt powerpoint presentation infographics slides. This is a three stage process. The stages in this process are finance, analysis, success, strategy, business, marketing.
-
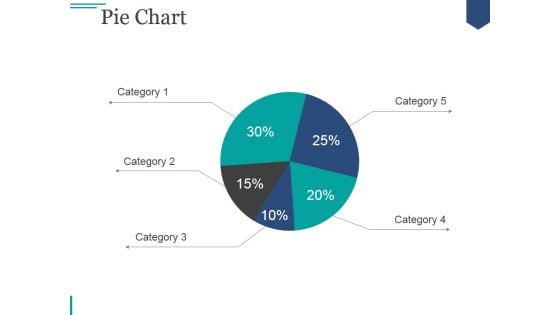
Pie Chart Ppt PowerPoint Presentation Visual Aids
This is a pie chart ppt powerpoint presentation visual aids. This is a five stage process. The stages in this process are pie, finance, analysis, division, percentage.
-
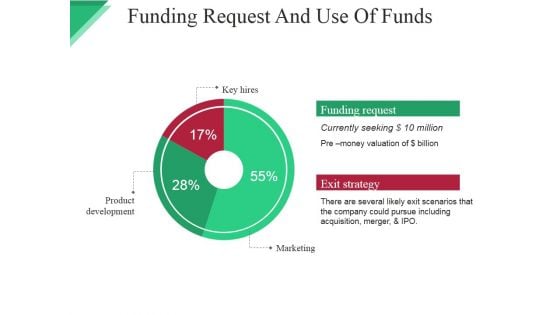
Funding Request And Use Of Funds Template Ppt PowerPoint Presentation Inspiration Graphic Images
This is a funding request and use of funds template ppt powerpoint presentation inspiration graphic images. This is a three stage process. The stages in this process are key hires, product development, marketing, funding request, exit strategy.
-
Balance Sheet Kpis Ppt PowerPoint Presentation Professional
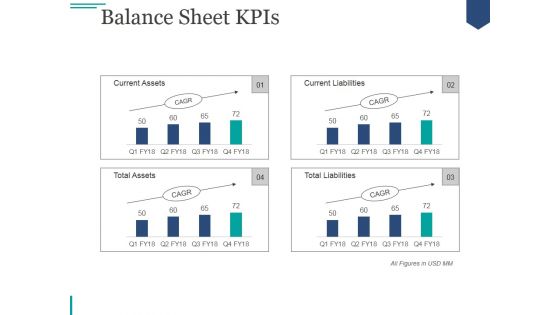
This is a balance sheet kpis ppt powerpoint presentation professional. This is a four stage process. The stages in this process are current assets, current liabilities, total assets, total liabilities.
-
Business Diagram Battery Icon With Power Icons Energy Technology PowerPoint Slide
This business diagram displays battery icon with power charging. Use this diagram, in your presentations to display energy saving, battery and technology. Create professional presentations using this diagram slide.
-
Business Diagram Alarm Clock With Pie Chart For Result Analysis PowerPoint Slide
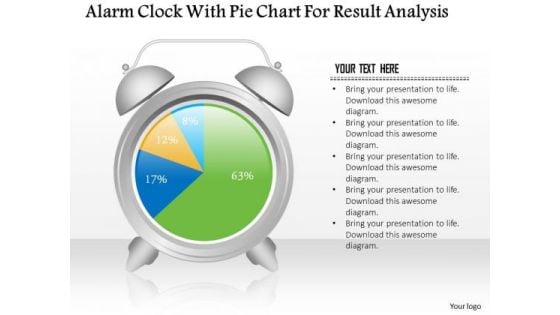
This business slide displays alarm clock with pie chart. This diagram is a data visualization tool that gives you a simple way to present statistical information. This slide helps your audience examine and interpret the data you present.
-
Product Roadmap Layout2 Ppt PowerPoint Presentation Gallery Template
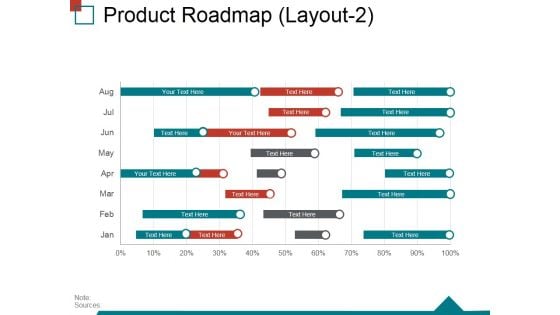
This is a product roadmap layout2 ppt powerpoint presentation gallery template. This is a nine stage process. The stages in this process are product roadmap, business, marketing, management.
-
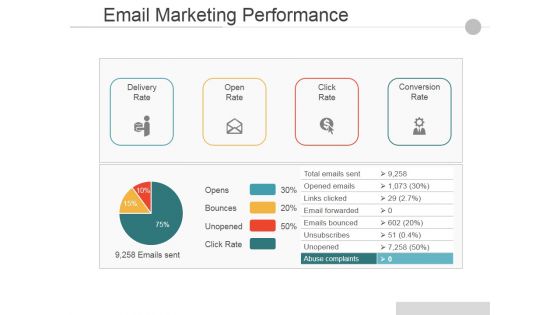
Email Marketing Performance Ppt PowerPoint Presentation Infographics Layout Ideas
This is a email marketing performance ppt powerpoint presentation infographics layout ideas. This is a four stage process. The stages in this process are delivery rate, open rate, click rate, conversion rate.
-
Bar Graph Ppt PowerPoint Presentation Icon Diagrams
This is a bar graph ppt powerpoint presentation icon diagrams. This is a nine stage process. The stages in this process are product, bar graph, marketing, success.
-
Balance Sheet Kpis Tabular Form Ppt PowerPoint Presentation Outline Background Image
This is a balance sheet kpis tabular form ppt powerpoint presentation outline background image. This is a four stage process. The stages in this process are current assets, current liabilities, total assets, total liabilities.
-
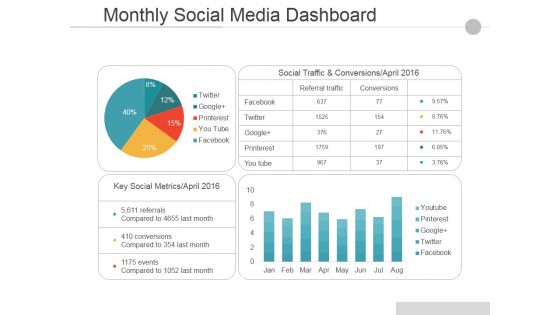
Monthly Social Media Dashboard Ppt PowerPoint Presentation Pictures Guide
This is a monthly social media dashboard ppt powerpoint presentation pictures guide. This is a two stage process. The stages in this process are social traffic and conversions april, key social metrics april, facebook, twitter, google.
-
Budgeting Planned Actual Comparison Ppt PowerPoint Presentation Visual Aids Outline
This is a budgeting planned actual comparison ppt powerpoint presentation visual aids outline. This is a three stage process. The stages in this process are planned cost, actual cost, value difference.
-
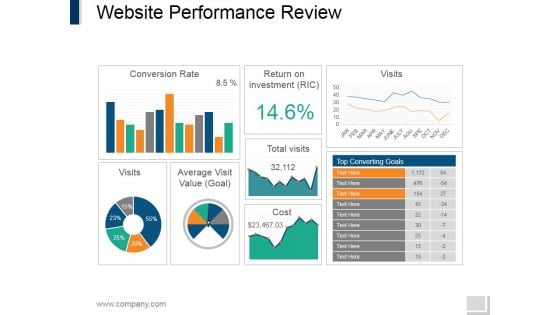
Website Performance Review Template 2 Ppt PowerPoint Presentation Infographics Vector
This is a website performance review template 2 ppt powerpoint presentation infographics vector. This is a three stage process. The stages in this process are conversion rate, return on investment, visits, average visit value, total visits.
-
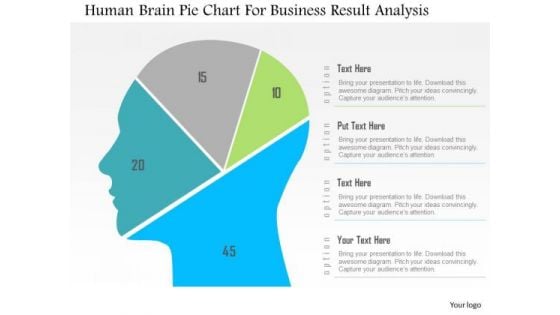
Business Diagram Human Brain Pie Chart For Business Result Analysis PowerPoint Slide
This diagram displays human face graphic divided into sections. This section can be used for data display. Use this diagram to build professional presentations for your viewers.
-
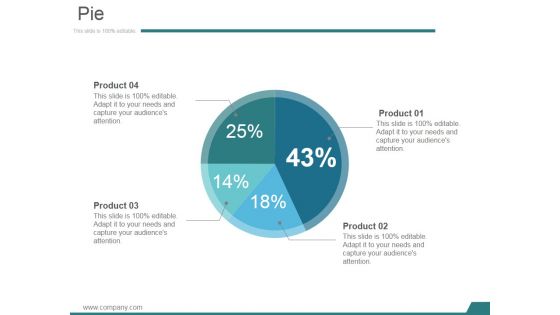
Pie Ppt PowerPoint Presentation Themes
This is a pie ppt powerpoint presentation themes. This is a four stage process. The stages in this process are business, marketing, pie, finance, process.
-
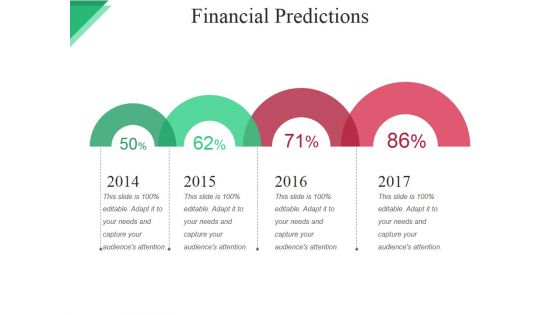
Financial Predictions Ppt PowerPoint Presentation File Clipart Images
This is a financial predictions ppt powerpoint presentation file clipart images. This is a three stage process. The stages in this process are revenue, expense, aggregate net income, monthly breakeven, aggregate breakeven.
-
Business Diagram Three Staged Pencil Diagram For Graph Formation PowerPoint Slide
This business diagram displays set of pencils. This Power Point template has been designed to compare and present business data. Download this diagram to represent stages of business growth.
-
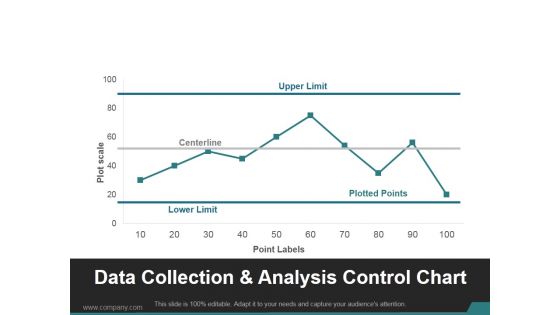
Data Collection And Analysis Control Chart Ppt PowerPoint Presentation Visuals
This is a data collection and analysis control chart ppt powerpoint presentation visuals. This is a ten stage process. The stages in this process are upper limit, centerline, lower limit, plotted points.
-
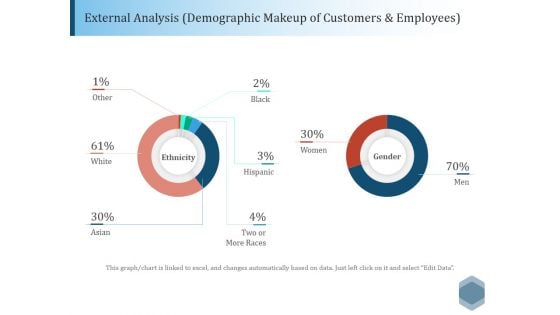
External Analysis Demographic Makeup Of Customers And Employees Ppt PowerPoint Presentation Outline Background Designs
This is a external analysis demographic makeup of customers and employees ppt powerpoint presentation outline background designs. This is a two stage process. The stages in this process are ethnicity, gender, white, asian, black.
-
Funding Request And Use Of Funds Ppt PowerPoint Presentation Inspiration Maker
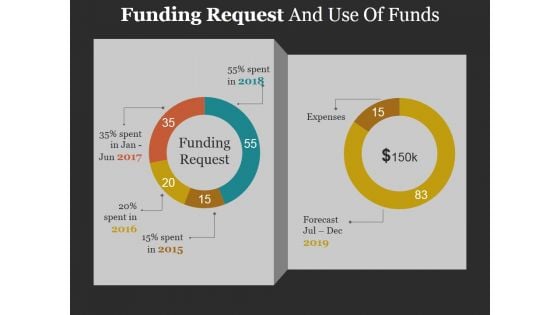
This is a funding request and use of funds ppt powerpoint presentation inspiration maker. This is a two stage process. The stages in this process are funding request, expenses, forecast jul, spent, spent in jan.
-
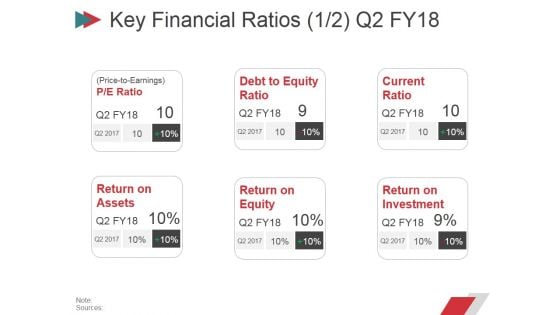
Key Financial Ratios Template 2 Ppt PowerPoint Presentation Icon Slide Download
This is a key financial ratios template 2 ppt powerpoint presentation icon slide download. This is a six stage process. The stages in this process are price to earnings, debt to equity ratio, current ratio, return on, equity, return on , assets, return on investment.
-
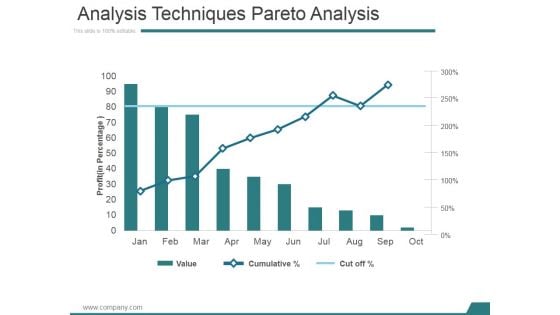
Analysis Techniques Pareto Analysis Ppt PowerPoint Presentation Designs
This is a analysis techniques pareto analysis ppt powerpoint presentation designs. This is a ten stage process. The stages in this process are business, marketing, growth, finance, techniques.
-
Pie Chart Ppt PowerPoint Presentation Layouts Icons
This is a pie chart ppt powerpoint presentation layouts icons. This is a three stage process. The stages in this process are business, finance, analysis, marketing, strategy.
-
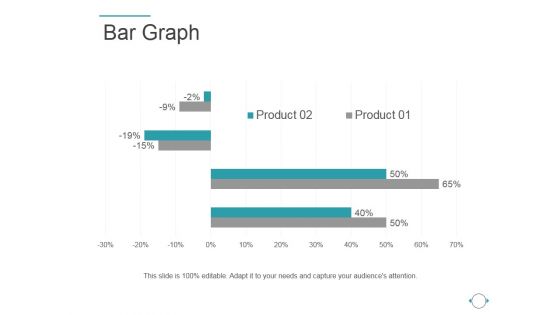
Bar Graph Ppt PowerPoint Presentation Layouts Good
This is a bar graph ppt powerpoint presentation layouts good. This is a two stage process. The stages in this process are bar graph, finance, success, strategy, management.
-
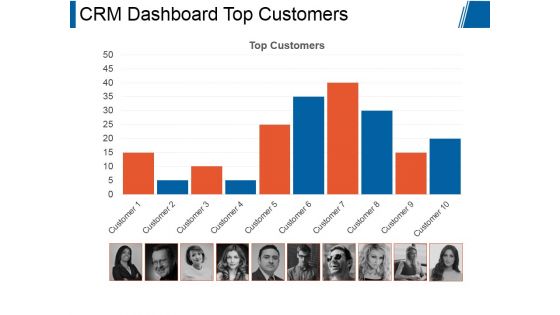
Crm Dashboard Top Customers Ppt PowerPoint Presentation Graphics
This is a crm dashboard top customers ppt powerpoint presentation graphics. This is a ten stage process. The stages in this process are top customers, business, marketing, process, management.
-
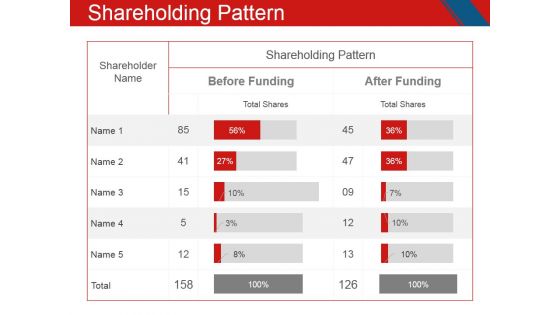
Shareholding Pattern Ppt PowerPoint Presentation Model Microsoft
This is a shareholding pattern ppt powerpoint presentation model microsoft. This is a two stage process. The stages in this process are shareholder name, shareholding pattern, before funding, after funding.
-
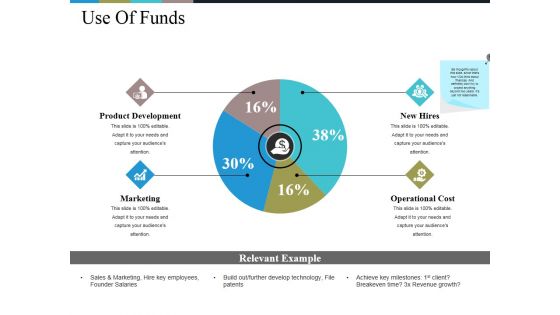
Use Of Funds Ppt PowerPoint Presentation Show Graphics Design
This is a use of funds ppt powerpoint presentation show graphics design. This is a four stage process. The stages in this process are product development, marketing, new hires, operational cost, business, finance.
-
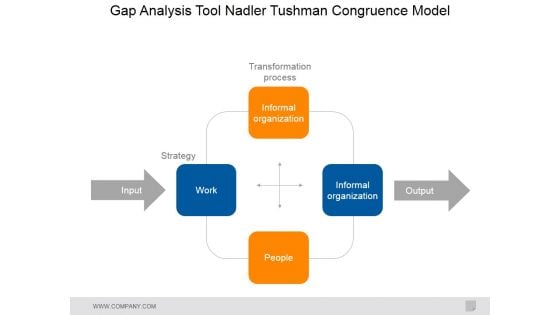
Gap Analysis Tool Nadler Tushman Congruence Model Ppt PowerPoint Presentation Slides Guidelines
This is a gap analysis tool nadler tushman congruence model ppt powerpoint presentation slides guidelines. This is a four stage process. The stages in this process are transformation process, strategy, people, output, input, work, informal organization, informal organization.
-
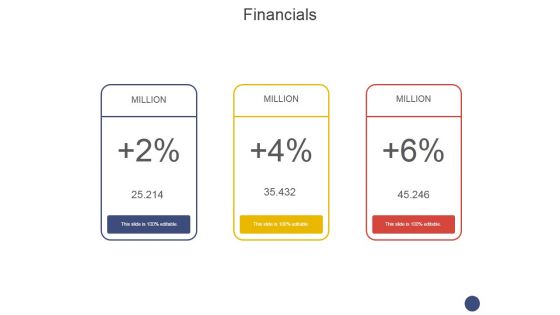
Financials Ppt PowerPoint Presentation File Format Ideas
This is a financials ppt powerpoint presentation file format ideas. This is a three stage process. The stages in this process are business, marketing, finance, management, analysis.
-
Key Financial Ratios Ppt PowerPoint Presentation Infographic Template Structure
This is a key financial ratios ppt powerpoint presentation infographic template structure. This is a six stage process. The stages in this process are price to earnings, debt to equity ratio, current ratio, return on, assets, return on , equity, return on investment.
-
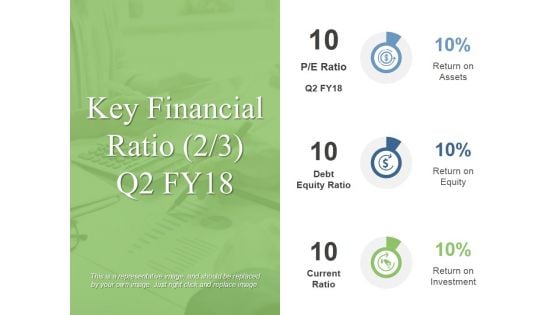
Key Financial Ratio Template 2 Ppt PowerPoint Presentation Summary Influencers
This is a key financial ratio template 2 ppt powerpoint presentation summary influencers. This is a three stage process. The stages in this process are return on assets, return on equity, return on investment.
-
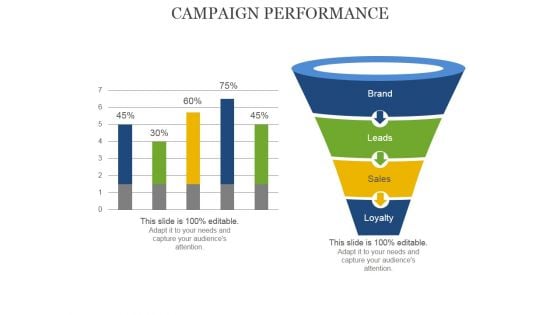
Campaign Performance Ppt PowerPoint Presentation Inspiration Vector
This is a campaign performance ppt powerpoint presentation inspiration vector. This is a two stage process. The stages in this process are loyalty, sales, leads, brand.
-
Health Scorecard Ppt PowerPoint Presentation Infographic Template Images
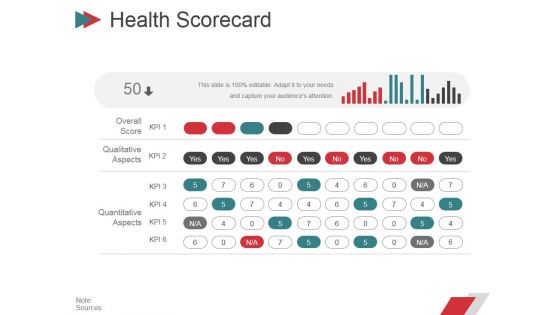
This is a health scorecard ppt powerpoint presentation infographic template images. This is a six stage process. The stages in this process are overall score, qualitative aspects, quantitative aspects.
-
Pros Of Crowdfunding Ppt PowerPoint Presentation Infographic Template Inspiration
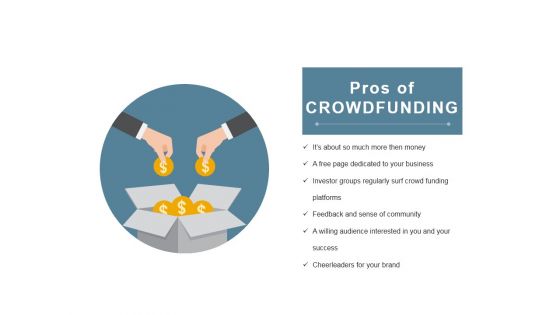
This is a pros of crowdfunding ppt powerpoint presentation infographic template inspiration. This is a two stage process. The stages in this process are pros of crowdfunding, business, marketing, strategy, success.
-
Bar Graph Ppt PowerPoint Presentation Professional Guide
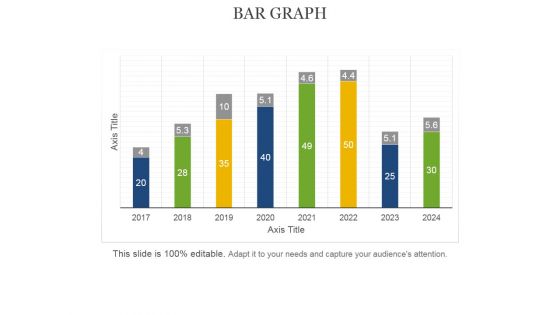
This is a bar graph ppt powerpoint presentation professional guide. This is a eight stage process. The stages in this process are axis title, bar graph, business, marketing, management.
-
Dashboard Ppt PowerPoint Presentation Pictures Portfolio
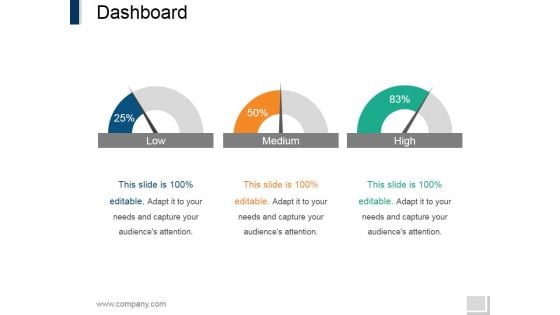
This is a dashboard ppt powerpoint presentation pictures portfolio. This is a three stage process. The stages in this process are speed, meter, business, marketing, equipment.
-
Marketing Roadmap Ppt PowerPoint Presentation Portfolio Ideas
This is a marketing roadmap ppt powerpoint presentation portfolio ideas. This is a eight stage process. The stages in this process are business, marketing, roadmap, planning, finance.
-
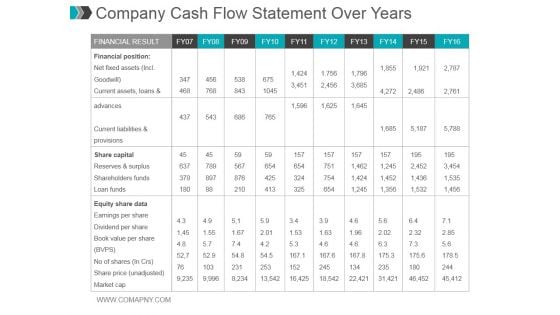
Company Cash Flow Statement Over Years Ppt PowerPoint Presentation Gallery
This is a company cash flow statement over years ppt powerpoint presentation gallery. This is ten stage process. The stages in this process are financial result, financial position, share capital, equity share data.
-
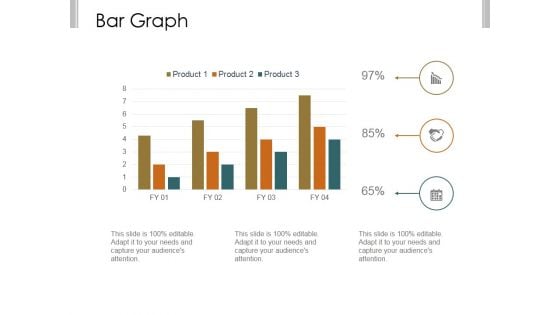
Bar Graph Ppt PowerPoint Presentation Examples
This is a bar graph ppt powerpoint presentation examples. This is a three stage process. The stages in this process are business, strategy, marketing, analysis, finance, bar graph.
-
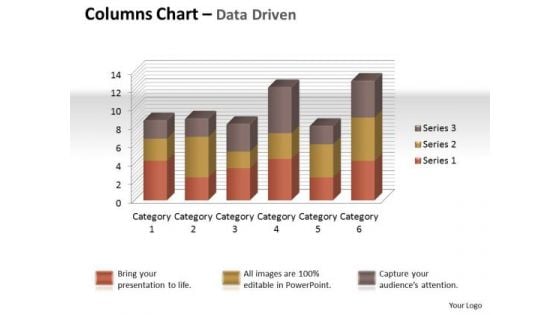
Excel Data Analysis Data Tools Data Methods Statistical Tool Chart PowerPoint Templates
Give Your Thoughts Some Durability. Coat Them With Our excel data analysis data tools data methods statistical tool chart Powerpoint Templates .
-
Data Analysis Template Driven Express Business Facts Pie Chart PowerPoint Slides Templates
Display Your Drive On Our data analysis template driven express business facts pie chart powerpoint slides Templates . Invigorate The Audience With Your Fervor.
-
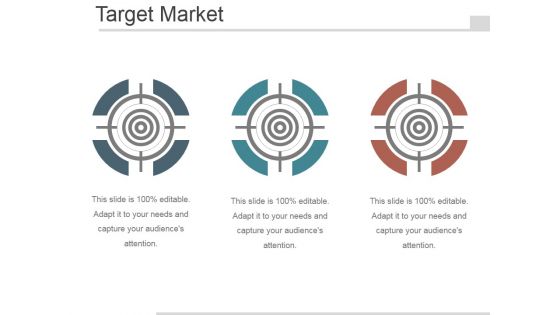
Target Market Ppt PowerPoint Presentation Ideas
This is a target market ppt powerpoint presentation ideas. This is a three stage process. The stages in this process are competitive brands market share, target market shares, best case, likely case.
-
Financial Ppt PowerPoint Presentation Shapes
This is a financial ppt powerpoint presentation shapes. This is a two stage process. The stages in this process are sale, operating income, net income.
-
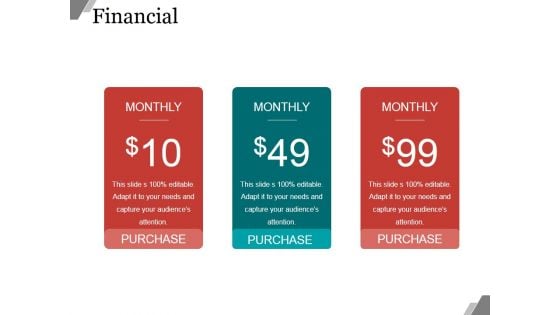
Financial Ppt PowerPoint Presentation Outline
This is a financial ppt powerpoint presentation outline. This is a three stage process. The stages in this process are monthly, purchase.
-
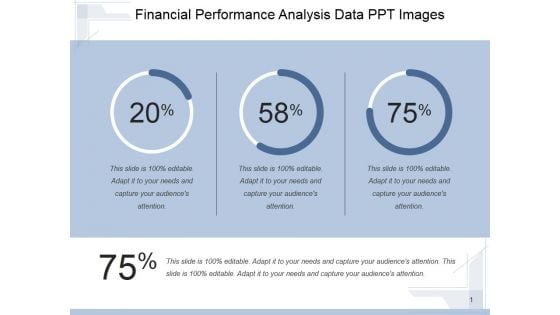
Financial Performance Analysis Data Ppt PowerPoint Presentation Topics
This is a financial performance analysis data ppt powerpoint presentation topics. This is a three stage process. The stages in this process are finance, percentage, marketing, business, growth.
-
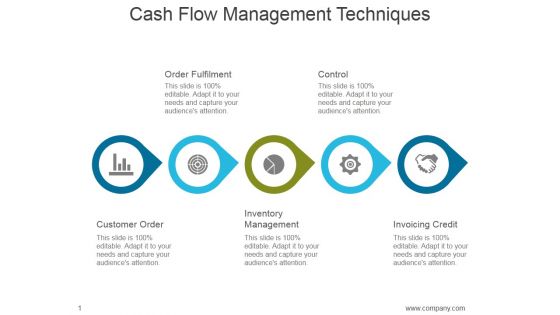
Cash Flow Management Techniques Ppt PowerPoint Presentation Inspiration
This is a cash flow management techniques ppt powerpoint presentation inspiration. This is a five stage process. The stages in this process are customer order, order fulfilment, inventory management, control, invoicing credit.
-
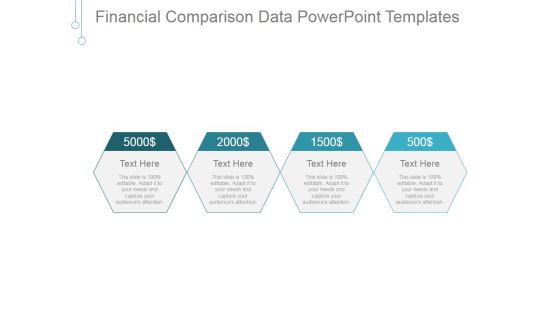
Financial Comparison Data Ppt PowerPoint Presentation Gallery
This is a financial comparison data ppt powerpoint presentation gallery. This is a four stage process. The stages in this process are business, marketing, management, dollar, finance.
-
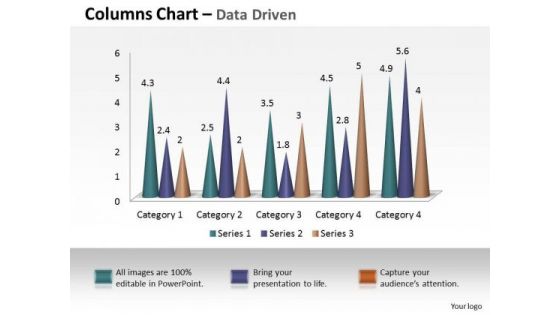
Examples Of Data Analysis Market 3d Business Intelligence And PowerPoint Templates
Our examples of data analysis market 3d business intelligence and Powerpoint Templates Are Dual Purpose. They Help Instruct And Inform At The Same Time.

 Home
Home 


