4
-
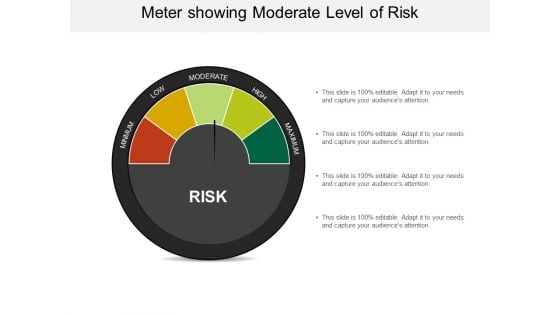
Meter Showing Moderate Level Of Risk Ppt PowerPoint Presentation Model Summary
This is a meter showing moderate level of risk ppt powerpoint presentation model summary. This is a four stage process. The stages in this process are risk meter, risk speedometer, hazard meter.
-
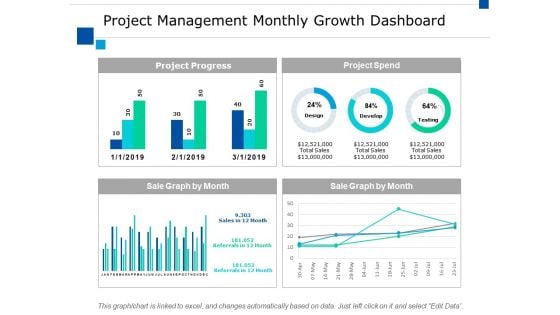
Project Management Monthly Growth Dashboard Ppt PowerPoint Presentation Pictures Guide
This is a project management monthly growth dashboard ppt powerpoint presentation pictures guide. This is a four stage process. The stages in this process are finance, marketing, management, investment, analysis.
-
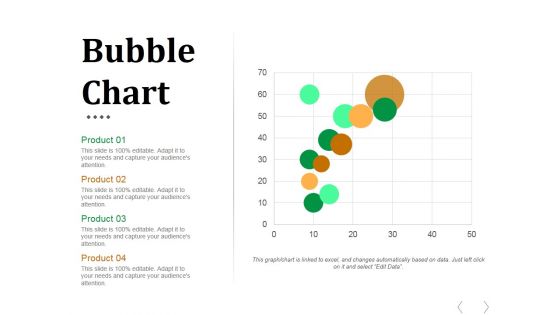
Bubble Chart Ppt PowerPoint Presentation Slides Download
This is a bubble chart ppt powerpoint presentation slides download. This is a four stage process. The stages in this process are business, marketing, bubble chart, finance, product.
-
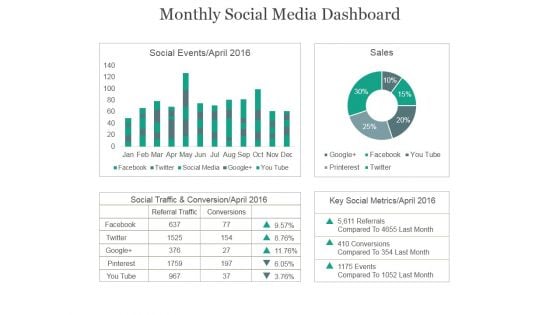
Monthly Social Media Dashboard Ppt PowerPoint Presentation Example 2015
This is a monthly social media dashboard ppt powerpoint presentation example 2015. This is a four stage process. The stages in this process are social events, sales, social traffic, conservation, key social metrics.
-
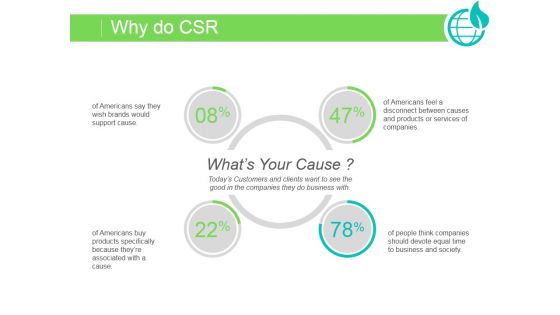
Why Do Csr Ppt PowerPoint Presentation Good
This is a why do csr ppt powerpoint presentation good. This is a four stage process. The stages in this process are business, strategy, marketing, analysis, finance.
-
Fundraising Plan For Non Profit Business Icon Formats PDF
Presenting Fundraising Plan For Non Profit Business Icon Formats PDF to dispense important information. This template comprises four stages. It also presents valuable insights into the topics including Fundraising Plan, Non Profit, Business Icon. This is a completely customizable PowerPoint theme that can be put to use immediately. So, download it and address the topic impactfully.
-
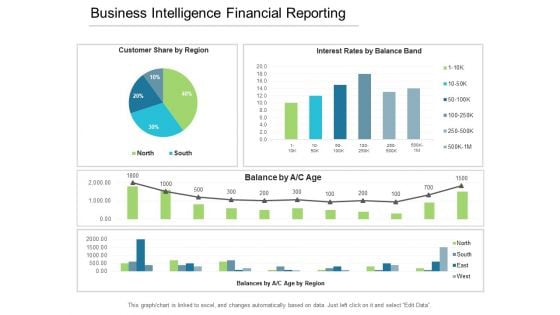
Business Intelligence Financial Reporting Ppt PowerPoint Presentation Layouts Model
This is a business intelligence financial reporting ppt powerpoint presentation layouts model. This is a four stage process. The stages in this process are business analytics, ba, organizations data.
-

Vision And Mission Powerpoint Slide Presentation Examples
This is a vision and mission powerpoint slide presentation examples. This is a four stage process. The stages in this process are vision and mission, security plan, application plan, goal and objectives.
-
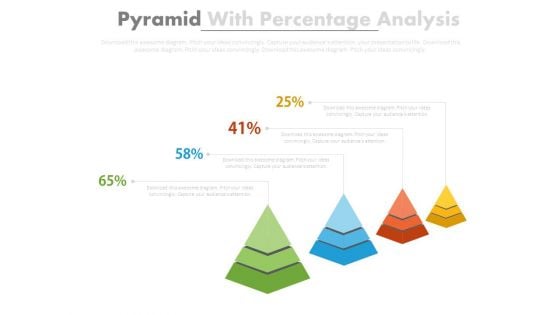
Four Pyramids With Growth Steps Powerpoint Slides
This business slide has been designed with four pyramids. This PowerPoint template may use to display sales growth and analysis. Prove the viability of your ideas using this impressive slide.
-

Four Circles With Percentage Data Display Powerpoint Slides
This PowerPoint template has been designed with graphics of four circles. Download this PPT slide to display percentage data display. Use this professional template to build an exclusive presentation.
-

Sales Performance Tracking Ppt PowerPoint Presentation Deck
This is a sales performance tracking ppt powerpoint presentation deck. This is a four stage process. The stages in this process are top opportunities, sales goal ytd, sales funnel, company, value, company.
-
Remuneration Strategy Payout Timeline Icon Ppt Gallery Slides PDF
Presenting Remuneration Strategy Payout Timeline Icon Ppt Gallery Slides PDF to dispense important information. This template comprises four stages. It also presents valuable insights into the topics including Remuneration Strategy, Payout Timeline, Icon. This is a completely customizable PowerPoint theme that can be put to use immediately. So, download it and address the topic impactfully.
-
Lead Scoring And Grading Ppt Images
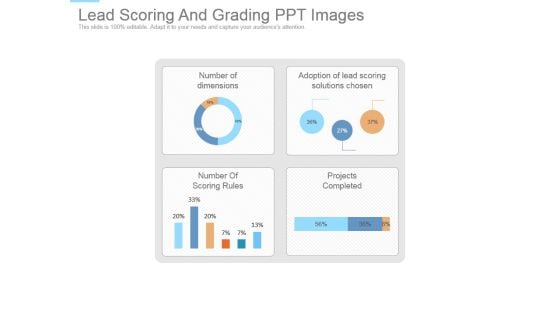
This is a lead scoring and grading ppt images. This is a four stage process. The stages in this process are number of dimensions, adoption of lead scoring solutions chosen, number of scoring rules, projects completed.
-
Cost Control And Effectiveness Icon Ppt PowerPoint Presentation Portfolio Demonstration
This is a cost control and effectiveness icon ppt powerpoint presentation portfolio demonstration. This is a four stage process. The stages in this process are cost planning, cost efficiency, cost organization.
-
Financial Management Kpi Dashboards Business Ppt Powerpoint Presentation Infographic Template Deck
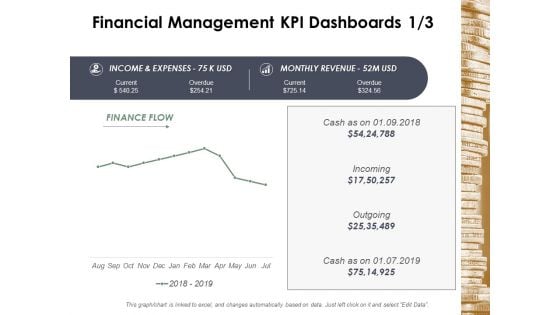
This is a financial management kpi dashboards business ppt powerpoint presentation infographic template deck. This is a four stage process. The stages in this process are finance, marketing, management, investment, analysis.
-
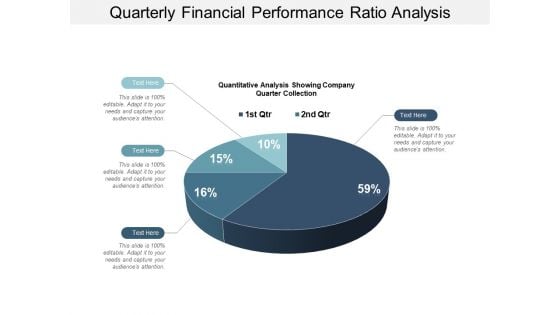
Quarterly Financial Performance Ratio Analysis Ppt PowerPoint Presentation Model Format Ideas
This is a quarterly financial performance ratio analysis ppt powerpoint presentation model format ideas. This is a four stage process. The stages in this process are financial analysis, quantitative, statistical modelling.
-
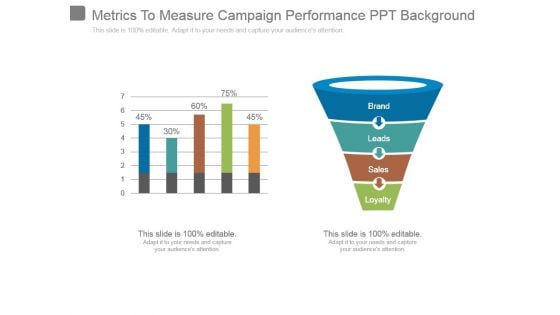
Metrics To Measure Campaign Performance Ppt Background
This is a metrics to measure campaign performance ppt background. This is a two stage process. The stages in this process are brand, leads, sales, loyalty.
-

Employee Performance Measurement Kpi Ppt PowerPoint Presentation Inspiration Design Inspiration
This is a employee performance measurement kpi ppt powerpoint presentation inspiration design inspiration. This is a four stage process. The stages in this process are financial, business, management, marketing.
-
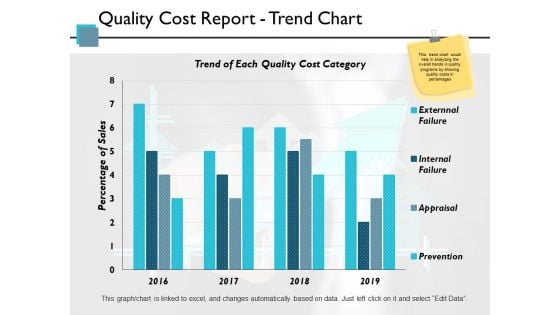
Quality Cost Report Trend Chart Ppt PowerPoint Presentation Pictures Themes
This is a quality cost report trend chart ppt powerpoint presentation pictures themes. This is a four stage process. The stages in this process are finance, strategy, marketing, management, business.
-
Debt Crisis Management And Recovery Icon Elements PDF
Presenting Debt Crisis Management And Recovery Icon Elements PDF to dispense important information. This template comprises four stages. It also presents valuable insights into the topics including Debt Crisis, Management Recovery Icon This is a completely customizable PowerPoint theme that can be put to use immediately. So, download it and address the topic impactfully.
-

Stocks Contribution Ppt PowerPoint Presentation Layouts Information
This is a stocks contribution ppt powerpoint presentation layouts information. This is a four stage process. The stages in this process are finanace, marketing, business, management, strategy.
-
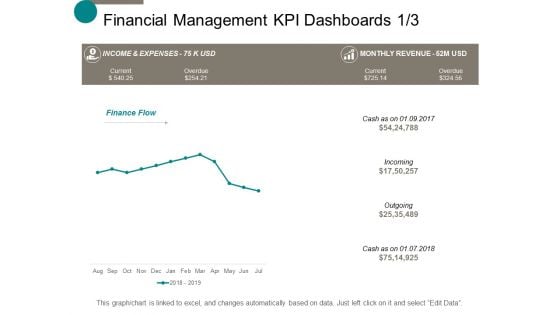
Financial Management Kpi Dashboards Business Ppt Powerpoint Presentation Show Gridlines
This is a financial management kpi dashboards business ppt powerpoint presentation show gridlines. This is a four stage process. The stages in this process are finance, marketing, management, investment, analysis.
-
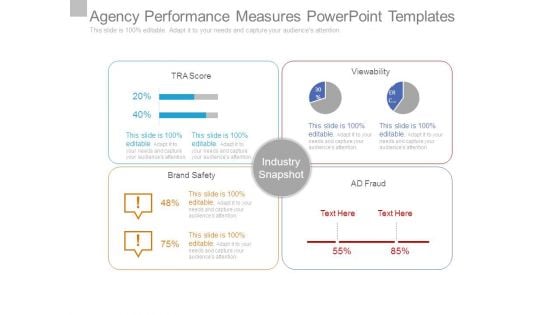
Agency Performance Measures Powerpoint Templates
This is a agency performance measures powerpoint templates. This is a four stage process. The stages in this process are industry snapshot, brand safety, ad fraud, viewability, tra score.
-
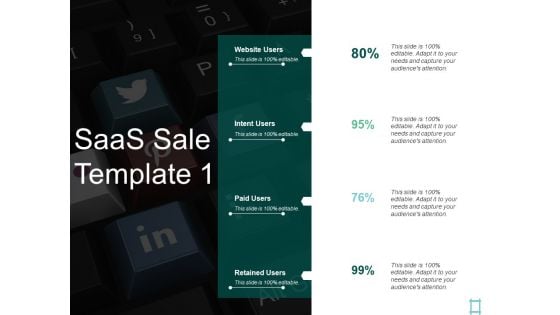
Saas Sale Paid Users Ppt PowerPoint Presentation Ideas Icon
This is a saas sale paid users ppt powerpoint presentation ideas icon. This is a four stage process. The stages in this process are website users, intent users, paid users, retained users, marketing.
-
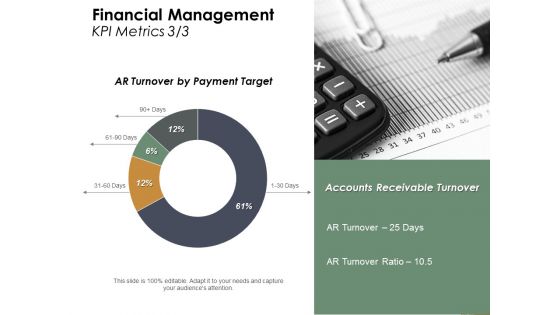
Financial Management Kpi Metrics Strategy Ppt Powerpoint Presentation Professional Show
This is a financial management kpi metrics strategy ppt powerpoint presentation professional show. This is a four stage process. The stages in this process are finance, marketing, management, investment, analysis.
-
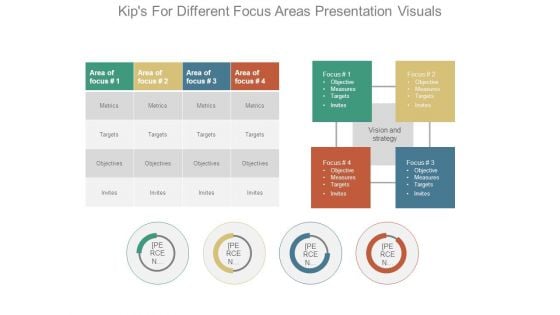
Kips For Different Focus Areas Presentation Visuals
This is a kips for different focus areas presentation visuals. This is a four stage process. The stages in this process are area of focus, metrics, targets, objectives, invites, vision and strategy, focus.
-
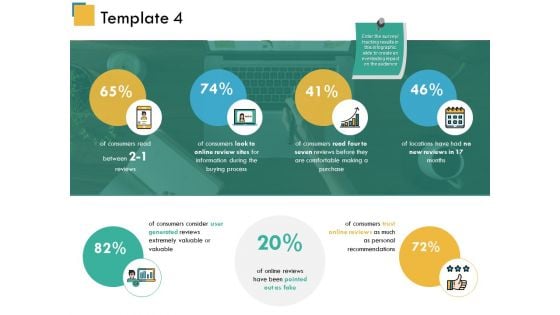
Template 4 Ppt PowerPoint Presentation Infographic Template Images
This is a template 4 ppt powerpoint presentation infographic template images. This is a four stage process. The stages in this process are business, finance, marketing, icons, strategy.
-
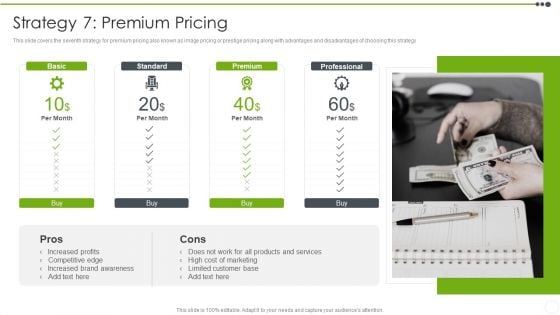
Estimating The Price Strategy 7 Premium Pricing Guidelines PDF
This slide covers the seventh strategy for premium pricing also known as image pricing or prestige pricing along with advantages and disadvantages of choosing this strategy. Presenting Estimating The Price Strategy 7 Premium Pricing Guidelines PDF to provide visual cues and insights. Share and navigate important information on four stages that need your due attention. This template can be used to pitch topics like Marketing, Cost, Customer, Products, Services. In addtion, this PPT design contains high resolution images, graphics, etc, that are easily editable and available for immediate download.
-
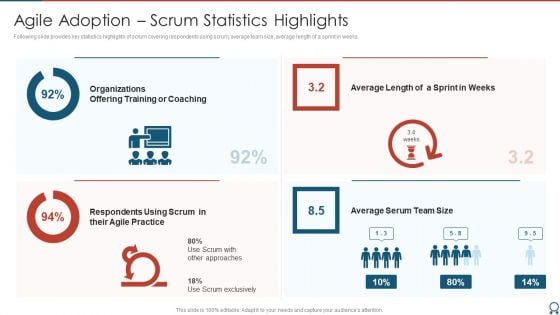
Agile Certified Professional Agile Adoption Scrum Statistics Highlights Formats PDF
Following slide provides key statistics highlights of scrum covering respondents using scrum, average team size, average length of a sprint in weeks. Presenting Agile Certified Professional Agile Adoption Scrum Statistics Highlights Formats PDF to provide visual cues and insights. Share and navigate important information on four stages that need your due attention. This template can be used to pitch topics like Organizations Offering Training Or Coaching, Average Length, Sprint Weeks. In addtion, this PPT design contains high resolution images, graphics, etc, that are easily editable and available for immediate download.
-
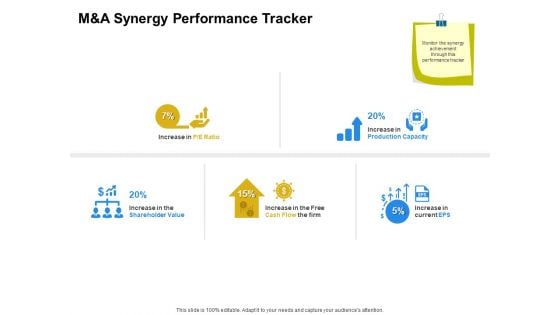
Firm Working Together M And A Synergy Performance Tracker Ppt Infographics Vector PDF
Presenting this set of slides with name firm working together m and a synergy performance tracker ppt infographics vector pdf. This is a four stage process. The stages in this process are m and a synergy performance tracker. This is a completely editable PowerPoint presentation and is available for immediate download. Download now and impress your audience.
-
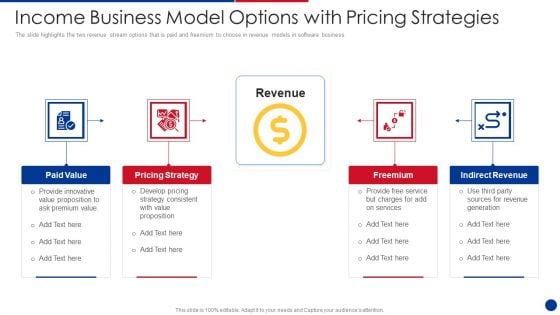
Income Business Model Options With Pricing Strategies Structure PDF
The slide highlights the two revenue stream options that is paid and freemium to choose in revenue models in software business.Presenting Income Business Model Options With Pricing Strategies Structure PDF to dispense important information. This template comprises four stages. It also presents valuable insights into the topics including Paid Value, Pricing Strategy, Indirect Revenue. This is a completely customizable PowerPoint theme that can be put to use immediately. So, download it and address the topic impactfully
-
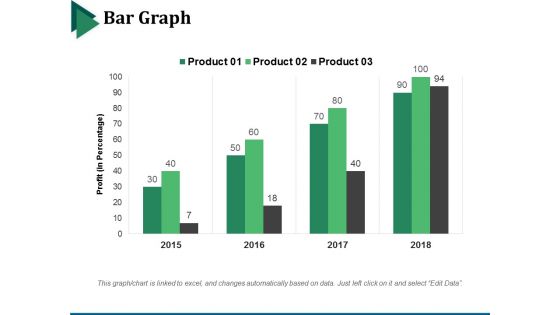
Bar Graph Ppt PowerPoint Presentation File Display
This is a bar graph ppt powerpoint presentation file display. This is a four stage process. The stages in this process are bar graph, marketing, strategy, finance, analysis.
-
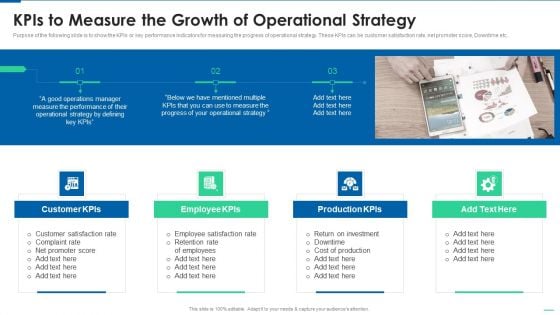
Six Sigma Continuous Process Kpis To Measure The Growth Of Operational Strategy Rules PDF
Purpose of the following slide is to show the KPIs or key performance indicators for measuring the progress of operational strategy. These KPIs can be customer satisfaction rate, net promoter score, Downtime etc. This is a Six Sigma Continuous Process Kpis To Measure The Growth Of Operational Strategy Rules PDF template with various stages. Focus and dispense information on four stages using this creative set, that comes with editable features. It contains large content boxes to add your information on topics like Customer KPIs, Employee KPIs, Production KPIs. You can also showcase facts, figures, and other relevant content using this PPT layout. Grab it now.
-

Financial Project Problems And Their Impact Icon Microsoft PDF
Persuade your audience using this Financial Project Problems And Their Impact Icon Microsoft PDF. This PPT design covers four stages, thus making it a great tool to use. It also caters to a variety of topics including Financial Project Problems And Their Impact Icon. Download this PPT design now to present a convincing pitch that not only emphasizes the topic but also showcases your presentation skills.
-
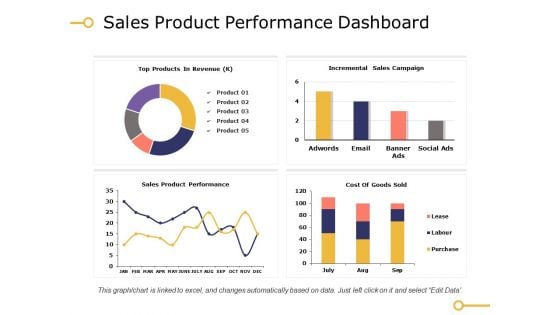
Sales Product Performance Dashboard Ppt PowerPoint Presentation Summary Icon
This is a sales product performance dashboard ppt powerpoint presentation infographics samples. This is a four stage process. The stages in this process are top products in revenue, incremental sales campaign, sales product performance, cost of goods sold.
-
Tangible Asset Management Icon With Land And Building Graphics PDF
Presenting tangible asset management icon with land and building graphics pdf to dispense important information. This template comprises four stages. It also presents valuable insights into the topics including tangible asset management icon with land and building. This is a completely customizable PowerPoint theme that can be put to use immediately. So, download it and address the topic impactfully.
-
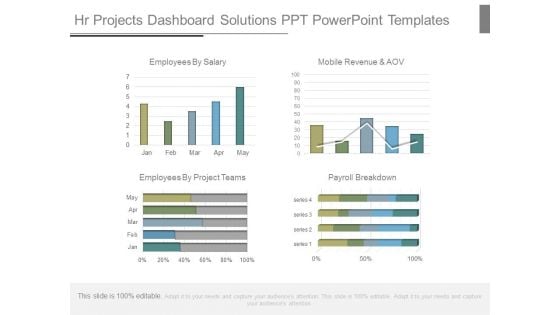
Hr Projects Dashboard Solutions Ppt Powerpoint Templates
This is a hr projects dashboard solutions ppt powerpoint templates. This is a four stage process. The stages in this process are employees by salary, mobile revenue and aov, employees by project teams, payroll breakdown, jan, feb, mar, apr, may, series.
-
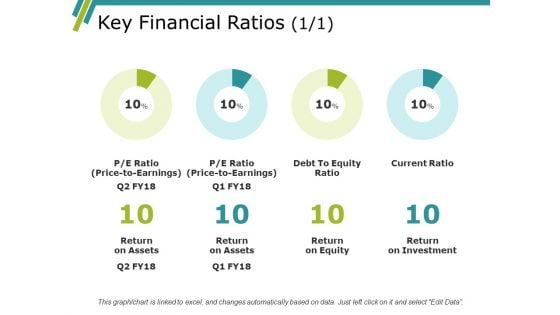
Key Financial Ratios Ppt PowerPoint Presentation Model Elements
This is a key financial ratios ppt powerpoint presentation model elements. This is a four stage process. The stages in this process are return on assets, return on equity, return on investment.
-
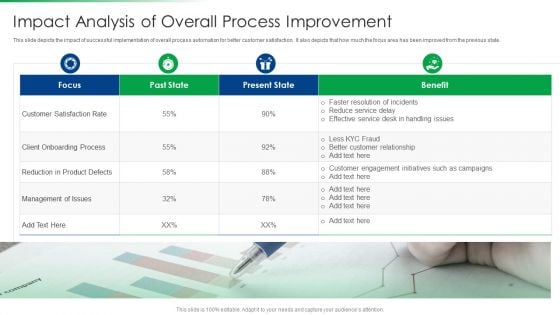
Strawman Project Action Plan Impact Analysis Of Overall Process Improvement Background PDF
This slide depicts the impact of successful implementation of overall process automation for better customer satisfaction. It also depicts that how much the focus area has been improved from the previous state. This is a strawman project action plan impact analysis of overall process improvement background pdf template with various stages. Focus and dispense information on four stages using this creative set, that comes with editable features. It contains large content boxes to add your information on topics like impact analysis of overall process improvement. You can also showcase facts, figures, and other relevant content using this PPT layout. Grab it now.
-
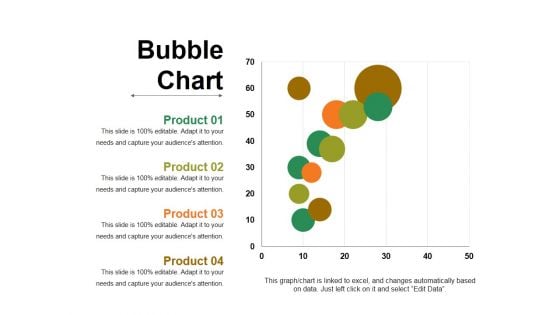
Bubble Chart Ppt PowerPoint Presentation Show Graphics
This is a bubble chart ppt powerpoint presentation show graphics. This is a four stage process. The stages in this process are business, marketing, graph, finance, strategy.
-
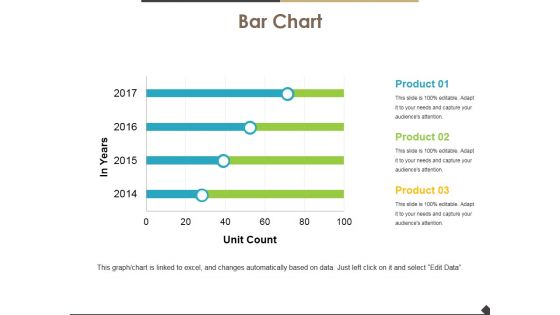
Bar Chart Ppt PowerPoint Presentation Show Grid
This is a bar chart ppt powerpoint presentation show grid. This is a four stage process. The stages in this process are bar chart, finance, marketing, analysis, business.
-
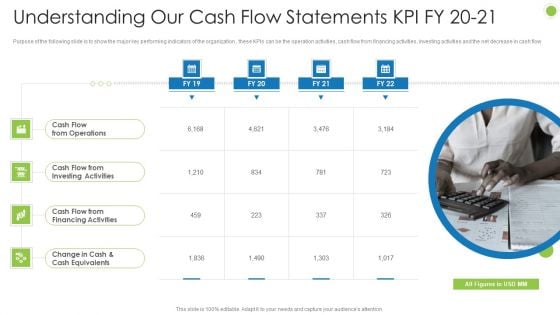
Debt Retrieval Techniques Understanding Our Cash Flow Statements Kpi Fy 20 21 Ppt Infographic Template Background Images PDF
Purpose of the following slide is to show the major key performing indicators of the organization , these KPIs can be the operation activities, cash flow from financing activities, investing activities and the net decrease in cash flow This is a debt retrieval techniques understanding our cash flow statements kpi fy 20 21 ppt infographic template background images pdf template with various stages. Focus and dispense information on four stages using this creative set, that comes with editable features. It contains large content boxes to add your information on topics like cash flow from operations, cash flow from investing activities, cash flow from financing activities, change in cash and cash equivalents. You can also showcase facts, figures, and other relevant content using this PPT layout. Grab it now.
-

Buyer Journey Improvement Initiatives For Customer Service Transformation Topics PDF
Persuade your audience using this buyer journey improvement initiatives for customer service transformation topics pdf. This PPT design covers four stages, thus making it a great tool to use. It also caters to a variety of topics including metrics, sales manager, product manager. Download this PPT design now to present a convincing pitch that not only emphasizes the topic but also showcases your presentation skills.
-
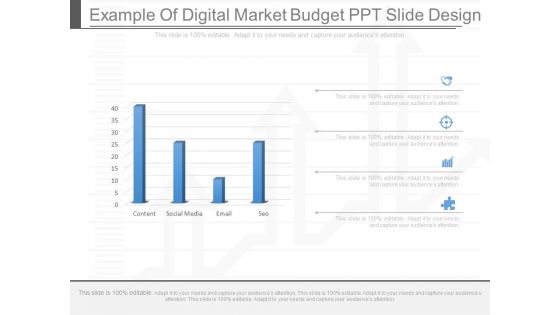
Example Of Digital Market Budget Ppt Slide Design
This is a example of digital market budget ppt slide design. This is a four stage process. The stages in this process are content, social media, email, seo.
-
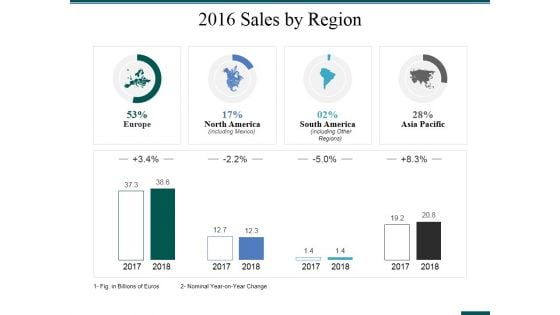
2016 Sales By Region Ppt PowerPoint Presentation Ideas Structure
This is a 2016 sales by region ppt powerpoint presentation ideas structure. This is a four stage process. The stages in this process are business, finance, strategy, management, location.
-
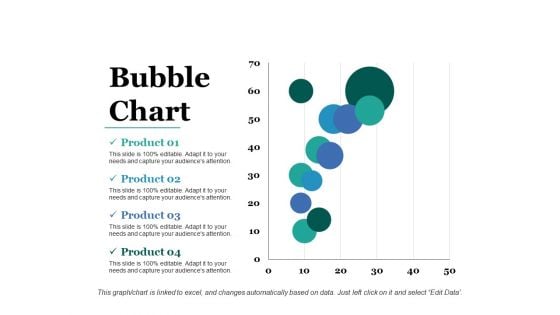
Bubble Chart Ppt PowerPoint Presentation File Styles
This is a bubble chart ppt powerpoint presentation file styles. This is a four stage process. The stages in this process are chart, business, marketing, strategy, bubble.
-
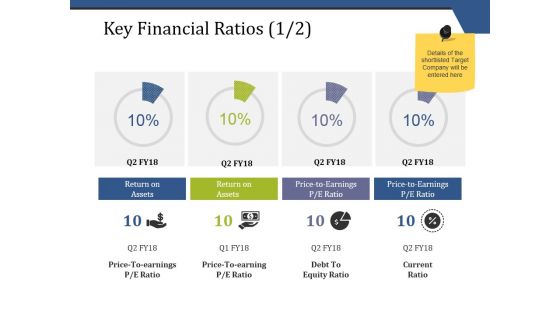
Key Financial Ratios Template 1 Ppt PowerPoint Presentation Outline Graphics Download
This is a key financial ratios template 1 ppt powerpoint presentation outline graphics download. This is a four stage process. The stages in this process are business, finance, analysis, marketing, strategy, investment.
-
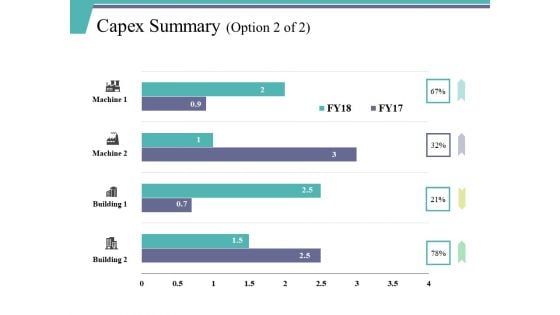
Capex Summary Template 2 Ppt PowerPoint Presentation File Background Designs
This is a capex summary template 2 ppt powerpoint presentation file background designs. This is a four stage process. The stages in this process are building, machine, business, marketing, graph.
-

Member Profile Ppt PowerPoint Presentation Show Designs Download
This is a member profile ppt powerpoint presentation show designs download. This is a four stage process. The stages in this process are business, marketing, person, finance, communication.
-
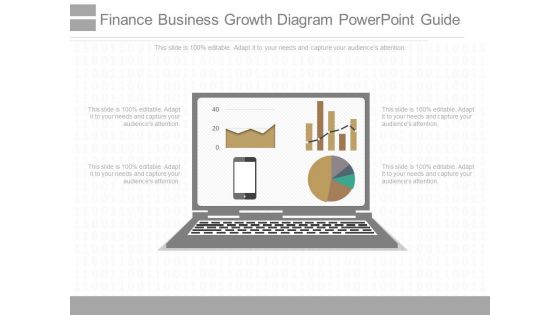
Finance Business Growth Diagram Powerpoint Guide
This is a finance business growth diagram powerpoint guide. This is a four stage process. The stages in this process are business, presentation, success, marketing, management.
-
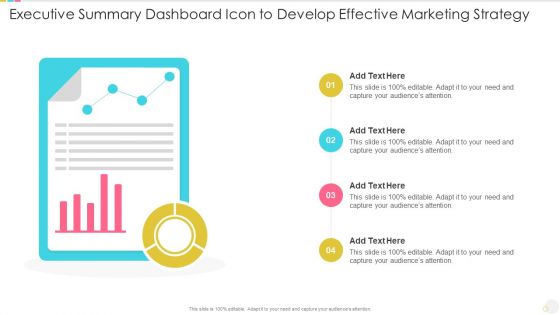
Executive Summary Dashboard Icon To Develop Effective Marketing Strategy Themes PDF
Persuade your audience using this executive summary dashboard icon to develop effective marketing strategy themes pdf. This PPT design covers four stages, thus making it a great tool to use. It also caters to a variety of topics including executive summary dashboard icon to develop effective marketing strategy. Download this PPT design now to present a convincing pitch that not only emphasizes the topic but also showcases your presentation skills.
-
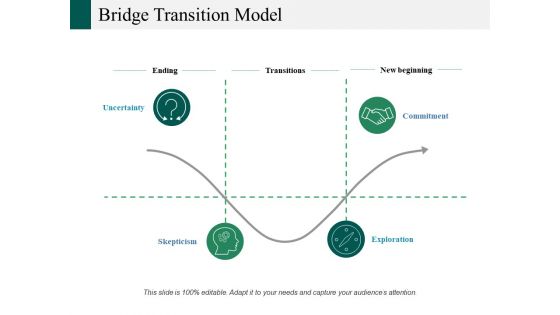
Bridge Transition Model Ppt PowerPoint Presentation Infographics Example
This is a bridge transition model ppt powerpoint presentation infographics example. This is a four stage process. The stages in this process are ending, transitions, uncertainty, commitment, exploration.
-
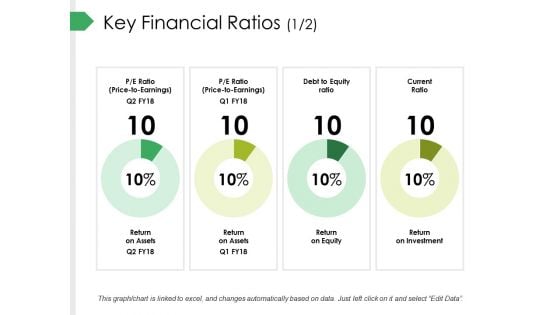
Key Financial Ratios Template 1 Ppt PowerPoint Presentation Summary Maker
This is a key financial ratios template 1 ppt powerpoint presentation summary maker. This is a four stage process. The stages in this process are return on assets, return on equity, return on investment, current ratio, debt to equity ratio.
-
Key Financial Ratios Template 2 Ppt PowerPoint Presentation Pictures Styles
This is a key financial ratios template 2 ppt powerpoint presentation pictures styles. This is a four stage process. The stages in this process are business, finance, analysis, computer, technology, knowledge.
-
External Analysis Report Icon For Business Clipart PDF
Persuade your audience using this external analysis report icon for business clipart pdf. This PPT design covers four stages, thus making it a great tool to use. It also caters to a variety of topics including external analysis report icon for business. Download this PPT design now to present a convincing pitch that not only emphasizes the topic but also showcases your presentation skills.
-
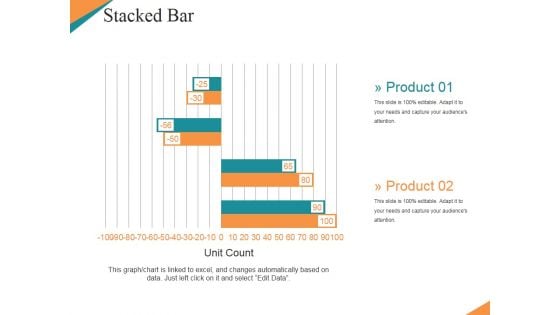
Stacked Bar Ppt PowerPoint Presentation Sample
This is a stacked bar ppt powerpoint presentation sample. This is a four stage process. The stages in this process are planning, management, strategy, marketing, business.
-
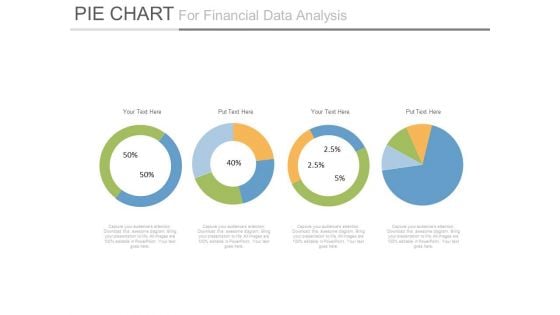
Pie Charts For Financial Ratio Analysis Powerpoint Slides
This PowerPoint template has been designed with diagram of pie charts. This PPT slide can be used to prepare presentations for profit growth report and also for financial data analysis. You can download finance PowerPoint template to prepare awesome presentations.
-
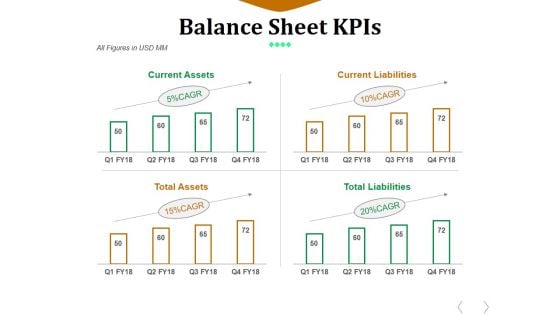
Balance Sheet Kpis Template 2 Ppt PowerPoint Presentation Ideas Graphics
This is a balance sheet kpis template 2 ppt powerpoint presentation ideas graphics. This is a four stage process. The stages in this process are current assets, current liabilities, total assets, total liabilities.
-
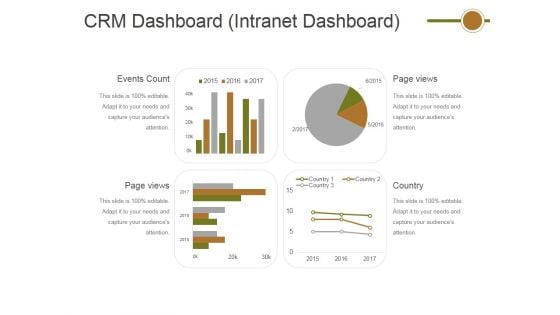
Crm Dashboard Intranet Dashboard Ppt PowerPoint Presentation Outline Professional
This is a crm dashboard intranet dashboard ppt powerpoint presentation outline professional. This is a four stage process. The stages in this process are events count, page views, page views, country.
-
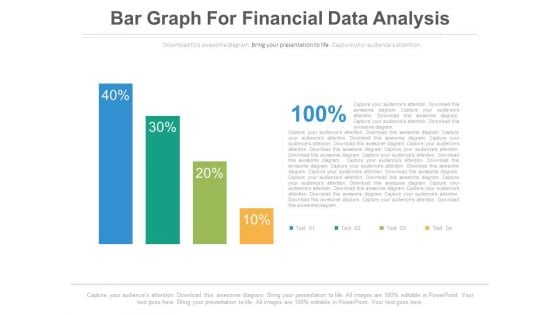
Bar Graph For Profit Growth Analysis Powerpoint Slides
This PowerPoint template has been designed with bar graph with percentage values. This diagram is useful to exhibit profit growth analysis. This diagram slide can be used to make impressive presentations.

 Home
Home 

