- Sign up
- Sign In
 AI PPT Maker
 Templates
 PPT Bundles
 Design Services
 Business PPTs
 Business Plan
 Management
 Strategy
 Introduction PPT
 Roadmap
 Self Introduction
 Timelines
 Process
 Marketing
 Agenda
 Technology
 Medical
 Startup Business Plan
 Cyber Security
 Dashboards
 SWOT
SWOT Proposals
 Education
 Pitch Deck
 Digital Marketing
 KPIs
KPIs Project Management
 Product Management
 Artificial Intelligence
 Target Market
 Communication
 Supply Chain
 Google Slides
 Research Services
 One Pagers
 All Categories
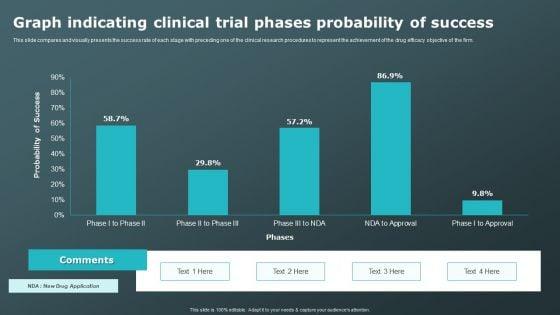
Graph Indicating Clinical Trial Phases Probability Of Success Clinical Research Trial Phases Professional PDF


Features of these PowerPoint presentation slides:
This slide compares and visually presents the success rate of each stage with preceding one of the clinical research procedures to represent the achievement of the drug efficacy objective of the firm. Slidegeeks has constructed Graph Indicating Clinical Trial Phases Probability Of Success Clinical Research Trial Phases Professional PDF after conducting extensive research and examination. These presentation templates are constantly being generated and modified based on user preferences and critiques from editors. Here, you will find the most attractive templates for a range of purposes while taking into account ratings and remarks from users regarding the content. This is an excellent jumping-off point to explore our content and will give new users an insight into our top-notch PowerPoint Templates.
People who downloaded this PowerPoint presentation also viewed the following :
Related Products
Graph Indicating Clinical Trial Phases Probability Of Success Clinical Research Trial Phases Professional PDF with all 2 slides: