2
-
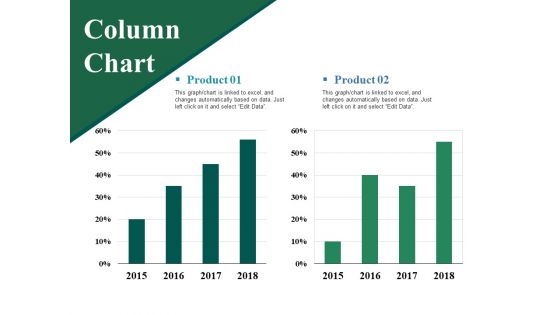
Column Chart Ppt PowerPoint Presentation Ideas Vector
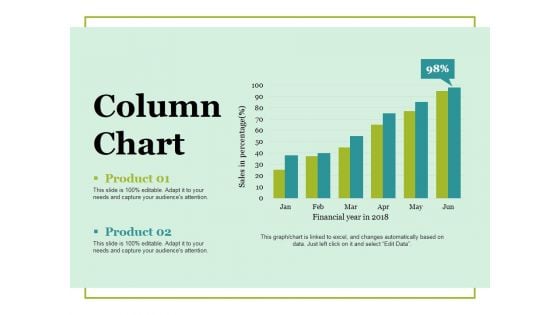
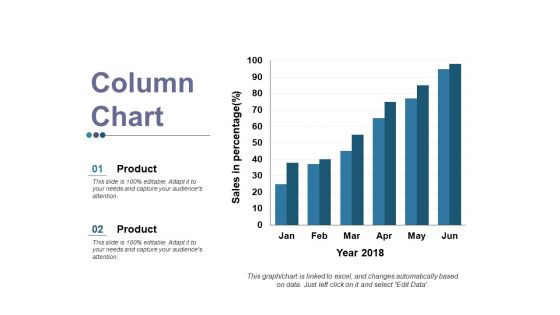
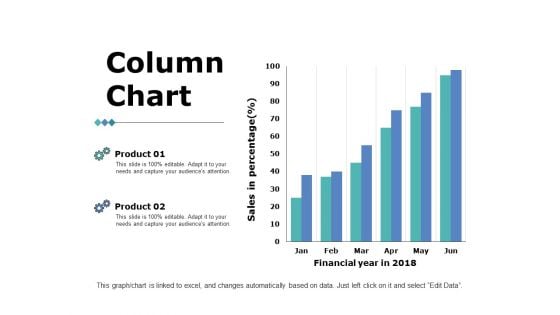
This is a column chart ppt powerpoint presentation ideas vector. This is a two stage process. The stages in this process are column chart, product, financial years, sales in percentage, growth.
-
Column Chart Ppt PowerPoint Presentation Pictures Graphic Images
This is a column chart ppt powerpoint presentation pictures graphic images. This is a two stage process. The stages in this process are product, years, growth, success, bar graph.
-
Column Chart Ppt PowerPoint Presentation Show Images
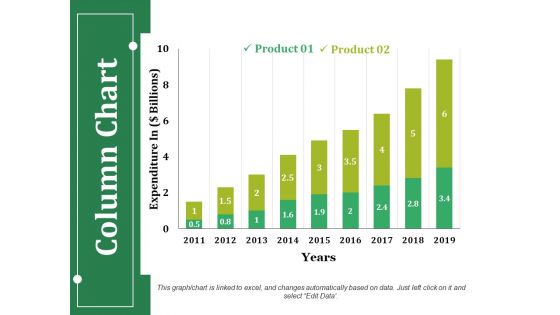
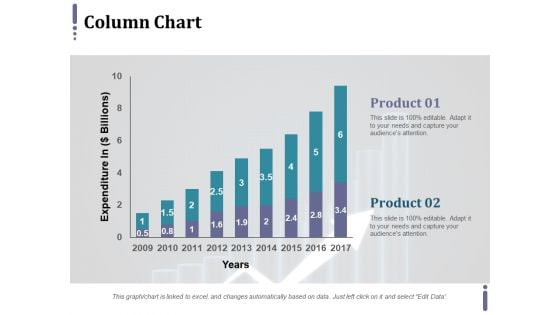
This is a column chart ppt powerpoint presentation show images. This is a two stage process. The stages in this process are product, expenditure, years, bar graph, growth.
-
Line Chart Ppt PowerPoint Presentation Slides
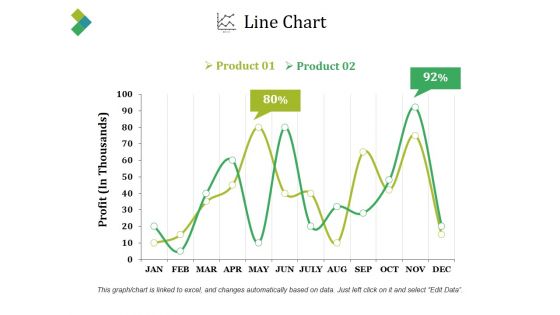
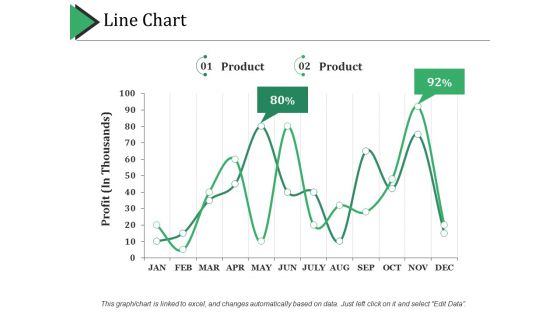
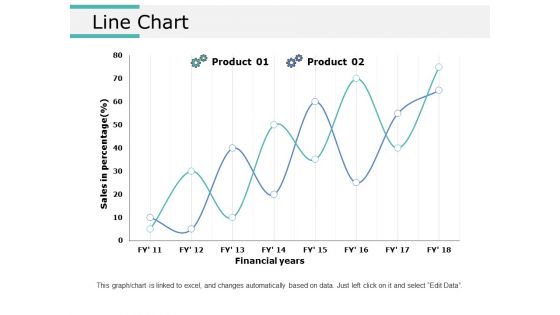
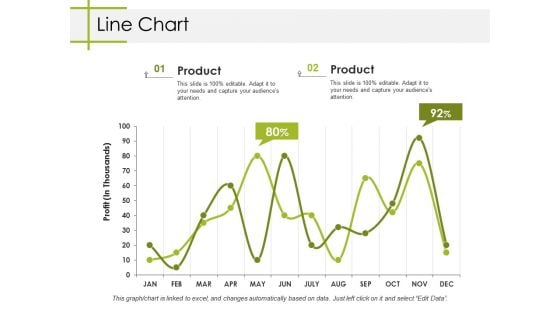
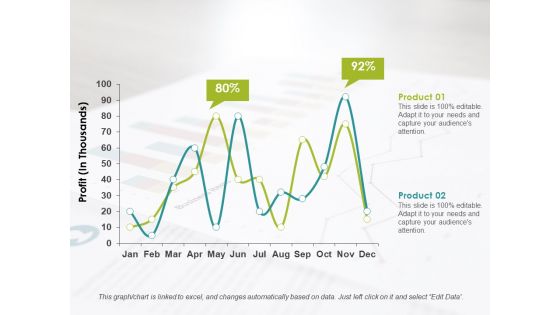
This is a line chart ppt powerpoint presentation slides. This is a two stage process. The stages in this process are product, profit, percentage, finance, line chart.
-
Column Chart Ppt PowerPoint Presentation Gallery Portfolio
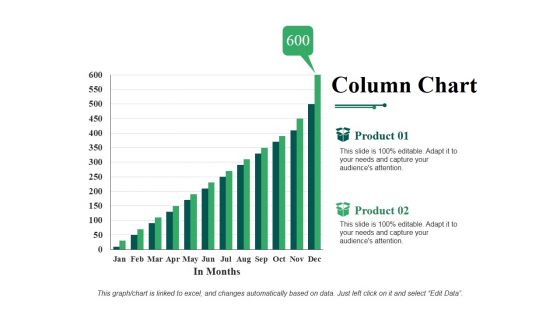
This is a column chart ppt powerpoint presentation gallery portfolio. This is a two stage process. The stages in this process are in months, product, column chart, growth, success.
-
Line Chart Ppt PowerPoint Presentation Slides Mockup
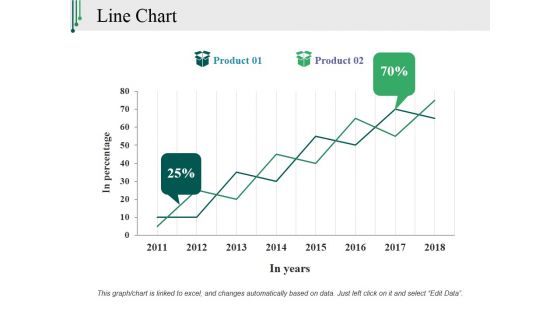
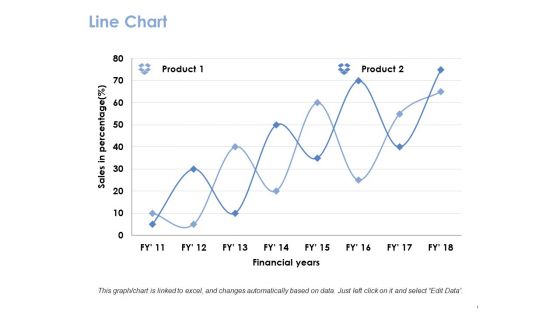
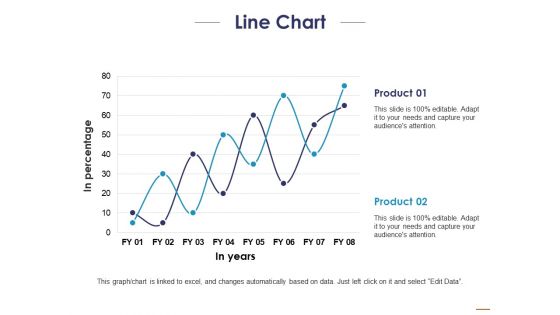
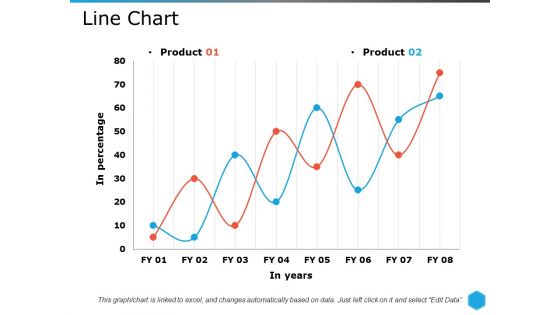
This is a line chart ppt powerpoint presentation slides mockup. This is a two stage process. The stages in this process are in percentage, in years, product, growth, success.
-
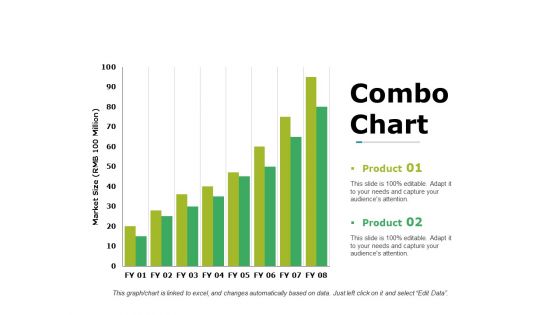
Combo Chart Ppt PowerPoint Presentation Gallery Background Designs
This is a combo chart ppt powerpoint presentation gallery background designs. This is a two stage process. The stages in this process are business, marketing, planning, finance, growth.
-
Line Chart Ppt PowerPoint Presentation Layouts Portfolio
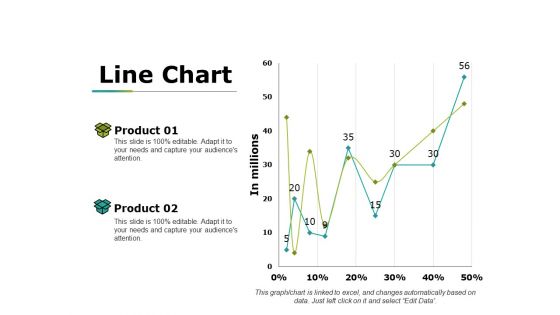
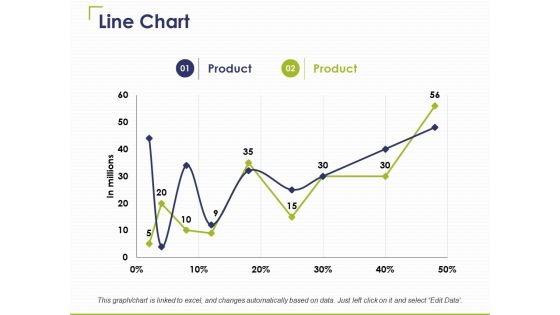
This is a line chart ppt powerpoint presentation layouts portfolio. This is a two stage process. The stages in this process are marketing, in millions, growth, strategy, business.
-
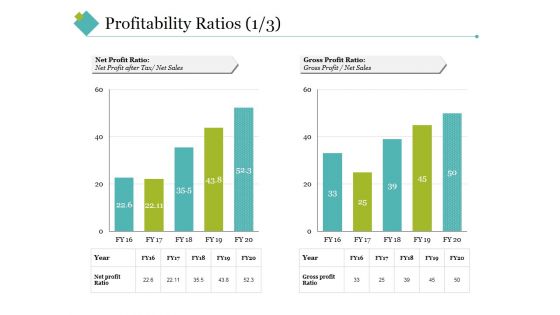
Profitability Ratios Template 2 Ppt PowerPoint Presentation Styles Example Topics
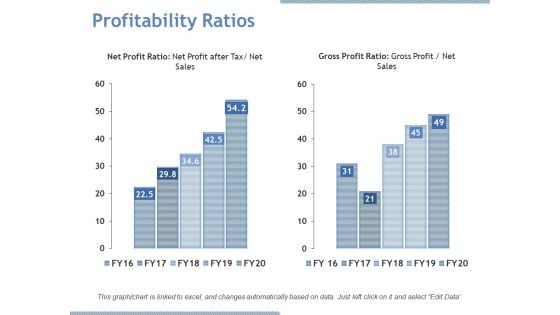
This is a profitability ratios template 2 ppt powerpoint presentation styles example topics. This is a two stage process. The stages in this process are net profit ratio, gross profit ratio, net sales, gross profit, year.
-
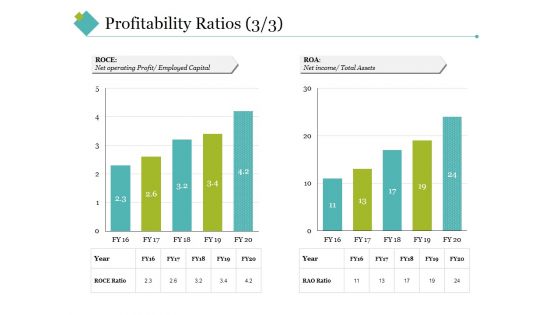
Profitability Ratios Ppt PowerPoint Presentation Portfolio Inspiration
This is a profitability ratios ppt powerpoint presentation portfolio inspiration. This is a two stage process. The stages in this process are roce, roa, total assets, net income, net operating profit.
-
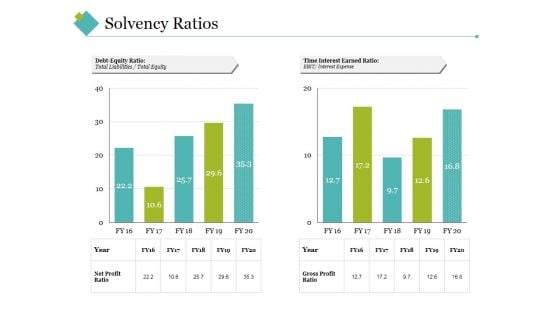
Solvency Ratios Ppt PowerPoint Presentation Professional
This is a solvency ratios ppt powerpoint presentation professional. This is a two stage process. The stages in this process are debt equity ratio, time interest earned ratio, total liabilities, total equity, interest expense.
-
Activity Ratios Template 2 Ppt PowerPoint Presentation Show Images
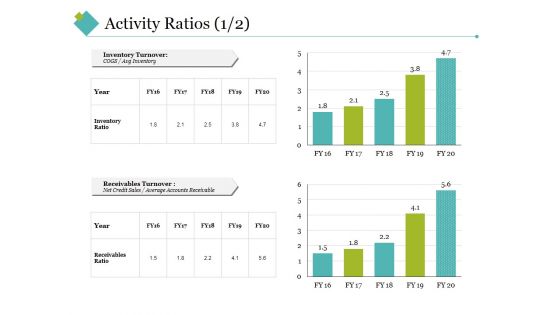
This is a activity ratios template 2 ppt powerpoint presentation show images. This is a two stage process. The stages in this process are inventory turnover, receivables turnover, inventory ratio, receivables ratio, year.
-
Activity Ratios Template 4 Ppt PowerPoint Presentation Styles Slideshow
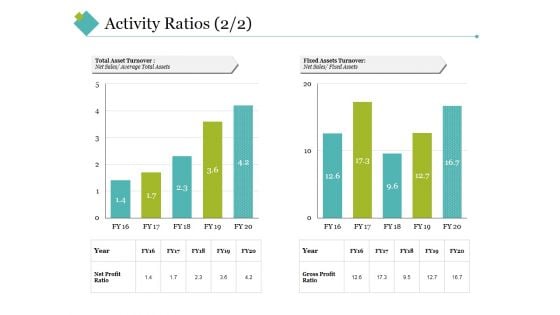
This is a activity ratios template 4 ppt powerpoint presentation styles slideshow. This is a two stage process. The stages in this process are total asset turnover, fixed assets turnover, net sales, year, net profit ratio, gross profit ratio.
-
Bar Chart Ppt PowerPoint Presentation Show Format Ideas
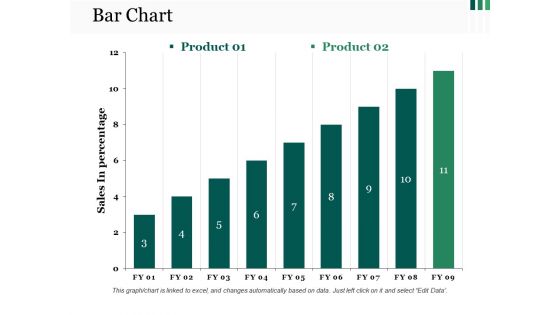
This is a bar chart ppt powerpoint presentation show format ideas. This is a two stage process. The stages in this process are bar graph, growth, success, business, marketing.
-
Activity Ratios Ppt PowerPoint Presentation Gallery Microsoft
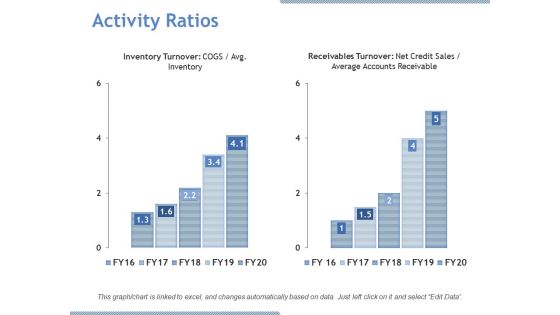
This is a activity ratios ppt powerpoint presentation gallery microsoft. This is a two stage process. The stages in this process are inventory turnover, receivables turnover, net credit sales, average accounts receivable.
-
Liquidity Ratios Ppt PowerPoint Presentation Visual Aids Gallery
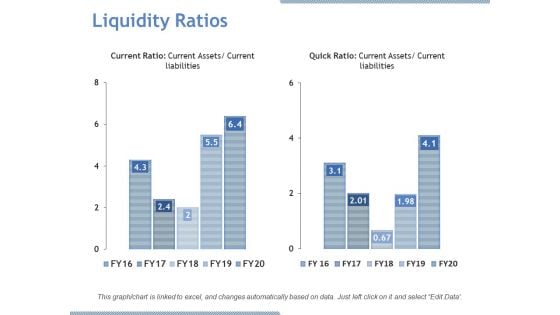
This is a liquidity ratios ppt powerpoint presentation visual aids gallery. This is a two stage process. The stages in this process are current ratio, quick ratio, current assets, current liabilities.
-
Profitability Ratios Ppt PowerPoint Presentation File Portrait
This is a profitability ratios ppt powerpoint presentation file portrait. This is a two stage process. The stages in this process are net profit ratio, gross profit ratio, growth.
-
Solvency Ratios Ppt PowerPoint Presentation Inspiration
This is a solvency ratios ppt powerpoint presentation inspiration. This is a two stage process. The stages in this process are debt equity ratio, time interest earned ratio.
-
Stacked Line With Marker Ppt PowerPoint Presentation Pictures Graphics Download
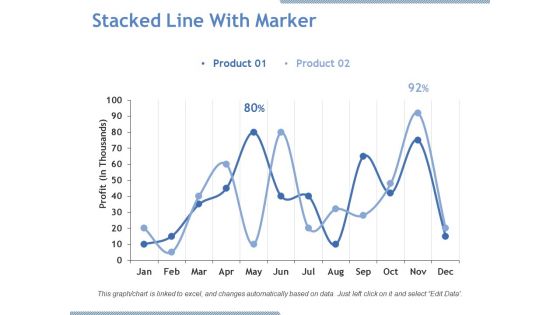
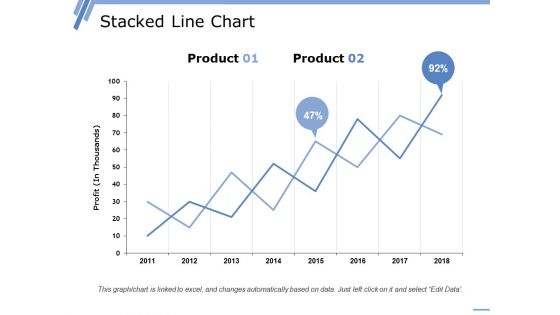
This is a stacked line with marker ppt powerpoint presentation pictures graphics download. This is a two stage process. The stages in this process are product, profit, line chart, business, growth.
-
Area Chart Ppt PowerPoint Presentation Infographic Template Model
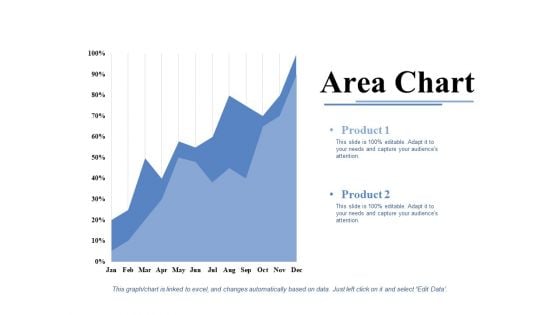
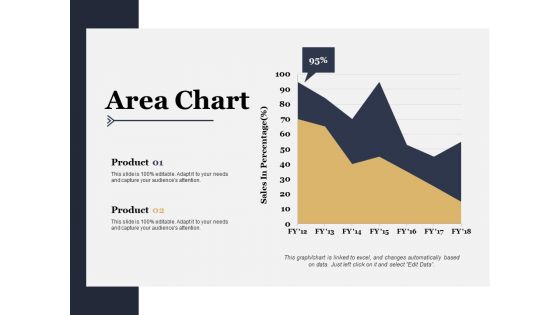
This is a area chart ppt powerpoint presentation infographic template model. This is a two stage process. The stages in this process are product, area chart, growth, percentage, success.
-
Clustered Column Ppt PowerPoint Presentation Pictures Graphics Template
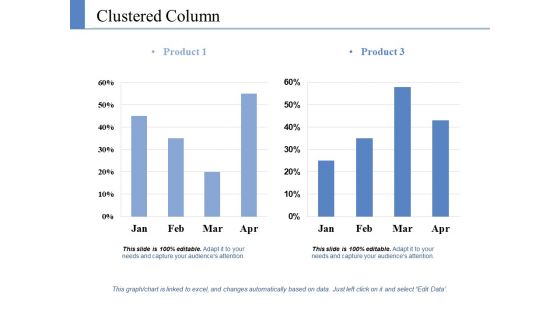
This is a clustered column ppt powerpoint presentation pictures graphics template. This is a two stage process. The stages in this process are product, growth, success, business, bar graph.
-
Bubble Chart Ppt PowerPoint Presentation Infographics Images
This is a bubble chart ppt powerpoint presentation infographics images. This is a two stage process. The stages in this process are product, bubble chart, business, growth, success.
-
Column Chart Ppt PowerPoint Presentation Infographics Guidelines
This is a column chart ppt powerpoint presentation infographics guidelines. This is a two stage process. The stages in this process are product, expenditure in, years, business, bar graph.
-
Line Chart Ppt PowerPoint Presentation Portfolio Graphics Pictures
This is a line chart ppt powerpoint presentation portfolio graphics pictures. This is a two stage process. The stages in this process are line chart, finance, growth, strategy, business.
-
Line Chart Ppt PowerPoint Presentation Icon Example Topics
This is a line chart ppt powerpoint presentation icon example topics. This is a two stage process. The stages in this process are line chart, finance, growth, strategy, business.
-
Column Chart Ppt PowerPoint Presentation Professional Template
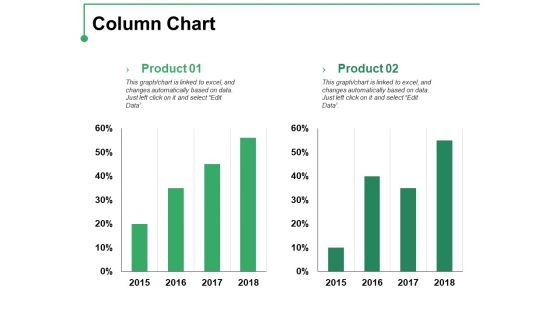
This is a column chart ppt powerpoint presentation professional template. This is a two stage process. The stages in this process are product, percentage, finance, bar graph, growth.
-
Bar Chart Ppt PowerPoint Presentation Infographics Format Ideas
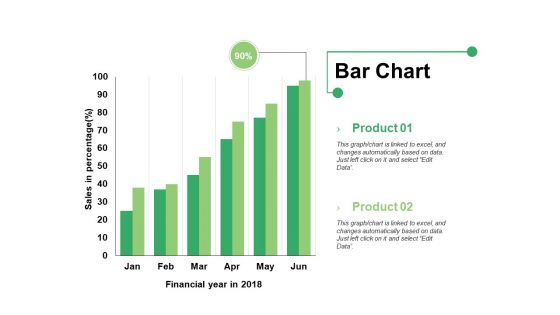
This is a bar chart ppt powerpoint presentation infographics format ideas. This is a two stage process. The stages in this process are bar graph, product, financial year, sales in percentage.
-
Area Chart Ppt PowerPoint Presentation Icon Gallery
This is a area chart ppt powerpoint presentation icon gallery. This is a two stage process. The stages in this process are sales in percentage, product, bar graph.
-
Area Chart Ppt PowerPoint Presentation Pictures Designs
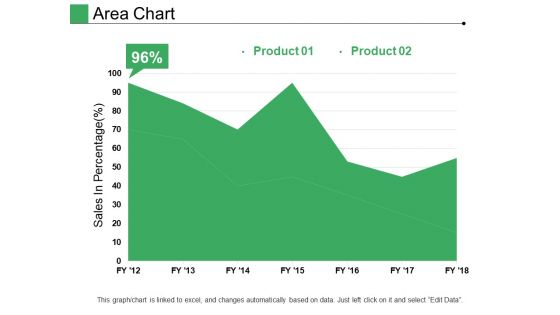
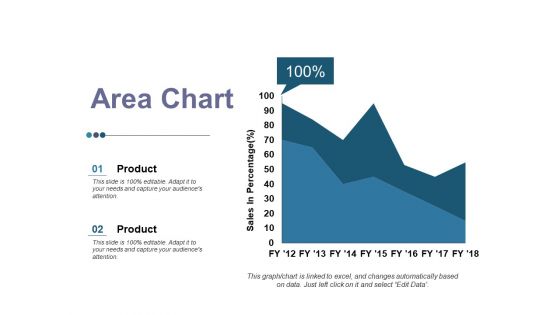
This is a area chart ppt powerpoint presentation pictures designs. This is a two stage process. The stages in this process are product, sales in percentage, growth, success.
-
Column Chart Ppt PowerPoint Presentation Professional Aids
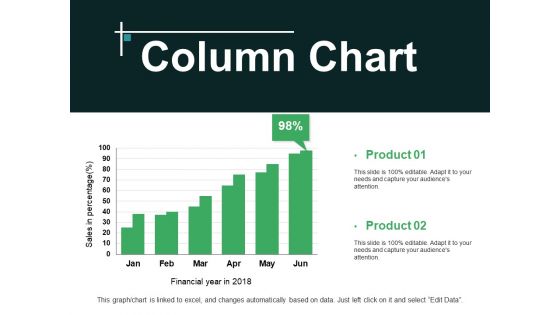
This is a column chart ppt powerpoint presentation professional aids. This is a two stage process. The stages in this process are product, sales in percentage, financial years.
-
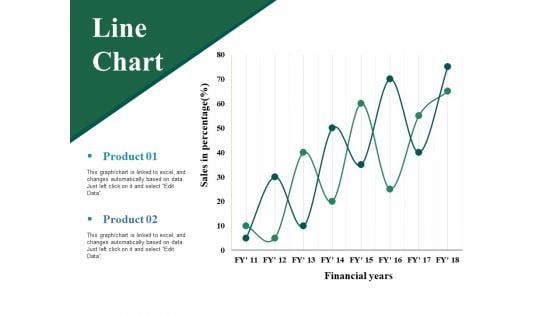
Line Chart Ppt PowerPoint Presentation Pictures Layout
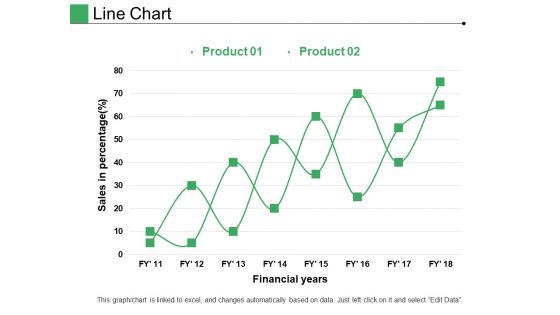
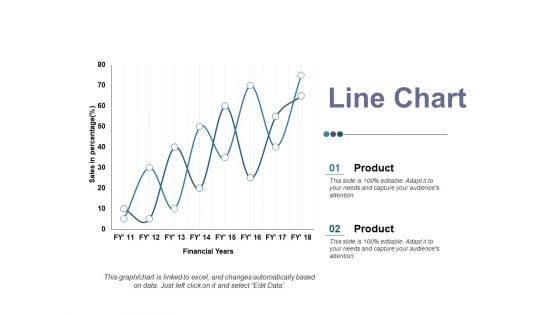
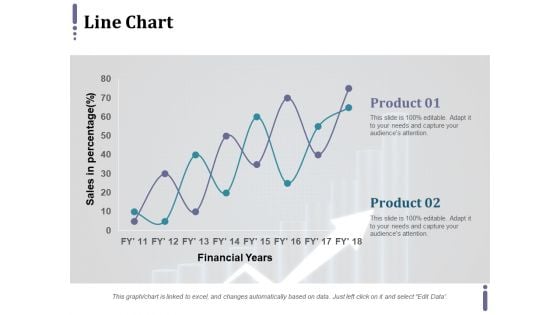
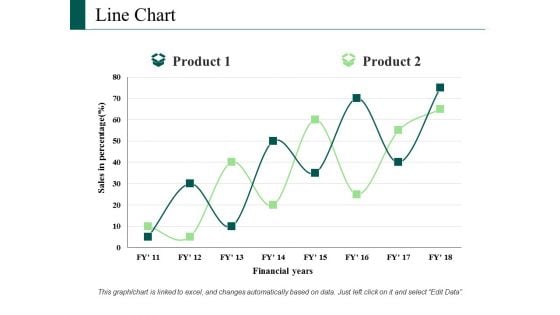
This is a line chart ppt powerpoint presentation pictures layout. This is a two stage process. The stages in this process are product, financial years, sales in percentage.
-
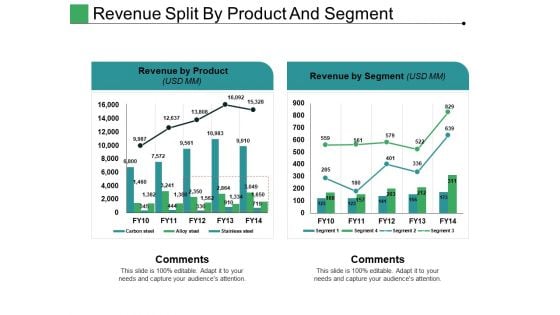
Revenue Split By Product And Segment Ppt PowerPoint Presentation Slides Infographics
This is a revenue split by product and segment ppt powerpoint presentation slides infographics. This is a two stage process. The stages in this process are revenue by product, revenue by segment, comments.
-
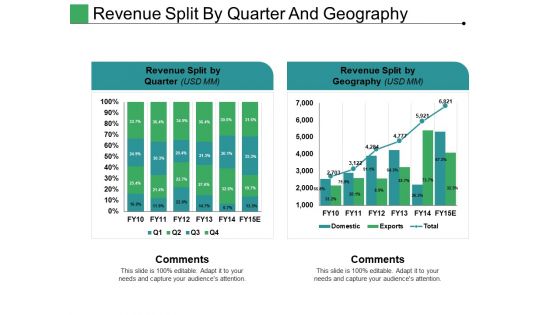
Revenue Split By Quarter And Geography Ppt PowerPoint Presentation Professional Rules
This is a revenue split by quarter and geography ppt powerpoint presentation professional rules. This is a two stage process. The stages in this process are revenue split by quarter, revenue split by geography, comments.
-
Column Chart Ppt PowerPoint Presentation Layouts Vector
This is a column chart ppt powerpoint presentation layouts vector. This is a two stage process. The stages in this process are product, column chart, bar graph, percentage, finance.
-
Line Chart Ppt PowerPoint Presentation Professional Grid
This is a line chart ppt powerpoint presentation professional grid. This is a two stage process. The stages in this process are sales in percentage, financial years, product, line chart.
-
Area Chart Ppt PowerPoint Presentation Show Professional
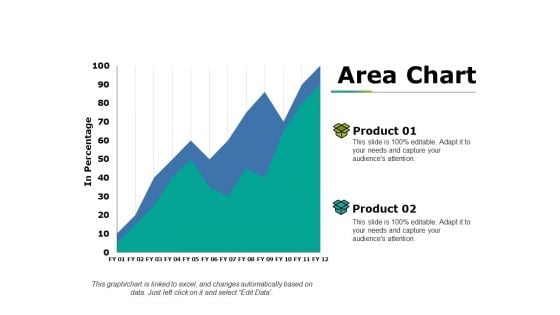
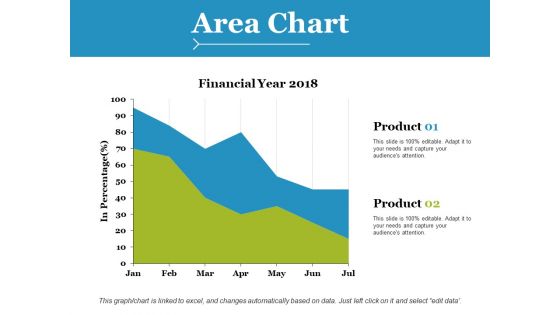
This is a area chart ppt powerpoint presentation show professional. This is a two stage process. The stages in this process are product, in percentage, area chart, growth, success.
-
Line Chart Ppt PowerPoint Presentation Infographic Template Design Ideas
This is a line chart ppt powerpoint presentation infographic template design ideas. This is a two stage process. The stages in this process are product, in millions, percentage, line chart, success.
-
Area Chart Ppt PowerPoint Presentation Inspiration Graphics
This is a area chart ppt powerpoint presentation inspiration graphics. This is a two stage process. The stages in this process are product, area chart, business, growth, sales in percentage.
-
Line Chart Ppt PowerPoint Presentation Ideas Elements
This is a line chart ppt powerpoint presentation ideas elements. This is a two stage process. The stages in this process are product, sales in percentage, financial year, business, line chart.
-
Stacked Line Chart Ppt PowerPoint Presentation Styles Graphics
This is a stacked line chart ppt powerpoint presentation styles graphics. This is a two stage process. The stages in this process are product, year, profit, percentage, growth.
-
Column Chart Ppt PowerPoint Presentation Gallery Layout
This is a column chart ppt powerpoint presentation gallery layout. This is a two stage process. The stages in this process are product, sales in percentage, year.
-
Line Chart Ppt PowerPoint Presentation Gallery Guide
This is a line chart ppt powerpoint presentation gallery guide. This is a two stage process. The stages in this process are product, financial years, sales in percentage.
-
Column Chart Ppt PowerPoint Presentation Model Graphics Example
This is a column chart ppt powerpoint presentation model graphics example. This is a two stage process. The stages in this process are expenditure in, product, years.
-
Line Chart Ppt PowerPoint Presentation Infographic Template Master Slide
This is a line chart ppt powerpoint presentation infographic template master slide. This is a two stage process. The stages in this process are product, financial years, sales in percentage.
-
Area Chart Ppt PowerPoint Presentation Styles Brochure
This is a area chart ppt powerpoint presentation styles brochure. This is a two stage process. The stages in this process are product, financial years, in percentage.
-
Line Chart Ppt PowerPoint Presentation Inspiration Graphics Tutorials
This is a line chart ppt powerpoint presentation inspiration graphics tutorials. This is a two stage process. The stages in this process are line chart, growth, strategy, analysis, business.
-
Template 4 Ppt PowerPoint Presentation Pictures Good
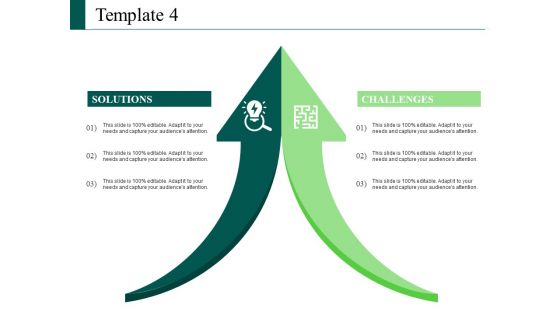
This is a template 4 ppt powerpoint presentation pictures good. This is a two stage process. The stages in this process are business, icons, marketing, strategy, analysis.
-
Column Chart Ppt PowerPoint Presentation Summary
This is a column chart ppt powerpoint presentation summary. This is a two stage process. The stages in this process are bar graph, marketing, strategy, finance, planning.
-
Line Chart Ppt PowerPoint Presentation Ideas Graphics Tutorials
This is a line chart ppt powerpoint presentation ideas graphics tutorials. This is a two stage process. The stages in this process are line chart, marketing, strategy, planning, finance.
-
Market Size And Customer Revenue Analysis PowerPoint Presentation Examples
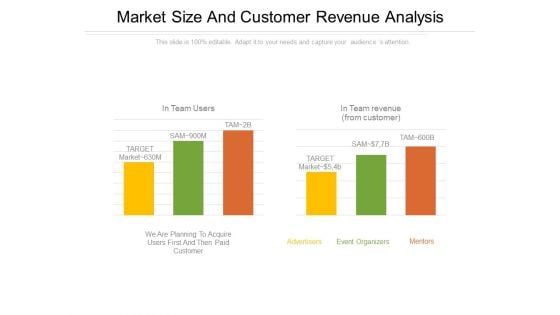
This is a market size and customer revenue analysis powerpoint presentation examples. This is a two stage process. The stages in this process are advertisers, mentors, event organizers, target, in team users.
-
Clustered Bar Ppt PowerPoint Presentation Slides Ideas
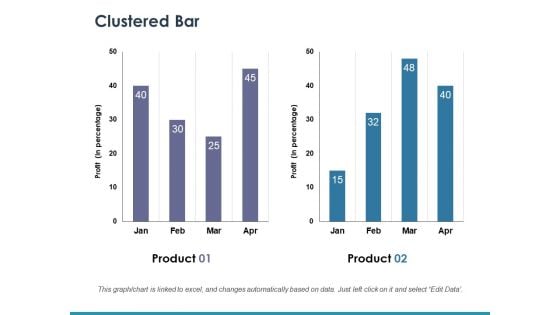
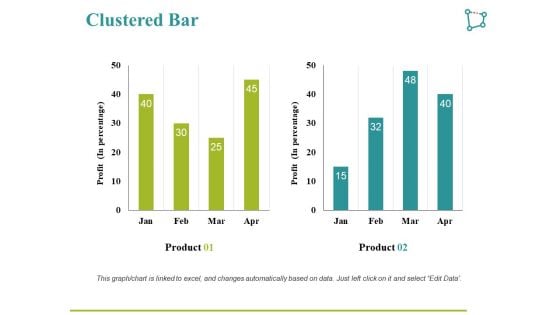
This is a clustered bar ppt powerpoint presentation slides ideas. This is a two stage process. The stages in this process are bar graph, growth, success, business, marketing.
-
Line Chart Ppt PowerPoint Presentation Gallery Example Introduction
This is a line chart ppt powerpoint presentation portfolio shapes. This is a two stage process. The stages in this process are product, financial years, line chart.
-
Line Chart Ppt PowerPoint Presentation Inspiration Slide Download
This is a line chart ppt powerpoint presentation inspiration slide download. This is a two stage process. The stages in this process are product, in millions, business, marketing.
-
Line Chart Ppt PowerPoint Presentation Layouts Templates
This is a line chart ppt powerpoint presentation layouts templates. This is a two stage process. The stages in this process are product, in percentage, in years.
-
Clustered Bar Ppt PowerPoint Presentation Slides Deck
This is a clustered bar ppt powerpoint presentation slides deck. This is a two stage process. The stages in this process are product, profit, bar graph.
-
Line Chart Ppt PowerPoint Presentation Ideas Templates
This is a line chart ppt powerpoint presentation ideas templates. This is a two stage process. The stages in this process are line chart, growth, finance, marketing, analysis, business.
-
Clustered Column Ppt PowerPoint Presentation Infographic Template Backgrounds
This is a clustered column ppt powerpoint presentation infographic template backgrounds. This is a two stage process. The stages in this process are sales in percentage, financial year, product.
-
Line Chart Ppt PowerPoint Presentation Infographics Format Ideas
This is a line chart ppt powerpoint presentation infographics format ideas. This is a two stage process. The stages in this process are product, profit, business.
-
Line Chart Ppt PowerPoint Presentation Pictures Themes
This is a line chart ppt powerpoint presentation pictures themes. This is a two stage process. The stages in this process are line chart, growth, strategy, marketing, strategy, business.
-
Area Chart Ppt PowerPoint Presentation Styles Professional
This is a area chart ppt powerpoint presentation styles professional. This is a two stage process. The stages in this process are sales in percentage, product, area chart.

 Home
Home 


