2 Blocks
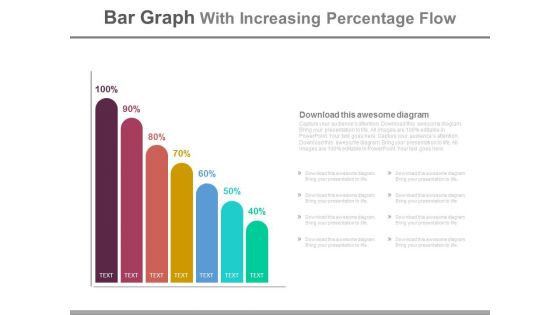
Bar Graph With Increasing Percentage Flow Powerpoint Slides
This PowerPoint slide has been designed with bar graph and increasing percentage values. This diagram slide may be used to display profit growth. Prove the viability of your ideas with this professional slide.
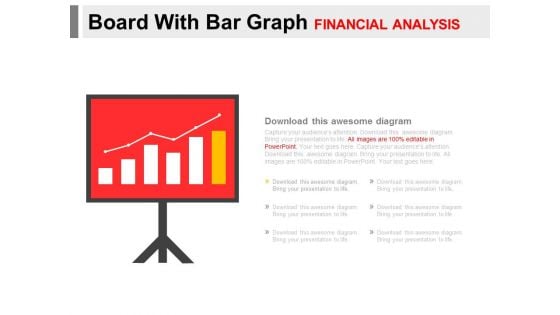
Board With Bar Graph For Financial Analysis Powerpoint Slides
You can download this PowerPoint template to display statistical data and analysis. This PPT slide contains display board with bar graph. Draw an innovative business idea using this professional diagram.
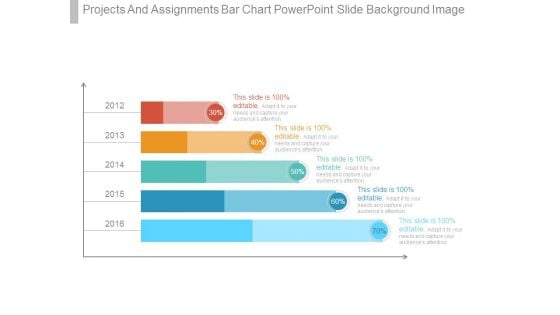
Projects And Assignments Bar Chart Powerpoint Slide Background Image
This is a projects and assignments bar chart powerpoint slide background image. This is a five stage process. The stages in this process are finance, presentation, business, strategy, marketing.

Clustered Bar Finance Ppt PowerPoint Presentation Summary Example Topics
This is a clustered bar finance ppt powerpoint presentation summary example topics. This is a three stage process. The stages in this process are finance, marketing, management, investment, analysis.
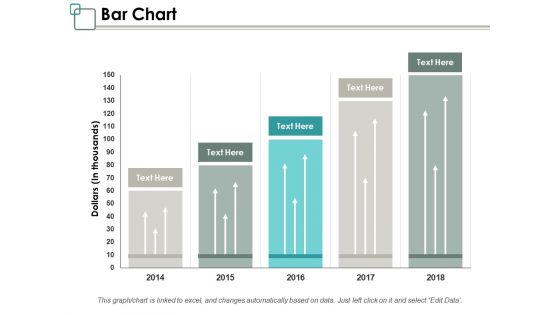
Bar Chart Ppt PowerPoint Presentation Infographic Template Graphics Design
This is a bar chart ppt powerpoint presentation infographic template graphics design. This is a five stage process. The stages in this process are management, marketing, business, percentage, product.
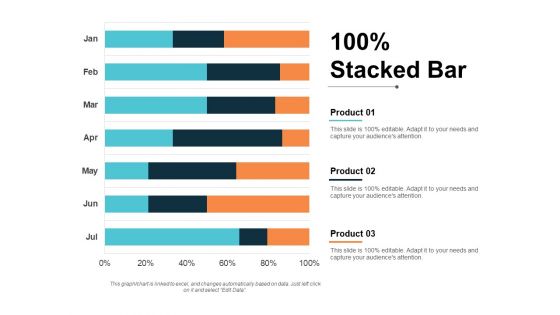
stacked bar finance ppt powerpoint presentation show graphics pictures
This is a stacked bar finance ppt powerpoint presentation show graphics pictures. This is a three stage process. The stages in this process are finance, marketing, management, investment, analysis.
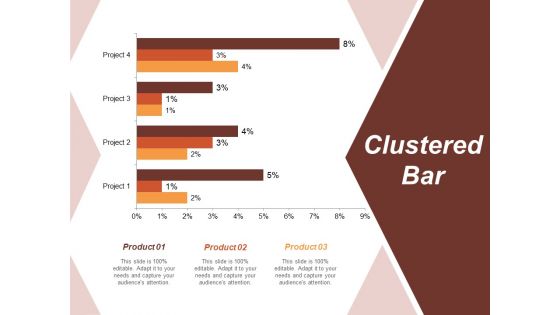
Clustered Bar Risk Estimator Ppt PowerPoint Presentation Layouts Mockup
This is a clustered bar risk estimator ppt powerpoint presentation layouts mockup. This is a four stage process. The stages in this process are business, management, strategy, analysis, marketing.
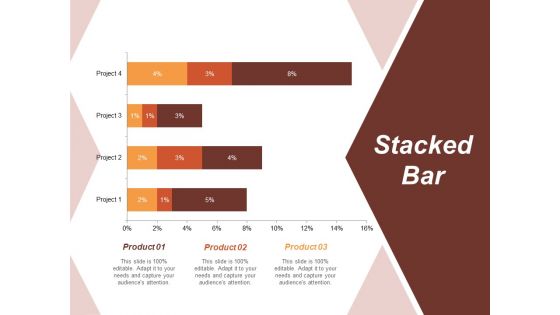
Stacked Bar Risk Estimator Ppt PowerPoint Presentation Gallery Design Templates
This is a stacked bar risk estimator ppt powerpoint presentation gallery design templates. This is a four stage process. The stages in this process are business, management, strategy, analysis, marketing.
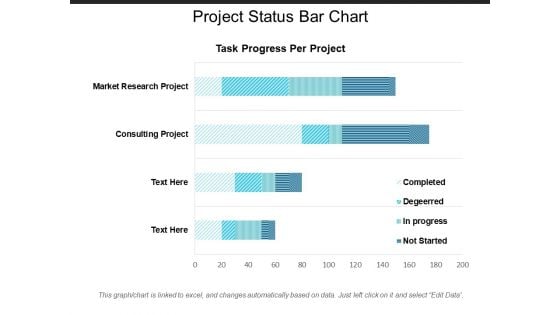
Project Status Bar Chart Ppt PowerPoint Presentation Ideas Objects
This is a project status bar chart ppt powerpoint presentation ideas objects. This is a four stage process. The stages in this process are project management, project progress, project growth.
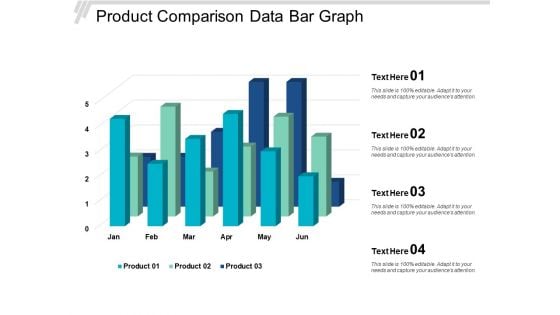
Product Comparison Data Bar Graph Ppt Powerpoint Presentation Slides Show
This is a product comparison data bar graph ppt powerpoint presentation slides show. This is a four stage process. The stages in this process are data presentation, content presentation, information presentation.
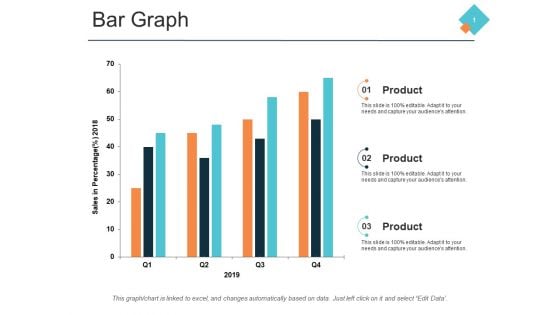
Bar Graph Marketing Process Ppt PowerPoint Presentation Ideas Example Introduction
This is a bar graph marketing process ppt powerpoint presentation ideas example introduction. This is a three stage process. The stages in this process are finance, management, strategy, analysis, marketing.
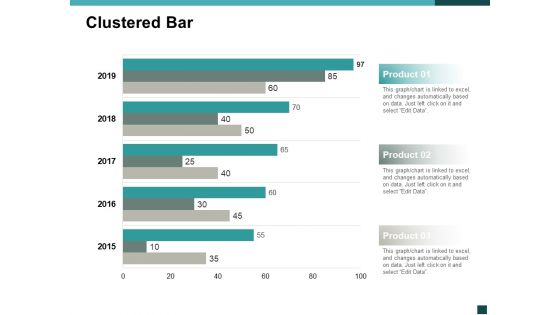
Clustered Bar Finance Ppt Powerpoint Presentation Portfolio Slide Portrait
This is a clustered bar finance ppt powerpoint presentation portfolio slide portrait. This is a three stage process. The stages in this process are finance, marketing, management, investment, analysis.
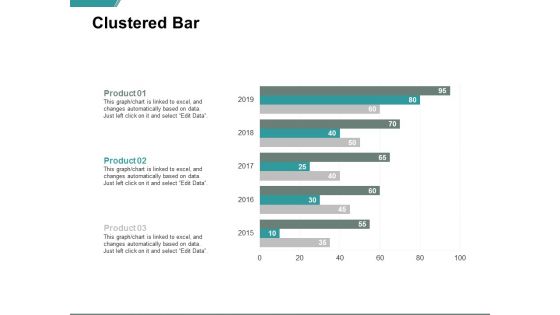
Clustered Bar Finance Marketing Ppt PowerPoint Presentation File Format Ideas
Presenting this set of slides with name clustered bar finance marketing ppt powerpoint presentation file format ideas. This is a one stage process. The stages in this process are finance, marketing, management, investment, analysis. This is a completely editable PowerPoint presentation and is available for immediate download. Download now and impress your audience.
Four Percentage Bars With Business Icons Ppt PowerPoint Presentation Ideas Rules
Presenting this set of slides with name four percentage bars with business icons ppt powerpoint presentation ideas rules. This is a four stage process. The stages in this process are four percentage bars with business icons. This is a completely editable PowerPoint presentation and is available for immediate download. Download now and impress your audience.
Dollar Note With Growing Payback Bar Vector Icon Ppt PowerPoint Presentation File Example PDF
Presenting dollar note with growing payback bar vector icon ppt powerpoint presentation file example pdf to dispense important information. This template comprises three stages. It also presents valuable insights into the topics including dollar note with growing payback bar vector icon. This is a completely customizable PowerPoint theme that can be put to use immediately. So, download it and address the topic impactfully.
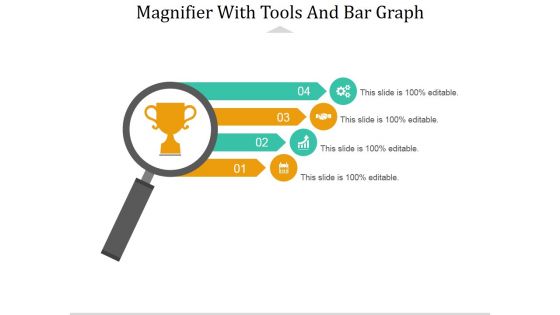
Magnifier With Tools And Bar Graph Ppt PowerPoint Presentation Portfolio Templates
This is a magnifier with tools and bar graph ppt powerpoint presentation portfolio templates. This is a four stage process. The stages in this process are magnifier, search, marketing, strategy, business.
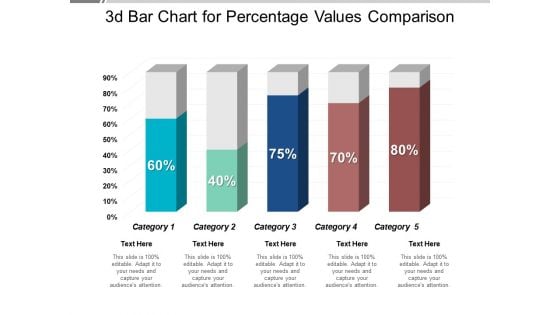
3D Bar Chart For Percentage Values Comparison Ppt PowerPoint Presentation Professional Visual Aids
This is a 3d bar chart for percentage values comparison ppt powerpoint presentation professional visual aids. This is a five stage process. The stages in this process are art, colouring, paint brush.

Bar Chart With Magnifying Glass For Financial Analysis Ppt Powerpoint Presentation Infographics Designs Download
This is a bar chart with magnifying glass for financial analysis ppt powerpoint presentation infographics designs download. This is a three stage process. The stages in this process are business metrics, business kpi, business dashboard.
Bar Graph Icon For Research Analysis Ppt PowerPoint Presentation Summary Portfolio
Presenting this set of slides with name bar graph icon for research analysis ppt powerpoint presentation summary portfolio. This is a three stage process. The stages in this process are data visualization icon, research analysis, business focus. This is a completely editable PowerPoint presentation and is available for immediate download. Download now and impress your audience.
Performance Monitoring Vector Icon Bar Graph In Magnifying Glass Ppt PowerPoint Presentation Summary Gallery
Presenting this set of slides with name performance monitoring vector icon bar graph in magnifying glass ppt powerpoint presentation summary gallery. This is a one stage process. The stages in this process are growth, improvement, enhancement. This is a completely editable PowerPoint presentation and is available for immediate download. Download now and impress your audience.
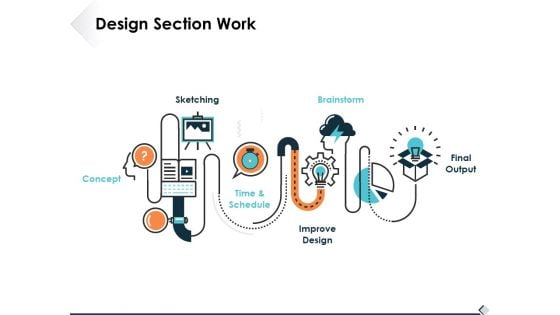
Design Section Work Ppt PowerPoint Presentation Summary Ideas
This is a design section work ppt powerpoint presentation summary ideas. This is a six stage process. The stages in this process are icons, management, strategy, analysis, marketing.
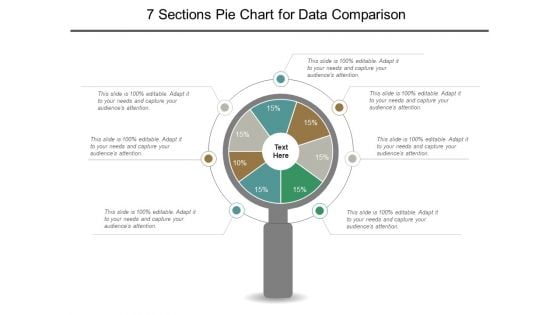
7 Sections Pie Chart For Data Comparison Ppt PowerPoint Presentation File Graphics Template
This is a 7 sections pie chart for data comparison ppt powerpoint presentation file graphics template. This is a seven stage process. The stages in this process are 6 piece pie chart, 6 segment pie chart, 6 parts pie chart.
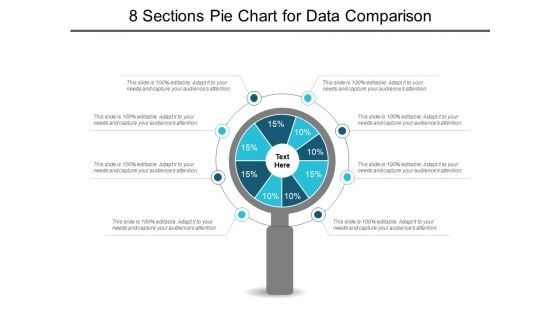
8 Sections Pie Chart For Data Comparison Ppt PowerPoint Presentation Show Slideshow
This is a 8 sections pie chart for data comparison ppt powerpoint presentation show slideshow. This is a eight stage process. The stages in this process are 6 piece pie chart, 6 segment pie chart, 6 parts pie chart.
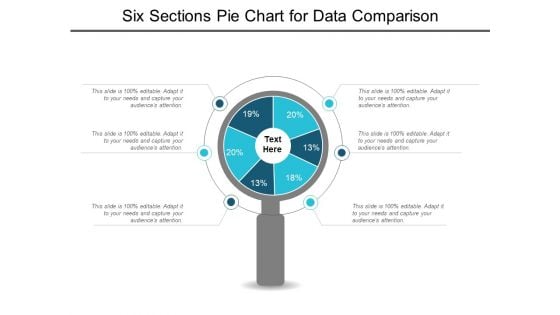
Six Sections Pie Chart For Data Comparison Ppt PowerPoint Presentation Styles Graphics Example
This is a six sections pie chart for data comparison ppt powerpoint presentation styles graphics example. This is a six stage process. The stages in this process are 6 piece pie chart, 6 segment pie chart, 6 parts pie chart.
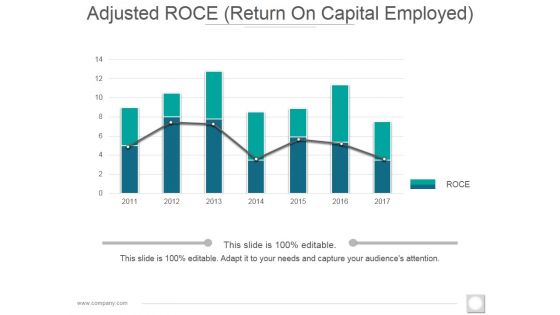
Adjusted Roce Template 1 Ppt PowerPoint Presentation Styles Background Designs
This is a adjusted roce template 1 ppt powerpoint presentation styles background designs. This is a seven stage process. The stages in this process are bar graph, finance, year, business, marketing.

Clustered Column Line Ppt PowerPoint Presentation Slide
This is a clustered column line ppt powerpoint presentation slide. This is a three stage process. The stages in this process are bar graph, growth, finance, product, sales in percentage.
Product Launch Budget Plan Ppt PowerPoint Presentation Icon Slide
This is a product launch budget plan ppt powerpoint presentation icon slide. This is a seven stage process. The stages in this process are bar graph, icons, percentage, finance, business.
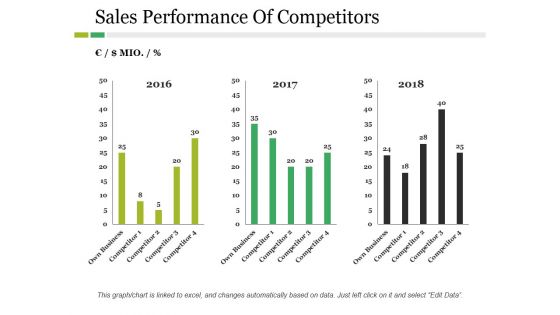
Sales Performance Of Competitors Ppt PowerPoint Presentation Inspiration Example
This is a sales performance of competitors ppt powerpoint presentation inspiration example. This is a three stage process. The stages in this process are business, marketing, year, bar graph, finance.
Competitors Average Price Product Ppt PowerPoint Presentation Icon Layout
This is a competitors average price product ppt powerpoint presentation icon layout. This is a five stage process. The stages in this process are company, bar graph, finance, business, marketing.
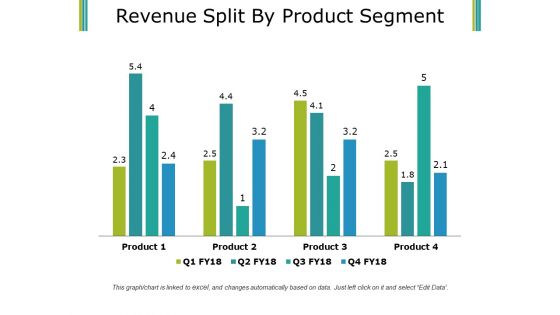
Revenue Split By Product Segment Template 1 Ppt PowerPoint Presentation Infographics Smartart
This is a revenue split by product segment template 1 ppt powerpoint presentation infographics smartart. This is a four stage process. The stages in this process are business, finance, marketing, bar graph, product.

Person Reading Business Section In Newspaper Ppt PowerPoint Presentation Gallery Files PDF
Persuade your audience using this person reading business section in newspaper ppt powerpoint presentation gallery files pdf. This PPT design covers three stages, thus making it a great tool to use. It also caters to a variety of topics including person reading business section in newspaper. Download this PPT design now to present a convincing pitch that not only emphasizes the topic but also showcases your presentation skills.
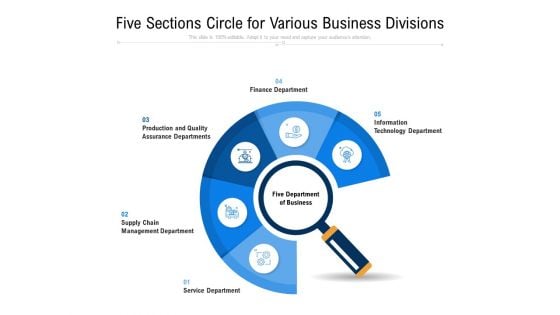
Five Sections Circle For Various Business Divisions Ppt PowerPoint Presentation File Templates PDF
Presenting five sections circle for various business divisions ppt powerpoint presentation file templates pdf to dispense important information. This template comprises five stages. It also presents valuable insights into the topics including finance, management, technology. This is a completely customizable PowerPoint theme that can be put to use immediately. So, download it and address the topic impactfully.
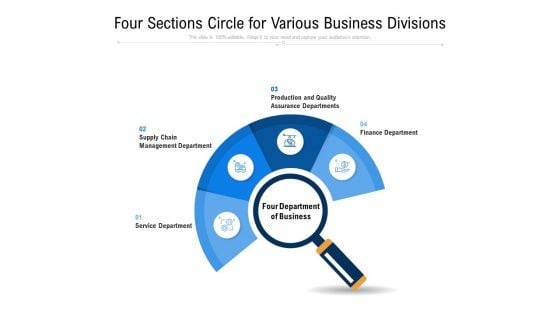
Four Sections Circle For Various Business Divisions Ppt PowerPoint Presentation File Topics PDF
Presenting four sections circle for various business divisions ppt powerpoint presentation file topics pdf to dispense important information. This template comprises four stages. It also presents valuable insights into the topics including management, service, business. This is a completely customizable PowerPoint theme that can be put to use immediately. So, download it and address the topic impactfully.
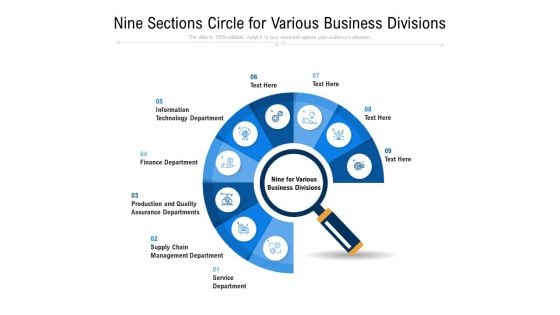
Nine Sections Circle For Various Business Divisions Ppt PowerPoint Presentation Gallery Brochure PDF
Presenting nine sections circle for various business divisions ppt powerpoint presentation gallery brochure pdf to dispense important information. This template comprises nine stages. It also presents valuable insights into the topics including management, service, business. This is a completely customizable PowerPoint theme that can be put to use immediately. So, download it and address the topic impactfully.
Six Sections Circle For Various Business Divisions Ppt PowerPoint Presentation Icon Show PDF
Presenting six sections circle for various business divisions ppt powerpoint presentation icon show pdf to dispense important information. This template comprises six stages. It also presents valuable insights into the topics including management, service, business. This is a completely customizable PowerPoint theme that can be put to use immediately. So, download it and address the topic impactfully.
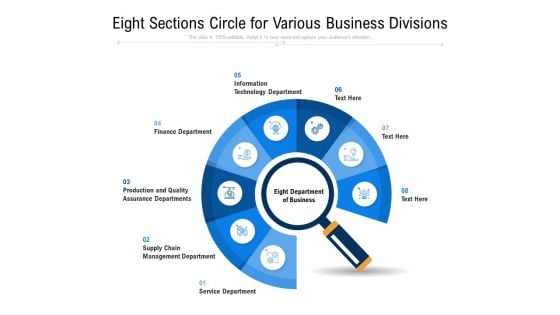
Eight Sections Circle For Various Business Divisions Ppt PowerPoint Presentation Gallery Ideas PDF
Persuade your audience using this eight sections circle for various business divisions ppt powerpoint presentation gallery ideas pdf. This PPT design covers eight stages, thus making it a great tool to use. It also caters to a variety of topics including finance, management, technology. Download this PPT design now to present a convincing pitch that not only emphasizes the topic but also showcases your presentation skills.
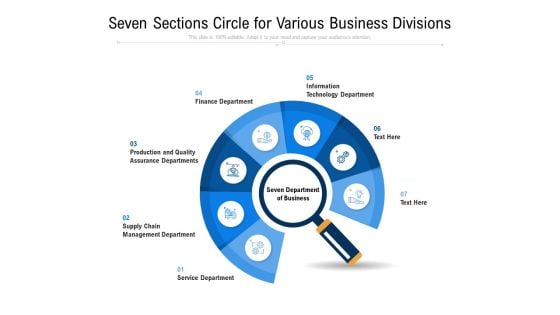
Seven Sections Circle For Various Business Divisions Ppt PowerPoint Presentation File Background Designs PDF
Persuade your audience using this seven sections circle for various business divisions ppt powerpoint presentation file background designs pdf. This PPT design covers seven stages, thus making it a great tool to use. It also caters to a variety of topics including management, service, business. Download this PPT design now to present a convincing pitch that not only emphasizes the topic but also showcases your presentation skills.
Evolving Target Consumer List Through Sectionalization Techniques Post It Formats PDF
This is a evolving target consumer list through sectionalization techniques post it formats pdf template with various stages. Focus and dispense information on four stages using this creative set, that comes with editable features. It contains large content boxes to add your information on topics like post it notes. You can also showcase facts, figures, and other relevant content using this PPT layout. Grab it now.
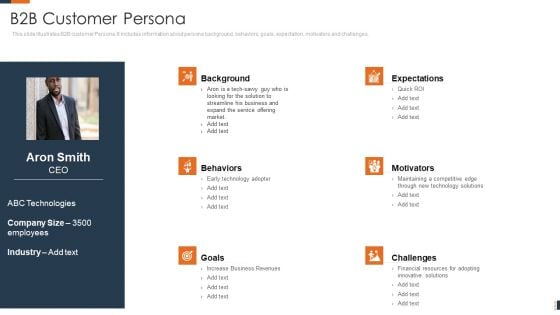
Evolving Target Consumer List Through Sectionalization Techniques B2B Customer Persona Slides PDF
This slide illustrates B2B customer Persona. It includes information about persona background, behaviors, goals, expectation, motivators and challenges. Presenting evolving target consumer list through sectionalization techniques b2b customer persona slides pdf to provide visual cues and insights. Share and navigate important information on six stages that need your due attention. This template can be used to pitch topics like goals, motivators, challenges, expectations, behaviors. In addtion, this PPT design contains high resolution images, graphics, etc, that are easily editable and available for immediate download.
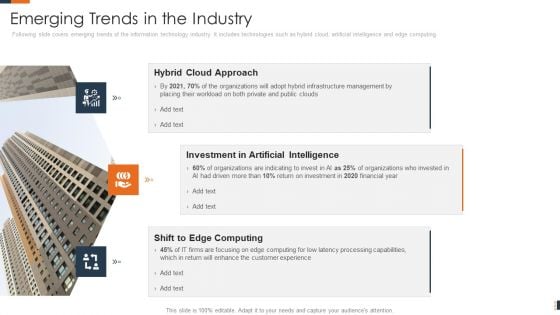
Evolving Target Consumer List Through Sectionalization Techniques Emerging Trends In The Industry Clipart PDF
Following slide covers emerging trends of the information technology industry. It includes technologies such as hybrid cloud, artificial intelligence and edge computing. Presenting evolving target consumer list through sectionalization techniques emerging trends in the industry clipart pdf to provide visual cues and insights. Share and navigate important information on three stages that need your due attention. This template can be used to pitch topics like hybrid cloud approach, investment in artificial intelligence, shift to edge computing. In addtion, this PPT design contains high resolution images, graphics, etc, that are easily editable and available for immediate download.
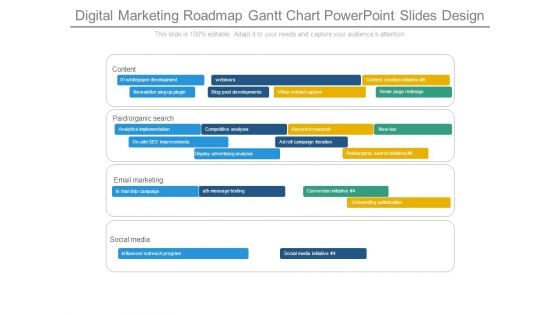
Digital Marketing Roadmap Gantt Chart Powerpoint Slides Design
This is a digital marketing roadmap gantt chart powerpoint slides design. This is a four stage process. The stages in this process are content, whitepaper development, webinars, content creation initiative, newsletter sing up plugin, blog post developments, video lead capture, home page redesign, paid organic search, analytics implementation, competitive analysis, keyword research, new bar, on site seo improvements, ad roll campaign iteration, display advertising analysis, paid organic search initiative, email marketing, trial drip campaign, a b message testing, conversion initiative, onboarding optimization, social media, influencer outreach program , social media initiative.
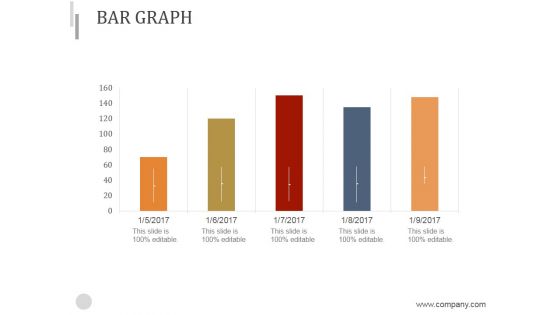
Bar Graph Ppt PowerPoint Presentation Styles
This is a bar graph ppt powerpoint presentation styles. This is a five stage process. The stages in this process are bar graph, business, marketing, strategy, growth.
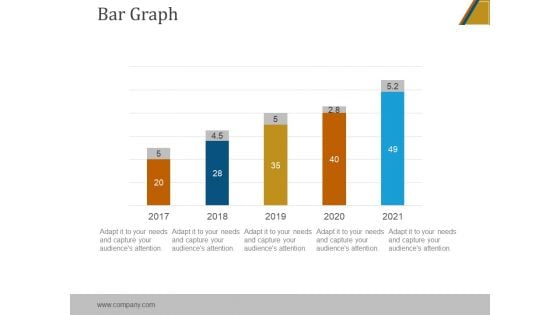
Bar Graph Ppt PowerPoint Presentation Designs
This is a bar graph ppt powerpoint presentation designs. This is a five stage process. The stages in this process are bar graph, marketing, analysis, strategy, business.
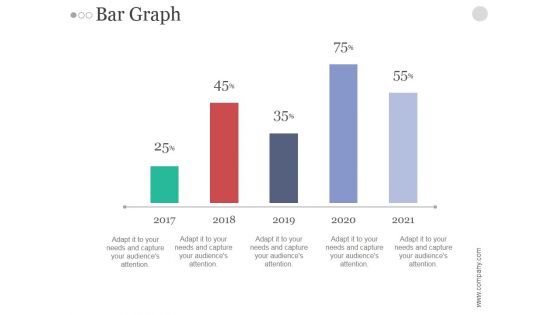
Bar Graph Ppt PowerPoint Presentation Portfolio
This is a bar graph ppt powerpoint presentation portfolio. This is a five stage process. The stages in this process are bar graph, marketing, analysis, finance, business, investment.
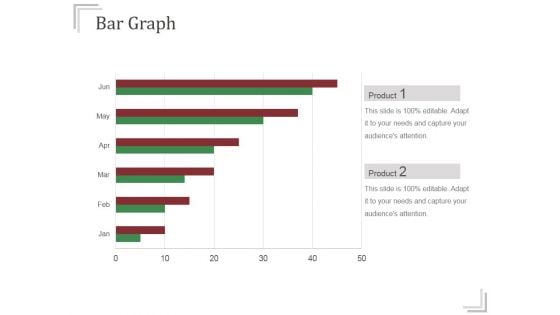
Bar Graph Ppt PowerPoint Presentation Slide
This is a bar graph ppt powerpoint presentation slide. This is a six stage process. The stages in this process are bar graph, analysis, marketing, strategy, business, finance.
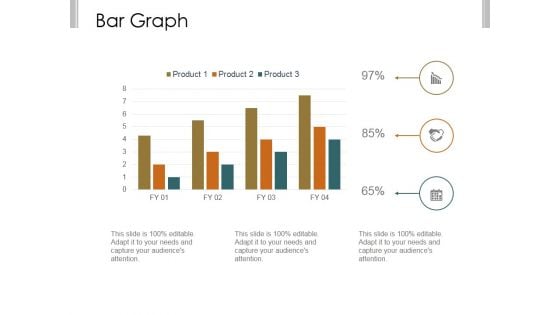
Bar Graph Ppt PowerPoint Presentation Examples
This is a bar graph ppt powerpoint presentation examples. This is a three stage process. The stages in this process are business, strategy, marketing, analysis, finance, bar graph.
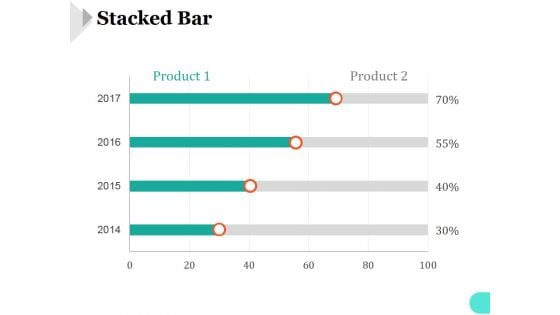
Stacked Bar Ppt PowerPoint Presentation Graphics
This is a stacked bar ppt powerpoint presentation graphics. This is a four stage process. The stages in this process are stacked bar, finance, marketing, analysis, business.
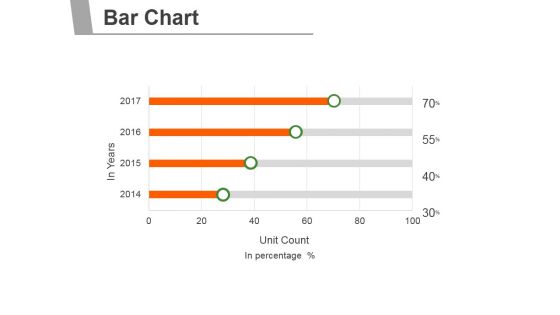
Bar Chart Ppt PowerPoint Presentation Deck
This is a bar chart ppt powerpoint presentation deck. This is a four stage process. The stages in this process are business, marketing, management, bar chart, finance.
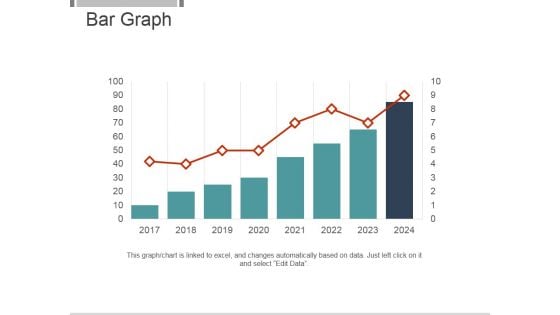
Bar Graph Ppt PowerPoint Presentation Designs Download
This is a bar graph ppt powerpoint presentation designs download. This is a eight stage process. The stages in this process are bar graph, business, strategy, management, marketing.
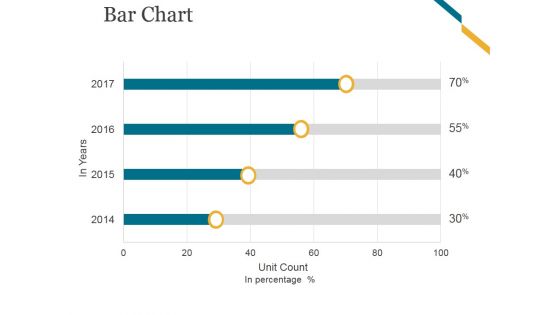
Bar Chart Ppt PowerPoint Presentation Guidelines
This is a bar chart ppt powerpoint presentation guidelines. This is a four stage process. The stages in this process are business, marketing, finance, timeline, bar chart.
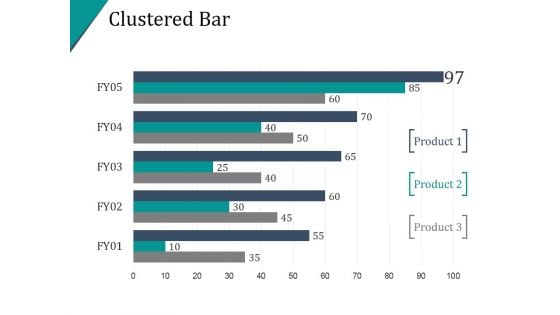
Clustered Bar Ppt PowerPoint Presentation Inspiration
This is a clustered bar ppt powerpoint presentation inspiration. This is a five stage process. The stages in this process are bar graph, business, marketing, finance, percentage.
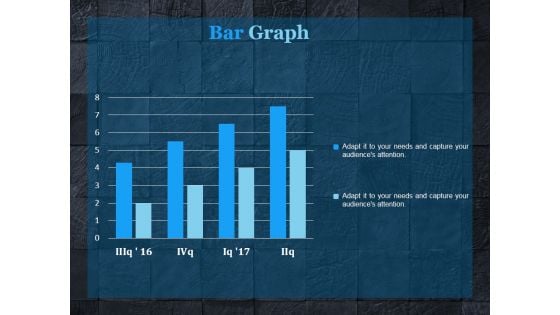
Bar Graph Ppt PowerPoint Presentation Sample
This is a bar graph ppt powerpoint presentation sample. This is a four stage process. The stages in this process are bar graph, finance, marketing, strategy, analysis, business.
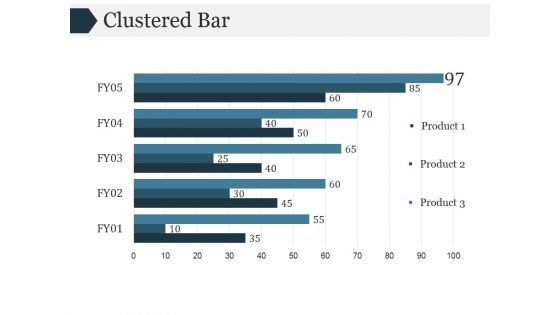
Clustered Bar Ppt PowerPoint Presentation Diagrams
This is a clustered bar ppt powerpoint presentation diagrams. This is a five stage process. The stages in this process are bar graph, marketing, strategy, analysis, business.
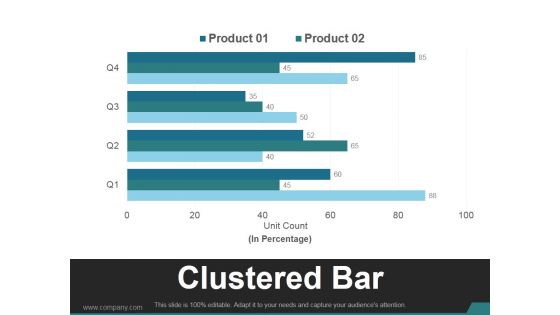
Clustered Bar Ppt PowerPoint Presentation Gallery
This is a clustered bar ppt powerpoint presentation gallery. This is a four stage process. The stages in this process are business, marketing, clustered bar, product, finance.
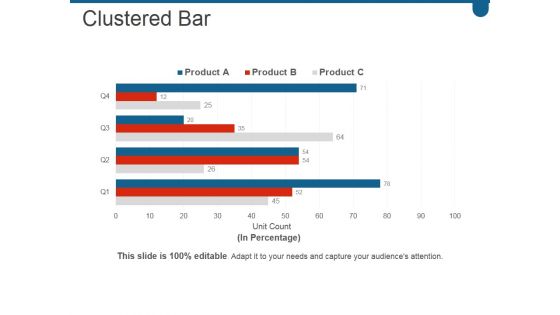
Clustered Bar Ppt PowerPoint Presentation Slide Download
This is a clustered bar ppt powerpoint presentation slide download. This is a four stage process. The stages in this process are bar, graph, business, marketing, strategy.
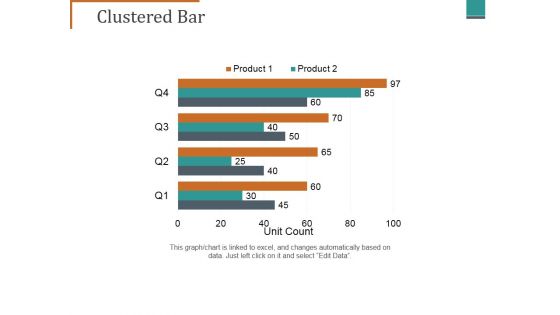
Clustered Bar Ppt PowerPoint Presentation Outline Topics
This is a clustered bar ppt powerpoint presentation outline topics. This is a four stage process. The stages in this process are clustered bar, unit count.
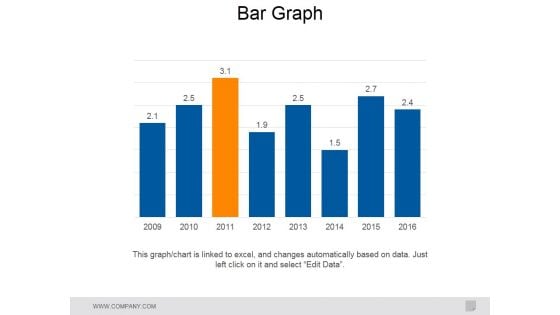
Bar Graph Ppt PowerPoint Presentation Slides Model
This is a bar graph ppt powerpoint presentation slides model. This is a eight stage process. The stages in this process are business, marketing, bar graph, management, timeline.
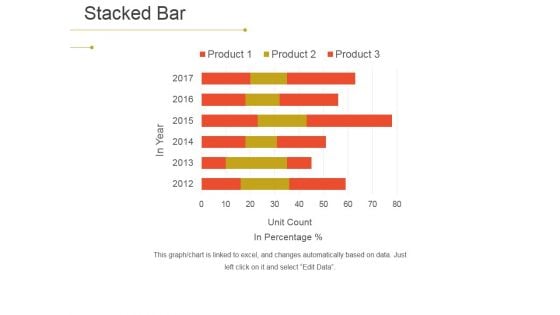
Stacked Bar Ppt PowerPoint Presentation Model Images
This is a stacked bar ppt powerpoint presentation model images. This is a six stage process. The stages in this process are bar chart, planning, business, strategic, management.

Bar Graph Ppt PowerPoint Presentation Layouts Graphics
This is a bar graph ppt powerpoint presentation layouts graphics. This is a four stage process. The stages in this process are bar graph, finance, marketing, strategy, business.
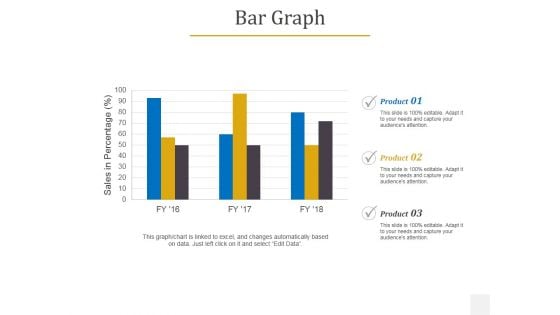
Bar Graph Ppt PowerPoint Presentation Slides Portfolio
This is a bar graph ppt powerpoint presentation slides portfolio. This is a three stage process. The stages in this process are business, marketing, management, bar graph, product.


 Continue with Email

 Home
Home


