2 Phases
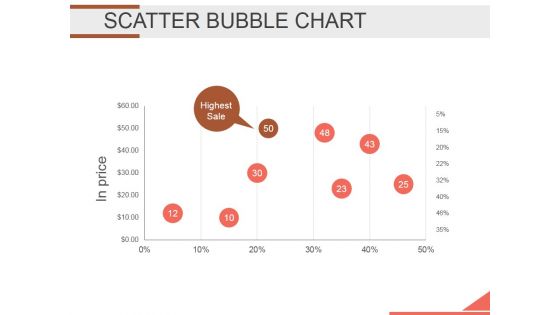
Scatter Bubble Chart Ppt PowerPoint Presentation Backgrounds
This is a scatter bubble chart ppt powerpoint presentation backgrounds. This is a one stage process. The stages in this process are bubble chart, finance, marketing, analysis, strategy, business.
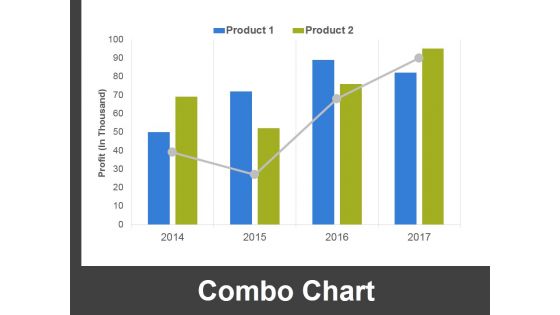
Combo Chart Ppt PowerPoint Presentation Ideas Outfit
This is a combo chart ppt powerpoint presentation ideas outfit. This is a four stage process. The stages in this process are combo chart, finance, analysis, marketing, strategy, business.
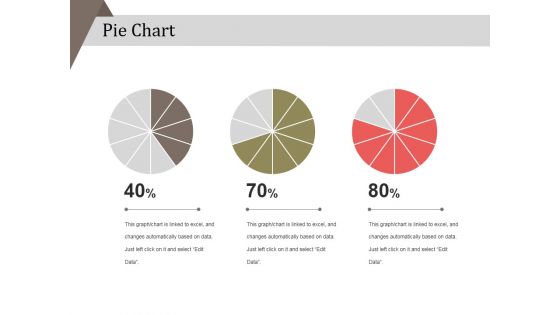
Pie Chart Ppt PowerPoint Presentation Layouts Example
This is a pie chart ppt powerpoint presentation layouts example. This is a three stage process. The stages in this process are business, strategy, analysis, pie chart, finance, marketing.
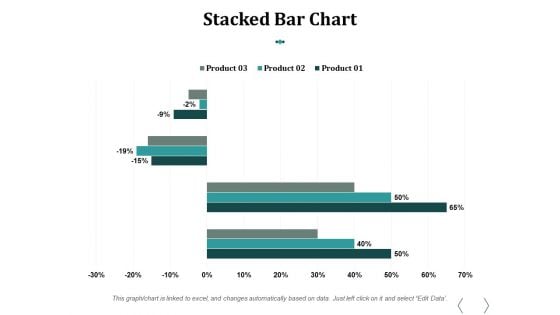
Stacked Bar Chart Ppt PowerPoint Presentation Influencers
This is a stacked bar chart ppt powerpoint presentation influencers. This is a three stage process. The stages in this process are stacked bar chart, product, percentage, finance, business.
Market Summary Icon For Company Growth Share Diagrams PDF
Persuade your audience using this Market Summary Icon For Company Growth Share Diagrams PDF. This PPT design covers three stages, thus making it a great tool to use. It also caters to a variety of topics including Market Summary Icon For Company Growth Share. Download this PPT design now to present a convincing pitch that not only emphasizes the topic but also showcases your presentation skills.
Product Business Plan Review Icon With Magnifying Glass Diagrams PDF
Persuade your audience using this Product Business Plan Review Icon With Magnifying Glass Diagrams PDF. This PPT design covers four stages, thus making it a great tool to use. It also caters to a variety of topics including Product Business Plan Review, Icon With Magnifying Glass. Download this PPT design now to present a convincing pitch that not only emphasizes the topic but also showcases your presentation skills.
Strategic Brand Equity Structure Icon With Hand Diagrams PDF
Persuade your audience using this Strategic Brand Equity Structure Icon With Hand Diagrams PDF. This PPT design covers three stages, thus making it a great tool to use. It also caters to a variety of topics including Strategic Brand Equity, Structure Icon With Hand. Download this PPT design now to present a convincing pitch that not only emphasizes the topic but also showcases your presentation skills.
Sales Person Icon For Direct Field Marketing Diagrams PDF
Persuade your audience using this Sales Person Icon For Direct Field Marketing Diagrams PDF. This PPT design covers four stages, thus making it a great tool to use. It also caters to a variety of topics including Sales Person Icon, Direct Field Marketing. Download this PPT design now to present a convincing pitch that not only emphasizes the topic but also showcases your presentation skills.
CRM For Realty Properties Our Goal Ppt Icon Diagrams PDF
Presenting this set of slides with name crm for realty properties our goal ppt icon diagrams pdf. This is a one stage process. The stage in this process is our goal. This is a completely editable PowerPoint presentation and is available for immediate download. Download now and impress your audience.
Financial Banking PPT Post It Notes Ppt Icon Diagrams PDF
Presenting financial banking ppt post it notes ppt icon diagrams pdf to provide visual cues and insights. Share and navigate important information on three stages that need your due attention. This template can be used to pitch topics like post it notes. In addition, this PPT design contains high-resolution images, graphics, etc, that are easily editable and available for immediate download.
Welfare Fundraising Icon For Raising Money Diagrams PDF
Persuade your audience using this Welfare Fundraising Icon For Raising Money Diagrams PDF. This PPT design covers three stages, thus making it a great tool to use. It also caters to a variety of topics including Welfare Fundraising, Raising, Money. Download this PPT design now to present a convincing pitch that not only emphasizes the topic but also showcases your presentation skills.
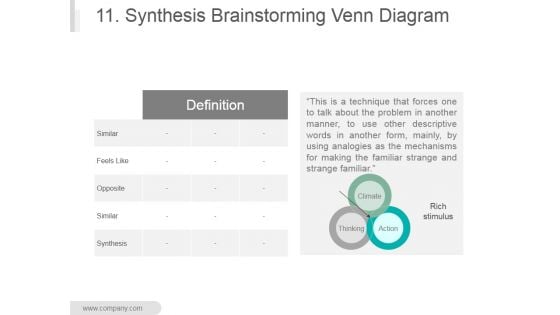
11 Synthesis Brainstorming Venn Diagram Ppt PowerPoint Presentation Designs Download
This is a 11 synthesis brainstorming venn diagram ppt powerpoint presentation designs download. This is a three stage process. The stages in this process are rich stimulus, climate, thinking, action, definition, similar.
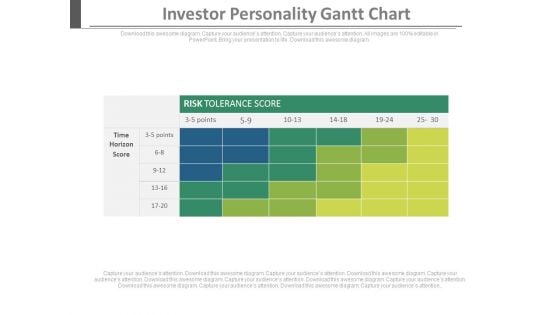
Investor Personality Gantt Chart Ppt Slides
This is an investor personality gantt chart ppt slides. This is a one stage process. The stages in this process are marketing, business, success.
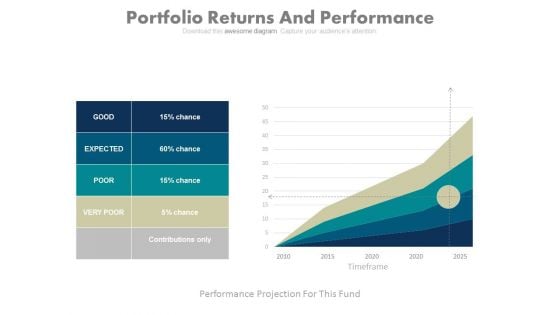
Portfolio Returns And Performance Chart Ppt Slides
This is a portfolio returns and performance chart ppt slides. This is a five stage process. The stages in this process are business, finance, marketing.
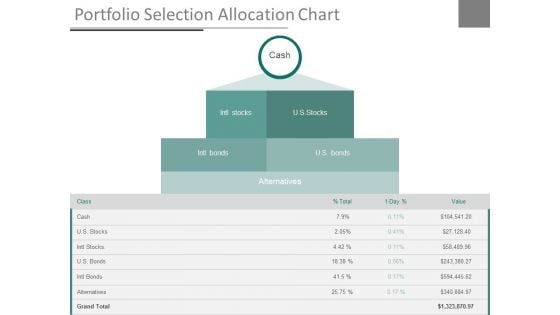
Portfolio Selection Allocation Chart Ppt Slides
This is a portfolio selection allocation chart ppt slides. This is a one stage process. The stages in this process are business, finance, marketing.
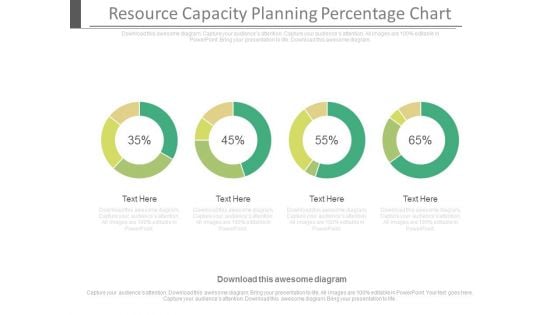
Resource Capacity Planning Percentage Chart Ppt Slides
This is a resource capacity planning percentage chart ppt slides. This is a four stage process. The stages in this process are business, finance, marketing.
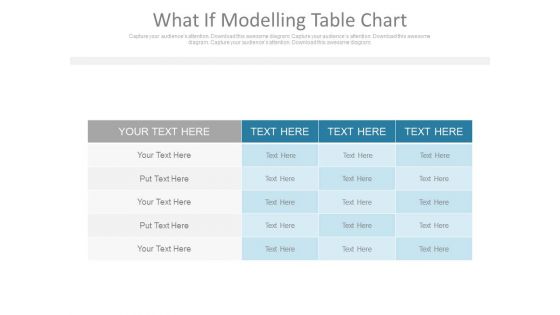
What If Modelling Table Chart Ppt Slides
This is a what if modelling table chart ppt slides. This is a one stage process. The stages in this process are business, success, marketing.
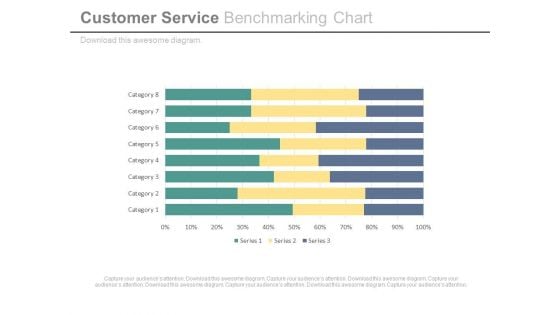
Customer Service Benchmarking Chart Ppt Slides
This is a customer service benchmarking chart ppt slides. This is a eight stage process. The stages in this process are finance, business, marketing.
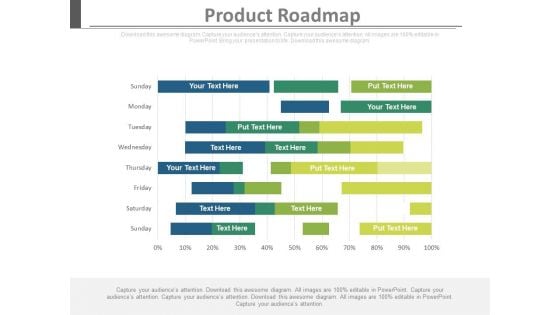
Product Roadmap Analysis Chart Ppt Slides
This is a product roadmap analysis chart ppt slides. This is a one stage process. The stages in this process are success, business, marketing.
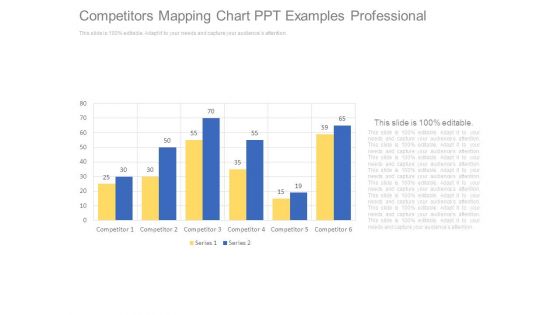
Competitors Mapping Chart Ppt Examples Professional
This is a competitors mapping chart ppt examples professional. This is a six stage process. The stages in this process are competitor, series.
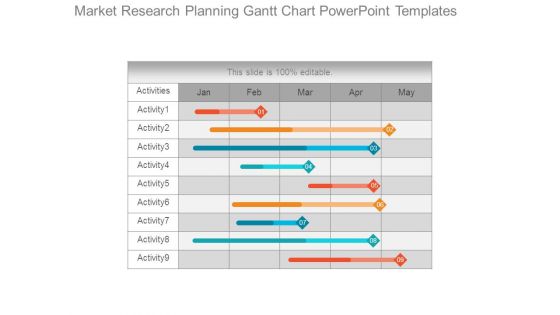
Market Research Planning Gantt Chart Powerpoint Templates
This is a market research planning gantt chart powerpoint templates. This is a five stage process. The stages in this process are jan, feb, mar, apr, may.
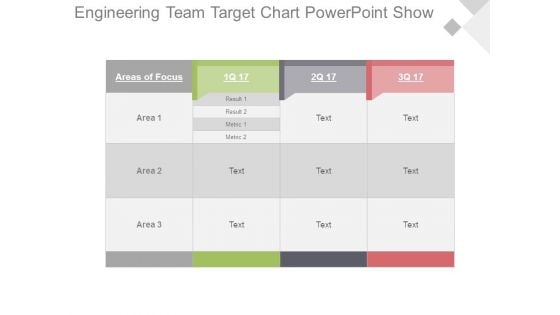
Engineering Team Target Chart Powerpoint Show
This is a engineering team target chart powerpoint show. This is a four stage process. The stages in this process are areas of focus, result, metric, area.
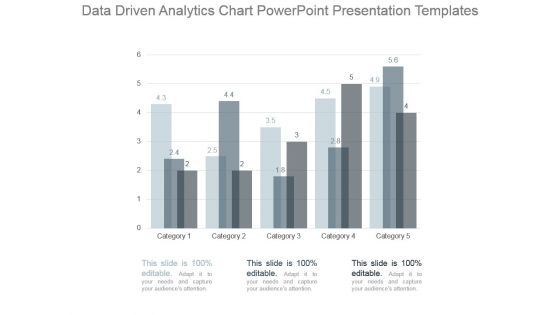
Data Driven Analytics Chart Powerpoint Presentation Templates
This is a data driven analytics chart powerpoint presentation templates. This is a five stage process. The stages in this process are category.
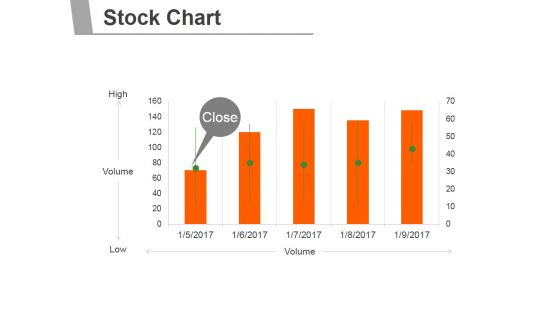
Stock Chart Ppt PowerPoint Presentation Design Templates
This is a stock chart ppt powerpoint presentation design templates. This is a five stage process. The stages in this process are business, marketing, finance, planning, management.
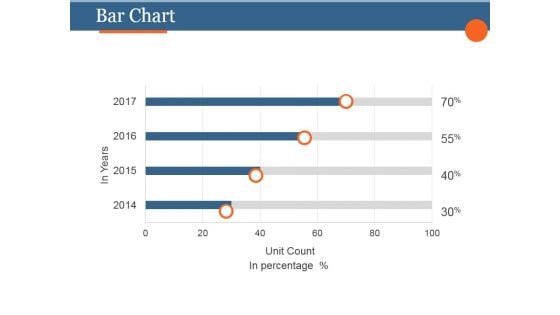
Bar Chart Ppt PowerPoint Presentation Layouts
This is a bar chart ppt powerpoint presentation layouts. This is a four stage process. The stages in this process are business, strategy, marketing, analysis, finance.
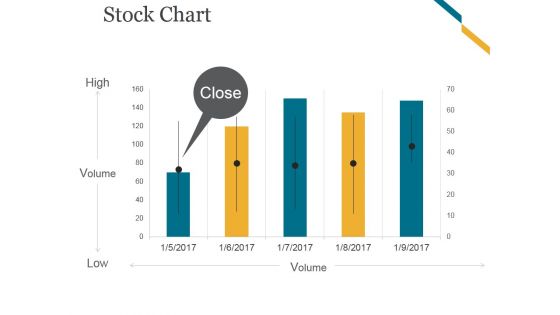
Stock Chart Ppt PowerPoint Presentation Infographics
This is a stock chart ppt powerpoint presentation infographics. This is a five stage process. The stages in this process are high, volume, low.
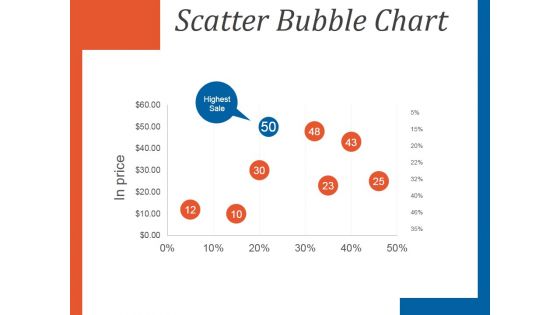
Scatter Bubble Chart Ppt PowerPoint Presentation Slides
This is a scatter bubble chart ppt powerpoint presentation slides. This is a eight stage process. The stages in this process are in price, highest sale, business, management.

Stock Chart Ppt PowerPoint Presentation Topics
This is a stock chart ppt powerpoint presentation topics. This is a five stage process. The stages in this process are high, volume, low, volume.
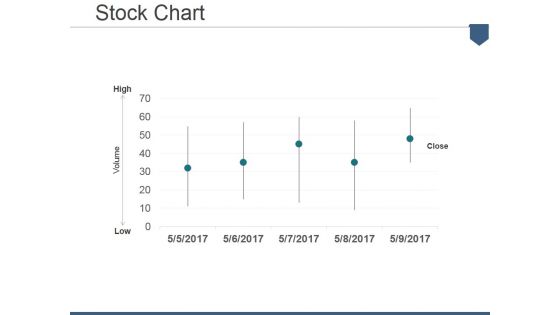
Stock Chart Ppt PowerPoint Presentation Show Layout
This is a stock chart ppt powerpoint presentation show layout. This is a five stage process. The stages in this process are low, volume, high, close.
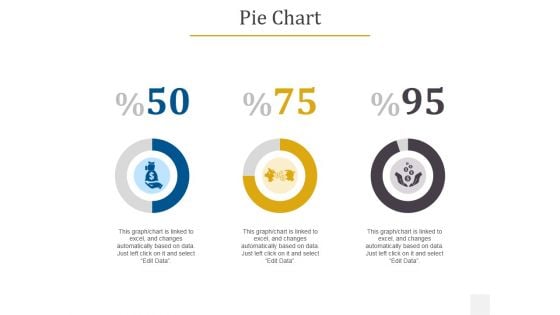
Pie Chart Ppt PowerPoint Presentation Infographics Aids
This is a pie chart ppt powerpoint presentation infographics aids. This is a three stage process. The stages in this process are business, finance, management, strategy, planning.
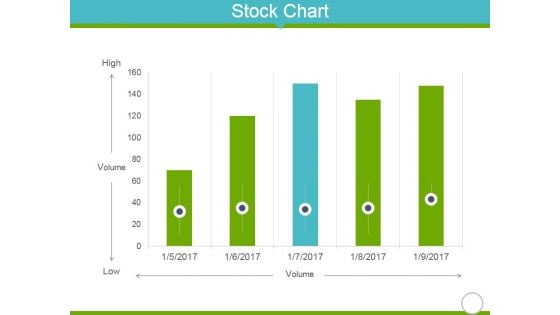
Stock Chart Ppt PowerPoint Presentation Portfolio Infographics
This is a stock chart ppt powerpoint presentation portfolio infographics. This is a five stage process. The stages in this process are high, volume, low, finance, business.
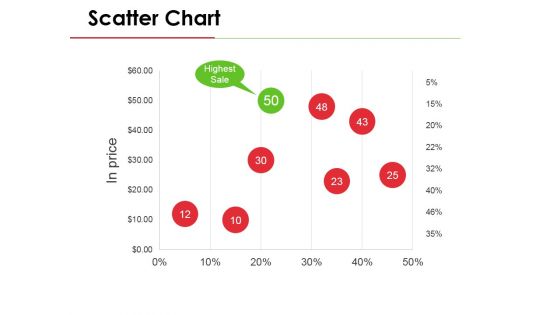
Scatter Chart Ppt PowerPoint Presentation Model Deck
This is a scatter chart ppt powerpoint presentation model deck. This is a eight stage process. The stages in this process are business, marketing, finance, management, strategy.
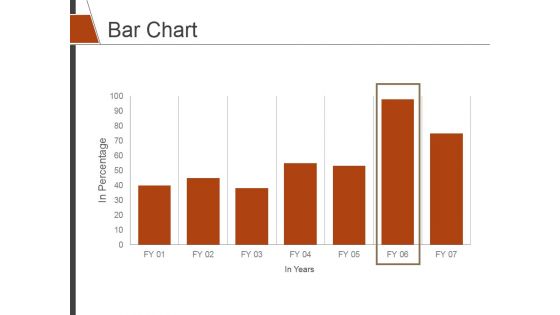
Bar Chart Ppt PowerPoint Presentation Slides Shapes
This is a bar chart ppt powerpoint presentation slides shapes. This is a seven stage process. The stages in this process are bar graph, finance, marketing, strategy, analysis.
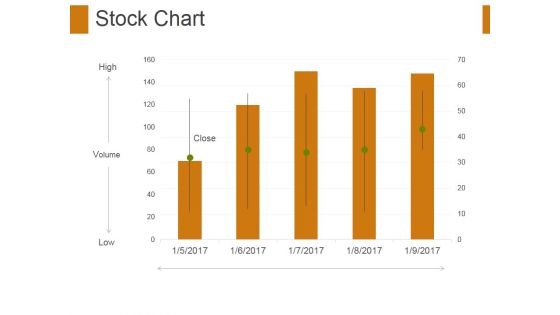
Stock Chart Ppt PowerPoint Presentation Gallery Files
This is a stock chart ppt powerpoint presentation gallery files. This is a five stage process. The stages in this process are high, volume, low, close.
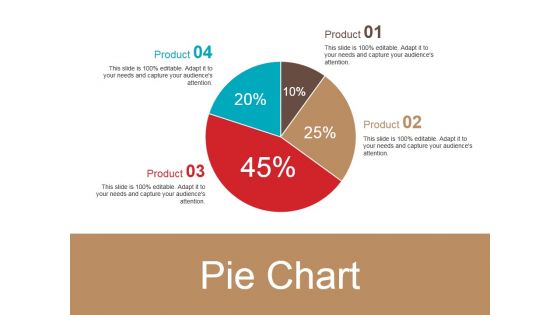
Pie Chart Ppt PowerPoint Presentation Ideas Slideshow
This is a pie chart ppt powerpoint presentation ideas slideshow. This is a four stage process. The stages in this process are pie, process, percentage, finance, business.
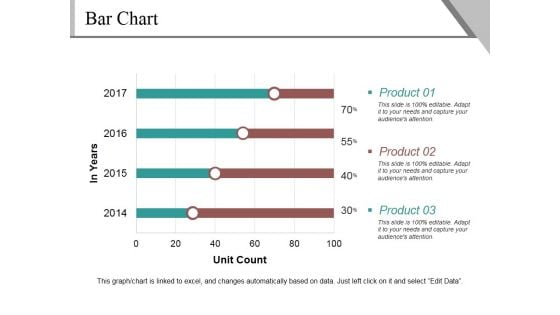
Bar Chart Ppt PowerPoint Presentation Summary Pictures
This is a bar chart ppt powerpoint presentation summary pictures. This is a four stage process. The stages in this process are product, unit count, finance, percentage, business.
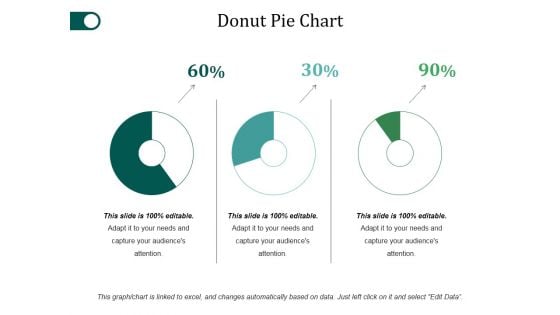
Donut Pie Chart Ppt PowerPoint Presentation Examples
This is a donut pie chart ppt powerpoint presentation examples. This is a three stage process. The stages in this process are percentage, finance, donut, business.
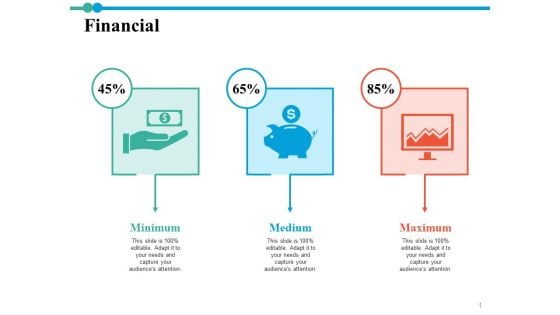
Financial Chart Ppt PowerPoint Presentation Outline Show
This is a financial chart ppt powerpoint presentation outline show. This is three stage process. The stages in this process are financial, minimum, medium, maximum.
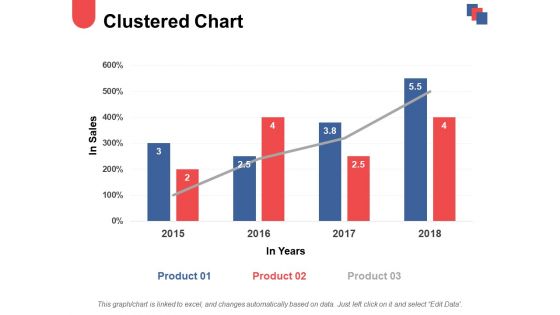
Clustered Chart Ppt PowerPoint Presentation Inspiration Templates
This is a clustered chart ppt powerpoint presentation inspiration templates. This is a three stage process. The stages in this process are finance, marketing, management, investment, analysis.
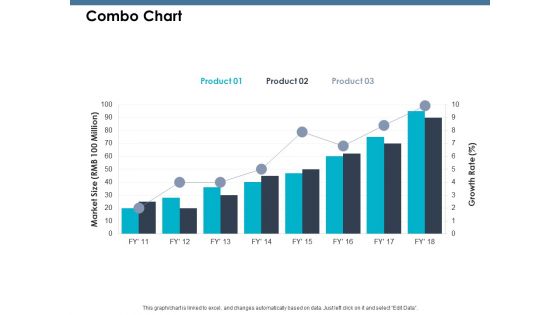
Combo Chart Ppt PowerPoint Presentation Model Grid
This is a combo chart ppt powerpoint presentation model grid. This is a three stage process. The stages in this process are growth, product, percentage, marketing.
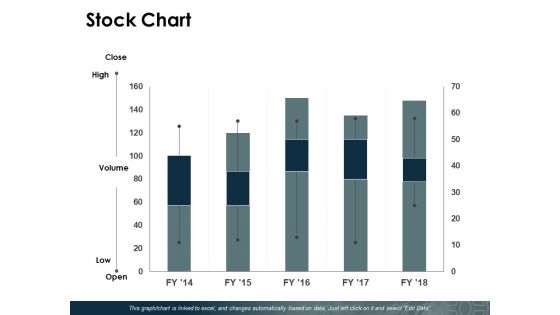
Stock Chart Ppt PowerPoint Presentation Show Pictures
This is a stock chart ppt powerpoint presentation show pictures. This is a five stage process. The stages in this process are product, percentage, management, marketing.
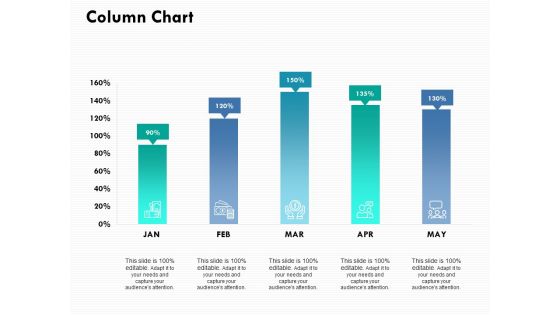
Column Chart Ppt PowerPoint Presentation Ideas Example
This is a column chart ppt powerpoint presentation ideas example. This is a five stage process. The stages in this process are percentage, product, management, marketing.
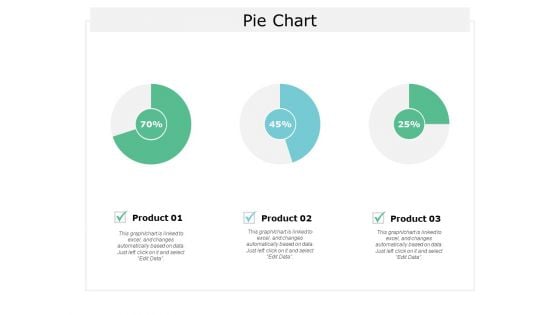
Pie Chart Finance Ppt Powerpoint Presentation Introduction
This is a pie chart finance ppt powerpoint presentation introduction. This is a three stage process. The stages in this process are finance, marketing, analysis, investment, strategy.
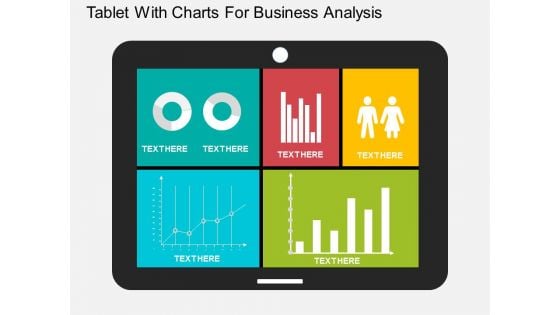
Tablet With Charts For Business Analysis Powerpoint Templates
Our compelling template consists with a design of four gear tags and icons. This slide has been professionally designed to exhibit process control. This template offers an excellent background to build impressive presentation.
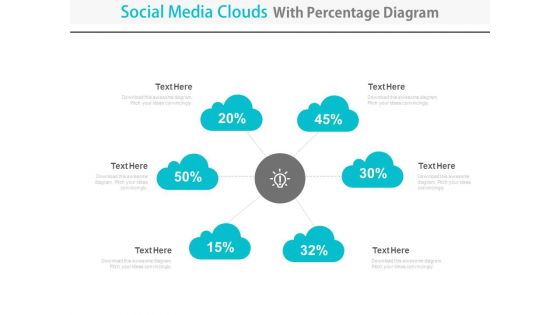
Cloud Network Diagram With Percentage Data Powerpoint Slides
This PowerPoint template contains graphics of cloud network diagram with percentage values. You may download this PPT slide design to display cloud network and financial strategy. You can easily customize this template to make it more unique as per your need.
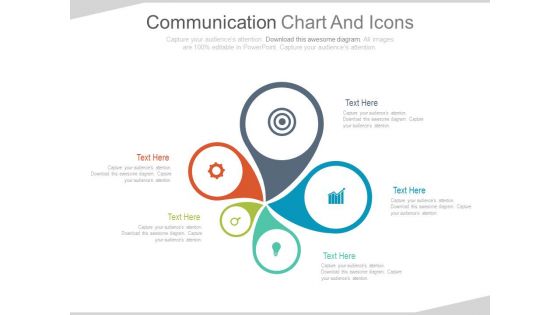
Infographic Chart For Marketing Information Powerpoint Slides
This PowerPoint template contains circular infographic chart. You may download this PPT slide to display marketing information in visual manner. You can easily customize this template to make it more unique as per your need.
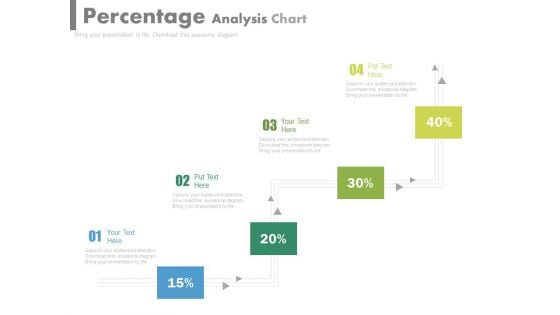
Pipeline Percentage Analysis Chart Powerpoint Slides
This PowerPoint template has been designed with pipeline percentage analysis chart. This PPT slide can be used to display business strategy plan. You can download finance PowerPoint template to prepare awesome presentations.
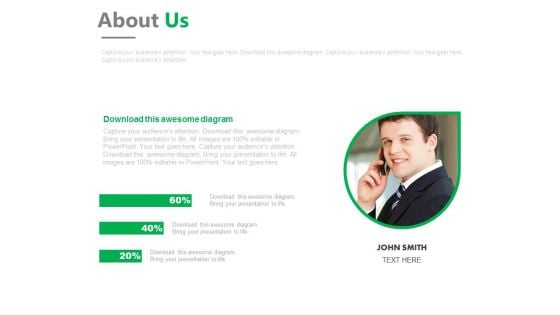
Business Employee Profile Growth Chart Powerpoint Slides
This PowerPoint template has been designed with graphics of business man with growth chart. This PowerPoint slide is an excellent tool to showcase employee growth and performance. Make impressive presentation using this slide.
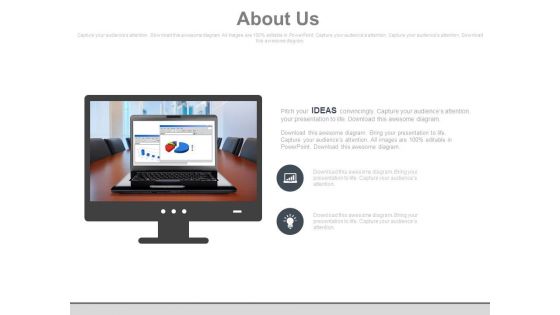
Business Charts About Us Slide Powerpoint Slides
This PowerPoint template has been designed with graphics of business charts. Download this PPT slide to display industry growth statistics. You can easily customize this template to make it more unique as per your need.
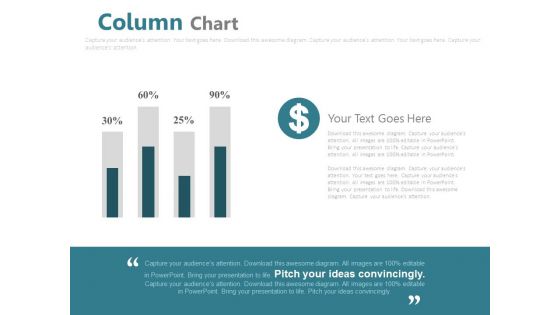
Column Chart For Financial Analysis Powerpoint Slides
This PowerPoint template has been designed with graphics of column chart with percentage values. You may use this business slide design for topics like financial analysis and planning. This PPT slide is powerful tool to describe your ideas.
Circular Chart For Business Goals Powerpoint Slides
This PowerPoint template has been designed with graphics of graphics of circular goal chart. This PPT slide may be used to display business success and planning. Impress your audiences by using this PPT slide.
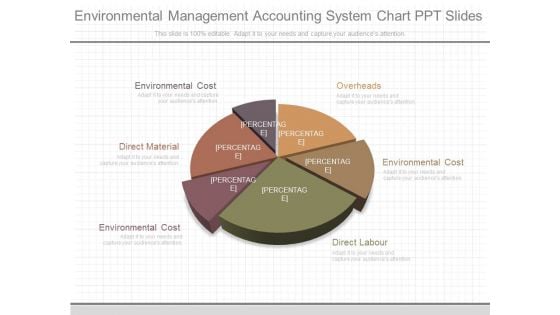
Environmental Management Accounting System Chart Ppt Slides
This is a environmental management accounting system chart ppt slides. This is a six stage process. The stages in this process are overheads, environmental cost, direct labour, environmental cost, direct material, environmental cost.
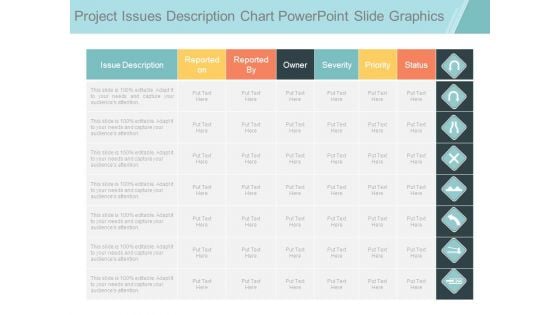
Project Issues Description Chart Powerpoint Slide Graphics
This is a project issues description chart powerpoint slide graphics. This is a seven stage process. The stages in this process are issue description, reported on, reported by, owner, severity, priority, status.

Project Issues Infogarphic Chart Ppt Examples Slides
This is a project issues infogarphic chart ppt examples slides. This is a seven stage process. The stages in this process are issue description, reported on, reported by, owner, severity, priority, status.
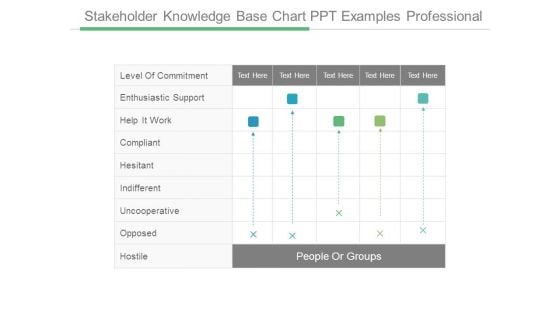
Stakeholder Knowledge Base Chart Ppt Examples Professional
This is a stakeholder knowledge base chart ppt examples professional. This is a five stage process. The stages in this process are people or groups, level of commitment, enthusiastic support, help it work, compliant, hesitant, indifferent, uncooperative, opposed, hostile.
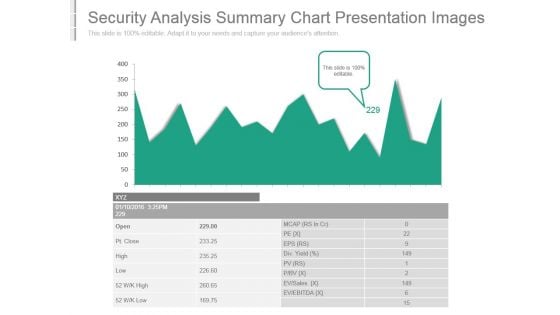
Security Analysis Summary Chart Presentation Images
This is a security analysis summary chart presentation images. This is a one stage process. The stages in this process are ev ebitda, ev sales, div yield, open, pt close, high, low, mcap, eps.
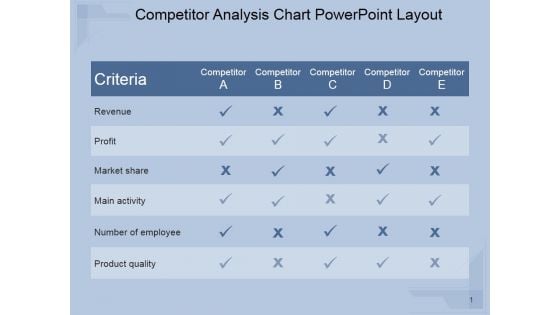
Competitor Analysis Chart Ppt PowerPoint Presentation Visuals
This is a competitor analysis chart ppt powerpoint presentation visuals. This is a five stage process. The stages in this process are revenue, profit, market share, main activity, number of employee, product quality.
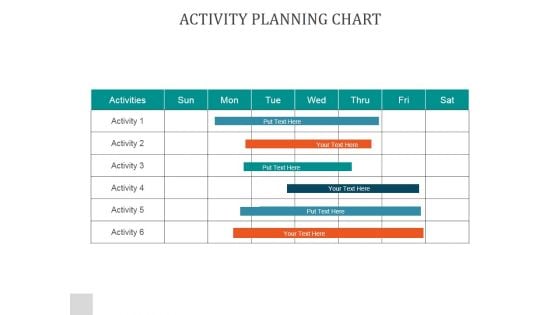
Activity Planning Chart Ppt PowerPoint Presentation Designs
This is a activity planning chart ppt powerpoint presentation designs. This is a seven stage process. The stages in this process are sun, mon, tue, wed, thru, fri, sat.
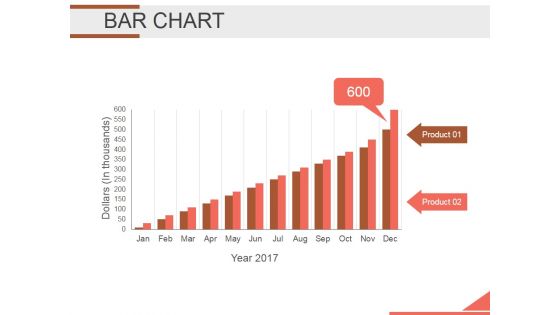
Bar Chart Ppt PowerPoint Presentation Background Designs
This is a bar chart ppt powerpoint presentation background designs. This is a twelve stage process. The stages in this process are bar graph, finance, marketing, strategy, analysis, investment.
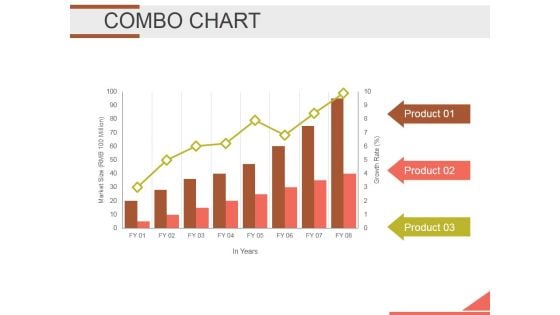
Combo Chart Ppt PowerPoint Presentation Infographics Infographics
This is a combo chart ppt powerpoint presentation infographics infographics. This is a three stage process. The stages in this process are bar graph, growth, finance, marketing, strategy, business.


 Continue with Email

 Home
Home


