2 Phases
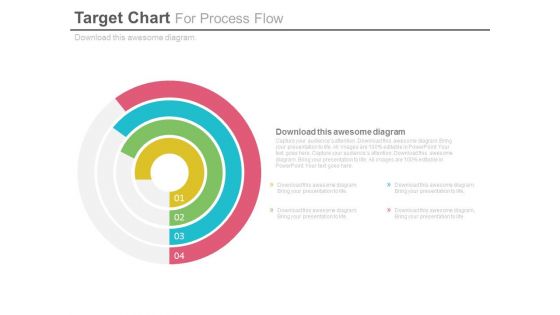
Target Chart For Strategic Management Process Powerpoint Slides
This PowerPoint template has been designed with four steps target chart. The PowerPoint template may be used to display strategic management process. You can download this PowerPoint slide for corporate presentations or annual meeting and business plans.
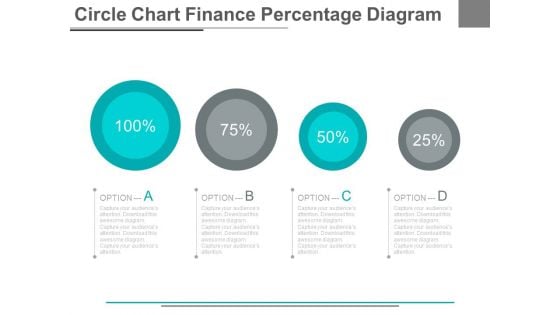
Four Options Circle Chart With Percentage Powerpoint Slides
This PowerPoint template has been designed with graphics of four options circle chart. This PowerPoint template may be used to display four steps of financial analysis. Prove the viability of your ideas using this impressive slide.
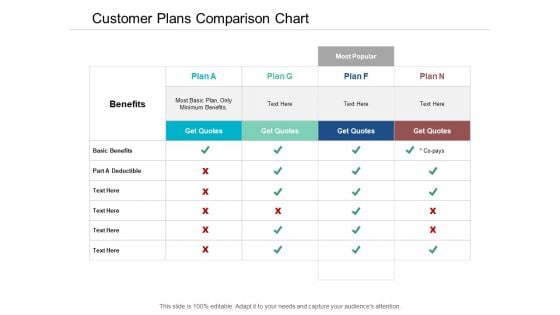
Customer Plans Comparison Chart Ppt Powerpoint Presentation Outline Graphics Example
This is a customer plans comparison chart ppt powerpoint presentation outline graphics example. This is a four stage process. The stages in this process are comparison chart, comparison table, comparison matrix.
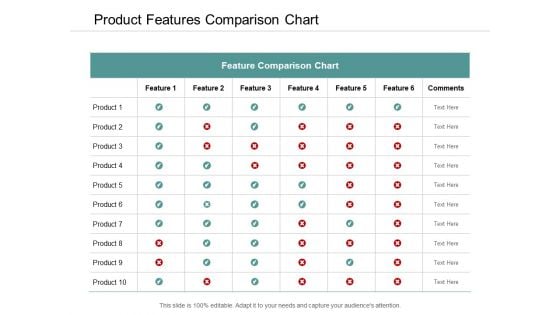
Product Features Comparison Chart Ppt Powerpoint Presentation Model Template
This is a product features comparison chart ppt powerpoint presentation model template. This is a six stage process. The stages in this process are comparison chart, comparison table, comparison matrix.
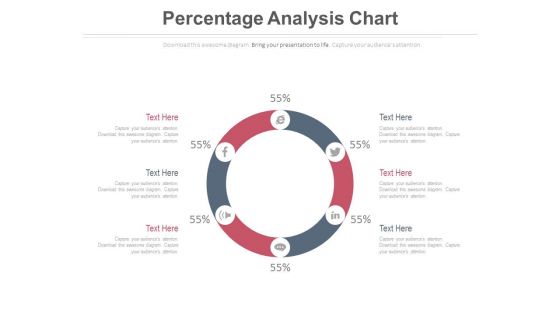
Circular Diagram For Percentage Analysis Powerpoint Slides
This PowerPoint slide has been designed with circular diagram with social media icons. This diagram slide may be used to display users of social media. Prove the viability of your ideas with this professional slide.
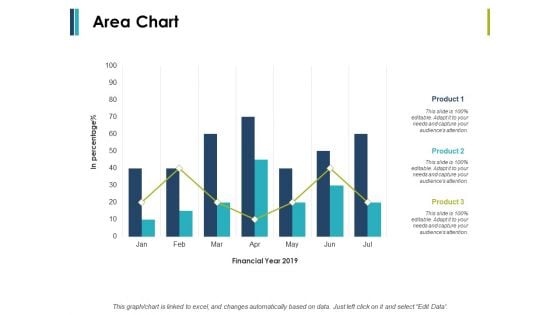
Area Chart Finance Ppt PowerPoint Presentation Infographic Template Model
This is a area chart finance ppt powerpoint presentation infographic template model. This is a two stage process. The stages in this process are finance, marketing, management, investment, analysis.
Four Linear Steps And Icons Powerpoint Slides
This PPT slide has been designed with four linear text boxes with icons. This PowerPoint template helps to exhibit process of business planning. Use this diagram slide to build an exclusive presentation.
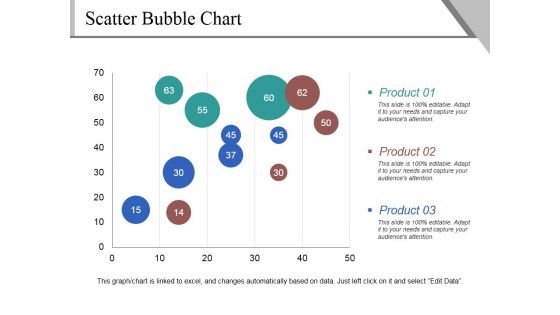
Scatter Bubble Chart Ppt PowerPoint Presentation Pictures Demonstration
This is a scatter bubble chart ppt powerpoint presentation pictures demonstration. This is a three stage process. The stages in this process are product, business, marketing, scatter chart.
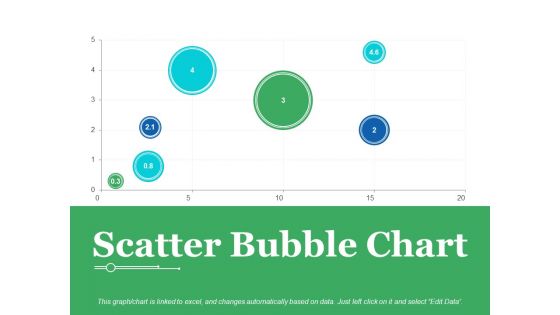
Scatter Bubble Chart Ppt PowerPoint Presentation Gallery Inspiration
This is a scatter bubble chart ppt powerpoint presentation gallery inspiration. This is a seven stage process. The stages in this process are scatter, bubble, chart, business, management.
Checklist With Financial Planning Icons Powerpoint Slides
This PowerPoint template contains business checklist with icons. Download this diagram slide to display financial planning and analysis. Etch your views in the brains of your audience with this diagram slide.
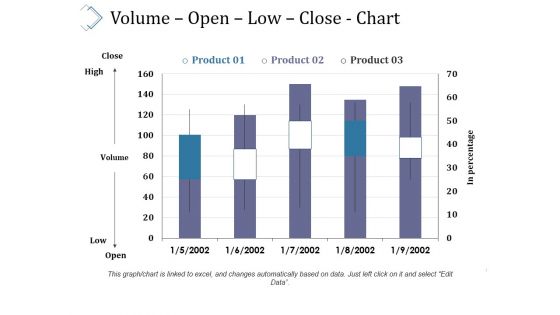
Volume Open Low Close Chart Ppt PowerPoint Presentation Summary Grid
This is a volume open low close chart ppt powerpoint presentation summary grid. This is a three stage process. The stages in this process are volume, open, low, close, chart.
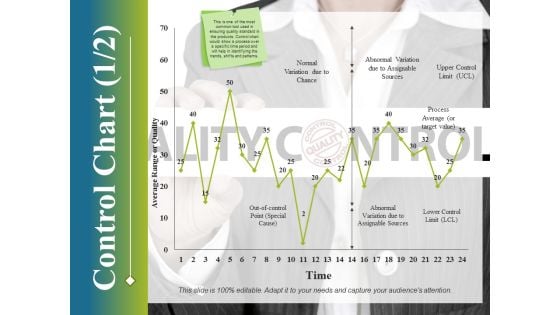
Control Chart Template 1 Ppt PowerPoint Presentation Infographic Template Deck
This is a control chart template 1 ppt powerpoint presentation infographic template deck. This is a one stage process. The stages in this process are control chart, growth, finance, marketing, strategy, business.
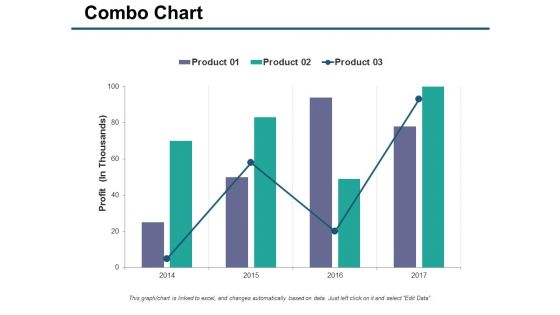
Combo Chart Finance Ppt PowerPoint Presentation Show Elements
This is a combo chart finance ppt powerpoint presentation show elements. This is a three stage process. The stages in this process are combo chart, finance, marketing, management, investment.
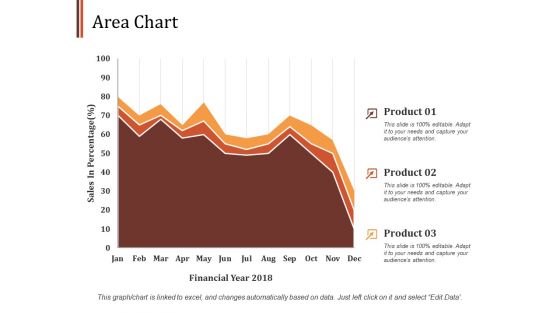
Area Chart Finance Ppt PowerPoint Presentation Infographics Design Ideas
This is a area chart finance ppt powerpoint presentation infographics design ideas. This is a three stage process. The stages in this process are area chart, finance, marketing, management, investment.

Area Chart Finance Ppt PowerPoint Presentation Professional File Formats
This is a area chart finance ppt powerpoint presentation professional file formats . This is a three stage process. The stages in this process are area chart, finance, marketing, management, investment.
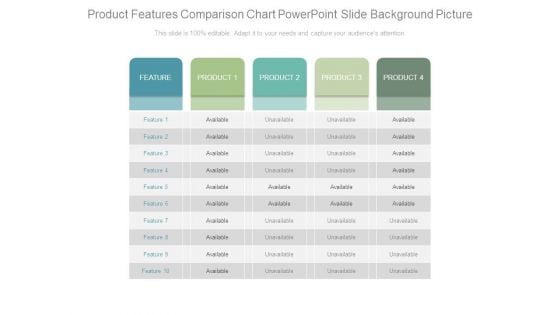
Product Features Comparison Chart Powerpoint Slide Background Picture
This is a product features comparison chart powerpoint slide background picture. This is a four stage process. The stages in this process are feature, product, available, unavailable.
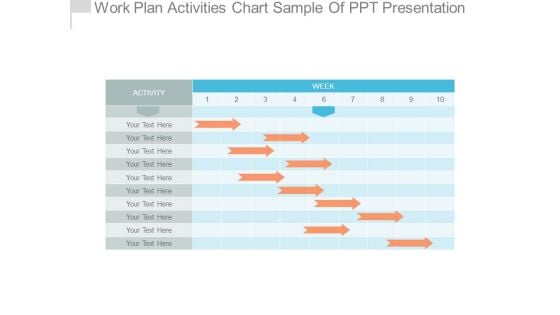
Work Plan Activities Chart Sample Of Ppt Presentation
This is a work plan activities chart sample of ppt presentation. This is a ten stage process. The stages in this process are table, management, business, strategy, presentation.
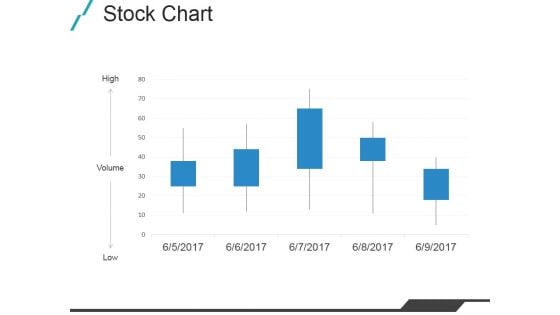
Stock Chart Ppt PowerPoint Presentation Outline Slide Portrait
This is a stock chart ppt powerpoint presentation outline slide portrait. This is a five stage process. The stages in this process are high, volume, low, business.
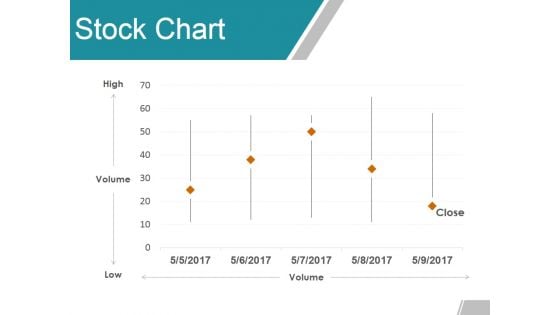
Stock Chart Ppt PowerPoint Presentation Summary Graphics Pictures
This is a stock chart ppt powerpoint presentation summary graphics pictures. This is a five stage process. The stages in this process are high, volume, low, close, finance.
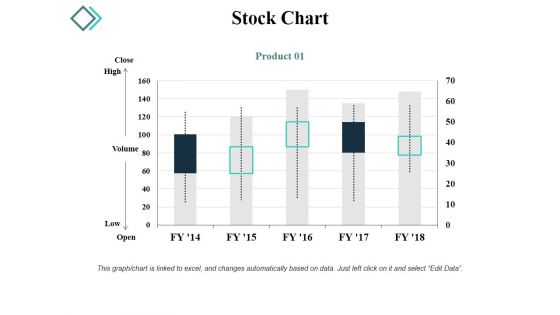
Stock Chart Ppt PowerPoint Presentation Gallery Graphic Images
This is a stock chart ppt powerpoint presentation gallery graphic images. This is a five stage process. The stages in this process are close, high, volume, low, open.
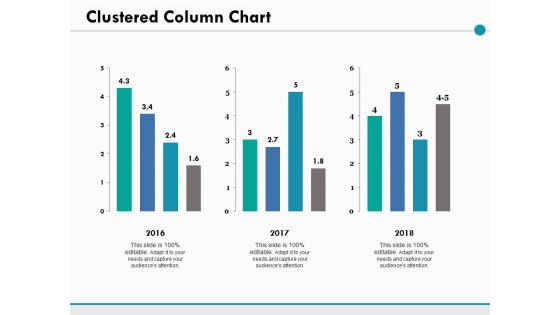
Clustered Column Chart Ppt PowerPoint Presentation Ideas Picture
This is a clustered column chart ppt powerpoint presentation ideas picture. This is a three stage process. The stages in this process are percentage, product, management, marketing.
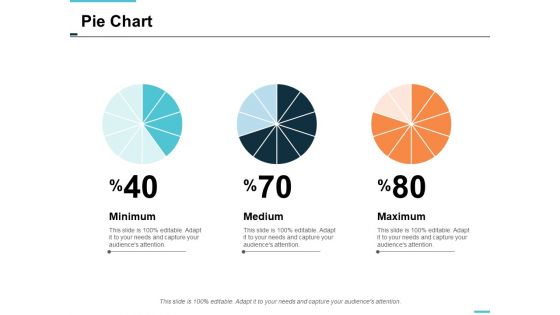
pie chart finance ppt powerpoint presentation styles skills
This is a pie chart finance ppt powerpoint presentation styles skills. This is a three stage process. The stages in this process are finance, marketing, management, investment, analysis.

Combo Chart Finance Ppt PowerPoint Presentation Portfolio Guidelines
This is a combo chart finance ppt powerpoint presentation portfolio guidelines. This is a three stage process. The stages in this process are finance, marketing, management, investment, analysis.
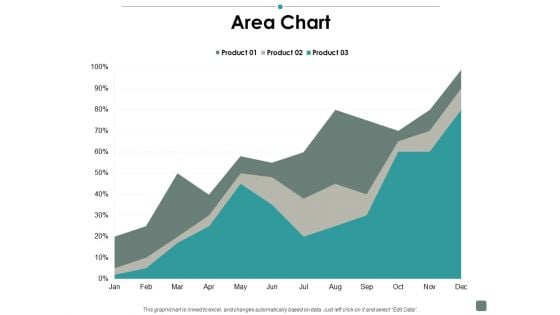
Area Chart Contribution Ppt PowerPoint Presentation Gallery Structure
This is a area chart contribution ppt powerpoint presentation gallery structure. This is a three stage process. The stages in this process are business, management, strategy, analysis, marketing.
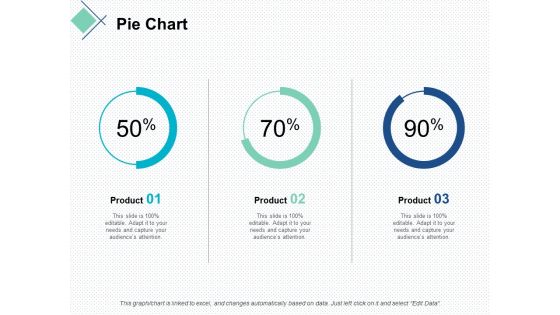
pie chart finance marketing ppt powerpoint presentation slides demonstration
This is a pie chart finance marketing ppt powerpoint presentation slides demonstration. This is a stage process. The stages in this process are finance, marketing, management, investment, analysis.
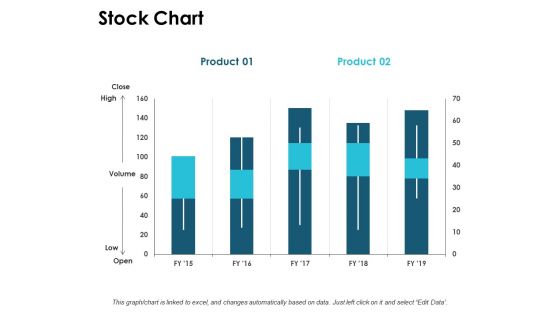
Stock Chart Graph Ppt PowerPoint Presentation Ideas Demonstration
This is a stock chart graph ppt powerpoint presentation ideas demonstration. This is a three stage process. The stages in this process are finance, marketing, management, investment, analysis.
Business Competitors Analysis Table Ppt Powerpoint Presentation Icon Brochure
This is a business competitors analysis table ppt powerpoint presentation icon brochure. This is a six stage process. The stages in this process are comparison chart, comparison table, comparison matrix.
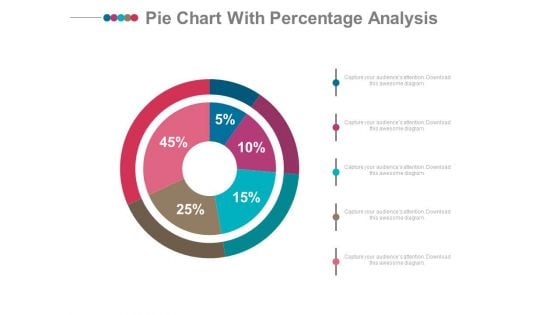
Pie Chart With Financial Data Comparison Powerpoint Slides
Emphatically define your message with our above template which contains graphics of pie chart. This PowerPoint template may be used to display financial data comparison. Grab the attention of your listeners with this slide.
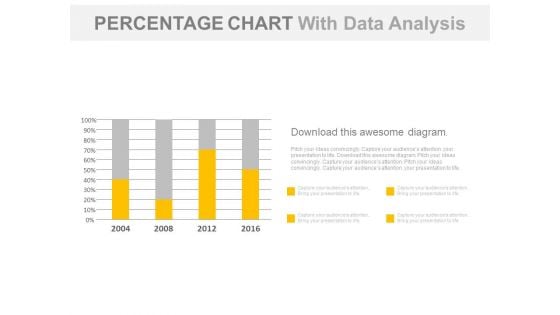
Year Based Chart With Percentage Data Analysis Powerpoint Slides
Our above business slide contains year based statistical chart. This PowerPoint template can be used to display percentage data analysis. Capture the attention of your audience with this slide.
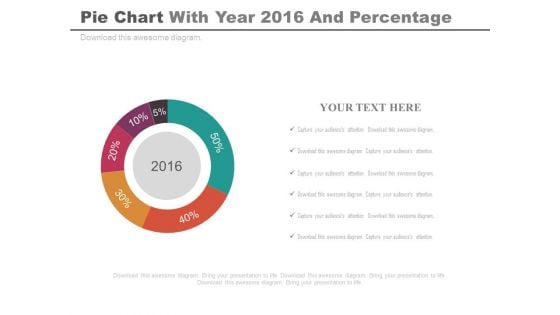
Pie Chart For Projected Profit Of 2016 Powerpoint Slides
Our above PPT slide displays graphics of Pie chart. This PowerPoint template may be used to display projected profit report of 2016. Download this template to leave permanent impression on your audience.
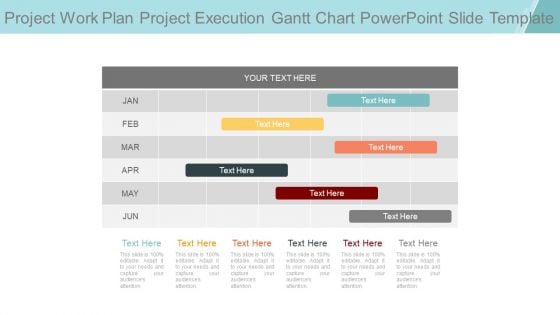
Project Work Plan Project Execution Gantt Chart Powerpoint Slide Template
This is a project work plan project execution gantt chart powerpoint slide template. This is a six stage process. The stages in this process are jan, feb, mar, apr, may, jun.

Break Point Chart For Quality Analysis Powerpoint Slide Show
This is a break point chart for quality analysis powerpoint slide show. This is a one stage process. The stages in this process are total variable costs, fixed costs, quality sold.

Our Market Research Plan Gantt Chart Powerpoint Slide Backgrounds
This is a our market research plan gantt chart powerpoint slide backgrounds. This is a nine stage process. The stages in this process are jan, feb, mar, apr, may.

Our Offers Vs The Competition Comparison Chart Ppt Example File
This is a our offers vs the competition comparison chart ppt example file. This is a five stage process. The stages in this process are compare, table, management, business, strategy.
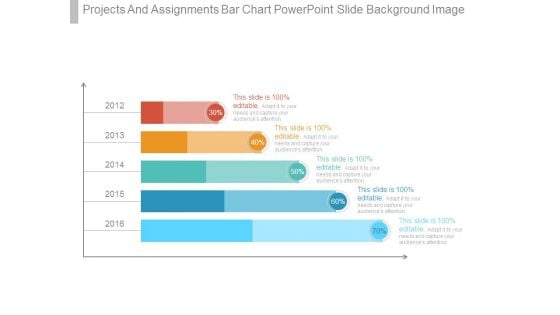
Projects And Assignments Bar Chart Powerpoint Slide Background Image
This is a projects and assignments bar chart powerpoint slide background image. This is a five stage process. The stages in this process are finance, presentation, business, strategy, marketing.
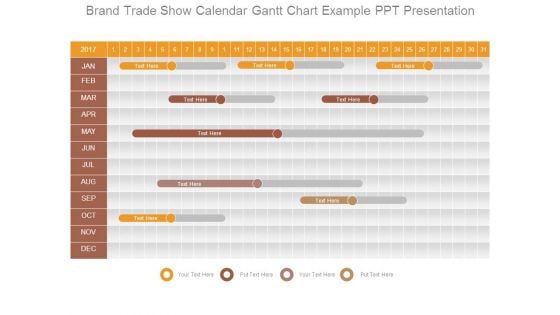
Brand Trade Show Calendar Gantt Chart Example Ppt Presentation
This is a brand trade show calendar gantt chart example ppt presentation. This is a one stage process. The stages in this process are jan, feb, mar, apr, may, jun, jul, aug, sep, oct, nov, dec.
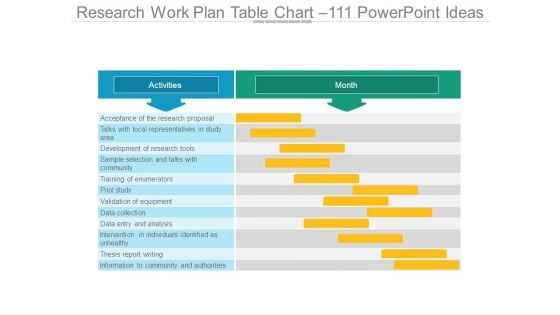
Research Work Plan Table Chart 111 Powerpoint Ideas
This is a research work plan table chart 111 powerpoint ideas. This is a twelve stage process. The stages in this process are business, marketing, table, arrow, success, strategy.

Scatter Bubble Chart Ppt PowerPoint Presentation Infographics Backgrounds
This is a scatter bubble chart ppt powerpoint presentation infographics backgrounds. This is a five stage process. The stages in this process are highest sale, in price, growth, success, business.
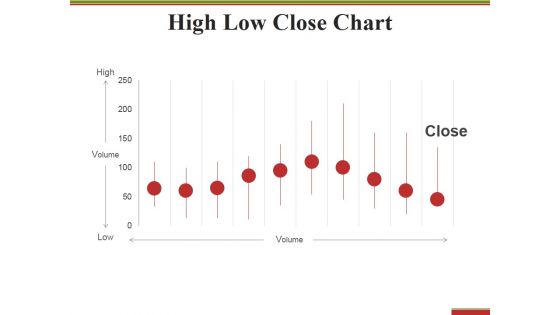
High Low Close Chart Ppt PowerPoint Presentation Styles Display
This is a high low close chart ppt powerpoint presentation styles display. This is a ten stage process. The stages in this process are high, volume, low, close, finance.
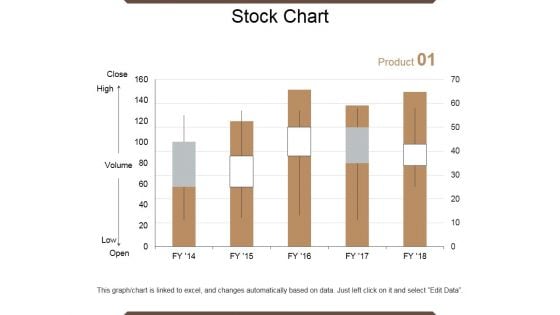
Stock Chart Ppt PowerPoint Presentation Outline Graphics Example
This is a stock chart ppt powerpoint presentation outline graphics example. This is a five stage process. The stages in this process are close, volume, low, high, open, product.
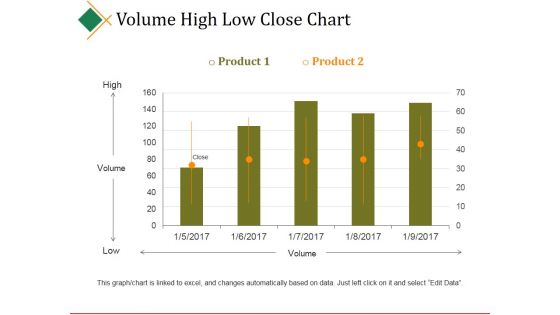
Volume High Low Close Chart Ppt PowerPoint Presentation Gallery Shapes
This is a volume high low close chart ppt powerpoint presentation gallery shapes. This is a five stage process. The stages in this process are high, volume, low, close, finance.
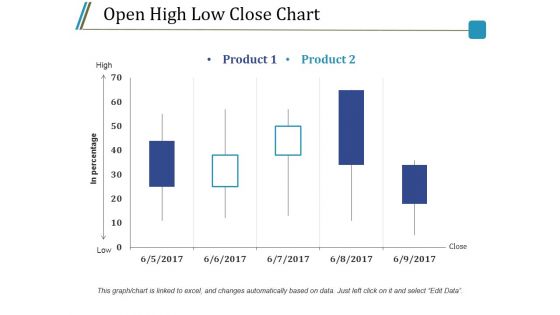
Open High Low Close Chart Ppt PowerPoint Presentation Styles Model
This is a open high low close chart ppt powerpoint presentation styles model. This is a five stage process. The stages in this process are product, high, low, in percentage, close.
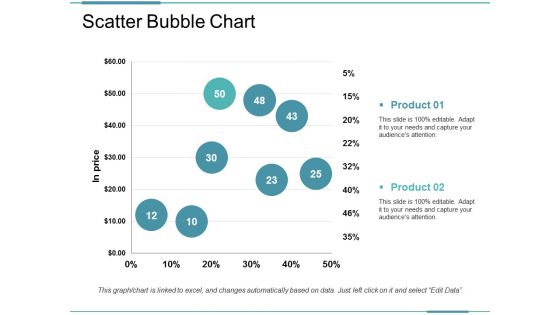
Scatter Bubble Chart Template Ppt PowerPoint Presentation Professional Background
This is a scatter bubble chart template ppt powerpoint presentation professional background. This is a six stage process. The stages in this process are business, marketing, strategy, planning, finance.
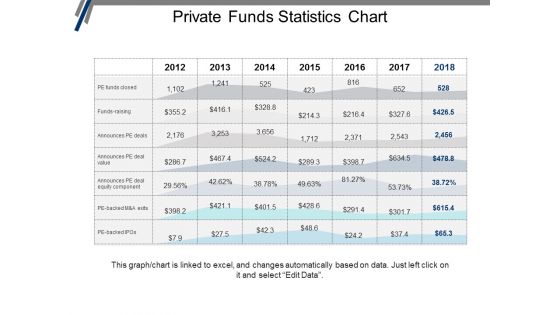
Private Funds Statistics Chart Ppt PowerPoint Presentation Portfolio Graphics Design
This is a private funds statistics chart ppt powerpoint presentation portfolio graphics design. This is a seven stage process. The stages in this process are investment, funding, private equity, venture capital.
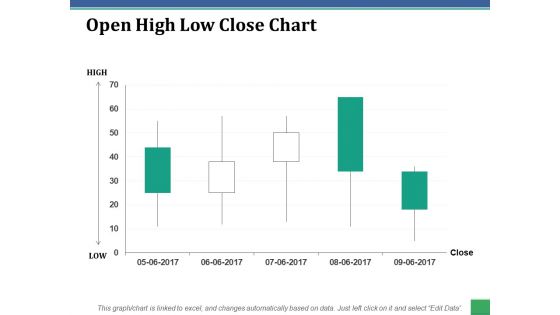
Open High Low Close Chart Ppt PowerPoint Presentation Professional Inspiration
This is a open high low close chart ppt powerpoint presentation professional inspiration. This is a five stage process. The stages in this process are high, low, close, business, finance.
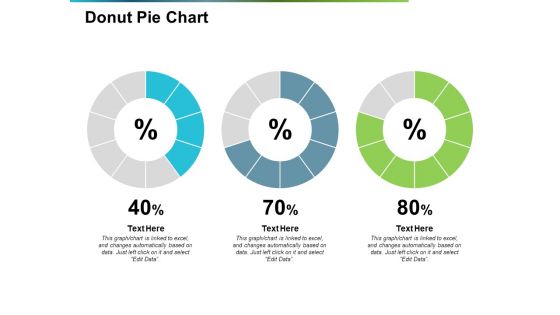
Donut Pie Chart Ppt PowerPoint Presentation Show Graphics Download
This is a donut pie chart ppt powerpoint presentation show graphics download. This is a three stage process. The stages in this process are percentage, finance, donut, business, marketing.
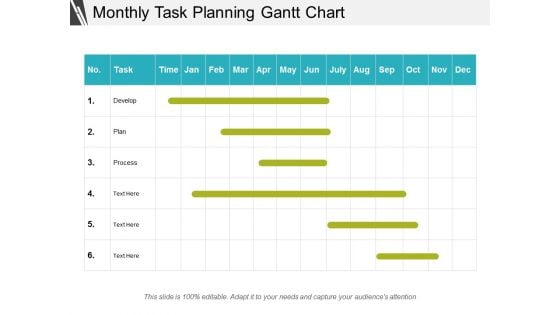
Monthly Task Planning Gantt Chart Ppt PowerPoint Presentation Portfolio Images
This is a monthly task planning gantt chart ppt powerpoint presentation portfolio images. This is a six stage process. The stages in this process are strategy plan, strategy objectives, strategy action.
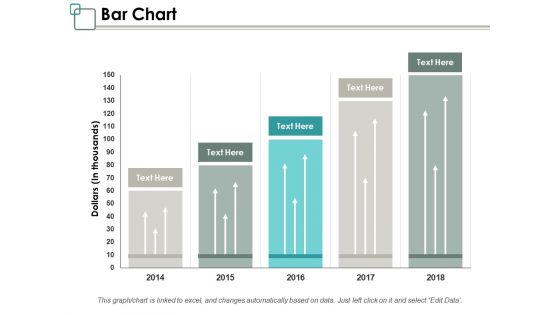
Bar Chart Ppt PowerPoint Presentation Infographic Template Graphics Design
This is a bar chart ppt powerpoint presentation infographic template graphics design. This is a five stage process. The stages in this process are management, marketing, business, percentage, product.
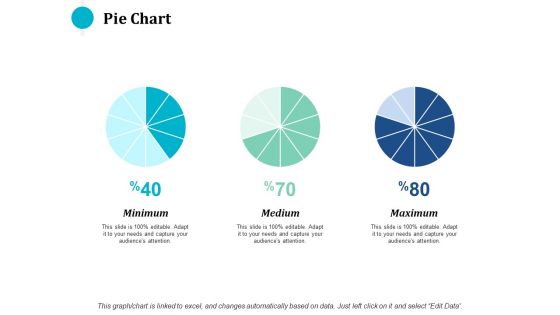
Pie Chart Finance Ppt PowerPoint Presentation Styles Graphics Template
This is a pie chart finance ppt powerpoint presentation styles graphics template. This is a three stage process. The stages in this process are financial, minimum, medium, maximum, marketing.
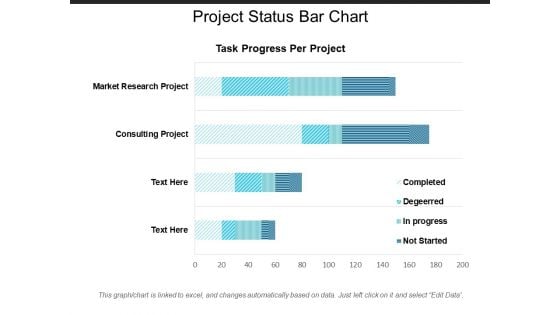
Project Status Bar Chart Ppt PowerPoint Presentation Ideas Objects
This is a project status bar chart ppt powerpoint presentation ideas objects. This is a four stage process. The stages in this process are project management, project progress, project growth.
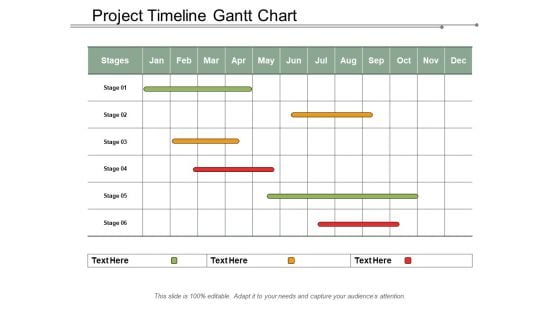
Project Timeline Gantt Chart Ppt PowerPoint Presentation Gallery
This is a project timeline gantt chart ppt powerpoint presentation gallery. This is a three stage process. The stages in this process are project management, project progress, project growth.
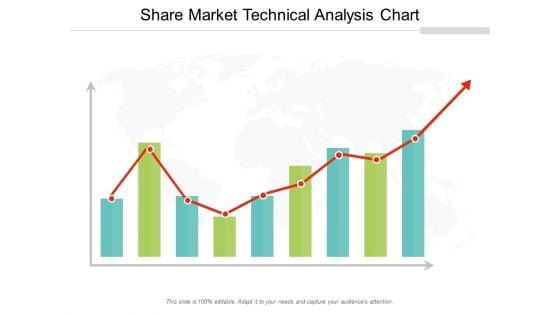
Share Market Technical Analysis Chart Ppt Powerpoint Presentation Professional Rules
This is a share market technical analysis chart ppt powerpoint presentation professional rules. This is a three stage process. The stages in this process are stock market, financial market, bull market.
Retail Performance Measurement Chart Ppt PowerPoint Presentation Ideas Structure
This is a retail performance measurement chart ppt powerpoint presentation ideas structure. This is a four stage process. The stages in this process are product distribution, distribution system, numeric distribution.

Donut Pie Chart Finance Ppt PowerPoint Presentation Portfolio Model
This is a donut pie chart finance ppt powerpoint presentation portfolio model. This is a three stage process. The stages in this process are finance, management, strategy, analysis, marketing.
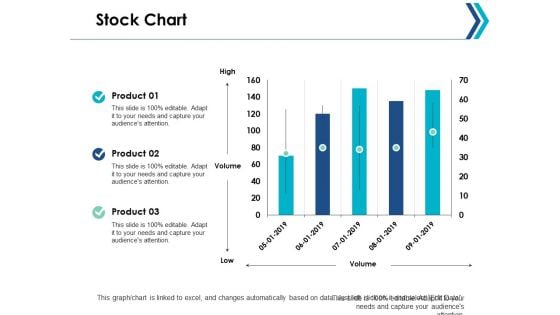
Stock Chart Finance Analysis Ppt Powerpoint Presentation Ideas Portrait
This is a stock chart finance analysis ppt powerpoint presentation ideas portrait. This is a three stage process. The stages in this process are finance, marketing, management, investment, strategy.
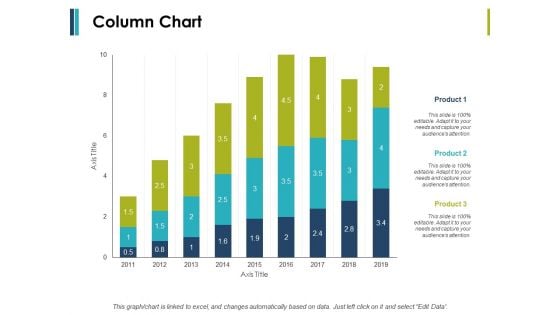
Column Chart And Graph Ppt PowerPoint Presentation File Introduction
This is a column chart and graph ppt powerpoint presentation file introduction. This is a three stage process. The stages in this process are finance, marketing, management, investment, analysis.
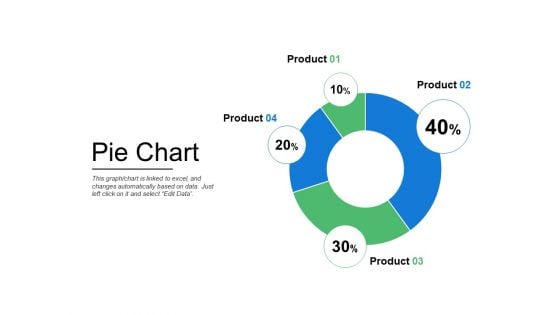
Pie Chart Finance Ppt PowerPoint Presentation Infographics Mockup
This is a pie chart finance ppt powerpoint presentation infographics mockup . This is a four stage process. The stages in this process are finance, marketing, management, investment, analysis.
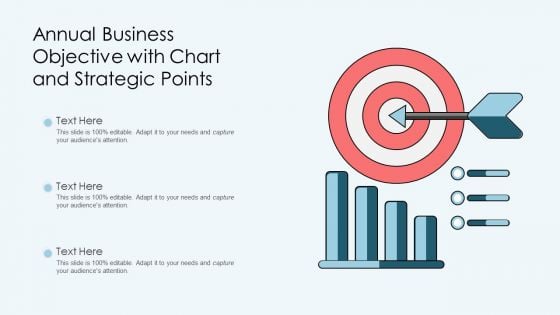
Annual Business Objective With Chart And Strategic Points Ppt Styles Maker PDF
Presenting annual business objective with chart and strategic points ppt styles maker pdf to dispense important information. This template comprises three stages. It also presents valuable insights into the topics including annual business objective with chart and strategic points. This is a completely customizable PowerPoint theme that can be put to use immediately. So, download it and address the topic impactfully.
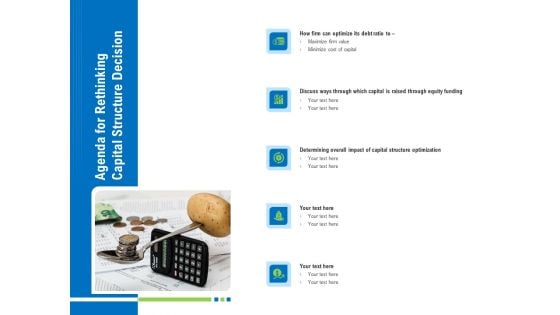
Revaluate Capital Structure Resolution Agenda For Rethinking Capital Structure Decision Structure PDF
Presenting revaluate capital structure resolution agenda for rethinking capital structure decision structure pdf. to provide visual cues and insights. Share and navigate important information on five stages that need your due attention. This template can be used to pitch topics like maximize firm value, structure optimization, minimize cost of capital. In addtion, this PPT design contains high resolution images, graphics, etc, that are easily editable and available for immediate download.
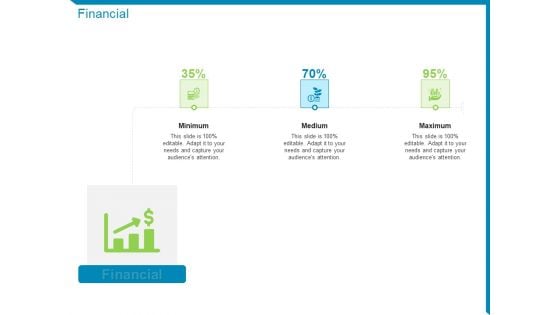
Case Competition Reduction In Existing Customer Of Telecommunication Company Financial Ppt Show Layout PDF
This is a case competition reduction in existing customer of telecommunication company financial ppt show layout pdf template with various stages. Focus and dispense information on three stages using this creative set, that comes with editable features. It contains large content boxes to add your information on topics like minimum, medium, maximum. You can also showcase facts, figures, and other relevant content using this PPT layout. Grab it now.


 Continue with Email

 Home
Home


