3 Infographics
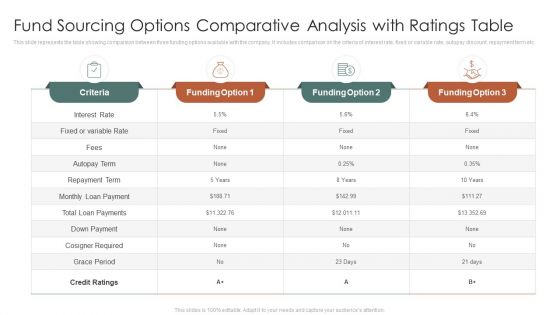
Fund Sourcing Options Comparative Analysis With Ratings Table Ppt PowerPoint Presentation Infographics Maker PDF
This slide represents the table showing comparison between three funding options available with the company. It includes comparison on the criteria of interest rate, fixed or variable rate, autopay discount, repayment term etc.Pitch your topic with ease and precision using this Fund Sourcing Options Comparative Analysis With Ratings Table Ppt PowerPoint Presentation Infographics Maker PDF. This layout presents information on Fixed Variable, Repayment Term, Cosigner Required. It is also available for immediate download and adjustment. So, changes can be made in the color, design, graphics or any other component to create a unique layout.
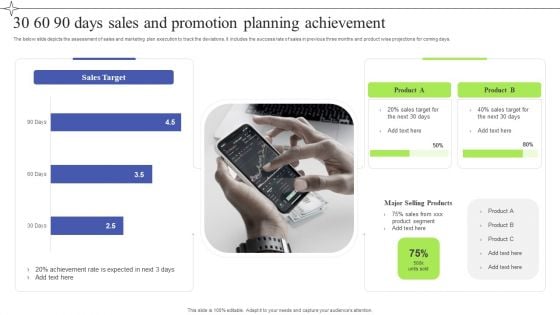
30 60 90 Days Sales And Promotion Planning Achievement Infographics PDF
The below slide depicts the assessment of sales and marketing plan execution to track the deviations. It includes the success rate of sales in previous three months and product wise projections for coming days. Showcasing this set of slides titled 30 60 90 Days Sales And Promotion Planning Achievement Infographics PDF. The topics addressed in these templates are 30 60 90 Days, Sales Promotion Planning, Achievement. All the content presented in this PPT design is completely editable. Download it and make adjustments in color, background, font etc. as per your unique business setting.
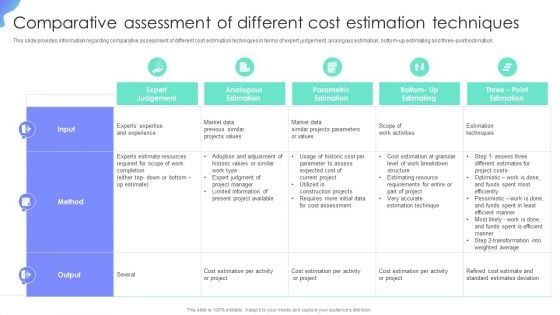
Comparative Assessment Of Different Cost Estimation Techniques Project Administration Plan Infographics PDF
This slide provides information regarding comparative assessment of different cost estimation techniques in terms of expert judgement, analogous estimation, bottom-up estimating and three-point estimation. From laying roadmaps to briefing everything in detail, our templates are perfect for you. You can set the stage with your presentation slides. All you have to do is download these easy-to-edit and customizable templates. Comparative Assessment Of Different Cost Estimation Techniques Project Administration Plan Infographics PDF will help you deliver an outstanding performance that everyone would remember and praise you for. Do download this presentation today.
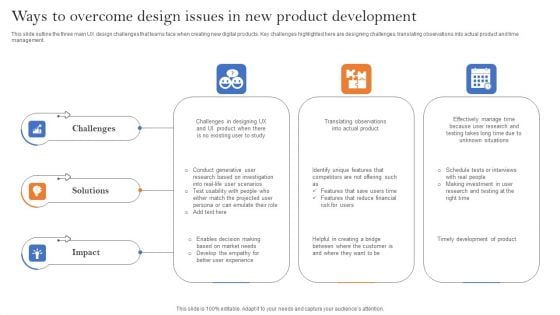
Ways To Overcome Design Issues In New Product Development Infographics PDF
This slide outline the three main UX design challenges that teams face when creating new digital products. Key challenges highlighted here are designing challenges, translating observations into actual product and time management. Showcasing this set of slides titled Ways To Overcome Design Issues In New Product Development Infographics PDF. The topics addressed in these templates are Challenges, Solutions, Impact. All the content presented in this PPT design is completely editable. Download it and make adjustments in color, background, font etc. as per your unique business setting.
Three Point Infographics Social Media Business Ppt PowerPoint Presentation Complete Deck With Slides
Boost your confidence and team morale with this well-structured three point infographics social media business ppt powerpoint presentation complete deck with slides. This prefabricated set gives a voice to your presentation because of its well-researched content and graphics. Our experts have added all the components very carefully, thus helping you deliver great presentations with a single click. Not only that, it contains a set of twelve slides that are designed using the right visuals, graphics, etc. Various topics can be discussed, and effective brainstorming sessions can be conducted using the wide variety of slides added in this complete deck. Apart from this, our PPT design contains clear instructions to help you restructure your presentations and create multiple variations. The color, format, design anything can be modified as deemed fit by the user. Not only this, it is available for immediate download. So, grab it now.
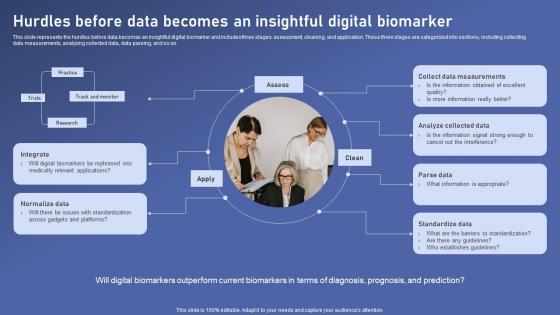
Hurdles Before Data Becomes Biomedical Data Science And Health Informatics Infographics Pdf
This slide represents the hurdles before data becomes an insightful digital biomarker and includes three stages assessment, cleaning, and application. These three stages are categorized into sections, including collecting data measurements, analyzing collected data, data parsing, and so on. Are you searching for a Hurdles Before Data Becomes Biomedical Data Science And Health Informatics Infographics Pdf that is uncluttered, straightforward, and original Its easy to edit, and you can change the colors to suit your personal or business branding. For a presentation that expresses how much effort you have put in, this template is ideal With all of its features, including tables, diagrams, statistics, and lists, its perfect for a business plan presentation. Make your ideas more appealing with these professional slides. Download Hurdles Before Data Becomes Biomedical Data Science And Health Informatics Infographics Pdf from Slidegeeks today. This slide represents the hurdles before data becomes an insightful digital biomarker and includes three stages assessment, cleaning, and application. These three stages are categorized into sections, including collecting data measurements, analyzing collected data, data parsing, and so on.
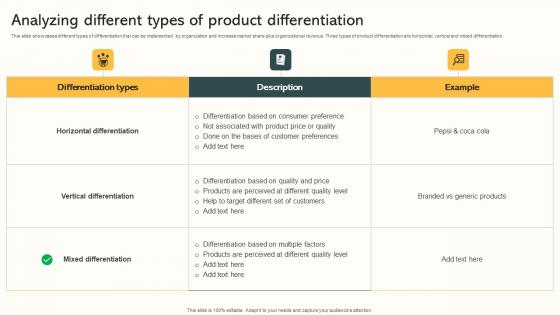
Analyzing Different Types Of Product Differentiation Market Expansion Through Infographics Pdf
This slide showcases different types of differentiation that can be implemented by organization and increase market share plus organizational revenue. Three types of product differentiation are horizontal, vertical and mixed differentiation. Formulating a presentation can take up a lot of effort and time, so the content and message should always be the primary focus. The visuals of the PowerPoint can enhance the presenters message, so our Analyzing Different Types Of Product Differentiation Market Expansion Through Infographics Pdf was created to help save time. Instead of worrying about the design, the presenter can concentrate on the message while our designers work on creating the ideal templates for whatever situation is needed. Slidegeeks has experts for everything from amazing designs to valuable content, we have put everything into Analyzing Different Types Of Product Differentiation Market Expansion Through Infographics Pdf This slide showcases different types of differentiation that can be implemented by organization and increase market share plus organizational revenue. Three types of product differentiation are horizontal, vertical and mixed differentiation.
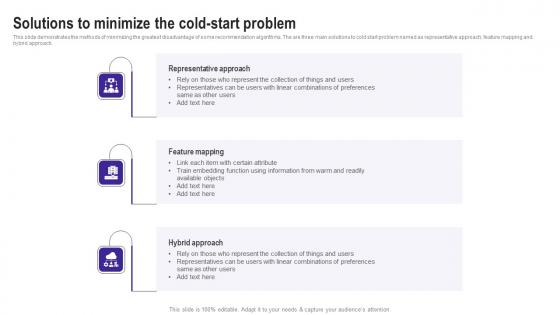
Solutions To Minimize The Cold Start Problem Use Cases Of Filtering Methods Infographics Pdf
This slide demonstrates the methods of minimizing the greatest disadvantage of some recommendation algorithms. The are three main solutions to cold start problem named as representative approach, feature mapping and hybrid approach. Do you have an important presentation coming up Are you looking for something that will make your presentation stand out from the rest Look no further than Solutions To Minimize The Cold Start Problem Use Cases Of Filtering Methods Infographics Pdf. With our professional designs, you can trust that your presentation will pop and make delivering it a smooth process. And with Slidegeeks, you can trust that your presentation will be unique and memorable. So why wait Grab Solutions To Minimize The Cold Start Problem Use Cases Of Filtering Methods Infographics Pdf today and make your presentation stand out from the rest This slide demonstrates the methods of minimizing the greatest disadvantage of some recommendation algorithms. The are three main solutions to cold start problem named as representative approach, feature mapping and hybrid approach.
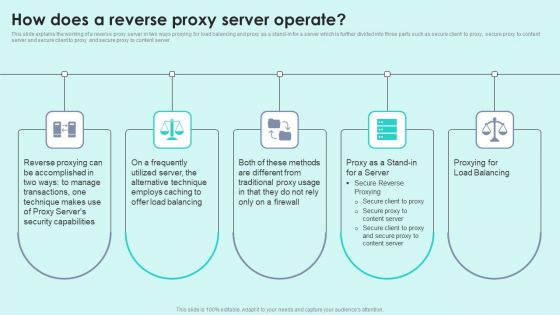
How Does A Reverse Proxy Server Operate Reverse Proxy For Load Balancing Infographics PDF
This slide explains the working of a reverse proxy server in two ways proxying for load balancing and proxy as a stand-in for a server which is further divided into three parts such as secure client to proxy, secure proxy to content server and secure client to proxy and secure proxy to content server.This is a How Does A Reverse Proxy Server Operate Reverse Proxy For Load Balancing Infographics PDF template with various stages. Focus and dispense information on five stages using this creative set, that comes with editable features. It contains large content boxes to add your information on topics like Reverse Proxying, Accomplished Transactions, Technique Security. You can also showcase facts, figures, and other relevant content using this PPT layout. Grab it now.
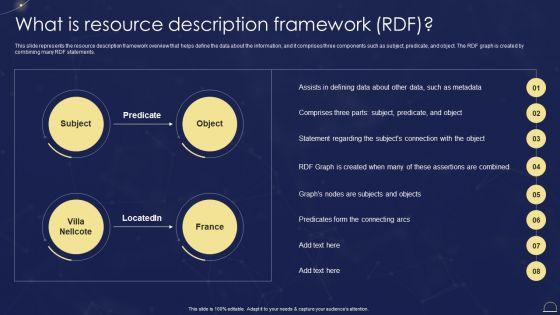
Semantic Web Technologies What Is Resource Description Framework RDF Infographics PDF
This slide represents the resource description framework overview that helps define the data about the information, and it comprises three components such as subject, predicate, and object. The RDF graph is created by combining many RDF statements. Do you know about Slidesgeeks Semantic Web Technologies What Is Resource Description Framework RDF Infographics PDF These are perfect for delivering any kind od presentation. Using it, create PowerPoint presentations that communicate your ideas and engage audiences. Save time and effort by using our pre-designed presentation templates that are perfect for a wide range of topic. Our vast selection of designs covers a range of styles, from creative to business, and are all highly customizable and easy to edit. Download as a PowerPoint template or use them as Google Slides themes.
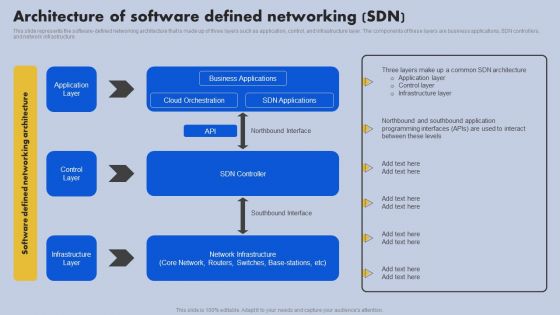
Architecture Of Software Defined Networking SDN Ppt Infographics Graphics Pictures PDF
This slide represents the software-defined networking architecture that is made up of three layers such as application, control, and infrastructure layer. The components of these layers are business applications, SDN controllers, and network infrastructure. Are you in need of a template that can accommodate all of your creative concepts This one is crafted professionally and can be altered to fit any style. Use it with Google Slides or PowerPoint. Include striking photographs, symbols, depictions, and other visuals. Fill, move around, or remove text boxes as desired. Test out color palettes and font mixtures. Edit and save your work, or work with colleagues. Download Architecture Of Software Defined Networking SDN Ppt Infographics Graphics Pictures PDF and observe how to make your presentation outstanding. Give an impeccable presentation to your group and make your presentation unforgettable.

Three Months Roadmap Of Fund Mobilization For New Venture Business Infographics
Presenting our jaw dropping three months roadmap of fund mobilization for new venture business infographics. You can alternate the color, font size, font type, and shapes of this PPT layout according to your strategic process. This PPT presentation is compatible with Google Slides and is available in both standard screen and widescreen aspect ratios. You can also download this well researched PowerPoint template design in different formats like PDF, JPG, and PNG. So utilize this visually appealing design by clicking the download button given below.
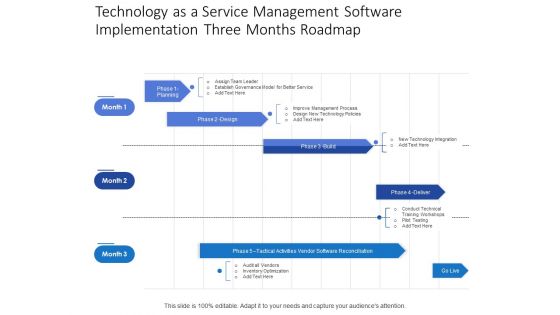
Technology As A Service Management Software Implementation Three Months Roadmap Infographics
Presenting the technology as a service management software implementation three months roadmap infographics. The template includes a roadmap that can be used to initiate a strategic plan. Not only this, the PowerPoint slideshow is completely editable and you can effortlessly modify the font size, font type, and shapes according to your needs. This PPT slide can be easily reached in standard screen and widescreen aspect ratios. The set is also available in various formats like PDF, PNG, and JPG. So download and use it multiple times as per your knowledge.
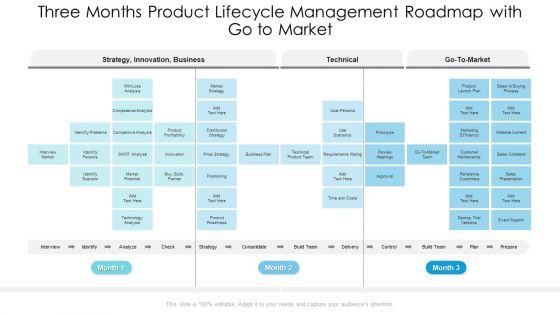
Three Months Product Lifecycle Management Roadmap With Go To Market Infographics
Presenting the three months product lifecycle management roadmap with go to market infographics. The template includes a roadmap that can be used to initiate a strategic plan. Not only this, the PowerPoint slideshow is completely editable and you can effortlessly modify the font size, font type, and shapes according to your needs. This PPT slide can be easily reached in standard screen and widescreen aspect ratios. The set is also available in various formats like PDF, PNG, and JPG. So download and use it multiple times as per your knowledge.
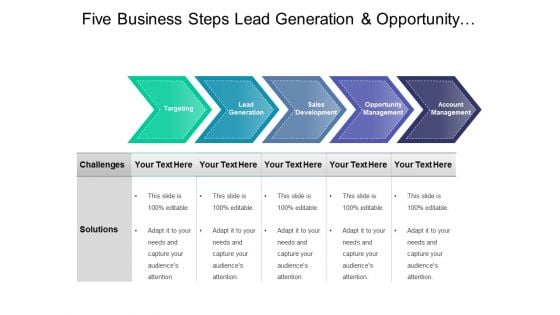
Five Business Steps Lead Generation And Opportunity Management Ppt PowerPoint Presentation Pictures Infographics
This is a five business steps lead generation and opportunity management ppt powerpoint presentation pictures infographics. This is a three stage process. The stages in this process are problem and solution, challenges and solutions, issues and solutions.

Confused Vector Worried Woman Lost In Thoughts Ppt PowerPoint Presentation Infographics
This is a confused vector worried woman lost in thoughts ppt powerpoint presentation infographics. This is a three stage process. The stages in this process are confused icon, unclear icon, muddled icon.

Moving Ahead Runners On Starting Line Of The Marathon Ppt PowerPoint Presentation Ideas Infographics
This is a moving ahead runners on starting line of the marathon ppt powerpoint presentation ideas infographics. This is a three stage process. The stages in this process are thinking ahead, moving forward, moving ahead.
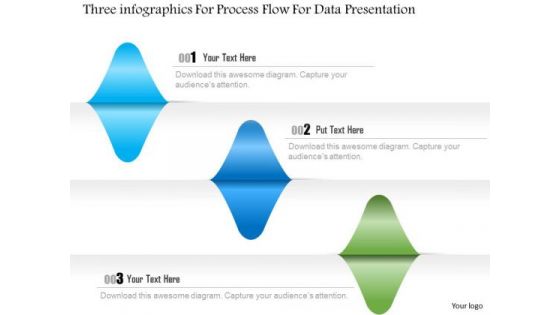
Busines Diagram Three Infographics For Process Flow For Data Presentation Template
Three info graphics has been used to design this business diagram. This slide helps to depict business process flow. This slide offers an excellent background to build professional presentations.
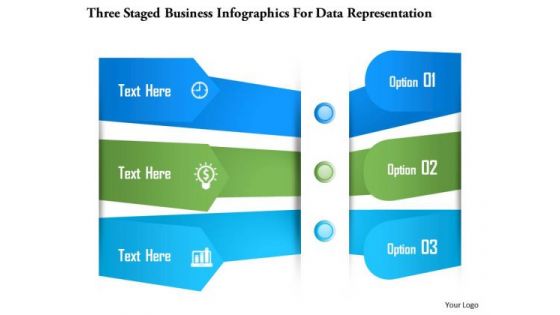
Business Diagram Three Staged Business Infographics For Data Representation Presentation Template
Three staged info graphics has been used to design this PowerPoint template. This slide can be used for text representation. Present your views using this innovative slide and be assured of leaving a lasting impression.

Business Diagram Three Staged Infographics With Diary For Data Flow PowerPoint Template
Three staged info graphic with diary has been used to design this power point template. This PPT contains the concept of data flow. Use this PPT diagram to represent the marketing and business data in any presentation.
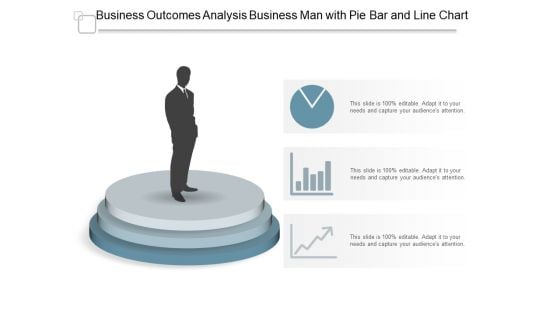
Business Outcomes Analysis Business Man With Pie Bar And Line Chart Ppt Powerpoint Presentation Infographics Visual Aids
This is a business outcomes analysis business man with pie bar and line chart ppt powerpoint presentation infographics visual aids. This is a three stage process. The stages in this process are business outcomes, business results, business output.
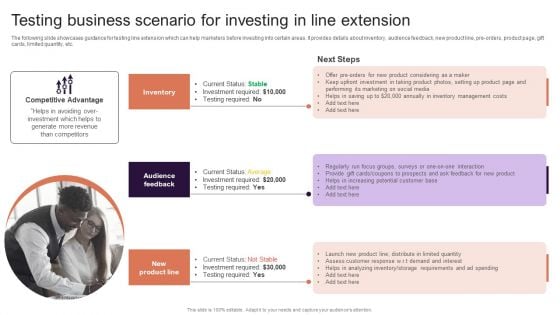
Implementing Brand Extension Initiatives For Apple Company Testing Business Scenario For Investing In Line Extension Infographics PDF
The following slide showcases guidance for testing line extension which can help marketers before investing into certain areas. It provides details about inventory, audience feedback, new product line, pre-orders, product page, gift cards, limited quantity, etc. Find highly impressive Implementing Brand Extension Initiatives For Apple Company Testing Business Scenario For Investing In Line Extension Infographics PDF on Slidegeeks to deliver a meaningful presentation. You can save an ample amount of time using these presentation templates. No need to worry to prepare everything from scratch because Slidegeeks experts have already done a huge research and work for you. You need to download Implementing Brand Extension Initiatives For Apple Company Testing Business Scenario For Investing In Line Extension Infographics PDF for your upcoming presentation. All the presentation templates are 100 percent editable and you can change the color and personalize the content accordingly. Download now.
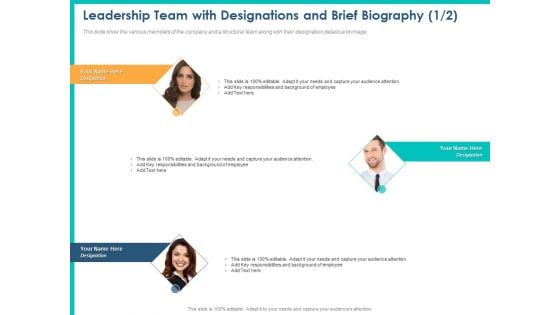
PPM Private Equity Leadership Team With Designations And Brief Biography Ppt PowerPoint Presentation Infographics Graphics Tutorials PDF
This slide show the various members of the company and a structural team along with their designation details and image. This is a ppm private equity leadership team with designations and brief biography ppt powerpoint presentation infographics graphics tutorials pdf template with various stages. Focus and dispense information on three stages using this creative set, that comes with editable features. It contains large content boxes to add your information on topics like key responsibilities, employee. You can also showcase facts, figures, and other relevant content using this PPT layout. Grab it now.
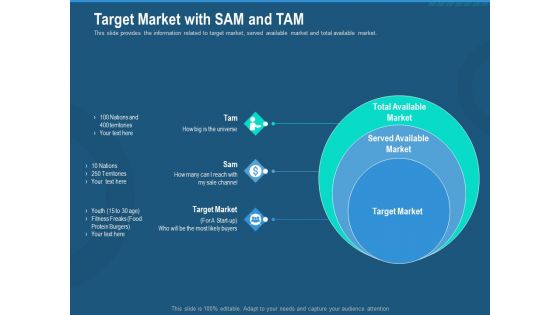
Investment Pitch To Generate Capital From Series B Venture Round Target Market With Sam And Tam Infographics PDF
This slide provides the information related to target market, served available market and total available market. This is a investment pitch to generate capital from series b venture round target market with sam and tam infographics pdf template with various stages. Focus and dispense information on three stages using this creative set, that comes with editable features. It contains large content boxes to add your information on topics like total available market, served available market, target market. You can also showcase facts, figures, and other relevant content using this PPT layout. Grab it now.
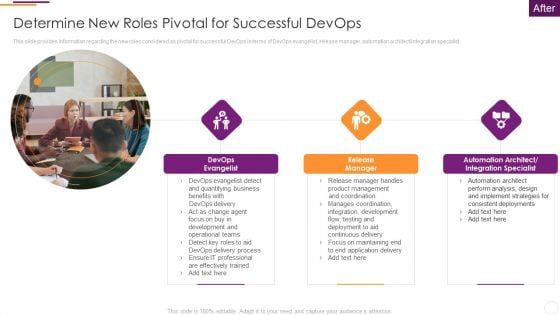
Key Parameters To Establish Overall Devops Value IT Determine New Roles Pivotal For Successful Devops Infographics PDF
This slide provides information regarding the new roles considered as pivotal for successful DevOps in terms of DevOps evangelist, release manager, automation architect or integration specialist. This is a key parameters to establish overall devops value it determine new roles pivotal for successful devops infographics pdf template with various stages. Focus and dispense information on three stages using this creative set, that comes with editable features. It contains large content boxes to add your information on topics like devops evangelist, release manager, automation architect or integration specialist . You can also showcase facts, figures, and other relevant content using this PPT layout. Grab it now.
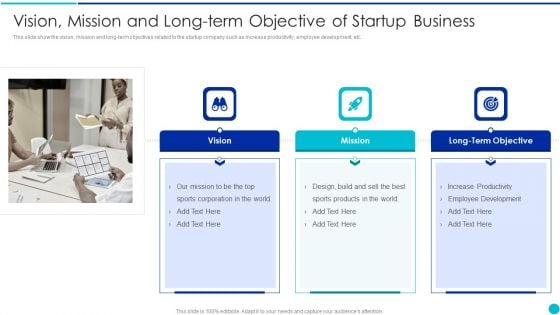
Valuing A Pre Revenue Startup Business Vision Mission And Long Term Objective Of Startup Business Infographics PDF
This slide show the vision, mission and long-term objectives related to the startup company such as increase productivity, employee development, etc. This is a valuing a pre revenue startup business vision mission and long term objective of startup business infographics pdf template with various stages. Focus and dispense information on three stages using this creative set, that comes with editable features. It contains large content boxes to add your information on topics like vision, mission, long term objective. You can also showcase facts, figures, and other relevant content using this PPT layout. Grab it now.

Handling Cyber Threats Digital Era Key Security Controls To Be Addressed In The Program Ppt Infographics Samples PDF
Purpose of this slide is to provide information about key security controls that are to be addressed in companys information security program. Security controls covered are user application hardening, daily backups and patch applications. Presenting handling cyber threats digital era key security controls to be addressed in the program ppt infographics samples pdf to provide visual cues and insights. Share and navigate important information on three stages that need your due attention. This template can be used to pitch topics like prevents attacks, limits extent of attacks, data recovery. In addtion, this PPT design contains high resolution images, graphics, etc, that are easily editable and available for immediate download.
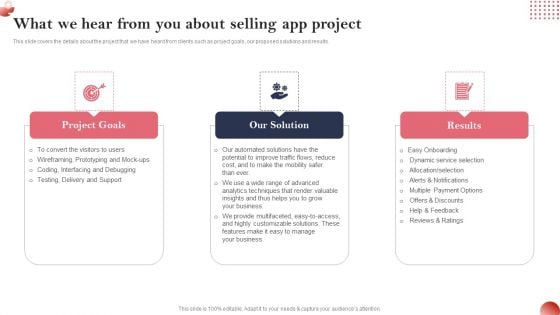
Creating And Introducing A Web Based What We Hear From You About Selling App Project Infographics PDF
This slide covers the details about the project that we have heard from clients such as project goals, our proposed solutions and results. Find a pre designed and impeccable Creating And Introducing A Web Based What We Hear From You About Selling App Project Infographics PDF. The templates can ace your presentation without additional effort. You can download these easy to edit presentation templates to make your presentation stand out from others. So, what are you waiting for Download the template from Slidegeeks today and give a unique touch to your presentation.
Win Win Situation Icon With Person On Podium With Two Stars Ppt PowerPoint Presentation Infographics Slide PDF
Presenting Win Win Situation Icon With Person On Podium With Two Stars Ppt PowerPoint Presentation Infographics Slide PDF to dispense important information. This template comprises three stages. It also presents valuable insights into the topics including win win situation icon with person on podium with two stars. This is a completely customizable PowerPoint theme that can be put to use immediately. So, download it and address the topic impactfully.

Viral Marketing Techniques To Increase Annual Business Sales Key Viral Marketing Trends For Business Professionals Infographics PDF
This slide showcases trends which can be referred by content creators to enhance their viral marketing strategies. It provides information about TikTok, content marketing, mobile friendly experience, social media platforms, etc. Presenting this PowerPoint presentation, titled Viral Marketing Techniques To Increase Annual Business Sales Key Viral Marketing Trends For Business Professionals Infographics PDF, with topics curated by our researchers after extensive research. This editable presentation is available for immediate download and provides attractive features when used. Download now and captivate your audience. Presenting this Viral Marketing Techniques To Increase Annual Business Sales Key Viral Marketing Trends For Business Professionals Infographics PDF. Our researchers have carefully researched and created these slides with all aspects taken into consideration. This is a completely customizable Viral Marketing Techniques To Increase Annual Business Sales Key Viral Marketing Trends For Business Professionals Infographics PDF that is available for immediate downloading. Download now and make an impact on your audience. Highlight the attractive features available with our PPTs.
A Step By Step Guide To Creating Brand Guidelines About Us For Logo Style Guide Proposal Infographics PDF
Presenting this set of slides with name a step by step guide to creating brand guidelines about us for logo style guide proposal infographics pdf. This is a three stage process. The stages in this process are our company, values clients, premium services. This is a completely editable PowerPoint presentation and is available for immediate download. Download now and impress your audience.
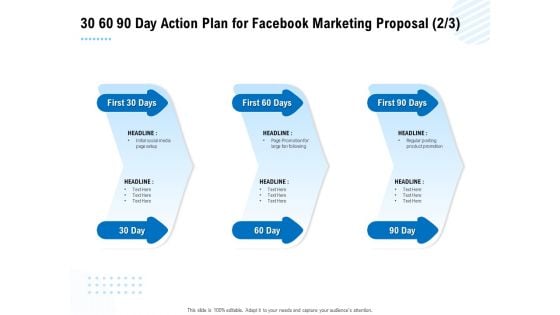
Facebook Ad Management 30 60 90 Day Action Plan For Facebook Marketing Proposal Ppt Infographics Portrait PDF
Presenting this set of slides with name facebook ad management 30 60 90 day action plan for facebook marketing proposal ppt infographics portrait pdf. This is a three stage process. The stages in this process are 30 60 90 days plan. This is a completely editable PowerPoint presentation and is available for immediate download. Download now and impress your audience.
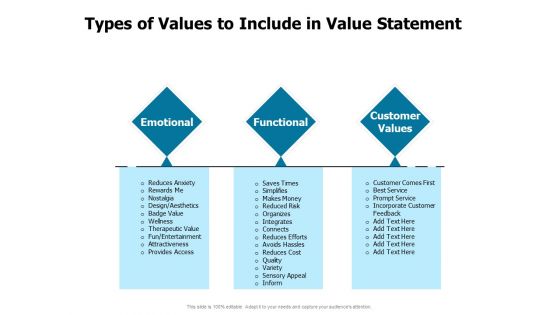
Developing Implementing Strategic HRM Plans Types Of Values To Include In Value Statement Ppt Infographics Maker PDF
Presenting this set of slides with name developing implementing strategic hrm plans types of values to include in value statement ppt infographics maker pdf. This is a three stage process. The stages in this process are emotional, functional, customer values. This is a completely editable PowerPoint presentation and is available for immediate download. Download now and impress your audience.
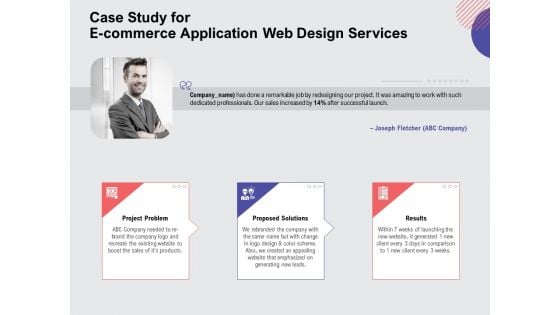
Web Design Services Proposal For Ecommerce Business Case Study For E Commerce Application Web Design Services Infographics PDF
Presenting this set of slides with name web design services proposal for ecommerce business case study for e commerce application web design services infographics pdf. This is a three stage process. The stages in this process are project problem, proposed solutions, results. This is a completely editable PowerPoint presentation and is available for immediate download. Download now and impress your audience.
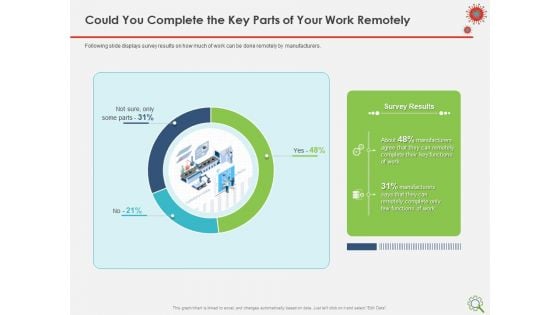
COVID Implications On Manufacturing Business Could You Complete The Key Parts Of Your Work Remotely Infographics PDF
Presenting this set of slides with name covid implications on manufacturing business could you complete the key parts of your work remotely infographics pdf. This is a three stage process. The stages in this process are survey results, manufacturers, few functions work, key functions work. This is a completely editable PowerPoint presentation and is available for immediate download. Download now and impress your audience.
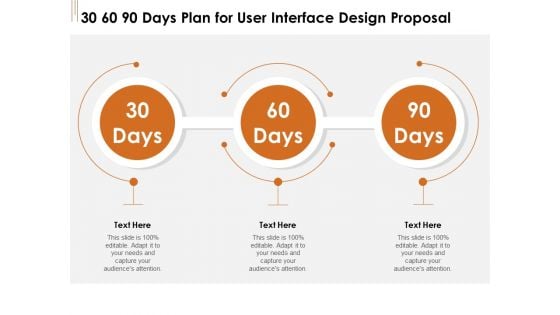
UI Software Design 30 60 90 Days Plan For User Interface Design Proposal Ppt Infographics Pictures PDF
Presenting this set of slides with name ui software design 30 60 90 days plan for user interface design proposal ppt infographics pictures pdf. This is a three stage process. The stages in this process are 30 60 90 days plan. This is a completely editable PowerPoint presentation and is available for immediate download. Download now and impress your audience.
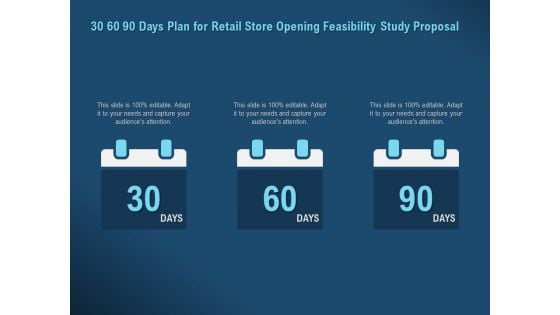
Proof Concept Variety Shop 30 60 90 Days Plan For Retail Store Opening Feasibility Study Proposal Infographics PDF
Presenting this set of slides with name proof concept variety shop 30 60 90 days plan for retail store opening feasibility study proposal infographics pdf. This is a three stage process. The stages in this process are 30 60 90 days plan. This is a completely editable PowerPoint presentation and is available for immediate download. Download now and impress your audience.
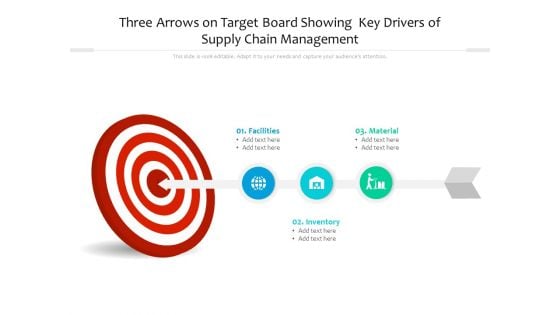
Three Arrows On Target Board Showing Key Drivers Of Supply Chain Management Ppt Powerpoint Presentation Infographics Shapes Pdf
Persuade your audience using this three arrows on target board showing key drivers of supply chain management ppt powerpoint presentation infographics shapes pdf. This PPT design covers three stages, thus making it a great tool to use. It also caters to a variety of topics including facilities, material, inventory. Download this PPT design now to present a convincing pitch that not only emphasizes the topic but also showcases your presentation skills.
Sales Steps Process With Gear And Bar Chart Vector Icon Ppt PowerPoint Presentation Infographics Graphics Design PDF
Presenting sales steps process with gear and bar chart vector icon ppt powerpoint presentation infographics graphics design pdf to dispense important information. This template comprises three stages. It also presents valuable insights into the topics including sales steps process with gear and bar chart vector icon. This is a completely customizable PowerPoint theme that can be put to use immediately. So, download it and address the topic impactfully.

Assessing The Impact Of COVID On Retail Business Segment Supply Chain Disruption Risk Due To Covid 19 Infographics PDF
Presenting this set of slides with name assessing the impact of covid on retail business segment supply chain disruption risk due to covid 19 infographics pdf. This is a three stage process. The stages in this process are direct impact on production, aggressive shopping, market and supply chain disruption, financial, goals. This is a completely editable PowerPoint presentation and is available for immediate download. Download now and impress your audience.

Investment Pitch For Aftermarket Key Products And Services Of The Company Ppt PowerPoint Presentation Infographics Picture PDF
Presenting this set of slides with name investment pitch for aftermarket key products and services of the company ppt powerpoint presentation infographics picture pdf. This is a three stage process. The stages in this process are individuals, business smes, corporate, saving accounts, deposit accounts, agriculture loan, loan against group, housing loans. This is a completely editable PowerPoint presentation and is available for immediate download. Download now and impress your audience.
Finance Manager Icon With Idea Bulb And Gear Vector Illustration Ppt PowerPoint Presentation Infographics Graphics Tutorials PDF
Presenting this set of slides with name finance manager icon with idea bulb and gear vector illustration ppt powerpoint presentation infographics graphics tutorials pdf. This is a three stage process. The stages in this process are finance manager icon with idea bulb and gear vector illustration. This is a completely editable PowerPoint presentation and is available for immediate download. Download now and impress your audience.
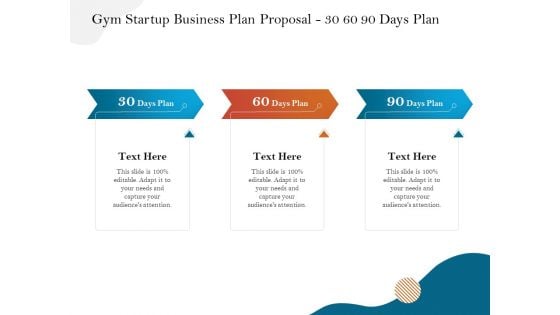
Gym And Fitness Center Business Plan Gym Startup Business Plan Proposal 30 60 90 Days Plan Infographics PDF
This is a gym and fitness center business plan gym startup business plan proposal 30 60 90 days plan infographics pdf template with various stages. Focus and dispense information on three stages using this creative set, that comes with editable features. It contains large content boxes to add your information on topics like 30 60 90 days plan. You can also showcase facts, figures, and other relevant content using this PPT layout. Grab it now.

Artificial Intelligence And Internet Of Things With Brain Shaped Chip Buses Ppt PowerPoint Presentation Infographics Design Ideas PDF
Persuade your audience using this artificial intelligence and internet of things with brain shaped chip buses ppt powerpoint presentation infographics design ideas pdf. This PPT design covers three stages, thus making it a great tool to use. It also caters to a variety of topics including artificial intelligence and internet of things with brain shaped chip buses. Download this PPT design now to present a convincing pitch that not only emphasizes the topic but also showcases your presentation skills.

30 60 90 Days Plan For Web Development And IT Design Proposal Ppt PowerPoint Presentation Infographics Format PDF
This is a 30 60 90 days plan for web development and it design proposal ppt powerpoint presentation infographics format pdf template with various stages. Focus and dispense information on three stages using this creative set, that comes with editable features. It contains large content boxes to add your information on topics like 30 60 90 days plan. You can also showcase facts, figures, and other relevant content using this PPT layout. Grab it now.
Analyzing Real Estate Funding Sources With Cost Borrowing 30 60 90 Days Plan Ppt Infographics Master Slide PDF
Presenting analyzing real estate funding sources with cost borrowing 30 60 90 days plan ppt infographics master slide pdf to provide visual cues and insights. Share and navigate important information on three stages that need your due attention. This template can be used to pitch topics like 30 60 90 days plan. In addtion, this PPT design contains high resolution images, graphics, etc, that are easily editable and available for immediate download.
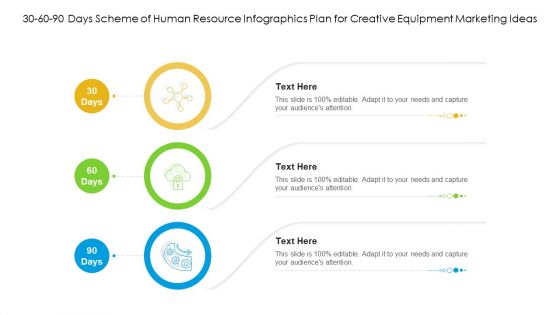
30 60 90 Days Scheme Of Human Resource Infographics Plan For Creative Equipment Marketing Ideas Guidelines PDF
Persuade your audience using this 30 60 90 days scheme of human resource infographics plan for creative equipment marketing ideas guidelines pdf. This PPT design covers three stages, thus making it a great tool to use. It also caters to a variety of topics including 30 60 90 days. Download this PPT design now to present a convincing pitch that not only emphasizes the topic but also showcases your presentation skills.
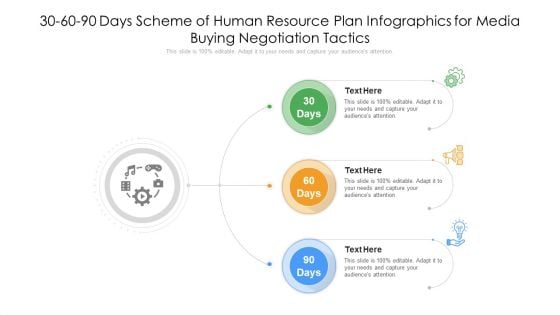
30 60 90 Days Scheme Of Human Resource Plan Infographics For Media Buying Negotiation Tactics Template PDF
Persuade your audience using this 30 60 90 days scheme of human resource plan infographics for media buying negotiation tactics template pdf. This PPT design covers three stages, thus making it a great tool to use. It also caters to a variety of topics including 30 60 90 days. Download this PPT design now to present a convincing pitch that not only emphasizes the topic but also showcases your presentation skills.

Agenda For Development And Operations Tools To Reduce Gap Between Program Development And Operations Teams Infographics PDF
This is a agenda for development and operations tools to reduce gap between program development and operations teams infographics pdf template with various stages. Focus and dispense information on three stages using this creative set, that comes with editable features. It contains large content boxes to add your information on topics like agenda. You can also showcase facts, figures, and other relevant content using this PPT layout. Grab it now.
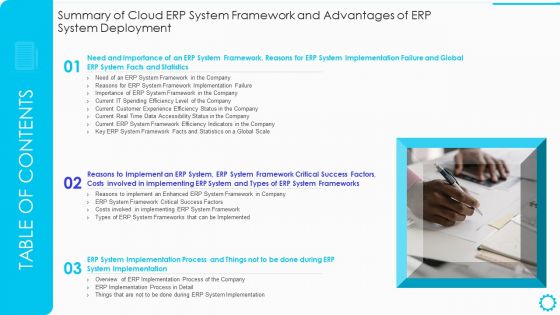
Table Of Contents Summary Of Cloud Erp System Framework And Advantages Of Erp System Deployment Contd Demonstration PDF Infographics PDF
This is a Table Of Contents Summary Of Cloud Erp System Framework And Advantages Of Erp System Deployment Contd Demonstration PDF Infographics PDF template with various stages. Focus and dispense information on three stages using this creative set, that comes with editable features. It contains large content boxes to add your information on topics like Need And Importance, System Facts And Statistics, Reasons To Implement. You can also showcase facts, figures, and other relevant content using this PPT layout. Grab it now.
Makeup And Skincare Brand What Makes Our Product Stand Out From The Crowd Ppt Icon Infographics PDF
This slide illustrates the production distinctions of XYZ beauty brand which includes dermatologist tested, fair trade, certified, etc. This is a Makeup And Skincare Brand What Makes Our Product Stand Out From The Crowd Ppt Icon Infographics PDF template with various stages. Focus and dispense information on three stages using this creative set, that comes with editable features. It contains large content boxes to add your information on topics like Dermatologist Tested, Prescription Strength, Beauty Organic. You can also showcase facts, figures, and other relevant content using this PPT layout. Grab it now.
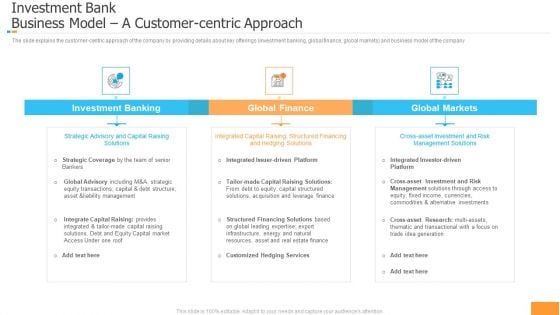
Funding Pitch Book Outline Investment Bank Business Model A Customer Centric Approach Ppt Infographics Layout Ideas PDF
The slide explains the custome centric approach of the company by providing details about key offerings investment banking, global finance, global markets and business model of the company. Presenting funding pitch book outline investment bank business model a customer centric approach ppt infographics layout ideas pdf to provide visual cues and insights. Share and navigate important information on three stages that need your due attention. This template can be used to pitch topics like investment banking, global finance, global markets. In addtion, this PPT design contains high resolution images, graphics, etc, that are easily editable and available for immediate download.
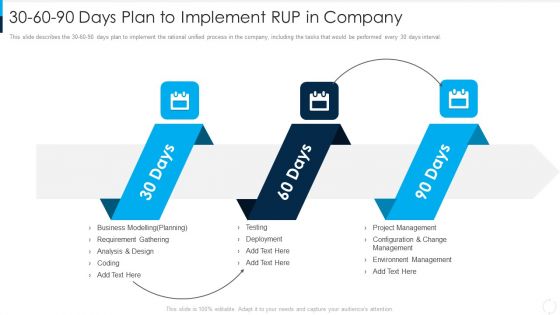
RUP Model 30 60 90 Days Plan To Implement RUP In Company Ppt Infographics Graphics Download PDF
This slide describes the 30-60-90 days plan to implement the rational unified process in the company, including the tasks that would be performed every 30 days interval. Presenting rup model 30 60 90 days plan to implement rup in company ppt infographics graphics download pdf to provide visual cues and insights. Share and navigate important information on three stages that need your due attention. This template can be used to pitch topics like 30 60 90 days plan. In addtion, this PPT design contains high resolution images, graphics, etc, that are easily editable and available for immediate download.
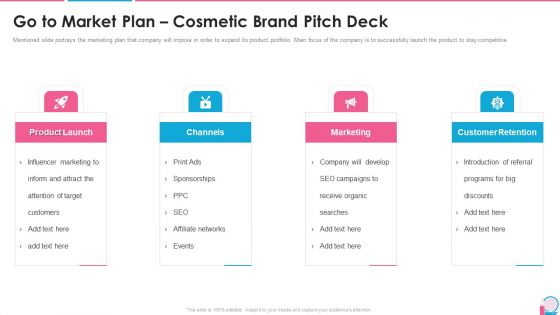
Investor Pitch Presentation For Beauty Product Brands Go To Market Plan Cosmetic Brand Pitch Deck Infographics PDF
Mentioned slide portrays the marketing plan that company will impose in order to expand its product portfolio. Main focus of the company is to successfully launch the product to stay competitive. This is a investor pitch presentation for beauty product brands go to market plan cosmetic brand pitch deck infographics pdf template with various stages. Focus and dispense information on three stages using this creative set, that comes with editable features. It contains large content boxes to add your information on topics like product launch, channels, marketing, customer retention. You can also showcase facts, figures, and other relevant content using this PPT layout. Grab it now.
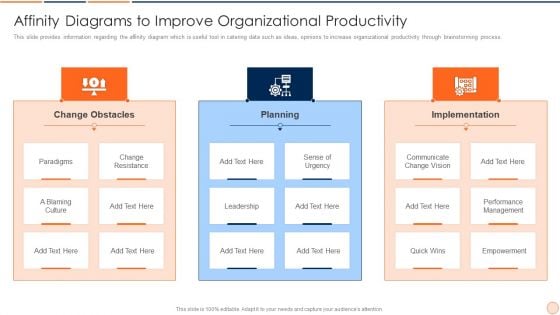
Strategic Business Plan Effective Tools And Templates Set 1 Affinity Diagrams To Improve Organizational Productivity Infographics PDF
This slide provides information regarding the affinity diagram which is useful tool in catering data such as ideas, opinions to increase organizational productivity through brainstorming process. Presenting strategic business plan effective tools and templates set 1 affinity diagrams to improve organizational productivity infographics pdf to provide visual cues and insights. Share and navigate important information on three stages that need your due attention. This template can be used to pitch topics like change obstacles, planning, implementation. In addtion, this PPT design contains high resolution images, graphics, etc, that are easily editable and available for immediate download.
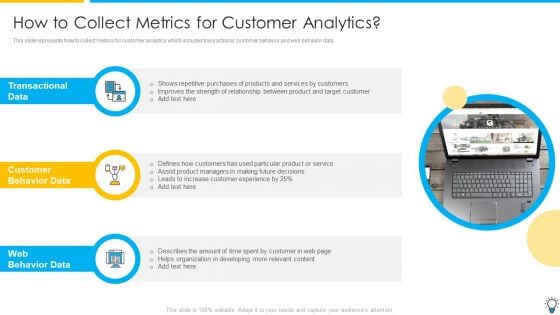
Assuring Management In Product Innovation To Enhance Processes How To Collect Metrics For Customer Analytics Infographics PDF
This slide represents how to collect metrics for customer analytics which includes transactional, customer behavior and web behavior data.This is a assuring management in product innovation to enhance processes how to collect metrics for customer analytics infographics pdf template with various stages. Focus and dispense information on three stages using this creative set, that comes with editable features. It contains large content boxes to add your information on topics like transactional data, customer behavior data, web behavior data You can also showcase facts, figures, and other relevant content using this PPT layout. Grab it now.
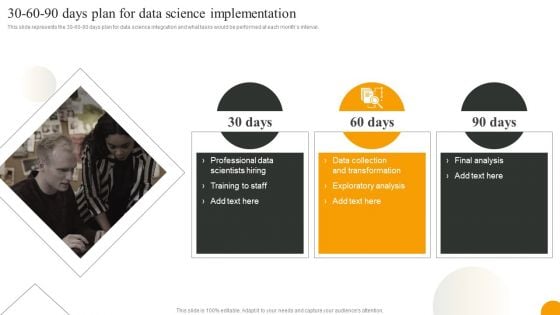
Using Data Science Technologies For Business Transformation 30 60 90 Days Plan For Data Science Implementation Infographics PDF
This slide represents the 30 60 90 days plan for data science integration and what tasks would be performed at each months interval. Want to ace your presentation in front of a live audience Our Using Data Science Technologies For Business Transformation 30 60 90 Days Plan For Data Science Implementation Infographics PDF can help you do that by engaging all the users towards you. Slidegeeks experts have put their efforts and expertise into creating these impeccable powerpoint presentations so that you can communicate your ideas clearly. Moreover, all the templates are customizable, and easy to edit and downloadable. Use these for both personal and commercial use.
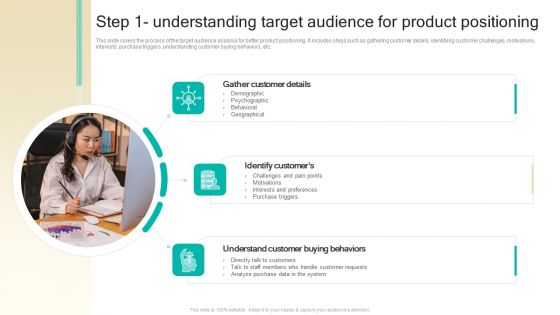
Procedure To Develop Effective Product Step 1 Understanding Target Audience For Product Positioning Ppt Infographics Example PDF
This slide covers the process of the target audience analysis for better product positioning. It includes steps such as gathering customer details, identifying customer challenges, motivations, interests, purchase triggers, understanding customer buying behaviors, etc. Retrieve professionally designed Procedure To Develop Effective Product Step 1 Understanding Target Audience For Product Positioning Ppt Infographics Example PDF to effectively convey your message and captivate your listeners. Save time by selecting pre-made slideshows that are appropriate for various topics, from business to educational purposes. These themes come in many different styles, from creative to corporate, and all of them are easily adjustable and can be edited quickly. Access them as PowerPoint templates or as Google Slides themes. You do not have to go on a hunt for the perfect presentation because Slidegeeks got you covered from everywhere.
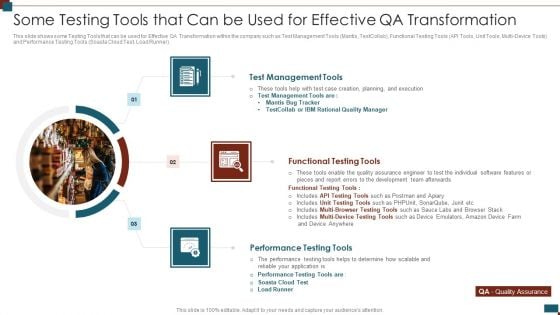
Successful Quality Assurance Transition Techniques To Enhance Product Quality Some Testing Tools That Can Be Used Infographics PDF
This slide shows some Testing Tools that can be used for Effective QA Transformation within the company such as Test Management Tools Mantis, TestCollab, Functional Testing Tools API Tools, Unit Tools, Multi-Device Tools and Performance Testing Tools Soasta Cloud Test, Load Runner. This is a successful quality assurance transition techniques to enhance product quality some testing tools that can be used infographics pdf template with various stages. Focus and dispense information on three stages using this creative set, that comes with editable features. It contains large content boxes to add your information on topics like test management tools, functional testing tools, performance testing tools. You can also showcase facts, figures, and other relevant content using this PPT layout. Grab it now.
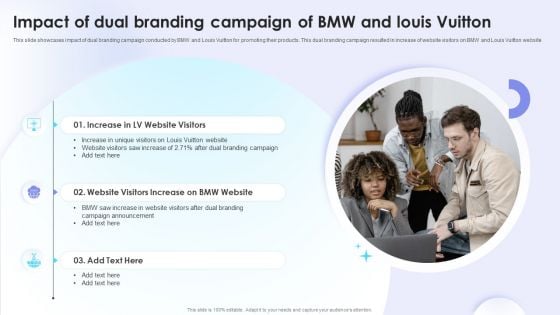
Dual Branding Campaign To Boost Sales Of Product Or Services Product Orimpact Of Dual Branding Campaign Infographics PDF
This slide showcases impact of dual branding campaign conducted by BMW and Louis Vuitton for promoting their products. This dual branding campaign resulted in increase of website visitors on BMW and Louis Vuitton website. Present like a pro with Dual Branding Campaign To Boost Sales Of Product Or Services Product Orimpact Of Dual Branding Campaign Infographics PDF Create beautiful presentations together with your team, using our easy to use presentation slides. Share your ideas in real time and make changes on the fly by downloading our templates. So whether you are in the office, on the go, or in a remote location, you can stay in sync with your team and present your ideas with confidence. With Slidegeeks presentation got a whole lot easier. Grab these presentations today.


 Continue with Email

 Home
Home


