5 Circle Infographic
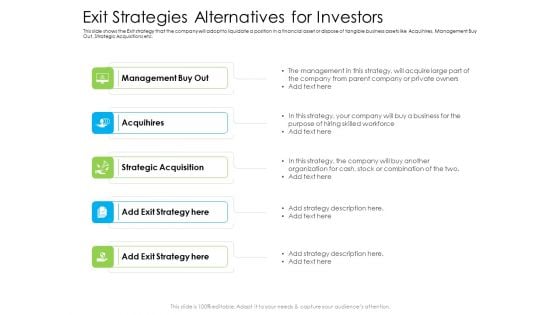
Exit Strategies Alternatives For Investors Ppt Infographics Background PDF
This slide shows the Exit strategy that the company will adopt to liquidate a position in a financial asset or dispose of tangible business assets like Acquihires, Management Buy Out, Strategic Acquisitions etc. Presenting exit strategies alternatives for investors ppt infographics background pdf to provide visual cues and insights. Share and navigate important information on five stages that need your due attention. This template can be used to pitch topics like strategic acquisition, acquihires, management buy out. In addition, this PPT design contains high-resolution images, graphics, etc, that are easily editable and available for immediate download.
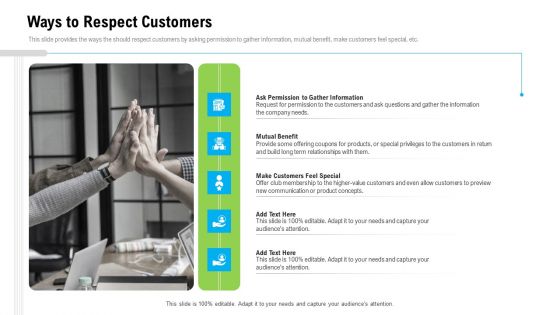
Organizational Culture Ways To Respect Customers Ppt Gallery Infographics PDF
This slide provides the ways the should respect customers by asking permission to gather information, mutual benefit, make customers feel special, etc. Presenting organizational culture ways to respect customers ppt gallery infographics pdf to provide visual cues and insights. Share and navigate important information on five stages that need your due attention. This template can be used to pitch topics like ask permission to gather information, mutual benefit, make customers feel special. In addtion, this PPT design contains high resolution images, graphics, etc, that are easily editable and available for immediate download.
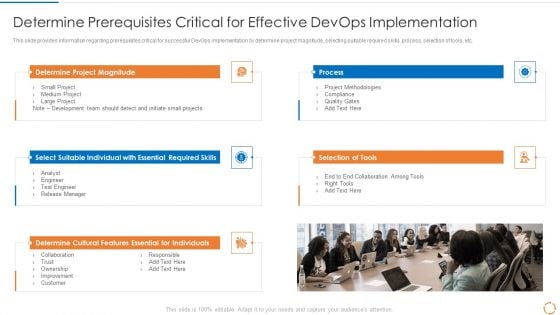
Devops Configuration Management IT Determine Prerequisites Critical Infographics PDF
This slide provides information regarding prerequisites critical for successful DevOps implementation by determine project magnitude, selecting suitable required skills, process, selection of tools, etc. Presenting devops configuration management it determine prerequisites critical infographics pdf to provide visual cues and insights. Share and navigate important information on five stages that need your due attention. This template can be used to pitch topics like project magnitude, process, required skills. In addition, this PPT design contains high resolution images, graphics, etc, that are easily editable and available for immediate download.
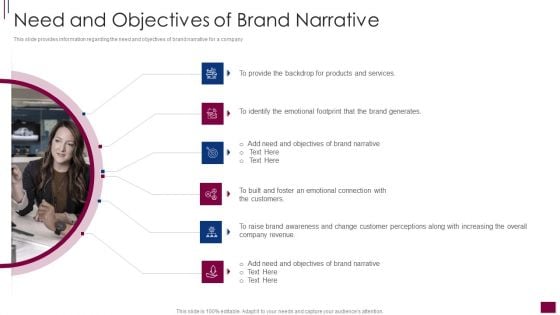
Components Prerequisite Brand Narrative Development Need And Objectives Infographics PDF
This slide provides information regarding the need and objectives of brand narrative for a company. This is a components prerequisite brand narrative development need and objectives infographics pdf template with various stages. Focus and dispense information on five stages using this creative set, that comes with editable features. It contains large content boxes to add your information on topics like products and services, brand generates, brand narrative, emotional connection, customers. You can also showcase facts, figures, and other relevant content using this PPT layout. Grab it now.
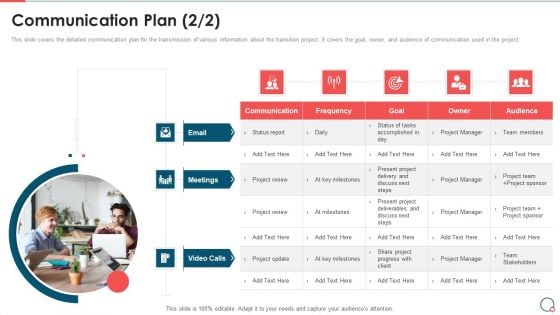
Communication Plan Information Technology Change Implementation Plan Infographics PDF
This slide covers the detailed communication plan for the transmission of various information about the transition project. It covers the goal, owner, and audience of communication used in the project. This is a Communication Plan Information Technology Change Implementation Plan Infographics PDF template with various stages. Focus and dispense information on five stages using this creative set, that comes with editable features. It contains large content boxes to add your information on topics like Communication, Goal, Frequency, Meetings, Email. You can also showcase facts, figures, and other relevant content using this PPT layout. Grab it now.
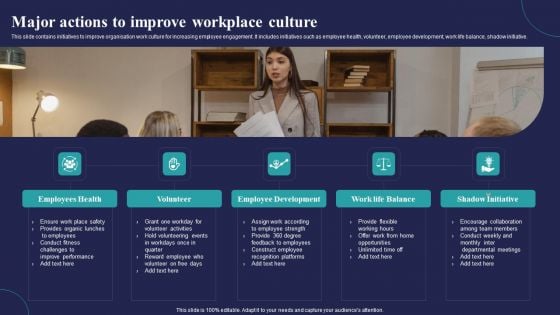
Major Actions To Improve Workplace Culture Ppt Infographics Model PDF
This slide contains initiatives to improve organisation work culture for increasing employee engagement. It includes initiatives such as employee health, volunteer, employee development, work life balance, shadow initiative. Presenting Major Actions To Improve Workplace Culture Ppt Infographics Model PDF to dispense important information. This template comprises five stages. It also presents valuable insights into the topics including Employees Health, Volunteer, Employee Development. This is a completely customizable PowerPoint theme that can be put to use immediately. So, download it and address the topic impactfully.
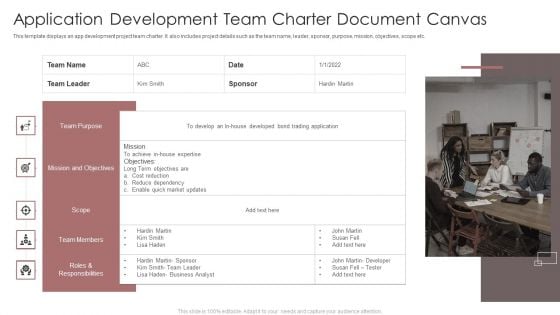
Application Development Team Charter Document Canvas Ppt Summary Infographics PDF
This template displays an app development project team charter. It also includes project details such as the team name, leader, sponsor, purpose, mission, objectives, scope etc. Persuade your audience using this Application Development Team Charter Document Canvas Ppt Summary Infographics PDF. This PPT design covers five stages, thus making it a great tool to use. It also caters to a variety of topics including Leader, Sponsor, Purpose, Mission, Objectives, Scope. Download this PPT design now to present a convincing pitch that not only emphasizes the topic but also showcases your presentation skills.
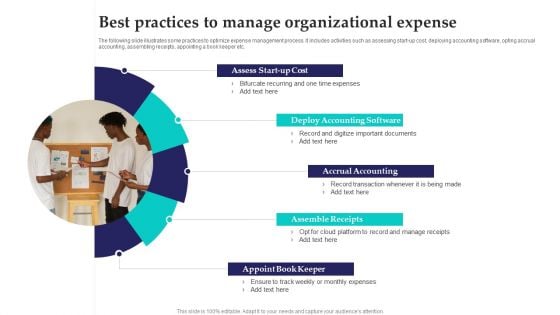
Best Practices To Manage Organizational Expense Infographics PDF
The following slide illustrates some practices to optimize expense management process. It includes activities such as assessing start up cost, deploying accounting software, opting accrual accounting, assembling receipts, appointing a book keeper etc. Presenting Best Practices To Manage Organizational Expense Infographics PDF to dispense important information. This template comprises five stages. It also presents valuable insights into the topics including Deploy Accounting Software, Accrual Accounting, Assemble Receipts. This is a completely customizable PowerPoint theme that can be put to use immediately. So, download it and address the topic impactfully.
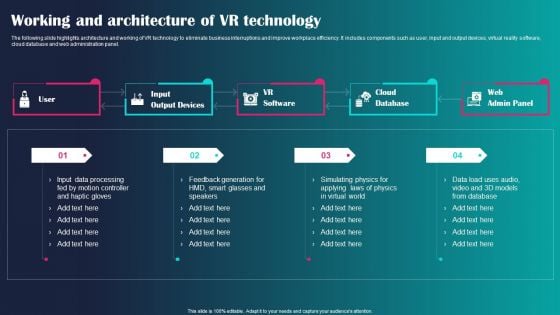
Working And Architecture Of VR Technology Ppt Infographics Samples PDF
The following slide highlights architecture and working of VR technology to eliminate business interruptions and improve workplace efficiency. It includes components such as user, input and output devices, virtual reality software, cloud database and web administration panel. Presenting Working And Architecture Of VR Technology Ppt Infographics Samples PDF to dispense important information. This template comprises four stages. It also presents valuable insights into the topics including Input Output Devices, VR Software, Cloud Database. This is a completely customizable PowerPoint theme that can be put to use immediately. So, download it and address the topic impactfully.
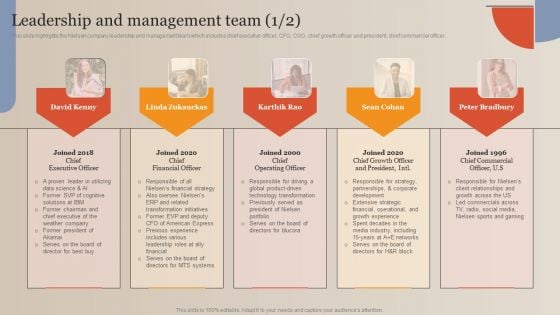
Market Study Company Outline Leadership And Management Team Infographics PDF
This slide highlights the Nielsen company leadership and management team which includes chief executive officer, CFO, COO, chief growth officer and president, chief commercial officer. Slidegeeks is one of the best resources for PowerPoint templates. You can download easily and regulate Market Study Company Outline Leadership And Management Team Infographics PDF for your personal presentations from our wonderful collection. A few clicks is all it takes to discover and get the most relevant and appropriate templates. Use our Templates to add a unique zing and appeal to your presentation and meetings. All the slides are easy to edit and you can use them even for advertisement purposes.
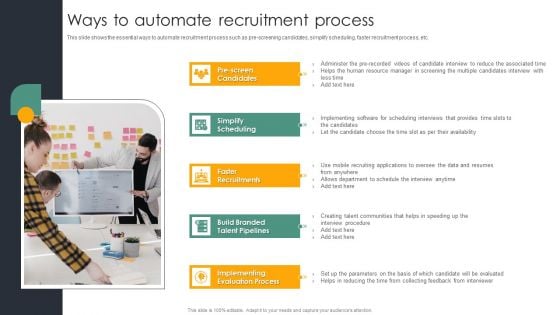
Automating Recruitment Process Ways To Automate Recruitment Process Infographics PDF
This slide shows the essential ways to automate recruitment process such as pre screening candidates, simplify scheduling, faster recruitment process, etc. Slidegeeks is here to make your presentations a breeze with Automating Recruitment Process Ways To Automate Recruitment Process Infographics PDF With our easy to use and customizable templates, you can focus on delivering your ideas rather than worrying about formatting. With a variety of designs to choose from, you are sure to find one that suits your needs. And with animations and unique photos, illustrations, and fonts, you can make your presentation pop. So whether you are giving a sales pitch or presenting to the board, make sure to check out Slidegeeks first.
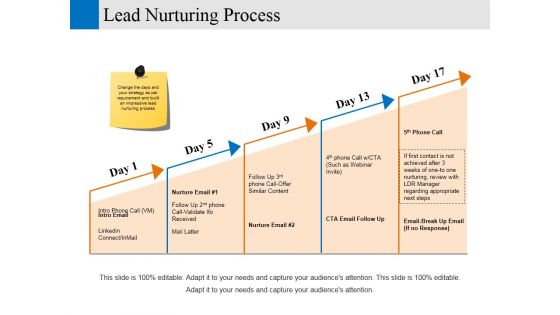
Lead Nurturing Process Ppt PowerPoint Presentation Pictures Infographics
This is a lead nurturing process ppt powerpoint presentation pictures infographics. This is a five stage process. The stages in this process are business, marketing, strategy, growth, analysis.
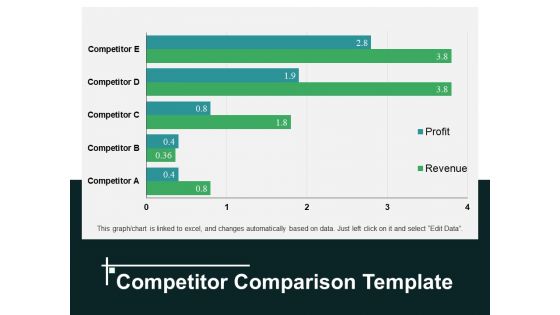
Competitor Comparison Template 1 Ppt PowerPoint Presentation Pictures Infographics
This is a competitor comparison template 1 ppt powerpoint presentation pictures infographics. This is a five stage process. The stages in this process are competitor, profit, revenue.
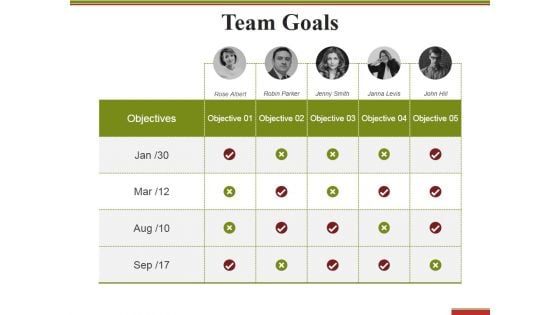
Team Goals Template 2 Ppt PowerPoint Presentation Infographics Structure
This is a team goals template 2 ppt powerpoint presentation infographics structure. This is a five stage process. The stages in this process are objectives, teamwork, table, compare, communication.
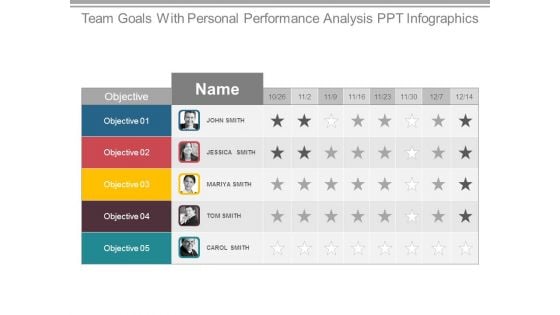
Team Goals With Personal Performance Analysis Ppt Infographics
This is a team goals with personal performance analysis ppt infographics. This is a five stage process. The stages in this process are john smith, jessica smith, mariya smith, tom smith, carol smith.
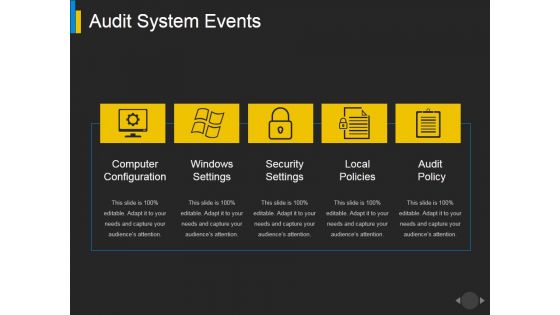
Audit System Events Ppt PowerPoint Presentation Visual Aids Infographics
This is a audit system events ppt powerpoint presentation visual aids infographics. This is a five stage process. The stages in this process are windows settings, security settings, local policies.
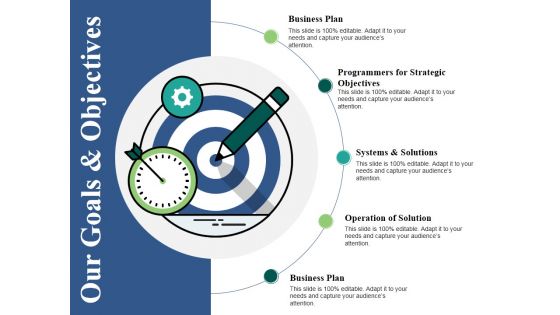
Our Goals And Objectives Ppt PowerPoint Presentation Styles Infographics
This is a our goals and objectives ppt powerpoint presentation styles infographics. This is a five stage process. The stages in this process are business plan, systems and solutions, operation of solution, business plan.
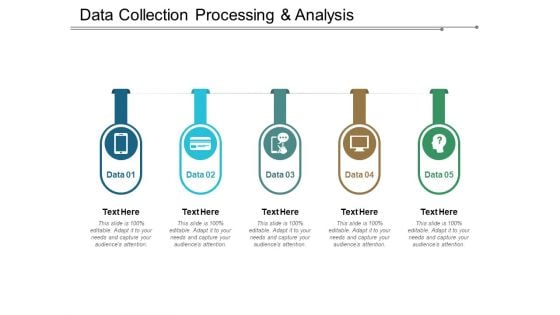
Data Collection Processing And Analysis Ppt PowerPoint Presentation Pictures Infographics
This is a data collection processing and analysis ppt powerpoint presentation pictures infographics. This is a five stage process. The stages in this process are data flow, data management, big data.
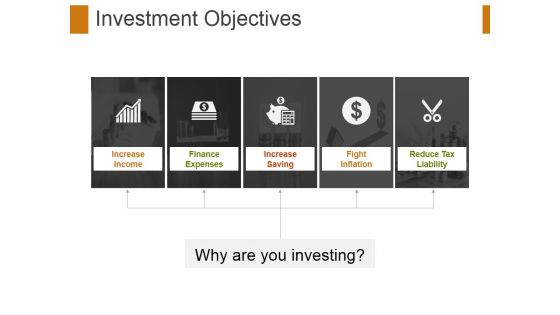
Investment Objectives Ppt PowerPoint Presentation Infographics Graphic Tips
This is a investment objectives ppt powerpoint presentation infographics graphic tips. This is a five stage process. The stages in this process are increase income, finance, finance expenses, increase saving, fight inflation, reduce tax liability.
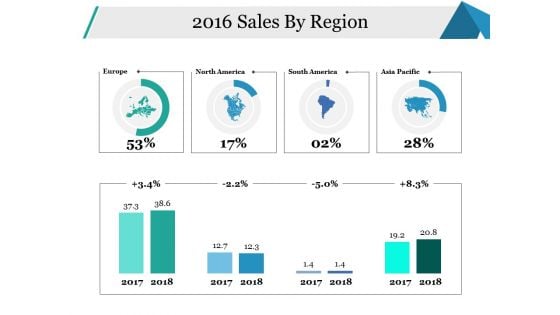
Sales By Region Ppt PowerPoint Presentation Infographics Example
This is a sales by region ppt powerpoint presentation infographics example. This is a five stage process. The stages in this process are europe, north america, south america, asia pacific, business.
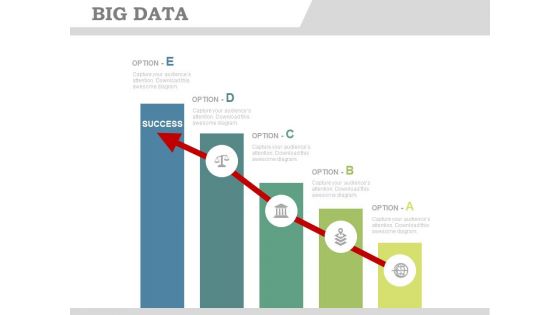
Bar Graph Infographics With Success Arrow Powerpoint Slides
This PowerPoint template has been designed with bar graph with success arrow. You may use this PPT slide to display goal achievement and planning. Impress your audiences by using this PPT slide.
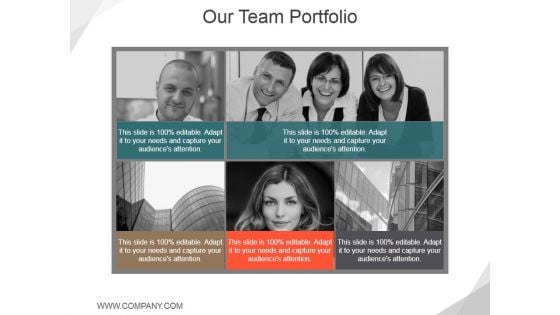
Our Team Portfolio Ppt PowerPoint Presentation Inspiration Infographics
This is a our team portfolio ppt powerpoint presentation inspiration infographics. This is a five stage process. The stages in this process are business, our team, communication, marketing.
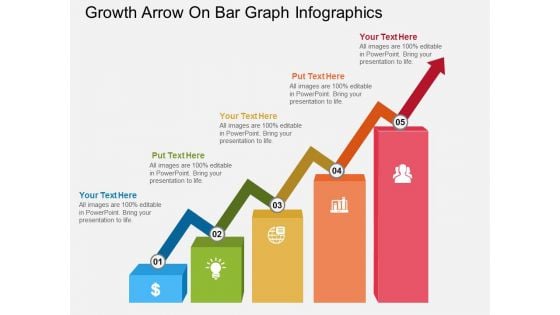
Growth Arrow On Bar Graph Infographics Powerpoint Template
This PowerPoint template has been designed with growth arrow on bar graph. You may download this diagram slide to display growth and progress concepts. Illustrate your plans to your listeners with this impressive template.
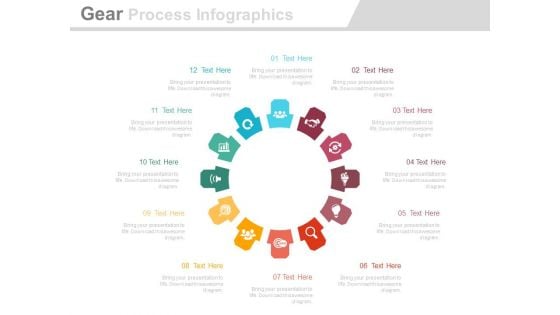
Circular Gear Process Infographics Diagram Powerpoint Template
This business slide contains circular infographic design. This diagram may be used for developing a marketing strategy. Visual effect this slide helps in maintaining the flow of the discussion and provides more clarity to the subject.
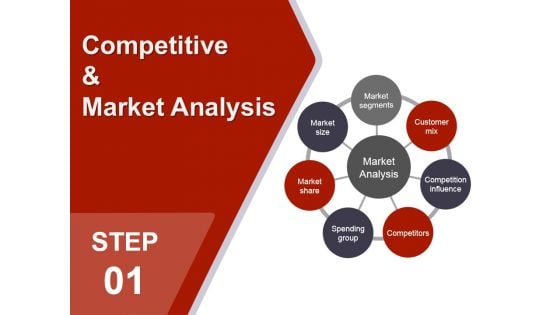
Competitive And Market Analysis Ppt PowerPoint Presentation Infographics Pictures
This is a competitive and market analysis ppt powerpoint presentation infographics pictures. This is a seven stage process. The stages in this process are market size, market segments, customer mix, competition influence, competitors, spending group, market analysis, market share.
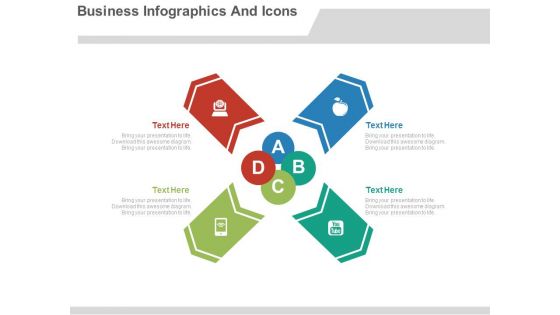
Business Infographics Theme Design Powerpoint Slides
This PPT slide has been designed with circular arrows infographic diagram. This business diagram is suitable for marketing research and analysis. This professional slide helps in making an instant impact on viewers.
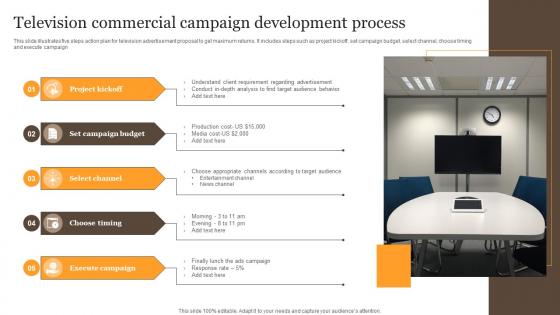
Television Commercial Campaign Development Process Infographics Pdf
This slide illustrates five steps action plan for television advertisement proposal to get maximum returns. It includes steps such as project kickoff, set campaign budget, select channel, choose timing and execute campaign Pitch your topic with ease and precision using this Television Commercial Campaign Development Process Infographics Pdf. This layout presents information on Project Kickoff, Campaign Budget, Select Channel. It is also available for immediate download and adjustment. So, changes can be made in the color, design, graphics or any other component to create a unique layout. This slide illustrates five steps action plan for television advertisement proposal to get maximum returns. It includes steps such as project kickoff, set campaign budget, select channel, choose timing and execute campaign
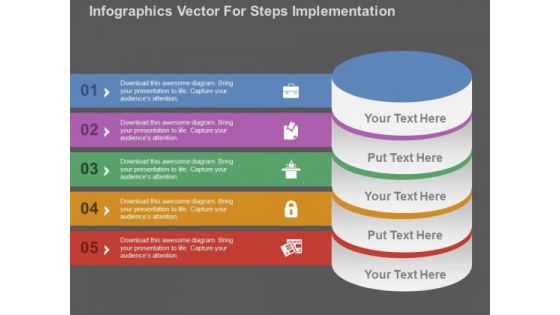
Infographics Vector For Steps Implementation PowerPoint Templates
Our above image has design of five staged infographic chart. This diagram is designed for steps implementation. Add this PowerPoint template in your presentations to visually support your content
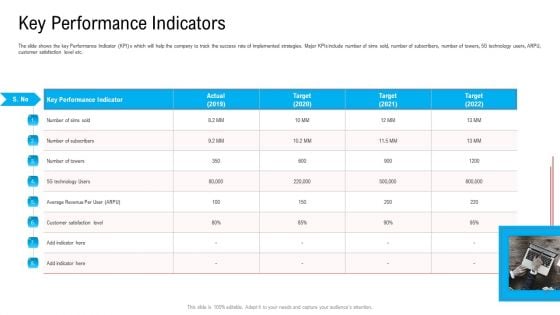
Key Performance Indicators Ppt Infographics Mockup PDF
The slide shows the key Performance Indicator KPI s which will help the company to track the success rate of implemented strategies. Major KPIs include number of sims sold, number of subscribers, number of towers, 5G technology users, ARPU, customer satisfaction level etc. This is a key performance indicators ppt infographics mockup pdf template with various stages. Focus and dispense information on one stage using this creative set, that comes with editable features. It contains large content boxes to add your information on topics like key performance indicator, technology, customer satisfaction level, target, 2019 to 2022. You can also showcase facts, figures, and other relevant content using this PPT layout. Grab it now.
Five Steps Pyramid With Icons Ppt PowerPoint Presentation Infographics Maker
Presenting this set of slides with name five steps pyramid with icons ppt powerpoint presentation infographics maker. This is a five stage process. The stages in this process are 5 key points, strategic management, customer service. This is a completely editable PowerPoint presentation and is available for immediate download. Download now and impress your audience.
Circular Ppt PowerPoint Presentation Infographics Display
This is a circular ppt powerpoint presentation infographics display. This is a four stage process. The stages in this process are circular, business, marketing, process.
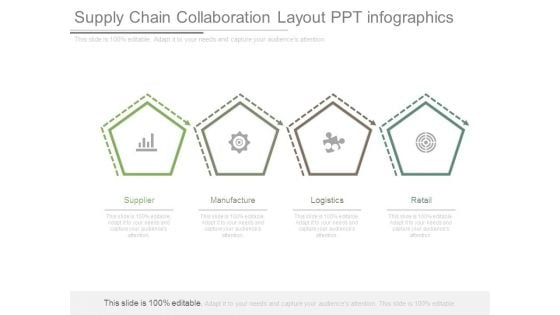
Supply Chain Collaboration Layout Ppt Infographics
This is a supply chain collaboration layout ppt infographics. This is a four stage process. The stages in this process are supplier, manufacture, logistics, retail.
Five Part Communication Technique Icon Infographics PDF
Persuade your audience using this Five Part Communication Technique Icon Infographics PDF. This PPT design covers three stages, thus making it a great tool to use. It also caters to a variety of topics including Five Part Communication, Technique Icon. Download this PPT design now to present a convincing pitch that not only emphasizes the topic but also showcases your presentation skills.
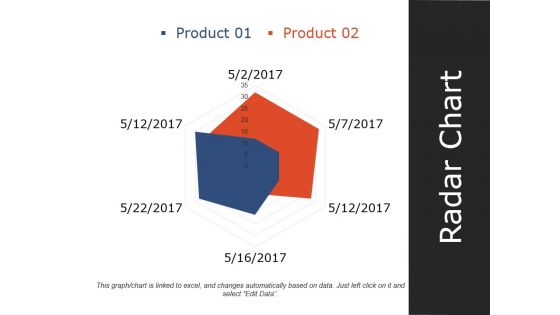
Radar Chart Ppt PowerPoint Presentation Infographics Slideshow
This is a radar chart ppt powerpoint presentation infographics slideshow. This is a two stage process. The stages in this process are product, radar chart, shape, management, marketing.
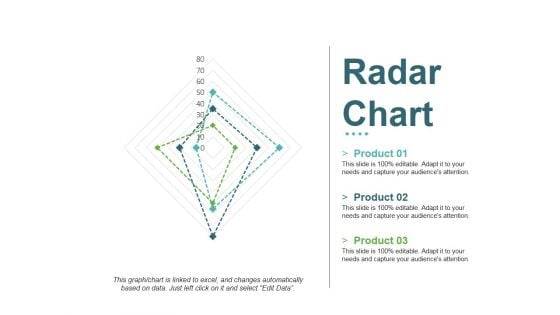
Radar Chart Ppt PowerPoint Presentation Infographics Ideas
This is a radar chart ppt powerpoint presentation infographics ideas. This is a three stage process. The stages in this process are product, business, shapes, marketing, radar chart.
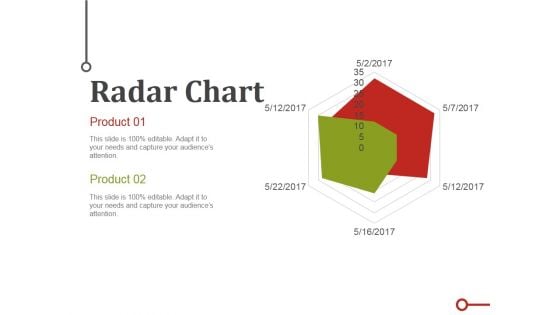
Radar Chart Ppt PowerPoint Presentation Infographics Templates
This is a radar chart ppt powerpoint presentation infographics templates. This is a two stage process. The stages in this process are business, marketing, charts, radar, scatter.
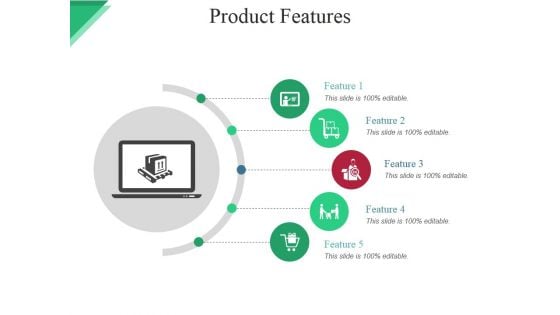
Product Features Ppt PowerPoint Presentation Infographics Microsoft
This is a product features ppt powerpoint presentation infographics microsoft. This is a six stage process. The stages in this process are icons, technology, business, marketing, strategy.
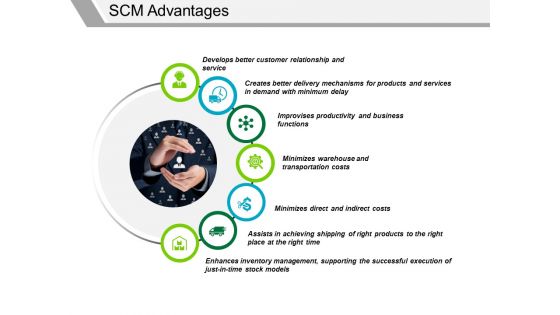
Scm Advantages Ppt PowerPoint Presentation Infographics Aids
This is a scm advantages ppt powerpoint presentation infographics aids. This is a seven stage process. The stages in this process are business, icons, strategy, marketing.

Puzzle Ppt PowerPoint Presentation Infographics Images
This is a puzzle ppt powerpoint presentation infographics images. This is a four stage process. The stages in this process are puzzle, business, marketing, strategy, planning.
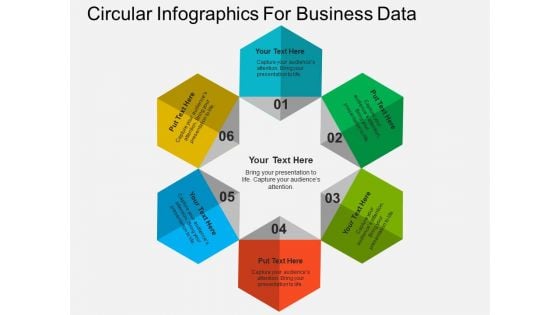
Circular Infographics For Business Data Powerpoint Templates
This PowerPoint diagram slide contains circular infographic. Download this diagram slide to display six steps of business process. You can edit text, color, shade and style of this diagram as per you need.
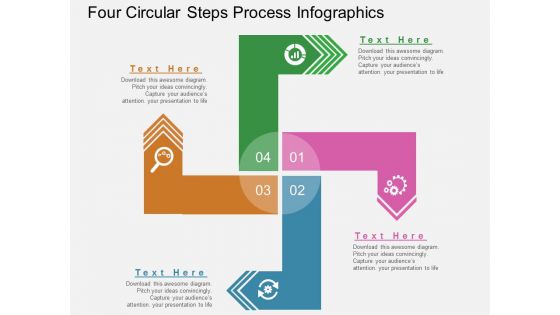
Four Circular Steps Process Infographics Powerpoint Template
This PowerPoint slide contains circular steps process infographic. This professional slide may be used for visual explanation of data. Adjust the above diagram in your business presentations to give professional impact.
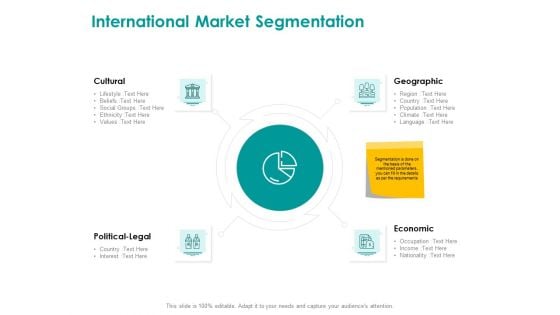
EMM Solution International Market Segmentation Infographics PDF
This is a emm solution international market segmentation infographics pdf template with various stages. Focus and dispense information on four stages using this creative set, that comes with editable features. It contains large content boxes to add your information on topics like international market segmentation, cultural, geographic, economic, political legal. You can also showcase facts, figures, and other relevant content using this PPT layout. Grab it now.
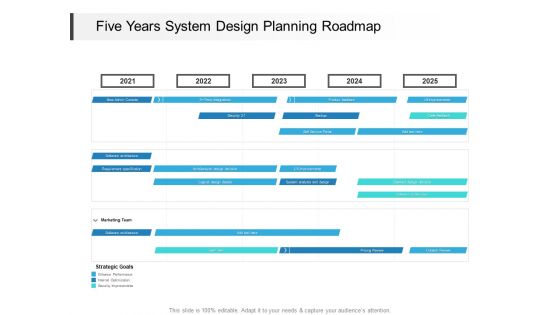
Five Years System Design Planning Roadmap Infographics
Presenting our jaw dropping five years system design planning roadmap infographics. You can alternate the color, font size, font type, and shapes of this PPT layout according to your strategic process. This PPT presentation is compatible with Google Slides and is available in both standard screen and widescreen aspect ratios. You can also download this well researched PowerPoint template design in different formats like PDF, JPG, and PNG. So utilize this visually appealing design by clicking the download button given below.
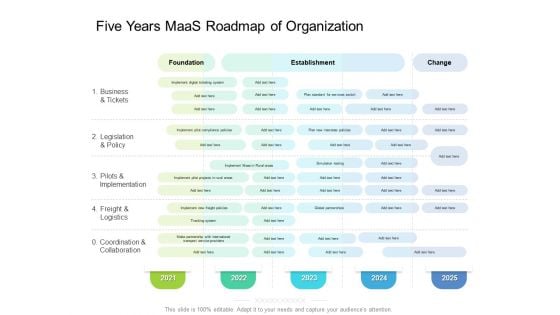
Five Years Maas Roadmap Of Organization Infographics
Introducing our five years maas roadmap of organization infographics. This PPT presentation is Google Slides compatible, therefore, you can share it easily with the collaborators for measuring the progress. Also, the presentation is available in both standard screen and widescreen aspect ratios. So edit the template design by modifying the font size, font type, color, and shapes as per your requirements. As this PPT design is fully editable it can be presented in PDF, JPG and PNG formats.
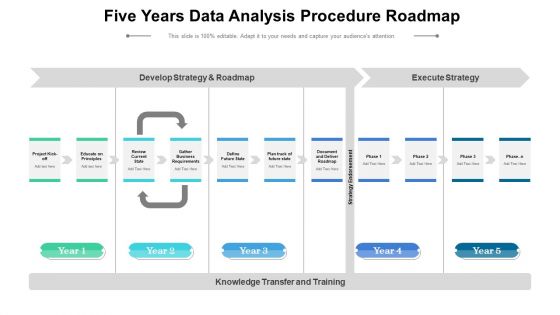
Five Years Data Analysis Procedure Roadmap Infographics
Introducing our five years data analysis procedure roadmap infographics. This PPT presentation is Google Slides compatible, therefore, you can share it easily with the collaborators for measuring the progress. Also, the presentation is available in both standard screen and widescreen aspect ratios. So edit the template design by modifying the font size, font type, color, and shapes as per your requirements. As this PPT design is fully editable it can be presented in PDF, JPG and PNG formats.
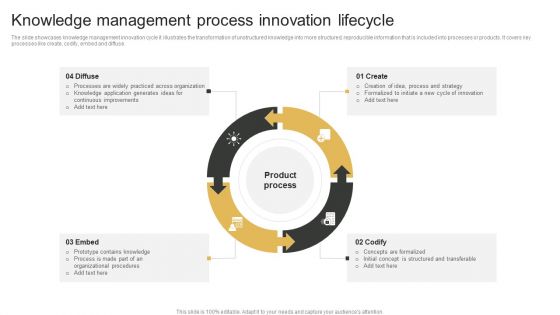
Knowledge Management Process Innovation Lifecycle Infographics PDF
The slide showcases knowledge management innovation cycle it illustrates the transformation of unstructured knowledge into more structured, reproducible information that is included into processes or products. It covers key processes like create, codify, embed and diffuse. Persuade your audience using this Knowledge Management Process Innovation Lifecycle Infographics PDF. This PPT design covers four stages, thus making it a great tool to use. It also caters to a variety of topics including Create, Codify, Embed. Download this PPT design now to present a convincing pitch that not only emphasizes the topic but also showcases your presentation skills.
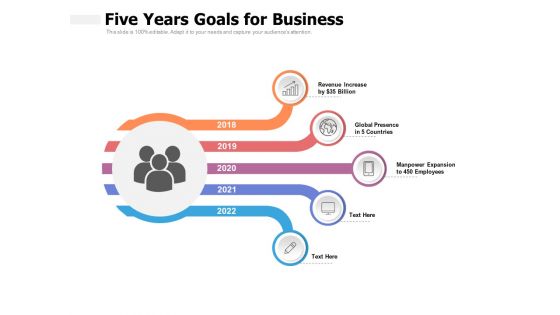
Five Years Goals For Business Ppt PowerPoint Presentation Infographics Layouts
Presenting this set of slides with name five years goals for business ppt powerpoint presentation infographics layouts. This is a five stage process. The stages in this process are revenue increase, global presence in 5 countries, manpower expansion to 450 employees, 2018 to 2022. This is a completely editable PowerPoint presentation and is available for immediate download. Download now and impress your audience.

Circular Business Process Flow Infographics Powerpoint Template
This PowerPoint template has been designed with graphic of four arrows in circular flow. This professional slide helps to present business flow, strategy and management. Define your ideas with this slide.
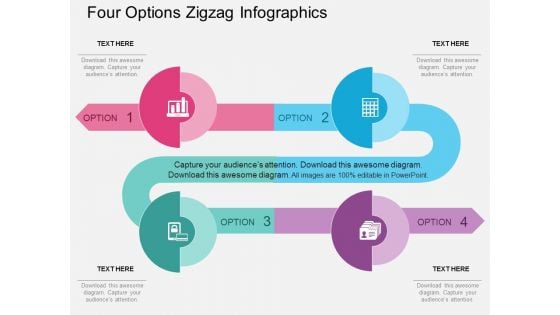
Four Options Zigzag Infographics Powerpoint Template
Emphatically define your message with our above template which contains four options zigzag infographic. This business diagram may be used to plot data series. Deliver amazing presentations to mesmerize your audience.
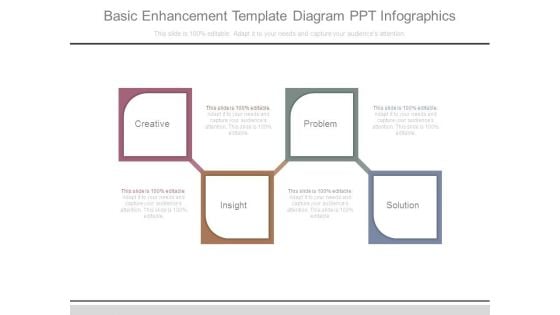
Basic Enhancement Template Diagram Ppt Infographics
This is a basic enhancement template diagram ppt infographics. This is a four stage process. The stages in this process are creative, problem, insight, solution.
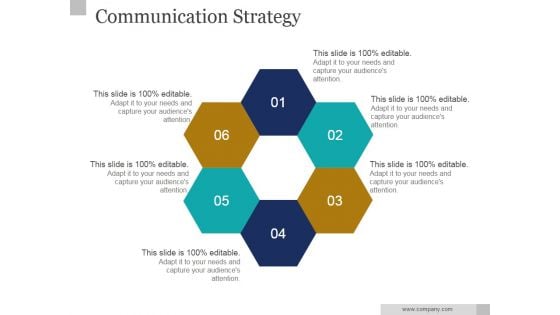
Communication Strategy Ppt PowerPoint Presentation Infographics
This is a communication strategy ppt powerpoint presentation infographics. This is a six stage process. The stages in this process are business, marketing, diagram, presentation.

Business Process Improvement Ppt PowerPoint Presentation Infographics Ideas
Presenting this set of slides with name business process improvement ppt powerpoint presentation infographics ideas. This is a five stage process. The stages in this process are 5 stages continuous improvement process, business process improvement. This is a completely editable PowerPoint presentation and is available for immediate download. Download now and impress your audience.
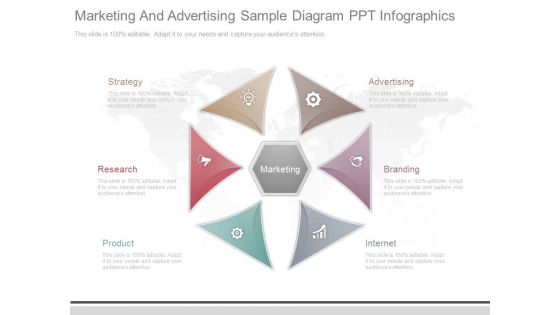
Marketing And Advertising Sample Diagram Ppt Infographics
This is a marketing and advertising sample diagram ppt infographics. This is a six stage process. The stages in this process are marketing, strategy, research, product, advertising, branding, internet.
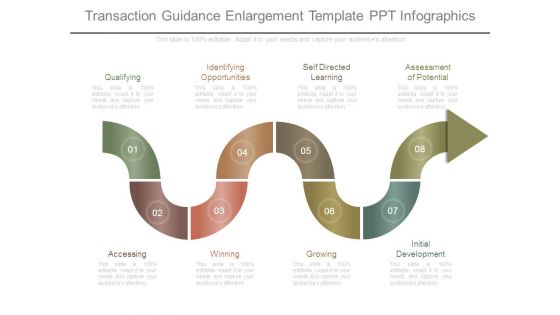
Transaction Guidance Enlargement Template Ppt Infographics
This is a transaction guidance enlargement template ppt infographics. This is a eight stage process. The stages in this process are qualifying, accessing, identifying opportunities, winning, self directed learning, growing, assessment of potential, initial development.
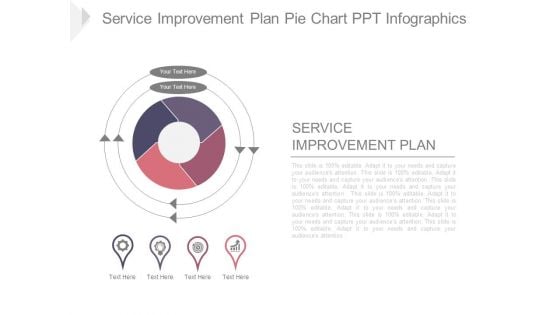
Service Improvement Plan Pie Chart Ppt Infographics
This is a service improvement plan pie chart ppt infographics. This is a four stage process. The stages in this process are service improvement plan, business, strategy, marketing, management.
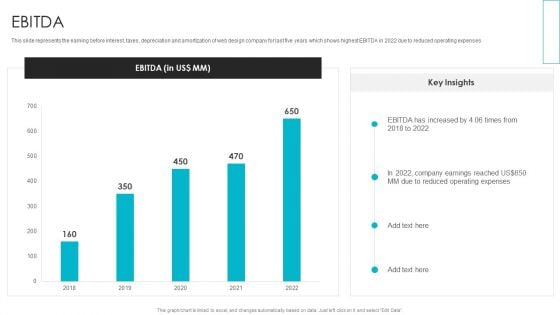
Web Design Company Overview EBITDA Infographics PDF
This slide represents the earning before interest, taxes, depreciation and amortization of web design company for last five years which shows highest EBITDA in 2022 due to reduced operating expenses. Here you can discover an assortment of the finest PowerPoint and Google Slides templates. With these templates, Web Design Company Overview EBITDA Infographics PDF can create presentations for a variety of purposes while simultaneously providing your audience with an eye catching visual experience. Download Web Design Company Overview EBITDA Infographics PDF to deliver an impeccable presentation. These templates will make your job of preparing presentations much quicker, yet still, maintain a high level of quality. Slidegeeks has experienced researchers who prepare these templates and write high quality content for you. Later on, you can personalize the content by editing the Web Design Company Overview EBITDA Infographics PDF.
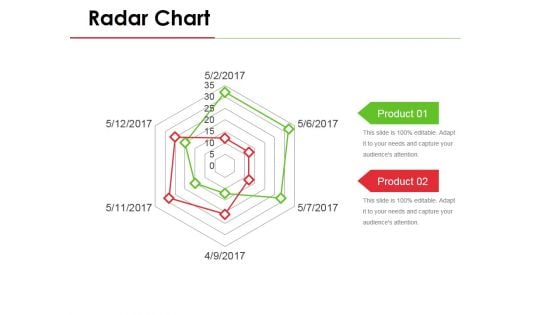
Radar Chart Ppt PowerPoint Presentation Styles Infographics
This is a radar chart ppt powerpoint presentation styles infographics. This is a six stage process. The stages in this process are business, marketing, product, radar chart, strategy.
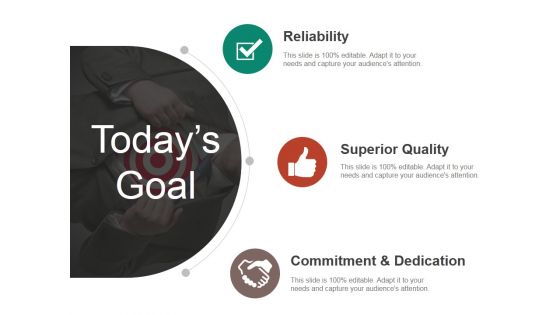
Todays Goal Ppt PowerPoint Presentation Show Infographics
This is a todays goal ppt powerpoint presentation show infographics. This is a three stage process. The stages in this process are reliability, superior quality, commitment and dedication.
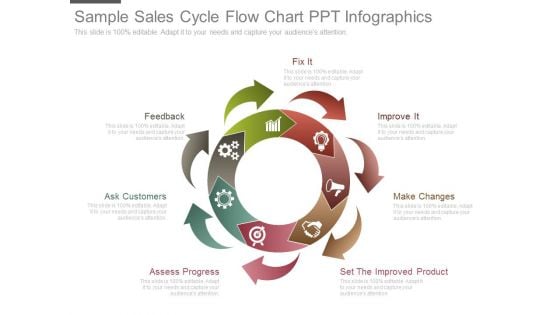
Sample Sales Cycle Flow Chart Ppt Infographics
This is a sample sales cycle flow chart ppt infographics. This is a seven stage process. The stages in this process are fix it, feedback, ask customers, assess progress, set the improved product, make changes, improve it.
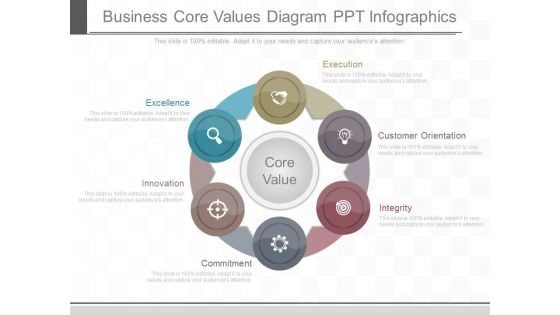
Business Core Values Diagram Ppt Infographics
This is a business core values diagram ppt infographics. This is a six stage process. The stages in this process are execution, customer orientation, integrity, commitment, innovation, excellence, core value.


 Continue with Email

 Home
Home


