5 Circle Infographic
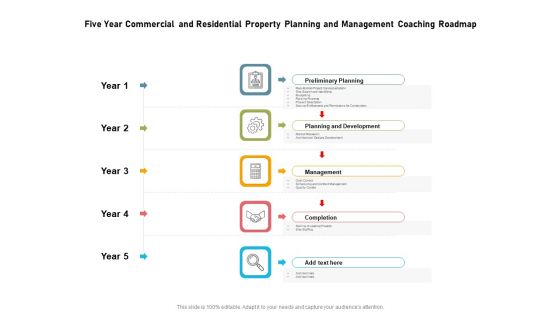
Five Year Commercial And Residential Property Planning And Management Coaching Roadmap Infographics
Introducing our five year commercial and residential property planning and management coaching roadmap infographics. This PPT presentation is Google Slides compatible, therefore, you can share it easily with the collaborators for measuring the progress. Also, the presentation is available in both standard screen and widescreen aspect ratios. So edit the template design by modifying the font size, font type, color, and shapes as per your requirements. As this PPT design is fully editable it can be presented in PDF, JPG and PNG formats.
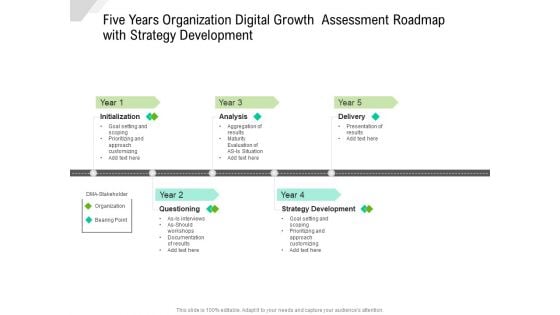
Five Years Organization Digital Growth Assessment Roadmap With Strategy Development Infographics
Presenting the five years organization digital growth assessment roadmap with strategy development infographics. The template includes a roadmap that can be used to initiate a strategic plan. Not only this, the PowerPoint slideshow is completely editable and you can effortlessly modify the font size, font type, and shapes according to your needs. This PPT slide can be easily reached in standard screen and widescreen aspect ratios. The set is also available in various formats like PDF, PNG, and JPG. So download and use it multiple times as per your knowledge.
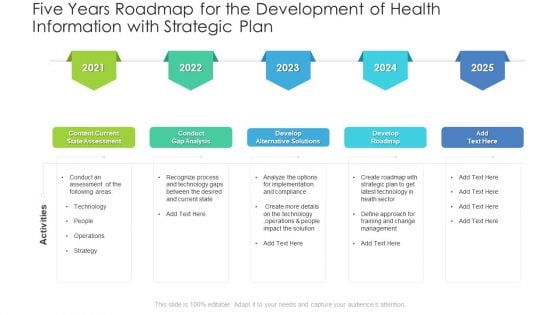
Five Years Roadmap For The Development Of Health Information With Strategic Plan Infographics
Presenting the five years roadmap for the development of health information with strategic plan infographics. The template includes a roadmap that can be used to initiate a strategic plan. Not only this, the PowerPoint slideshow is completely editable and you can effortlessly modify the font size, font type, and shapes according to your needs. This PPT slide can be easily reached in standard screen and widescreen aspect ratios. The set is also available in various formats like PDF, PNG, and JPG. So download and use it multiple times as per your knowledge.
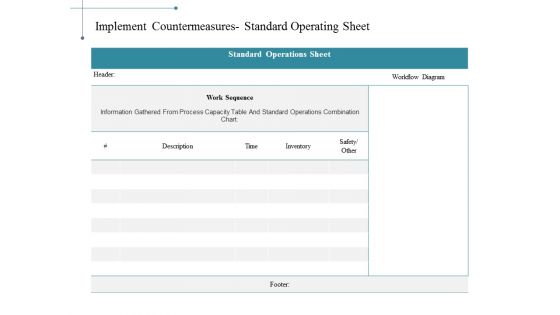
Implement Countermeasures Standard Operating Sheet Ppt PowerPoint Presentation Visual Aids Infographics
This is a implement countermeasures standard operating sheet ppt powerpoint presentation visual aids infographics. This is a five stage process. The stages in this process are tables, marketing, strategy, finance, analysis.
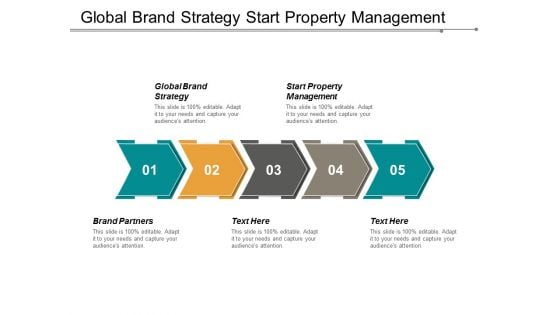
Global Brand Strategy Start Property Management Brand Partners Ppt PowerPoint Presentation Infographics Master Slide
This is a global brand strategy start property management brand partners ppt powerpoint presentation infographics. This is a five stage process. The stages in this process are global brand strategy, start property management, brand partners.
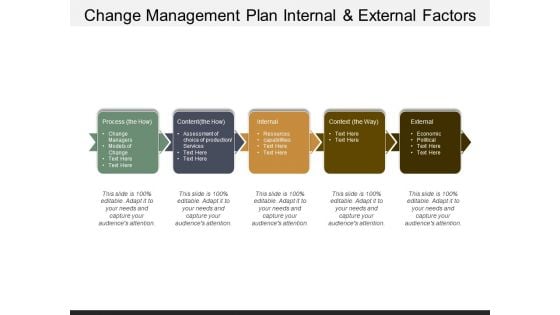
Change Management Plan Internal And External Factors Ppt Powerpoint Presentation Professional Infographics
This is a change management plan internal and external factors ppt powerpoint presentation professional infographics. This is a five stage process. The stages in this process are change strategy, change plan, change approach.
Summary Report With Checklist And Magnifying Glass Ppt Powerpoint Presentation Gallery Infographics
This is a summary report with checklist and magnifying glass ppt powerpoint presentation gallery infographics. This is a five stage process. The stages in this process are executive summary, analysis summary, review summary.
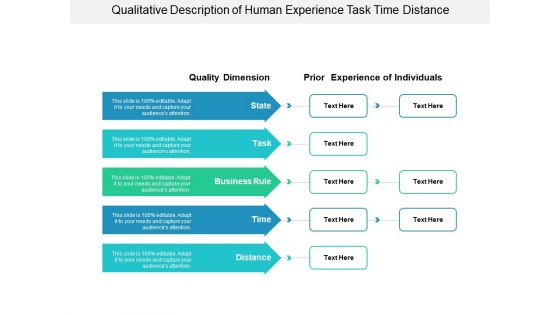
Qualitative Description Of Human Experience Task Time Distance Ppt PowerPoint Presentation Visual Aids Infographics
This is a qualitative description of human experience task time distance ppt powerpoint presentation visual aids infographics. This is a five stage process. The stages in this process are analysis, observation, qualitative.
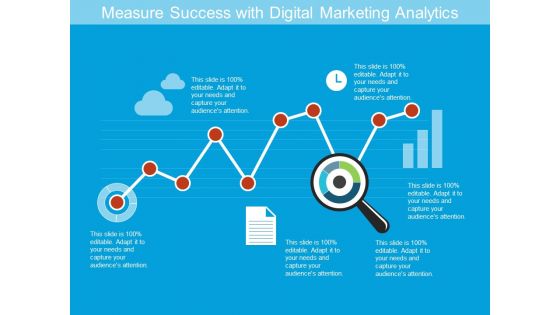
Measure Success With Digital Marketing Analytics Ppt PowerPoint Presentation Gallery Infographics
This is a measure success with digital marketing analytics ppt powerpoint presentation gallery infographics. This is a five stage process. The stages in this process are digital analytics, digital dashboard, marketing.
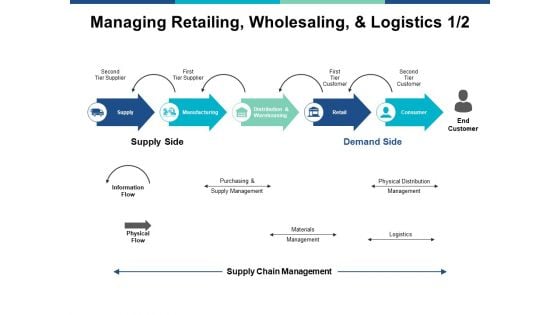
Managing Retailing Wholesaling And Logistics Marketing Ppt PowerPoint Presentation Model Infographics
This is a managing retailing wholesaling and logistics marketing ppt powerpoint presentation model infographics. This is a five stage process. The stages in this process are marketing, business, management, planning, strategy.
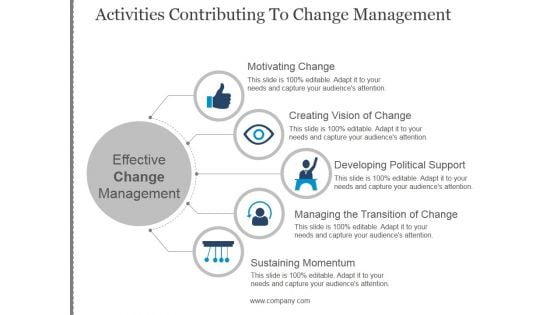
Activities Contributing To Change Management Template 2 Ppt PowerPoint Presentation Infographics
This is a activities contributing to change management template 2 ppt powerpoint presentation infographics. This is a five stage process. The stages in this process are sustaining momentum, managing the transition of change, developing political support, motivating change, creating vision of change, effective change management.
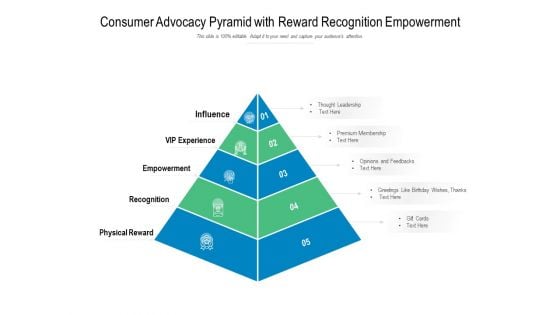
Consumer Advocacy Pyramid With Reward Recognition Empowerment Ppt PowerPoint Presentation Styles Infographics
Presenting this set of slides with name consumer advocacy pyramid with reward recognition empowerment ppt powerpoint presentation styles infographics. This is a five stage process. The stages in this process are influence, vip experience, empowerment, recognition, physical reward. This is a completely editable PowerPoint presentation and is available for immediate download. Download now and impress your audience.
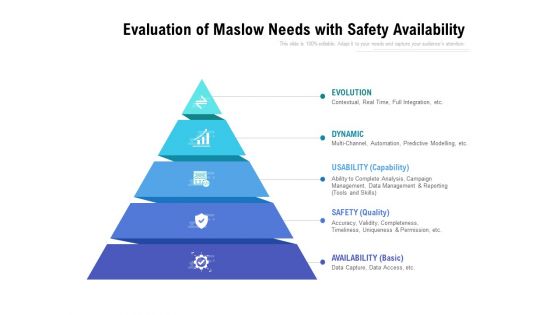
Evaluation Of Maslow Needs With Safety Availability Ppt PowerPoint Presentation Professional Infographics
Presenting this set of slides with name evaluation of maslow needs with safety availability ppt powerpoint presentation professional infographics. This is a five stage process. The stages in this process are evolution, dynamic, usability, safety, availability. This is a completely editable PowerPoint presentation and is available for immediate download. Download now and impress your audience.
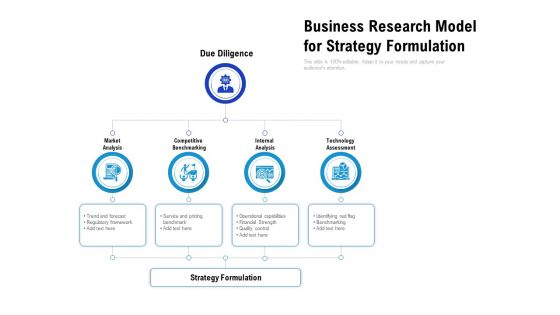
Business Research Model For Strategy Formulation Ppt PowerPoint Presentation Slides Infographics
Presenting this set of slides with name business research model for strategy formulation ppt powerpoint presentation slides infographics. This is a five stage process. The stages in this process are due diligence, market analysis, competitive benchmarking, internal analysis, technology assessment, strategy formulation. This is a completely editable PowerPoint presentation and is available for immediate download. Download now and impress your audience.
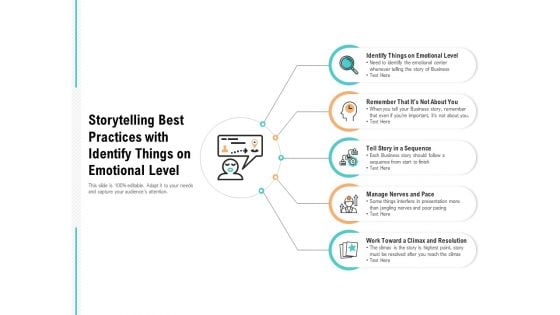
Storytelling Best Practices With Identify Things On Emotional Level Ppt PowerPoint Presentation Professional Infographics
Presenting this set of slides with name storytelling best practices with identify things on emotional level ppt powerpoint presentation professional infographics. This is a five stage process. The stages in this process are identify things on emotional level, remember that its not about you, tell story in a sequence, manage nerves and pace, work toward a climax and resolution. This is a completely editable PowerPoint presentation and is available for immediate download. Download now and impress your audience.
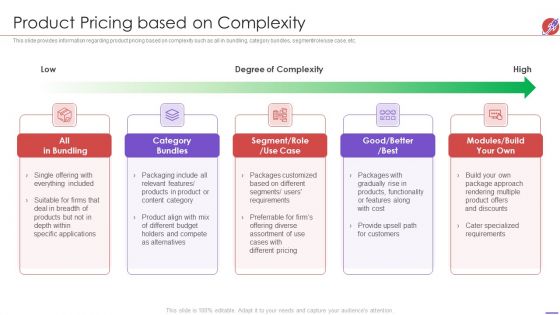
New Product Development And Launch To Market Product Pricing Based On Complexity Infographics PDF
This slide provides information regarding product pricing based on complexity such as all in bundling, category bundles, segmen role use case, etc. Presenting new product development and launch to market product pricing based on complexity elements pdf to provide visual cues and insights. Share and navigate important information on five stages that need your due attention. This template can be used to pitch topics like bundling, category, segment, modules . In addtion, this PPT design contains high resolution images, graphics, etc, that are easily editable and available for immediate download.
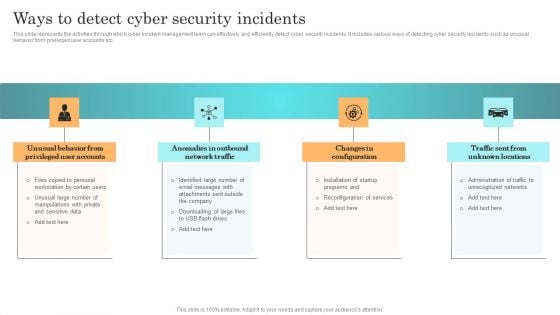
Incident Response Techniques Deployement Ways To Detect Cyber Security Incidents Infographics PDF
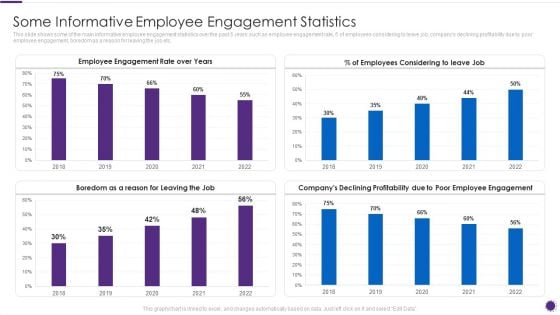
Complete Guide For Total Employee Involvement Strategic Approach Some Informative Employee Infographics PDF
This slide shows some of the main informative employee engagement statistics over the past 5 years such as employee engagement rate, 5 of employees considering to leave job, companys declining profitability due to poor employee engagement, boredom as a reason for leaving the job etc. Deliver and pitch your topic in the best possible manner with this Complete Guide For Total Employee Involvement Strategic Approach Some Informative Employee Infographics PDF Use them to share invaluable insights on Employee Engagement, Employees Considering, Declining Profitibility and impress your audience. This template can be altered and modified as per your expectations. So, grab it now.

Use Of A Component Based Architecture In RUP Model Ppt Infographics Slides PDF
This slide depicts the use of a component-based architecture with the Rational Unified Process Model using components such as CORBA and component object model. Presenting use of a component based architecture in rup model ppt infographics slides pdf to provide visual cues and insights. Share and navigate important information on five stages that need your due attention. This template can be used to pitch topics like infrastructures, resources, location, developing. In addtion, this PPT design contains high resolution images, graphics, etc, that are easily editable and available for immediate download.
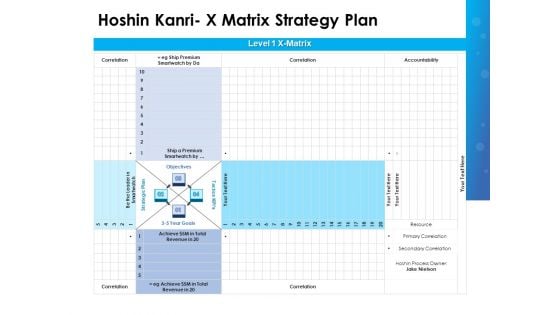
Hoshin Policy Deployment Strategic Planning Hoshin Kanri X Matrix Strategy Plan Infographics PDF
Presenting this set of slides with name hoshin policy deployment strategic planning hoshin kanri x matrix strategy plan infographics pdf. The topics discussed in these slides are objectives, tactics kpis, strategic plan, 3 to 5 year goals. This is a completely editable PowerPoint presentation and is available for immediate download. Download now and impress your audience.
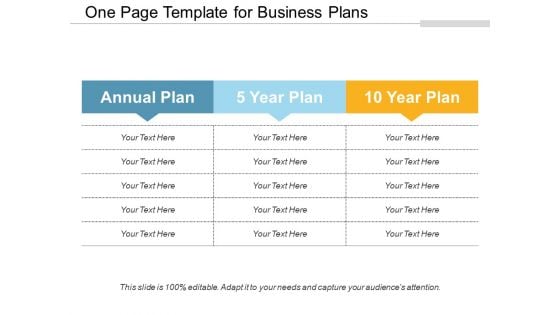
One Page Template For Business Plans Ppt PowerPoint Presentation Infographics Designs Download PDF
Presenting this set of slides with name one page template for business plans ppt powerpoint presentation infographics designs download pdf. The topics discussed in these slide is annual plan, 5 year plan, 10 year plan. This is a completely editable PowerPoint presentation and is available for immediate download. Download now and impress your audience.
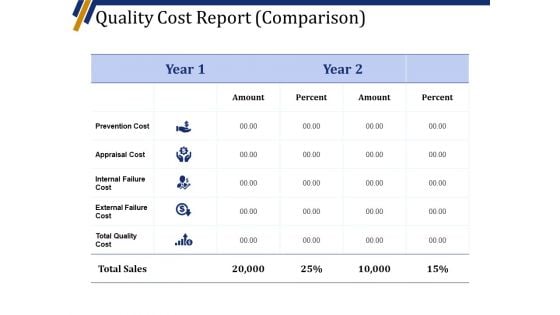
Quality Cost Report Comparison Template 1 Ppt PowerPoint Presentation Pictures Infographics
This is a quality cost report comparison template 1 ppt powerpoint presentation pictures infographics. This is a five stage process. The stages in this process are amount, percent, year, appraisal cost, prevention cost.
Makeup And Skincare Brand What Makes Our Product Stand Out From The Crowd Ppt Icon Infographics PDF
This slide illustrates the production distinctions of XYZ beauty brand which includes dermatologist tested, fair trade, certified, etc. This is a Makeup And Skincare Brand What Makes Our Product Stand Out From The Crowd Ppt Icon Infographics PDF template with various stages. Focus and dispense information on three stages using this creative set, that comes with editable features. It contains large content boxes to add your information on topics like Dermatologist Tested, Prescription Strength, Beauty Organic. You can also showcase facts, figures, and other relevant content using this PPT layout. Grab it now.
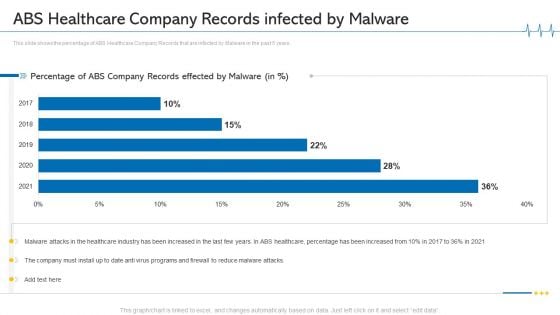
ABS Healthcare Company Records Infected By Malware Ppt File Infographics PDF
This slide shows the percentage of ABS Healthcare Company Records that are infected by Malware in the past 5 years. Deliver an awe inspiring pitch with this creative ABS healthcare company records infected by malware ppt file infographics pdf bundle. Topics like ABS healthcare company records infected by malware, 2017 to 2021 can be discussed with this completely editable template. It is available for immediate download depending on the needs and requirements of the user.
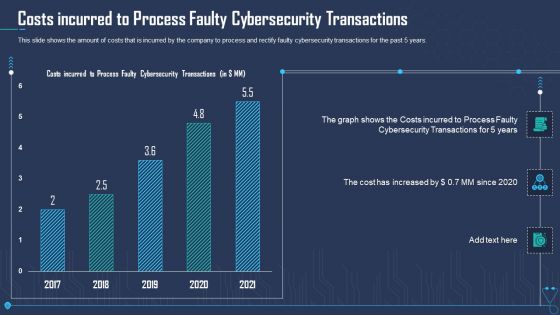
Costs Incurred To Process Faulty Cybersecurity Transactions Ppt Infographics Smartart PDF
This slide shows the amount of costs that is incurred by the company to process and rectify faulty cybersecurity transactions for the past 5 years. Deliver an awe inspiring pitch with this creative costs incurred to process faulty cybersecurity transactions ppt infographics smartart pdf bundle. Topics like costs incurred to process faulty cybersecurity transactions can be discussed with this completely editable template. It is available for immediate download depending on the needs and requirements of the user.
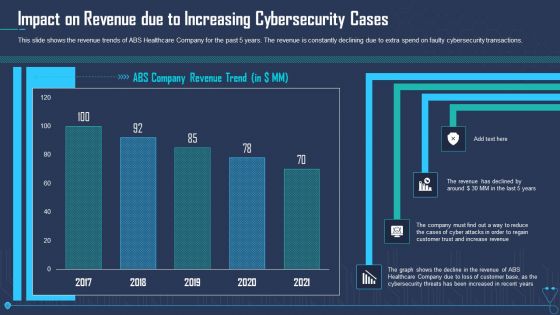
Impact On Revenue Due To Increasing Cybersecurity Cases Ppt Inspiration Infographics PDF
This slide shows the revenue trends of ABS Healthcare Company for the past 5 years. The revenue is constantly declining due to extra spend on faulty cybersecurity transactions. Deliver an awe inspiring pitch with this creative impact on revenue due to increasing cybersecurity cases ppt inspiration infographics pdf bundle. Topics like impact on revenue due to increasing cybersecurity cases can be discussed with this completely editable template. It is available for immediate download depending on the needs and requirements of the user.
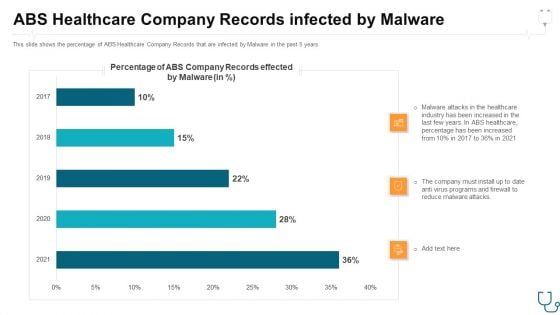
Abs Healthcare Company Records Infected By Malware Ppt Infographics Rules PDF
This slide shows the percentage of ABS Healthcare Company Records that are infected by Malware in the past 5 years. Deliver an awe-inspiring pitch with this creative abs healthcare company records infected by malware ppt infographics rules pdf. bundle. Topics like abs healthcare company records infected by malware can be discussed with this completely editable template. It is available for immediate download depending on the needs and requirements of the user.
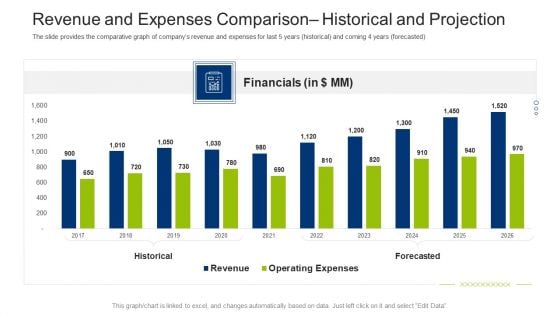
Investment Fundraising Pitch Deck From Stock Market Revenue And Expenses Comparison Historical And Projection Infographics PDF
The slide provides the comparative graph of companys revenue and expenses for last 5 years historical and coming 4 years forecasted. Deliver an awe inspiring pitch with this creative investment fundraising pitch deck from stock market revenue and expenses comparison historical and projection infographics pdf bundle. Topics like financials, historical, forecasted, revenue, expenses can be discussed with this completely editable template. It is available for immediate download depending on the needs and requirements of the user.
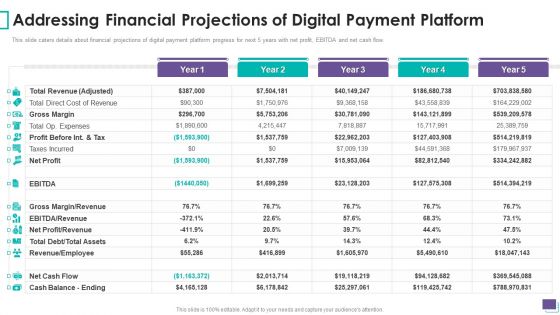
Payment Gateway Firm Addressing Financial Projections Of Digital Payment Platform Infographics PDF
This slide caters details about financial projections of digital payment platform progress for next 5 years with net profit, EBITDA and net cash flow. Deliver an awe inspiring pitch with this creative Payment Gateway Firm Addressing Financial Projections Of Digital Payment Platform Infographics PDF bundle. Topics like Gross Margin, Profit Before, Net Profit, Employee can be discussed with this completely editable template. It is available for immediate download depending on the needs and requirements of the user.
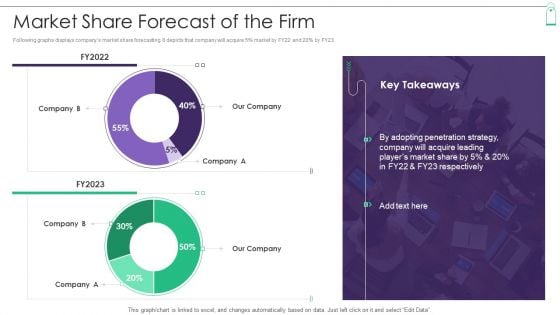
New Product Sales Strategy And Marketing Market Share Forecast Of The Firm Infographics PDF
Following graphs displays companys market share forecasting. It depicts that company will acquire 5 percent market by FY22 and 20 percent by FY23. Deliver and pitch your topic in the best possible manner with this New Product Sales Strategy And Marketing Market Share Forecast Of The Firm Infographics PDF. Use them to share invaluable insights on Market Share Forecast and impress your audience. This template can be altered and modified as per your expectations. So, grab it now.

How To Create A Customer Experience CX Strategythe Principles Of Service Design Infographics PDF
Every service needs to have a holistic service blueprint. For it to be successful, here are the 5 core principles that every business should follow.Deliver an awe inspiring pitch with this creative How To Create A Customer Experience CX Strategythe Principles Of Service Design Infographics PDF bundle. Topics like Sequence Interrelated, Entire Environment, Intangible Services can be discussed with this completely editable template. It is available for immediate download depending on the needs and requirements of the user.
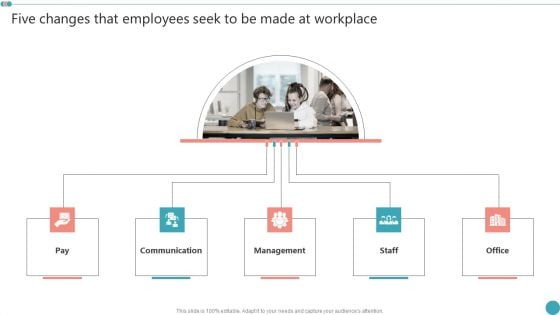
Five Changes That Employees Seek To Be Made At Workplace Employee Engagement HR Strategy At Organization Infographics PDF
Retrieve professionally designed Five Changes That Employees Seek To Be Made At Workplace Employee Engagement HR Strategy At Organization Infographics PDF to effectively convey your message and captivate your listeners. Save time by selecting pre-made slideshows that are appropriate for various topics, from business to educational purposes. These themes come in many different styles, from creative to corporate, and all of them are easily adjustable and can be edited quickly. Access them as PowerPoint templates or as Google Slides themes. You do not have to go on a hunt for the perfect presentation because Slidegeeks got you covered from everywhere.
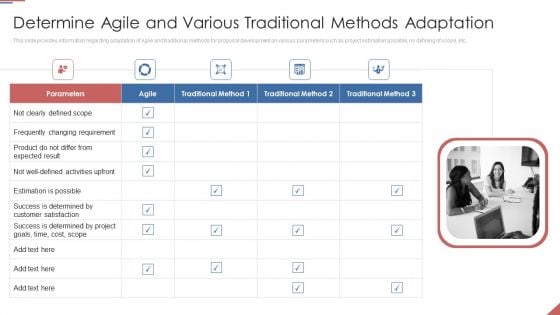
Formulating Plan And Executing Bid Projects Using Agile IT Determine Agile And Various Traditional Methods Adaptation Infographics PDF
This slide provides information regarding adaptation of Agile and traditional methods for proposal development on various parameters such as project estimation possible, no defining of scope, etc. This is a formulating plan and executing bid projects using agile it determine agile and various traditional methods adaptation infographics pdf template with various stages. Focus and dispense information on five stages using this creative set, that comes with editable features. It contains large content boxes to add your information on topics like determine agile and various traditional methods adaptation. You can also showcase facts, figures, and other relevant content using this PPT layout. Grab it now.
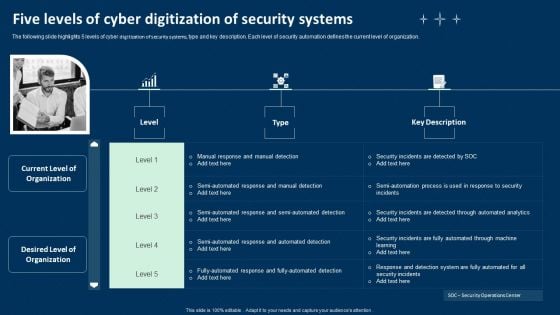
Five Levels Of Cyber Digitization Of Security Systems Ppt Infographics Graphics Tutorials PDF
The following slide highlights 5 levels of cyber digitization of security systems, type and key description. Each level of security automation defines the current level of organization. Presenting Five Levels Of Cyber Digitization Of Security Systems Ppt Infographics Graphics Tutorials PDF to dispense important information. This template comprises three stages. It also presents valuable insights into the topics including Investigating Steps, Security Analysts, Determining Responsive Action. This is a completely customizable PowerPoint theme that can be put to use immediately. So, download it and address the topic impactfully.
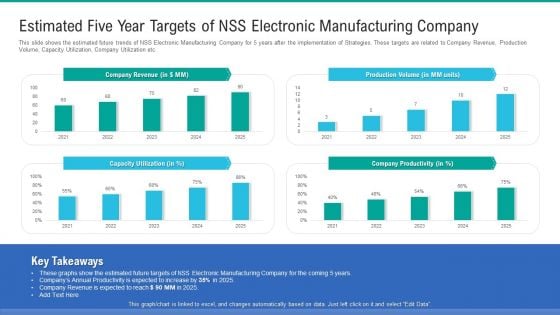
Estimated Five Year Targets Of NSS Electronic Manufacturing Company Infographics PDF
This slide shows the estimated future trends of NSS Electronic Manufacturing Company for 5 years after the implementation of Strategies. These targets are related to Company Revenue, Production Volume, Capacity Utilization, Company Utilization etc. Deliver an awe inspiring pitch with this creative estimated five year targets of nss electronic manufacturing company infographics pdf bundle. Topics like estimated five year targets of nss electronic manufacturing company can be discussed with this completely editable template. It is available for immediate download depending on the needs and requirements of the user.
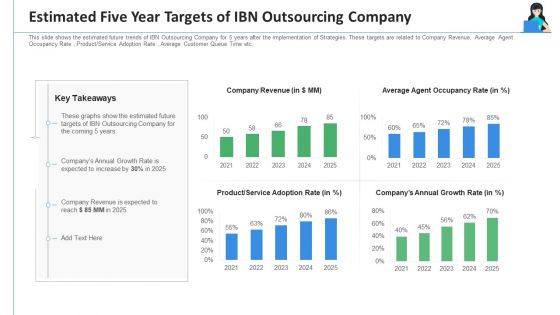
Estimated Five Year Targets Of IBN Outsourcing Company Ppt Infographics Demonstration PDF
This slide shows the estimated future trends of IBN Outsourcing Company for 5 years after the implementation of Strategies. These targets are related to Company Revenue, Average Agent Occupancy Rate , Product Service Adoption Rate , Average Customer Queue Time etc. Deliver and pitch your topic in the best possible manner with this estimated five year targets of IBN outsourcing company ppt infographics demonstration pdf. Use them to share invaluable insights on company revenue, product service, companys annual growth rate and impress your audience. This template can be altered and modified as per your expectations. So, grab it now.
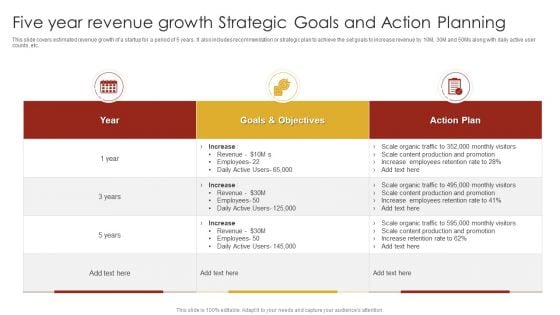
Five Year Revenue Growth Strategic Goals And Action Planning Infographics PDF
This slide covers estimated revenue growth of a startup for a period of 5 years. It also includes recommendation or strategic plan to achieve the set goals to increase revenue by 10M, 30M and 50Ms along with daily active user counts, etc. Showcasing this set of slides titled Five Year Revenue Growth Strategic Goals And Action Planning Infographics PDF. The topics addressed in these templates are Revenue, Employees, Scale Organic. All the content presented in this PPT design is completely editable. Download it and make adjustments in color, background, font etc. as per your unique business setting.
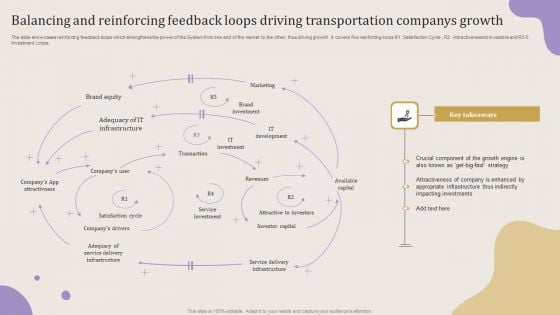
Balancing And Reinforcing Feedback Loops Driving Transportation Companys Growth Infographics PDF
The slide showcases reinforcing feedback loops which strengthens the power of the System from one end of the market to the other, thus driving growth. It covers five reinforcing loops R1 Satisfaction Cycle, R2 Attractiveness to Investors and R3 5 Investment Loops. Showcasing this set of slides titled Balancing And Reinforcing Feedback Loops Driving Transportation Companys Growth Infographics PDF. The topics addressed in these templates are Marketing, Brand Equity, Brand Investment. All the content presented in this PPT design is completely editable. Download it and make adjustments in color, background, font etc. as per your unique business setting.
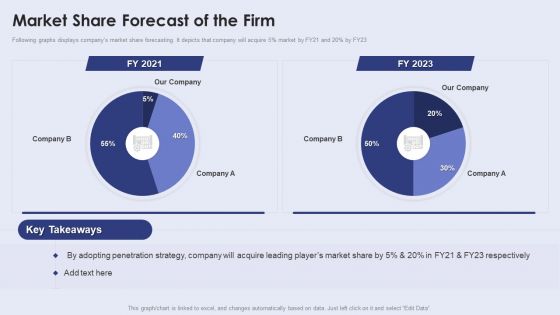
Creating New Product Launch Campaign Strategy Market Share Forecast Of The Firm Infographics PDF
Following graphs displays companys market share forecasting. It depicts that company will acquire 5 percent market by FY21 and 20 percent by FY23. This Creating New Product Launch Campaign Strategy Market Share Forecast Of The Firm Infographics PDF is perfect for any presentation, be it in front of clients or colleagues. It is a versatile and stylish solution for organizing your meetings. The product features a modern design for your presentation meetings. The adjustable and customizable slides provide unlimited possibilities for acing up your presentation. Slidegeeks has done all the homework before launching the product for you. So, dont wait, grab the presentation templates today.

Creating And Introducing A Web Based Application Development And Marketing Process Infographics PDF
This slide covers the project launch timeline for 5 months including releases, milestones, product integrations, UXandUI designs and meetings. Want to ace your presentation in front of a live audience Our Creating And Introducing A Web Based Application Development And Marketing Process Infographics PDF can help you do that by engaging all the users towards you.. Slidegeeks experts have put their efforts and expertise into creating these impeccable powerpoint presentations so that you can communicate your ideas clearly. Moreover, all the templates are customizable, and easy-to-edit and downloadable. Use these for both personal and commercial use.
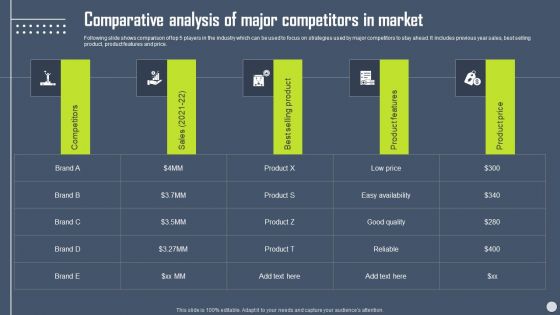
Boosting Yearly Business Revenue Comparative Analysis Of Major Competitors In Market Infographics PDF
Following slide shows comparison of top 5 players in the industry which can be used to focus on strategies used by major competitors to stay ahead. It includes previous year sales, best selling product, product features and price. If you are looking for a format to display your unique thoughts, then the professionally designed Boosting Yearly Business Revenue Comparative Analysis Of Major Competitors In Market Infographics PDF is the one for you. You can use it as a Google Slides template or a PowerPoint template. Incorporate impressive visuals, symbols, images, and other charts. Modify or reorganize the text boxes as you desire. Experiment with shade schemes and font pairings. Alter, share or cooperate with other people on your work. Download Boosting Yearly Business Revenue Comparative Analysis Of Major Competitors In Market Infographics PDF and find out how to give a successful presentation. Present a perfect display to your team and make your presentation unforgettable.
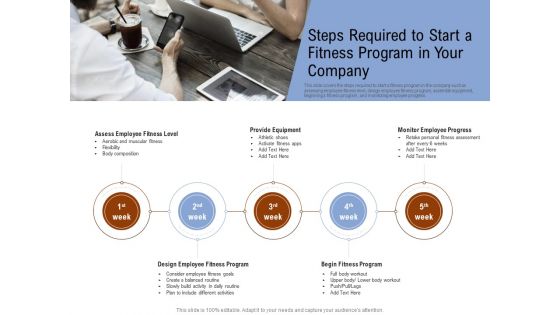
Employee Health And Fitness Program Steps Required To Start A Fitness Program In Your Company Infographics PDF
Presenting this set of slides with name employee health and fitness program steps required to start a fitness program in your company infographics pdf. This is a five stage process. The stages in this process are assess, program, equipment, monitor, design. This is a completely editable PowerPoint presentation and is available for immediate download. Download now and impress your audience.
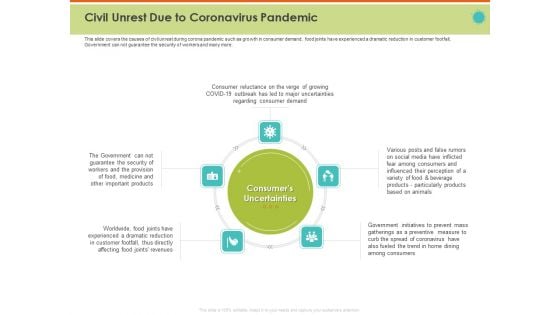
Mitigating The Impact Of COVID On Food And Agriculture Sector Civil Unrest Due To Coronavirus Pandemic Infographics PDF
Presenting this set of slides with name mitigating the impact of covid on food and agriculture sector civil unrest due to coronavirus pandemic infographics pdf. This is a five stage process. The stages in this process are revenues, government, security, initiatives, consumers. This is a completely editable PowerPoint presentation and is available for immediate download. Download now and impress your audience.
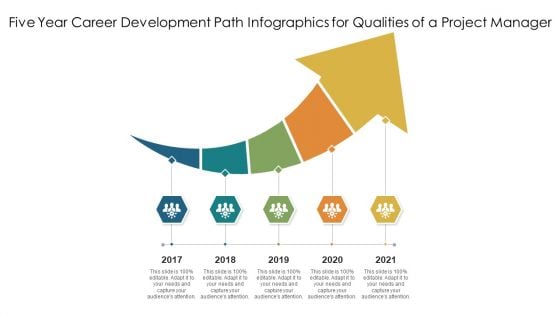
Five Year Career Development Path Infographics For Qualities Of A Project Manager Ppt PowerPoint Presentation Ideas Visuals PDF
Presenting five year career development path infographics for qualities of a project manager ppt powerpoint presentation ideas visuals pdf to dispense important information. This template comprises five stages. It also presents valuable insights into the topics including five year career development path infographics for qualities of a project manager This is a completely customizable PowerPoint theme that can be put to use immediately. So, download it and address the topic impactfully.
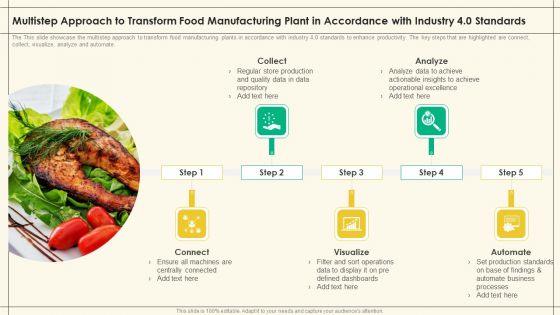
Multistep Approach Transform Food Manufacturing Plant Accordance Industry 4 0 Standards Precooked Food Industry Analysis Infographics PDF
The This slide showcase the multistep approach to transform food manufacturing plants in accordance with industry 4.0 standards to enhance productivity. The key steps that are highlighted are connect, collect, visualize, analyze and automate.Presenting Multistep Approach Transform Food Manufacturing Plant Accordance Industry 4 0 Standards Precooked Food Industry Analysis Infographics PDF to provide visual cues and insights. Share and navigate important information on five stages that need your due attention. This template can be used to pitch topics like Ensure Machines, Centrally Connected, Defined Dashboards. In addtion, this PPT design contains high resolution images, graphics, etc, that are easily editable and available for immediate download.

Business Development Process Step 9 Determine Whether Or Not To Pursue A Lead Ppt PowerPoint Presentation File Infographics PDF
This slide provides information and a detailed overview regarding the ninth step in a business development planning process i.e., determining whether to pursue a lead or not. Make sure to capture your audiences attention in your business displays with our gratis customizable Business Development Process Step 9 Determine Whether Or Not To Pursue A Lead Ppt PowerPoint Presentation File Infographics PDF. These are great for business strategies, office conferences, capital raising or task suggestions. If you desire to acquire more customers for your tech business and ensure they stay satisfied, create your own sales presentation with these plain slides.
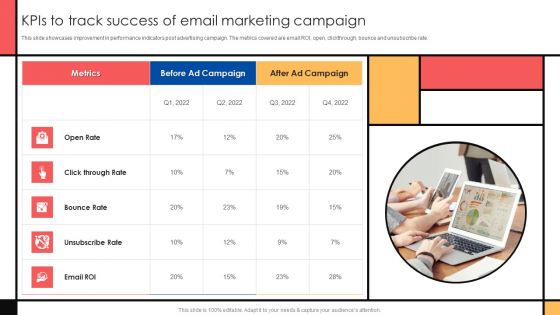
Guide To Create Advertising Campaign For Client Engagement Kpis To Track Success Of Email Marketing Campaign Infographics PDF
This slide showcases improvement in performance indicators post advertising campaign. The metrics covered are email ROI, open, clickthrough, bounce and unsubscribe rate. Presenting this PowerPoint presentation, titled Guide To Create Advertising Campaign For Client Engagement Kpis To Track Success Of Email Marketing Campaign Infographics PDF, with topics curated by our researchers after extensive research. This editable presentation is available for immediate download and provides attractive features when used. Download now and captivate your audience. Presenting this Guide To Create Advertising Campaign For Client Engagement Kpis To Track Success Of Email Marketing Campaign Infographics PDF. Our researchers have carefully researched and created these slides with all aspects taken into consideration. This is a completely customizable Guide To Create Advertising Campaign For Client Engagement Kpis To Track Success Of Email Marketing Campaign Infographics PDF that is available for immediate downloading. Download now and make an impact on your audience. Highlight the attractive features available with our PPTs.
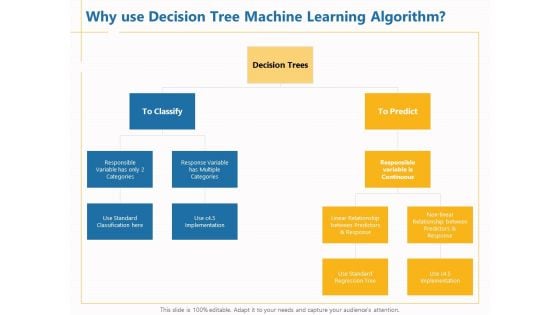
Boosting Machine Learning Why Use Decision Tree Machine Learning Algorithm Ppt PowerPoint Presentation Infographics Design Inspiration PDF
Presenting this set of slides with name boosting machine learning why use decision tree machine learning algorithm ppt powerpoint presentation infographics design inspiration pdf. This is a five stage process. The stages in this process are classification decision trees, classify, predict, implementation. This is a completely editable PowerPoint presentation and is available for immediate download. Download now and impress your audience.
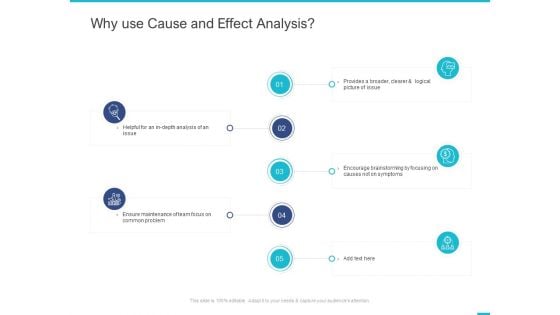
Fishbone Ishikawa Cause And Effect Analysis Why Use Cause And Effect Analysis Ppt PowerPoint Presentation Infographics Graphics Design PDF
Presenting this set of slides with name fishbone ishikawa cause and effect analysis why use cause and effect analysis ppt powerpoint presentation infographics graphics design pdf. This is a five stage process. The stages in this process are provides broader, clearer and logical picture, encourage brainstorming, focusing causes, symptoms, ensure maintenance, team focus, common problem, helpful depth analysis. This is a completely editable PowerPoint presentation and is available for immediate download. Download now and impress your audience.
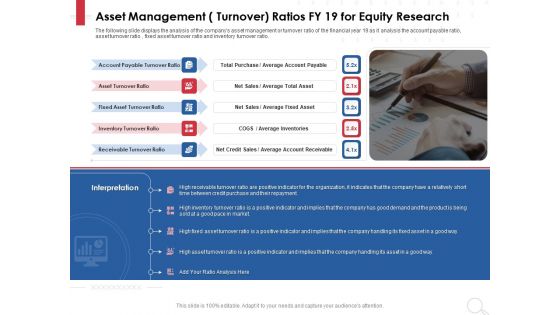
Equity Analysis Project Asset Management Turnover Ratios FY 19 For Equity Research Ppt PowerPoint Presentation Infographics Guide PDF
Presenting this set of slides with name equity analysis project asset management turnover ratios fy 19 for equity research ppt powerpoint presentation infographics guide pdf. This is a five stage process. The stages in this process are account payable turnover ratio, asset turnover ratio, fixed asset turnover ratio, inventory turnover ratio, receivable turnover ratio, net sales. This is a completely editable PowerPoint presentation and is available for immediate download. Download now and impress your audience.
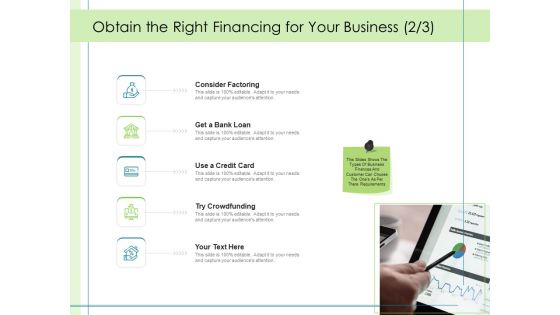
In Depth Business Assessment Obtain The Right Financing For Your Business Ppt PowerPoint Presentation Infographics Master Slide PDF
This is a in depth business assessment obtain the right financing for your business ppt powerpoint presentation infographics master slide pdf template with various stages. Focus and dispense information on five stages using this creative set, that comes with editable features. It contains large content boxes to add your information on topics like consider factoring, get bank loan, use credit card, try crowdfunding. You can also showcase facts, figures, and other relevant content using this PPT layout. Grab it now.
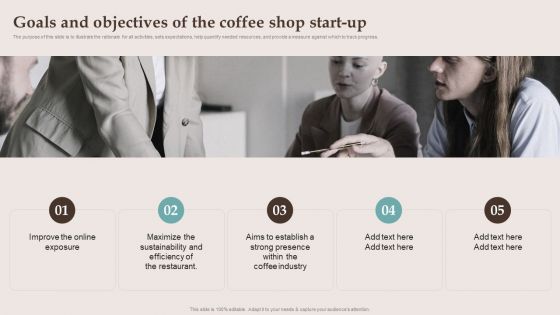
Company Details Of The Cafe Business Goals And Objectives Of The Coffee Shop Start Up Infographics PDF
The purpose of this slide is to illustrate the rationale for all activities, sets expectations, help quantify needed resources, and provide a measure against which to track progress. Create an editable Company Details Of The Cafe Business Goals And Objectives Of The Coffee Shop Start Up Infographics PDF that communicates your idea and engages your audience. Whether you are presenting a business or an educational presentation, pre designed presentation templates help save time. Company Details Of The Cafe Business Goals And Objectives Of The Coffee Shop Start Up Infographics PDF is highly customizable and very easy to edit, covering many different styles from creative to business presentations. Slidegeeks has creative team members who have crafted amazing templates. So, go and get them without any delay.
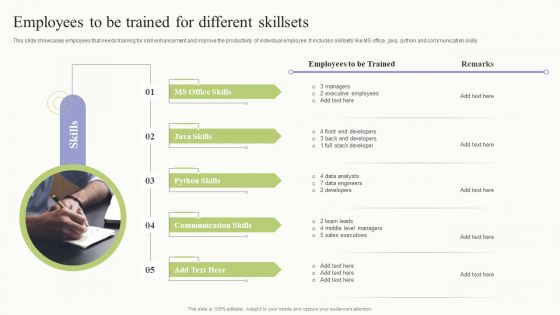
Workplace Training Techniques For Departments And Individual Staff Employees To Be Trained For Different Skillsets Infographics PDF
This slide showcases employees that needs training for skill enhancement and improve the productivity of individual employee. It includes skillsets like MS office, java, python and communication skills. Do you have to make sure that everyone on your team knows about any specific topic I yes, then you should give Workplace Training Techniques For Departments And Individual Staff Employees To Be Trained For Different Skillsets Infographics PDF a try. Our experts have put a lot of knowledge and effort into creating this impeccable Workplace Training Techniques For Departments And Individual Staff Employees To Be Trained For Different Skillsets Infographics PDF. You can use this template for your upcoming presentations, as the slides are perfect to represent even the tiniest detail. You can download these templates from the Slidegeeks website and these are easy to edit. So grab these today.
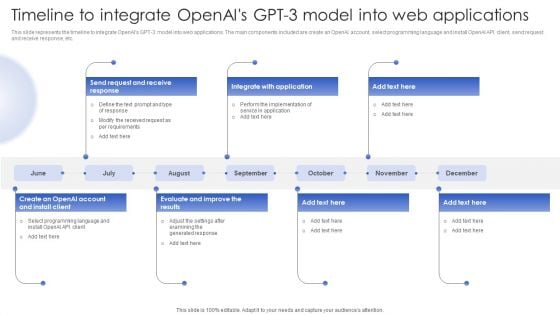
Chatgpt In Web Applications For Enhanced User Interactions Timeline To Integrate Openais GPT 3 Model Into Web Applications Infographics PDF
This slide represents the timeline to integrate OpenAIs GPT 3 model into web applications. The main components included are create an OpenAI account, select programming language and install OpenAI API client, send request and receive response, etc. Do you have an important presentation coming up Are you looking for something that will make your presentation stand out from the rest Look no further than Chatgpt In Web Applications For Enhanced User Interactions Timeline To Integrate Openais GPT 3 Model Into Web Applications Infographics PDF. With our professional designs, you can trust that your presentation will pop and make delivering it a smooth process. And with Slidegeeks, you can trust that your presentation will be unique and memorable. So why wait Grab Chatgpt In Web Applications For Enhanced User Interactions Timeline To Integrate Openais GPT 3 Model Into Web Applications Infographics PDF today and make your presentation stand out from the rest.
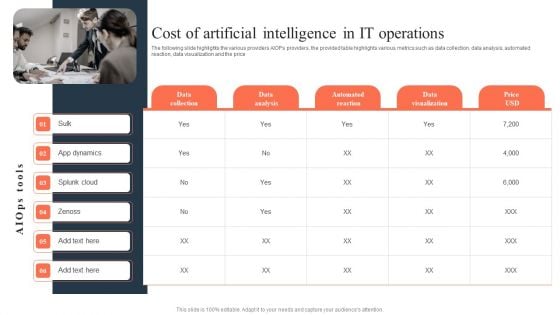
Ml And Big Data In Information Technology Processes Cost Of Artificial Intelligence In IT Operations Infographics PDF
The following slide highlights the various providers AIOPs providers, the provided table highlights various metrics such as data collection, data analysis, automated reaction, data visualization and the price Do you have to make sure that everyone on your team knows about any specific topic I yes, then you should give Ml And Big Data In Information Technology Processes Cost Of Artificial Intelligence In IT Operations Infographics PDF a try. Our experts have put a lot of knowledge and effort into creating this impeccable Ml And Big Data In Information Technology Processes Cost Of Artificial Intelligence In IT Operations Infographics PDF. You can use this template for your upcoming presentations, as the slides are perfect to represent even the tiniest detail. You can download these templates from the Slidegeeks website and these are easy to edit. So grab these today.
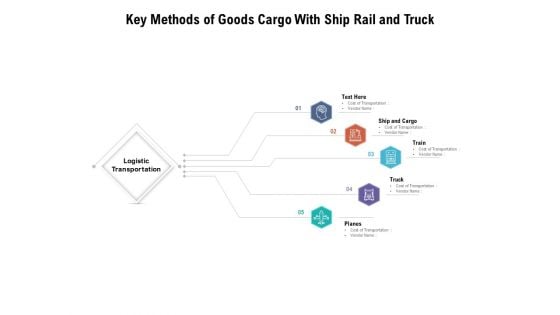
Key Methods Of Goods Cargo With Ship Rail And Truck Ppt PowerPoint Presentation Infographics Slide Download PDF
Persuade your audience using this key methods of goods cargo with ship rail and truck ppt powerpoint presentation infographics slide download pdf. This PPT design covers five stages, thus making it a great tool to use. It also caters to a variety of topics including logistic transportation, cost of transportation, cost of transportation, cost of transportation, cost of transportation, cost of transportation. Download this PPT design now to present a convincing pitch that not only emphasizes the topic but also showcases your presentation skills.
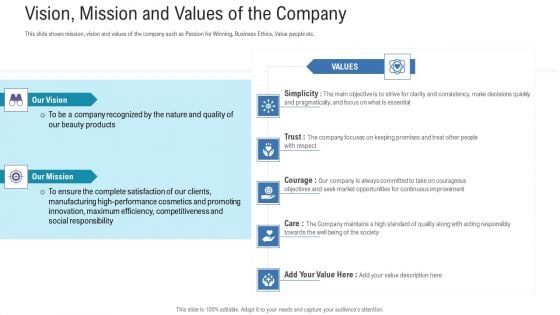
Pitch Deck For Fundraising From Angel Investors Vision Mission And Values Of The Company Ppt Infographics Slide Download PDF
This slide shows mission, vision and values of the company such as Passion for Winning, Business Ethics, Value people etc. Presenting pitch deck for fundraising from angel investors vision mission and values of the company ppt infographics slide download pdf to provide visual cues and insights. Share and navigate important information on five stages that need your due attention. This template can be used to pitch topics like our vision mission, manufacturing, competitiveness, social responsibility, opportunities. In addtion, this PPT design contains high resolution images, graphics, etc, that are easily editable and available for immediate download.
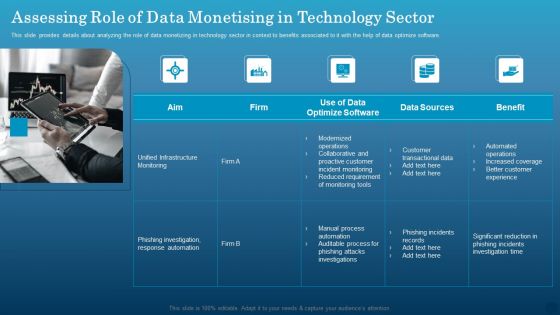
Data Monetization Approach To Drive Business Growth Assessing Role Of Data Monetising In Technology Sector Infographics PDF
This slide provides details about analyzing the role of data monetizing in technology sector in context to benefits associated to it with the help of data optimize software. Find a pre designed and impeccable Data Monetization Approach To Drive Business Growth Assessing Role Of Data Monetising In Technology Sector Infographics PDF. The templates can ace your presentation without additional effort. You can download these easy to edit presentation templates to make your presentation stand out from others. So, what are you waiting for Download the template from Slidegeeks today and give a unique touch to your presentation.
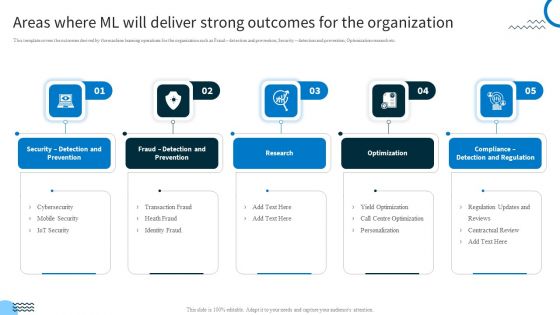
Redefining IT Solutions Delivery In A Post Pandemic Areas Where ML Will Deliver Strong Outcomes For The Organization Infographics PDF
This template covers the outcomes derived by the machine learning operations for the organization such as Fraud detection and prevention, Security detection and prevention, Optimization research etc. Want to ace your presentation in front of a live audience. Our Redefining IT Solutions Delivery In A Post Pandemic Areas Where ML Will Deliver Strong Outcomes For The Organization Infographics PDF can help you do that by engaging all the users towards you.. Slidegeeks experts have put their efforts and expertise into creating these impeccable powerpoint presentations so that you can communicate your ideas clearly. Moreover, all the templates are customizable, and easy to edit and downloadable. Use these for both personal and commercial use.
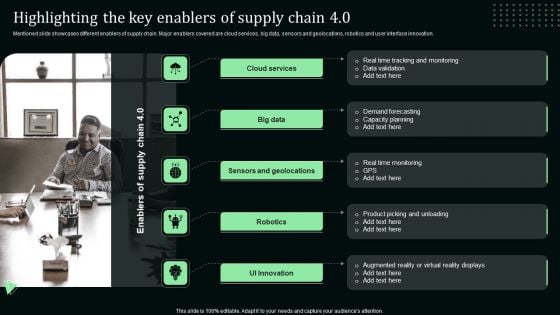
Highlighting The Key Enablers Of Supply Chain 4 0 Stand Out Digital Supply Chain Tactics Enhancing Infographics PDF
Mentioned slide showcases different enablers of supply chain. Major enablers covered are cloud services, big data, sensors and geolocations, robotics and user interface innovation.The best PPT templates are a great way to save time, energy, and resources. Slidegeeks have 100 precent editable powerpoint slides making them incredibly versatile. With these quality presentation templates, you can create a captivating and memorable presentation by combining visually appealing slides and effectively communicating your message. Download Highlighting The Key Enablers Of Supply Chain 4 0 Stand Out Digital Supply Chain Tactics Enhancing Infographics PDF from Slidegeeks and deliver a wonderful presentation.


 Continue with Email

 Home
Home


