5 Infographics
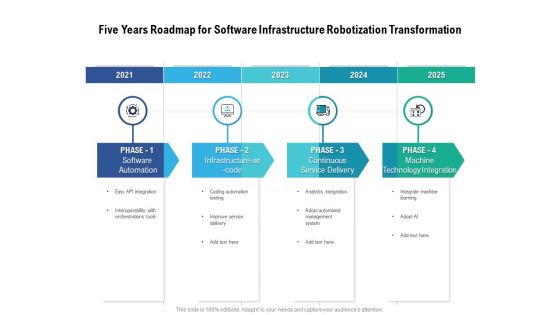
Five Years Roadmap For Software Infrastructure Robotization Transformation Infographics
Presenting the five years roadmap for software infrastructure robotization transformation infographics. The template includes a roadmap that can be used to initiate a strategic plan. Not only this, the PowerPoint slideshow is completely editable and you can effortlessly modify the font size, font type, and shapes according to your needs. This PPT slide can be easily reached in standard screen and widescreen aspect ratios. The set is also available in various formats like PDF, PNG, and JPG. So download and use it multiple times as per your knowledge.
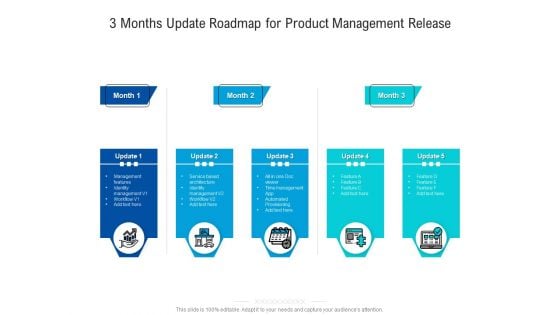
3 Months Update Roadmap For Product Management Release Infographics
Presenting our jaw-dropping 3 months update roadmap for product management release infographics. You can alternate the color, font size, font type, and shapes of this PPT layout according to your strategic process. This PPT presentation is compatible with Google Slides and is available in both standard screen and widescreen aspect ratios. You can also download this well-researched PowerPoint template design in different formats like PDF, JPG, and PNG. So utilize this visually-appealing design by clicking the download button given below.
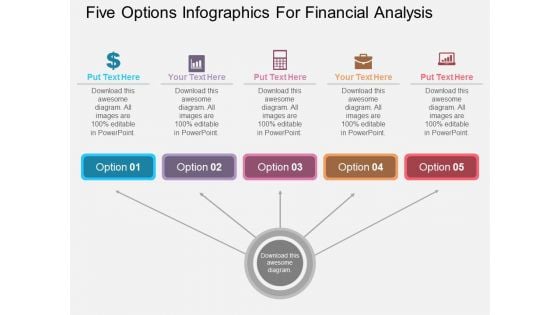
Five Options Infographics For Financial Analysis Powerpoint Template
Visually support your presentation with our above template showing five options infographic. This slide has been professionally designed to present money and finance management. This template offers an excellent background to build impressive presentation.
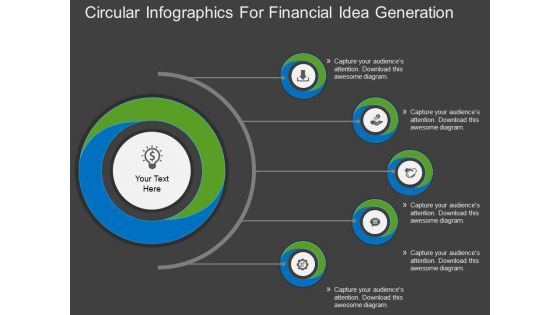
Circular Infographics For Financial Idea Generation Powerpoint Template
Our professionally designed circle diagram is as an effective tool for communicating financial ideas. It contains circle design with finance icons. Convey your views with this diagram slide. It will amplify the strength of your logic.
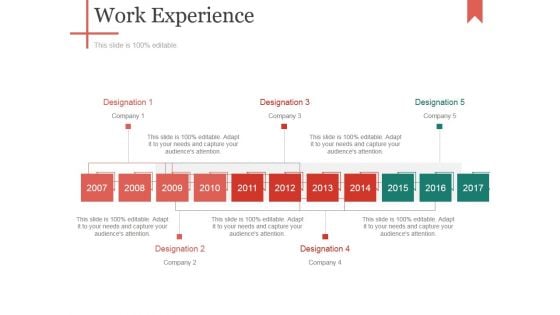
Work Experience Template 2 Ppt PowerPoint Presentation Infographics Ideas
This is a work experience template 2 ppt powerpoint presentation infographics ideas. This is a five stage process. The stages in this process are company, designation, work experience.
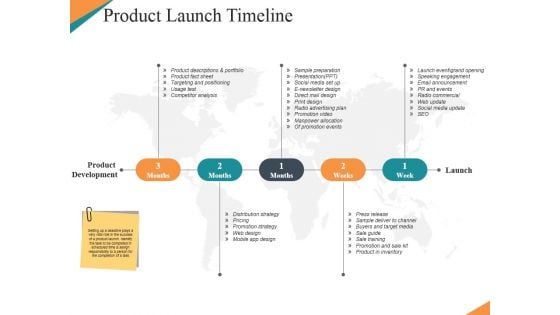
Product Launch Timeline Ppt PowerPoint Presentation Infographics Visuals
This is a product launch timeline ppt powerpoint presentation infographics visuals. This is a five stage process. The stages in this process are timeline, planning, management, strategy, marketing.
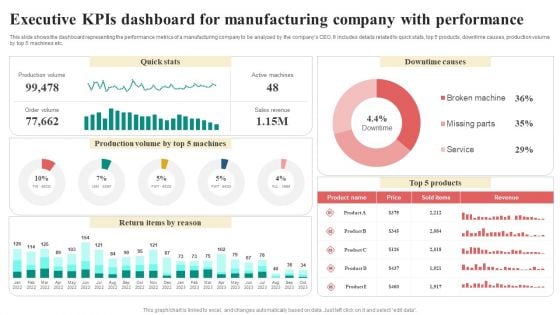
Executive Kpis Dashboard For Manufacturing Company With Performance Infographics PDF
This slide shows the dashboard representing the performance metrics of a manufacturing company to be analyzed by the companys CEO. It includes details related to quick stats, top 5 products, downtime causes, production volume by top 5 machines etc. Showcasing this set of slides titled Executive Kpis Dashboard For Manufacturing Company With Performance Infographics PDF. The topics addressed in these templates are Return Items By Reason, Quick Stats, Downtime Causes, Revenue. All the content presented in this PPT design is completely editable. Download it and make adjustments in color, background, font etc. as per your unique business setting.
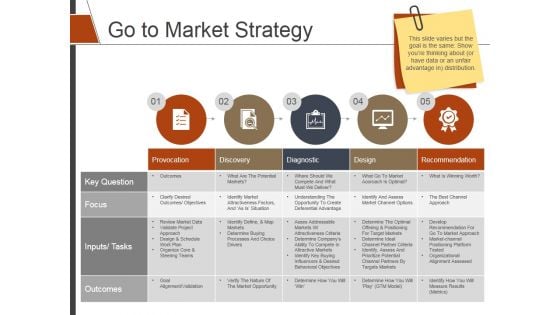
Go To Market Strategy Ppt PowerPoint Presentation Infographics Objects
This is a go to market strategy ppt powerpoint presentation infographics objects. This is a five stage process. The stages in this process are provocation, discovery, diagnostic, design, recommendation.
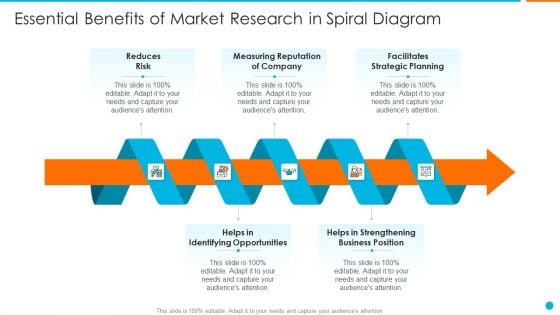
Essential Benefits Of Market Research In Spiral Diagram Infographics PDF
Persuade your audience using this essential benefits of market research in spiral diagram infographics pdf. This PPT design covers five stages, thus making it a great tool to use. It also caters to a variety of topics including reduces risk, measuring reputation of company, facilitates strategic planning, helps in identifying opportunities, helps in strengthening business position. Download this PPT design now to present a convincing pitch that not only emphasizes the topic but also showcases your presentation skills.
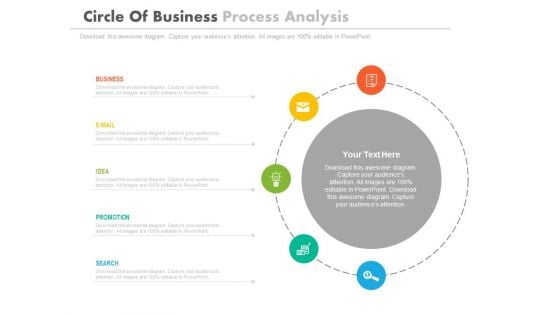
Circle Infographics For Market Research Analysis Powerpoint Template
This PowerPoint template has been designed with circular infographic diagram. You can use this PPT diagram slide to visually support your content. Above slide is suitable for business presentation.
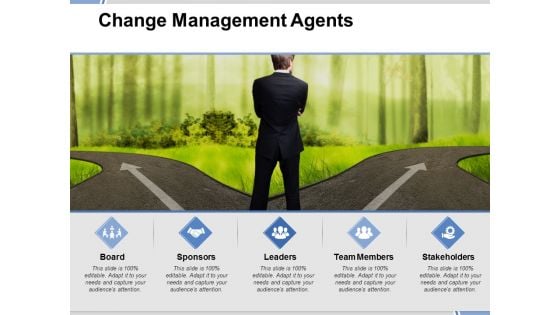
Change Management Agents Ppt PowerPoint Presentation Portfolio Infographics
This is a change management agents ppt powerpoint presentation portfolio infographics. This is a five stage process. The stages in this process are board, sponsors, leaders, team members, stakeholders.
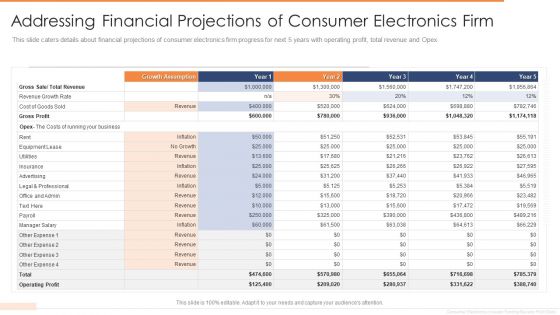
Addressing Financial Projections Of Consumer Electronics Firm Infographics PDF
This slide caters details about financial projections of consumer electronics firm progress for next 5 years with operating profit, total revenue and Opex. Deliver an awe inspiring pitch with this creative addressing financial projections of consumer electronics firm infographics pdf bundle. Topics like revenue growth rate, gross profit, advertising, equipment, growth assumption can be discussed with this completely editable template. It is available for immediate download depending on the needs and requirements of the user.
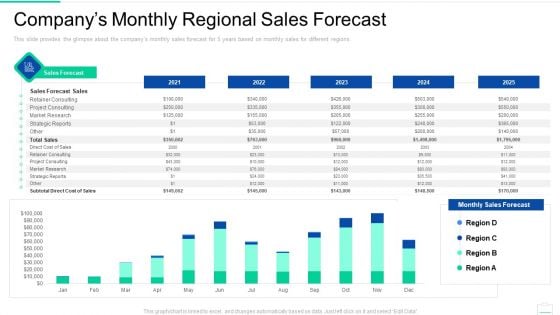
Market Area Analysis Companys Monthly Regional Sales Forecast Infographics PDF
This slide provides the glimpse about the companys monthly sales forecast for 5 years based on monthly sales for different regions.Deliver and pitch your topic in the best possible manner with this market area analysis companys monthly regional sales forecast infographics pdf. Use them to share invaluable insights on retainer consulting, market research, strategic reports and impress your audience. This template can be altered and modified as per your expectations. So, grab it now.
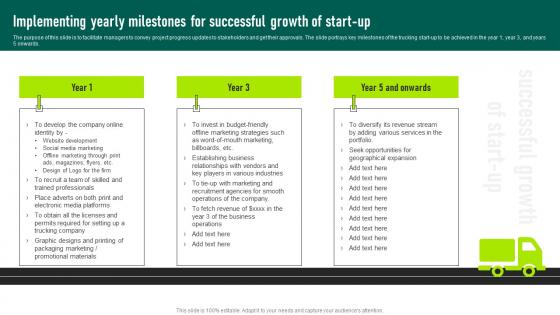
Implementing Yearly Milestones Trucking Services Business Plan Infographics Pdf
The purpose of this slide is to facilitate managers to convey project progress updates to stakeholders and get their approvals. The slide portrays key milestones of the trucking start up to be achieved in the year 1, year 3, and years 5 onwards. Crafting an eye-catching presentation has never been more straightforward. Let your presentation shine with this tasteful yet straightforward Implementing Yearly Milestones Trucking Services Business Plan Infographics Pdf template. It offers a minimalistic and classy look that is great for making a statement. The colors have been employed intelligently to add a bit of playfulness while still remaining professional. Construct the ideal Implementing Yearly Milestones Trucking Services Business Plan Infographics Pdf that effortlessly grabs the attention of your audience. Begin now and be certain to wow your customers. The purpose of this slide is to facilitate managers to convey project progress updates to stakeholders and get their approvals. The slide portrays key milestones of the trucking start up to be achieved in the year 1, year 3, and years 5 onwards.

Enterprise Risk Management Enterprise Cyber Risk Management Dashboard Infographics PDF
This slide represents dashboard representing details related to management of strategic risks in the organization. It includes details related to risk rating breakdown, risk heat map, top 5 vulnerabilities etc. Do you have an important presentation coming up Are you looking for something that will make your presentation stand out from the rest Look no further than Enterprise Risk Management Enterprise Cyber Risk Management Dashboard Infographics PDF. With our professional designs, you can trust that your presentation will pop and make delivering it a smooth process. And with Slidegeeks, you can trust that your presentation will be unique and memorable. So why wait Grab Enterprise Risk Management Enterprise Cyber Risk Management Dashboard Infographics PDF today and make your presentation stand out from the rest.
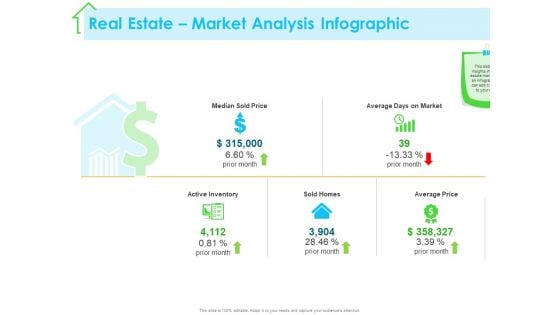
Real Estate Development Real Estate Market Analysis Infographic Ppt PowerPoint Presentation Infographic Template Infographics PDF
Presenting this set of slides with name real estate development real estate market analysis infographic ppt powerpoint presentation infographic template infographics pdf. This is a five stage process. The stages in this process are median sold price, average days on market, active inventory, sold homes, average price. This is a completely editable PowerPoint presentation and is available for immediate download. Download now and impress your audience.
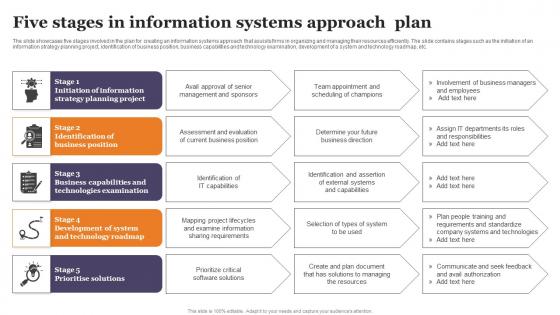
Five Stages In Information Systems Approach Plan Infographics Pdf
The slide showcases five stages involved in the plan for creating an information systems approach that assists firms in organizing and managing their resources efficiently. The slide contains stages such as the initiation of an information strategy planning project, identification of business position, business capabilities and technology examination, development of a system and technology roadmap, etc. Showcasing this set of slides titled Five Stages In Information Systems Approach Plan Infographics Pdf The topics addressed in these templates are Strategy Planning Project, Business Position, Technologies Examination All the content presented in this PPT design is completely editable. Download it and make adjustments in color, background, font etc. as per your unique business setting. The slide showcases five stages involved in the plan for creating an information systems approach that assists firms in organizing and managing their resources efficiently. The slide contains stages such as the initiation of an information strategy planning project, identification of business position, business capabilities and technology examination, development of a system and technology roadmap, etc.
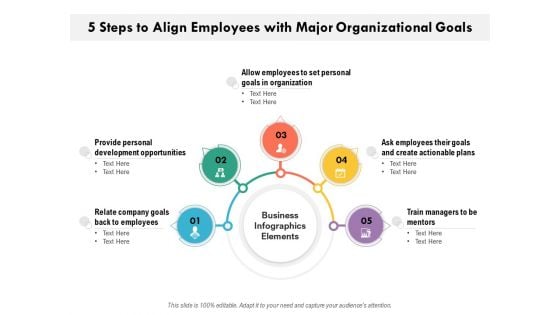
5 Steps To Align Employees With Major Organizational Goals Ppt PowerPoint Presentation Slides Structure PDF
Presenting 5 steps to align employees with major organizational goals ppt powerpoint presentation slides structure pdf to dispense important information. This template comprises five stages. It also presents valuable insights into the topics including provide personal development opportunities, relate company goals back to employees, allow employees to set personal goals in organization, ask employees their goals and create actionable plans, train managers to be mentors, business infographics elements. This is a completely customizable PowerPoint theme that can be put to use immediately. So, download it and address the topic impactfully.
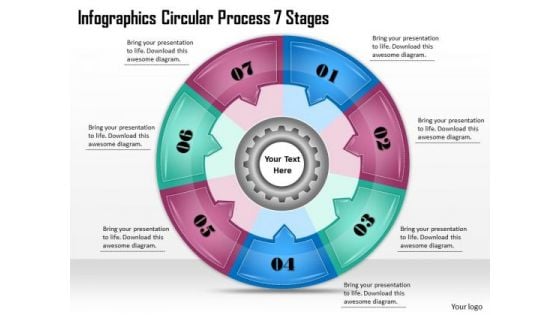
Timeline Ppt Template Infographics Circular Process 7 Stages
Our Timeline Ppt Template Infographics Circular Process 7 Stages Powerpoint Templates Enjoy Drama. They Provide Entertaining Backdrops.
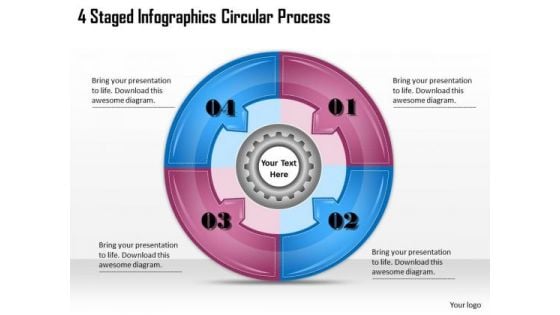
Timeline Ppt Template 4 Staged Infographics Circular Process
Our Timeline Ppt Template 4 Staged Infographics Circular Process Powerpoint Templates Abhor Doodling. They Never Let The Interest Flag.
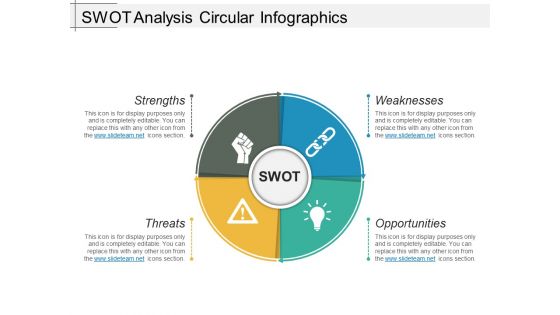
Swot Analysis Circular Infographics Ppt PowerPoint Presentation Ideas Background Image
This is a swot analysis circular infographics ppt powerpoint presentation ideas background image. This is a four stage process. The stages in this process are strength, weakness.
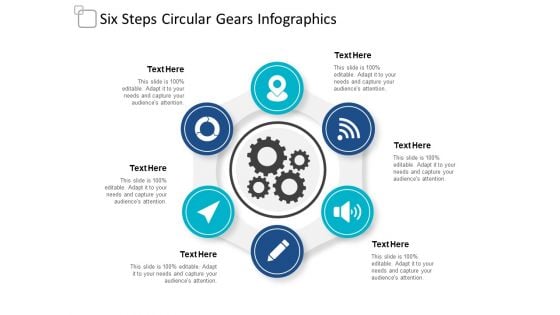
Six Steps Circular Gears Infographics Ppt Powerpoint Presentation Slides Smartart
This is a six steps circular gears infographics ppt powerpoint presentation slides smartart. This is a six stage process. The stages in this process are gear, equipment, setting.
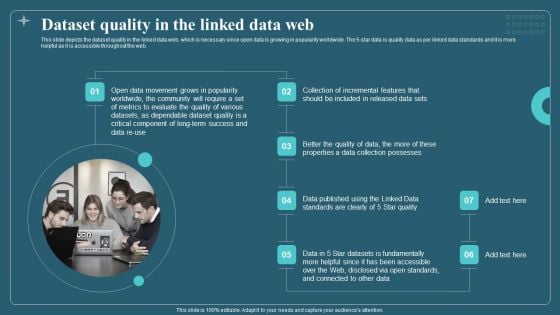
Dataset Quality In The Linked Data Web Infographics PDF
This slide depicts the dataset quality in the linked data web, which is necessary since open data is growing in popularity worldwide. The 5-star data is quality data as per linked data standards and it is more helpful as it is accessible throughout the web. This is a Dataset Quality In The Linked Data Web Infographics PDF template with various stages. Focus and dispense information on seven stages using this creative set, that comes with editable features. It contains large content boxes to add your information on topics like Quality Of Data, Evaluate, Metrics. You can also showcase facts, figures, and other relevant content using this PPT layout. Grab it now.
The Problem Template 1 Ppt PowerPoint Presentation Infographics Background
This is a the problem template 1 ppt powerpoint presentation infographics background. This is a one stage process. The stages in this process are strategy, business, process, circular.
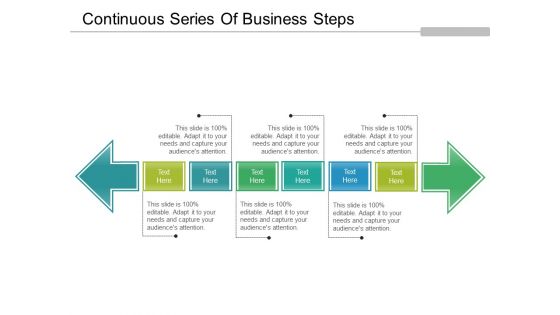
Continuous Series Of Business Steps Ppt PowerPoint Presentation Infographics Templates
This is a continuous series of business steps ppt powerpoint presentation infographics templates. This is a six stage process. The stages in this process are circular, continuity, continuum.
Personality Traits Percentage Scale Ppt PowerPoint Presentation Infographics Icon
This is a personality traits percentage scale ppt powerpoint presentation infographics icon. This is a six stage process. The stages in this process are circular, continuity, continuum.
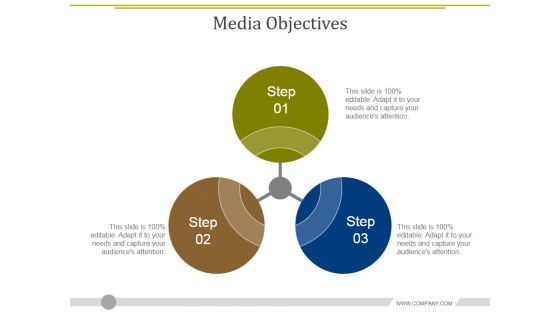
Media Objectives Template 1 Ppt PowerPoint Presentation Infographics Objects
This is a media objectives template 1 ppt powerpoint presentation infographics objects. This is a three stage process. The stages in this process are step, business, marketing, management.
Customer Loyalty Lifecycle Ppt PowerPoint Presentation Infographics Icons
This is a customer loyalty lifecycle ppt powerpoint presentation infographics icons. This is a seven stage process. The stages in this process are attract, loyalty, engage, retain, reward.

Employee Referral Bonus Announcement Ppt PowerPoint Presentation Infographics Layout
This is a employee referral bonus announcement ppt powerpoint presentation infographics layout. This is a six stage process. The stages in this process are employee referral bonus announcement.
Musical Instrument Vector Icon Ppt Powerpoint Presentation Infographics Backgrounds
This is a musical instrument vector icon ppt powerpoint presentation infographics backgrounds. This is a three stage process. The stages in this process are harmonization, standarization, redundant.
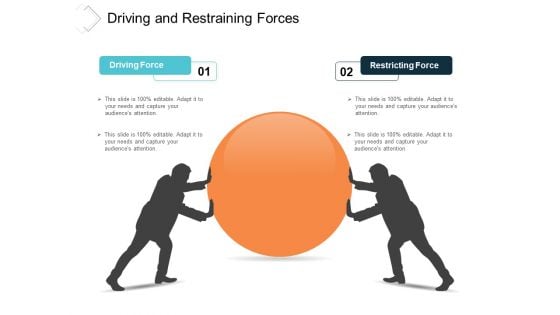
Driving And Restraining Forces Ppt Powerpoint Presentation Infographics Inspiration
This is a driving and restraining forces ppt powerpoint presentation infographics inspiration. This is a two stage process. The stages in this process are strength, efforts, forces.
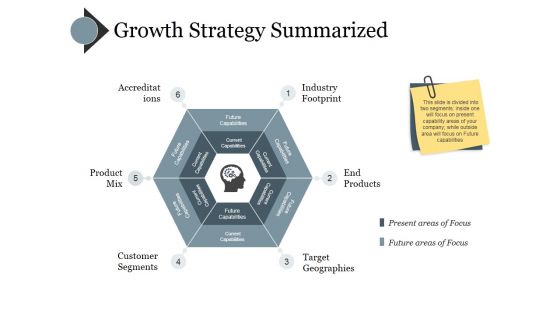
Growth Strategy Summarized Ppt PowerPoint Presentation Infographics Example Introduction
This is a growth strategy summarized ppt powerpoint presentation infographics example introduction. This is a six stage process. The stages in this process are future capabilities, current capabilities.
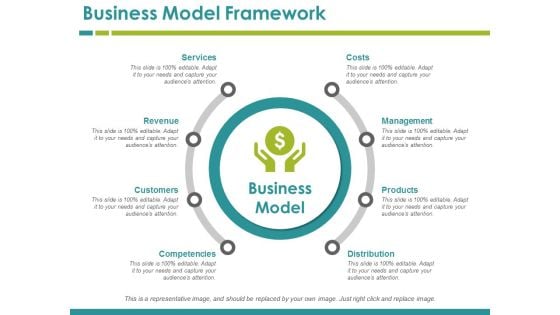
Business Model Framework Ppt PowerPoint Presentation Infographics Deck
This is a business model framework ppt powerpoint presentation infographics deck. This is a eight stage process. The stages in this process are services, revenue, customers, competencies, costs.
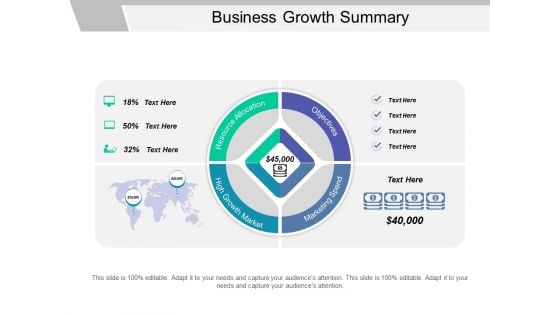
Business Growth Summary Ppt PowerPoint Presentation Infographics Slide
This is a business growth summary ppt powerpoint presentation infographics slide. This is a four stage process. The stages in this process are goals, results, output, deliverables.
Venture Capital Services Ppt PowerPoint Presentation Infographics Graphics Download
This is a venture capital services ppt powerpoint presentation infographics graphics download. This is a two stage process. The stages in this process are venture capital services.
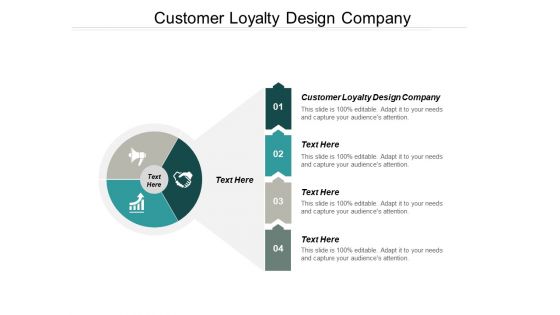
Customer Loyalty Design Company Ppt PowerPoint Presentation Infographics Objects
This is a customer loyalty design company ppt powerpoint presentation infographics objects. This is a four stage process. The stages in this process are customer loyalty design company.
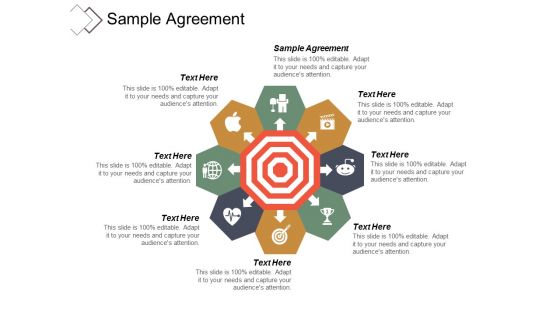
Sample Agreement Ppt Powerpoint Presentation Infographics Information Cpb
This is a sample agreement ppt powerpoint presentation infographics information cpb. This is a eight stage process. The stages in this process are sample agreement.
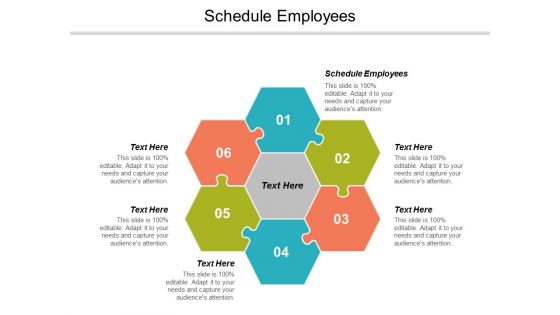
Schedule Employees Ppt Powerpoint Presentation Infographics Master Slide Cpb
This is a schedule employees ppt powerpoint presentation infographics master slide cpb. This is a six stage process. The stages in this process are schedule employees.
Inventory Tracking Ppt Powerpoint Presentation Infographics Icons Cpb
This is a inventory tracking ppt powerpoint presentation infographics icons cpb. This is a four stage process. The stages in this process are inventory tracking.
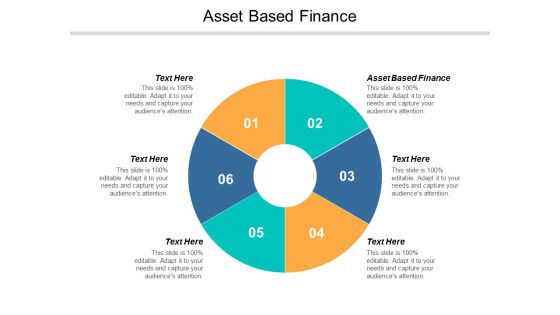
Asset Based Finance Ppt PowerPoint Presentation Infographics Influencers Cpb
This is a asset based finance ppt powerpoint presentation infographics influencers cpb. This is a six stage process. The stages in this process are asset based finance.
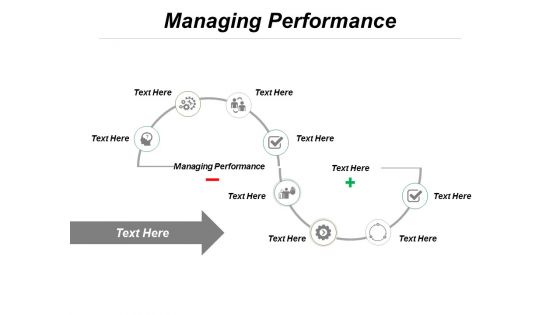
Managing Performance Ppt PowerPoint Presentation Infographics Visuals Cpb
This is a managing performance ppt powerpoint presentation infographics visuals cpb. This is a eight stage process. The stages in this process are managing performance.

Online Awareness Strategies Ppt PowerPoint Presentation Infographics Designs Download Cpb
This is a online awareness strategies ppt powerpoint presentation infographics designs download cpb. This is a four stage process. The stages in this process are online awareness strategies.
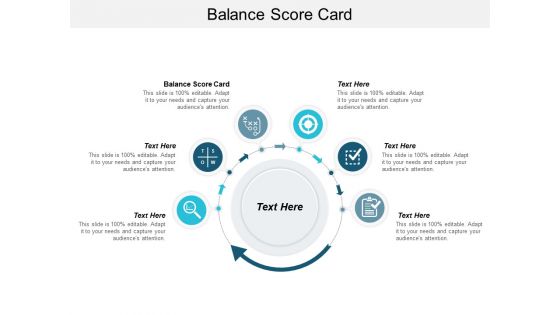
Balance Score Card Ppt PowerPoint Presentation Infographics Shapes Cpb
This is a balance score card ppt powerpoint presentation infographics shapes cpb. This is a six stage process. The stages in this process are balance score card.

Customer Services Management Ppt PowerPoint Presentation Infographics Designs Download Cpb
This is a customer services management ppt powerpoint presentation infographics designs download cpb. This is a eight stage process. The stages in this process are customer services management.
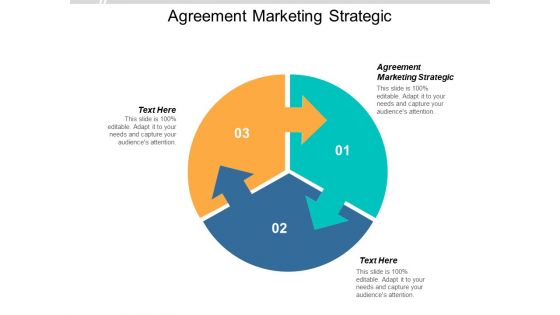
Agreement Marketing Strategic Ppt PowerPoint Presentation Infographics Layout Cpb
This is a agreement marketing strategic ppt powerpoint presentation infographics layout cpb. This is a three stage process. The stages in this process are agreement marketing strategic.
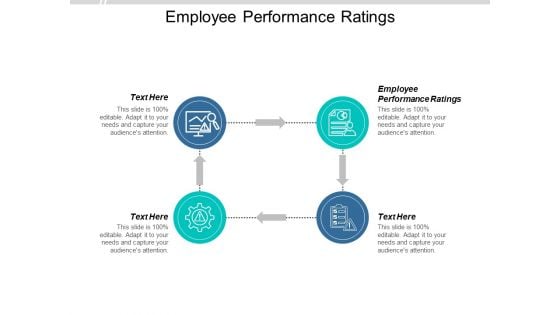
Employee Performance Ratings Ppt PowerPoint Presentation Infographics Brochure Cpb
This is a employee performance ratings ppt powerpoint presentation infographics brochure cpb. This is a four stage process. The stages in this process are employee performance ratings.
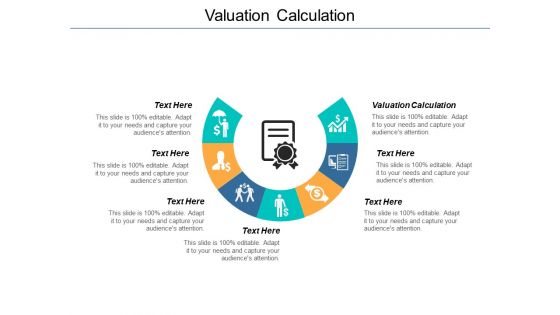
Valuation Calculation Ppt PowerPoint Presentation Infographics Diagrams Cpb
This is a valuation calculation ppt powerpoint presentation infographics diagrams cpb. This is a seven stage process. The stages in this process are valuation calculation.
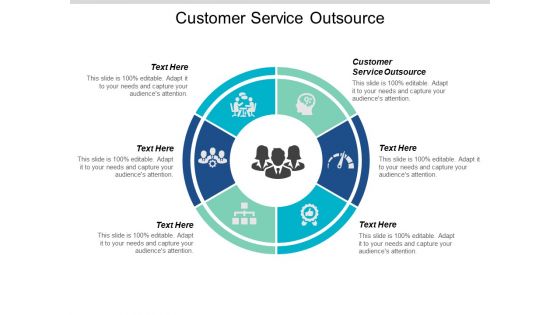
Customer Service Outsource Ppt PowerPoint Presentation Infographics Designs Cpb
This is a customer service outsource ppt powerpoint presentation infographics designs cpb. This is a six stage process. The stages in this process are customer service outsource.
Marketing Politics Ppt Powerpoint Presentation Infographics Designs Cpb
This is a marketing politics ppt powerpoint presentation infographics designs cpb. This is a four stage process. The stages in this process are marketing politics.
Market Distribution Ppt PowerPoint Presentation Infographics Graphics Tutorials Cpb
This is a market distribution ppt powerpoint presentation infographics graphics tutorials cpb. This is a three stage process. The stages in this process are market distribution.
Invention Vector Icon Ppt Powerpoint Presentation Infographics Layouts
This is a invention vector icon ppt powerpoint presentation infographics layouts. This is a four stage process. The stages in this process are discovery, identify, recognize.

Corporate Purchasing Policy Ppt PowerPoint Presentation Infographics Smartart Cpb
This is a corporate purchasing policy ppt powerpoint presentation infographics smartart cpb. This is a six stage process. The stages in this process are corporate purchasing policy.

Business Payroll Solutions Ppt PowerPoint Presentation Infographics Graphic Images
This is a business payroll solutions ppt powerpoint presentation infographics graphic images. This is a four stage process. The stages in this process are business payroll solutions.
Capital Raising Agreement Ppt PowerPoint Presentation Show Infographics Cpb
This is a capital raising agreement ppt powerpoint presentation show infographics cpb. This is a four stage process. The stages in this process are capital raising agreement.
Customer Payments Ppt PowerPoint Presentation Infographics Example Introduction Cpb
This is a customer payments ppt powerpoint presentation infographics example introduction cpb. This is a four stage process. The stages in this process are customer payments.
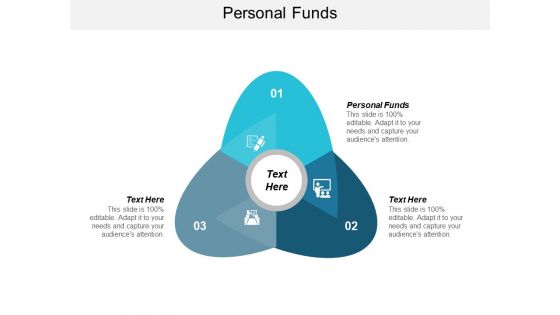
Personal Funds Ppt PowerPoint Presentation Infographics Guidelines Cpb
This is a personal funds ppt powerpoint presentation infographics guidelines cpb. This is a three stage process. The stages in this process are personal funds.
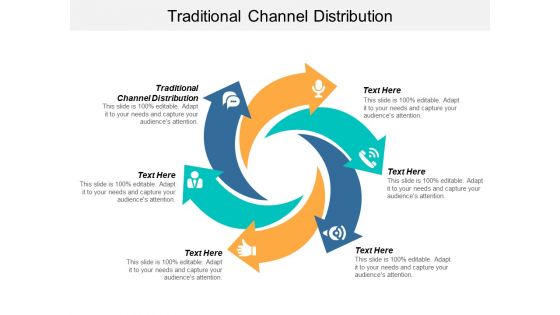
Traditional Channel Distribution Ppt PowerPoint Presentation Infographics Format Cpb
This is a traditional channel distribution ppt powerpoint presentation infographics format cpb. This is a six stage process. The stages in this process are traditional channel distribution.
Leadership Organizational Culture Ppt PowerPoint Presentation Infographics Clipart Cpb
This is a leadership organizational culture ppt powerpoint presentation infographics clipart cpb. This is a four stage process. The stages in this process are leadership organizational culture.
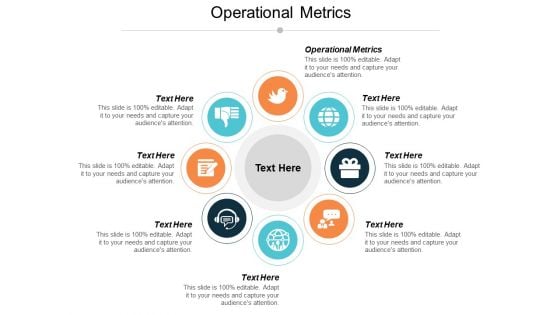
Operational Metrics Ppt PowerPoint Presentation Infographics Structure Cpb
This is a operational metrics ppt powerpoint presentation infographics structure cpb. This is a eight stage process. The stages in this process are operational metrics.
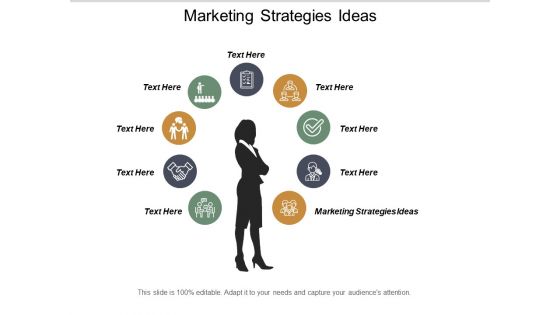
Marketing Strategies Ideas Ppt PowerPoint Presentation Infographics Graphics Example Cpb
This is a marketing strategies ideas ppt powerpoint presentation infographics graphics example cpb. This is a nine stage process. The stages in this process are marketing strategies ideas.


 Continue with Email

 Home
Home


