5 Infographics
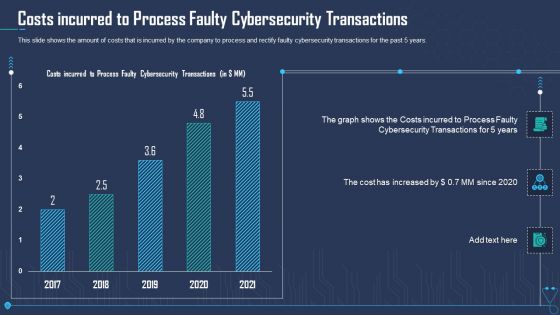
Costs Incurred To Process Faulty Cybersecurity Transactions Ppt Infographics Smartart PDF
This slide shows the amount of costs that is incurred by the company to process and rectify faulty cybersecurity transactions for the past 5 years. Deliver an awe inspiring pitch with this creative costs incurred to process faulty cybersecurity transactions ppt infographics smartart pdf bundle. Topics like costs incurred to process faulty cybersecurity transactions can be discussed with this completely editable template. It is available for immediate download depending on the needs and requirements of the user.
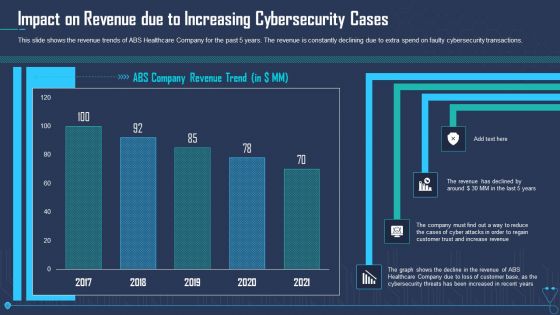
Impact On Revenue Due To Increasing Cybersecurity Cases Ppt Inspiration Infographics PDF
This slide shows the revenue trends of ABS Healthcare Company for the past 5 years. The revenue is constantly declining due to extra spend on faulty cybersecurity transactions. Deliver an awe inspiring pitch with this creative impact on revenue due to increasing cybersecurity cases ppt inspiration infographics pdf bundle. Topics like impact on revenue due to increasing cybersecurity cases can be discussed with this completely editable template. It is available for immediate download depending on the needs and requirements of the user.
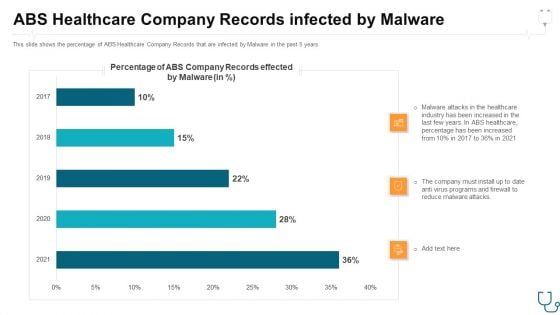
Abs Healthcare Company Records Infected By Malware Ppt Infographics Rules PDF
This slide shows the percentage of ABS Healthcare Company Records that are infected by Malware in the past 5 years. Deliver an awe-inspiring pitch with this creative abs healthcare company records infected by malware ppt infographics rules pdf. bundle. Topics like abs healthcare company records infected by malware can be discussed with this completely editable template. It is available for immediate download depending on the needs and requirements of the user.
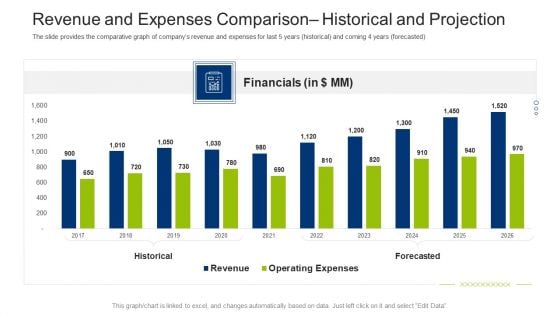
Investment Fundraising Pitch Deck From Stock Market Revenue And Expenses Comparison Historical And Projection Infographics PDF
The slide provides the comparative graph of companys revenue and expenses for last 5 years historical and coming 4 years forecasted. Deliver an awe inspiring pitch with this creative investment fundraising pitch deck from stock market revenue and expenses comparison historical and projection infographics pdf bundle. Topics like financials, historical, forecasted, revenue, expenses can be discussed with this completely editable template. It is available for immediate download depending on the needs and requirements of the user.
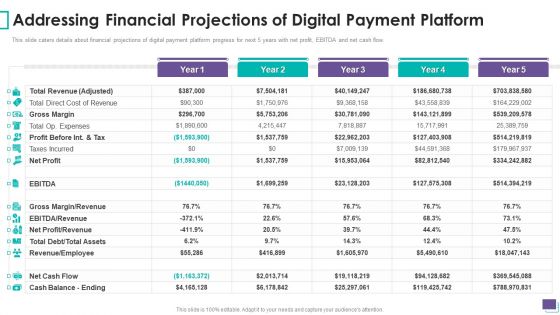
Payment Gateway Firm Addressing Financial Projections Of Digital Payment Platform Infographics PDF
This slide caters details about financial projections of digital payment platform progress for next 5 years with net profit, EBITDA and net cash flow. Deliver an awe inspiring pitch with this creative Payment Gateway Firm Addressing Financial Projections Of Digital Payment Platform Infographics PDF bundle. Topics like Gross Margin, Profit Before, Net Profit, Employee can be discussed with this completely editable template. It is available for immediate download depending on the needs and requirements of the user.
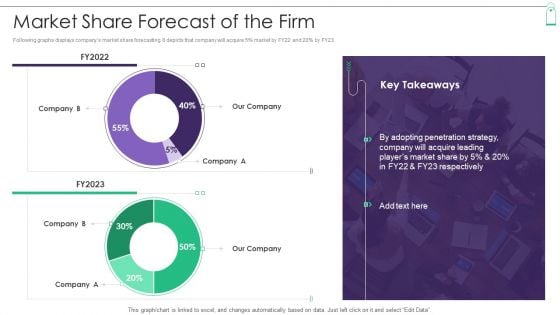
New Product Sales Strategy And Marketing Market Share Forecast Of The Firm Infographics PDF
Following graphs displays companys market share forecasting. It depicts that company will acquire 5 percent market by FY22 and 20 percent by FY23. Deliver and pitch your topic in the best possible manner with this New Product Sales Strategy And Marketing Market Share Forecast Of The Firm Infographics PDF. Use them to share invaluable insights on Market Share Forecast and impress your audience. This template can be altered and modified as per your expectations. So, grab it now.

How To Create A Customer Experience CX Strategythe Principles Of Service Design Infographics PDF
Every service needs to have a holistic service blueprint. For it to be successful, here are the 5 core principles that every business should follow.Deliver an awe inspiring pitch with this creative How To Create A Customer Experience CX Strategythe Principles Of Service Design Infographics PDF bundle. Topics like Sequence Interrelated, Entire Environment, Intangible Services can be discussed with this completely editable template. It is available for immediate download depending on the needs and requirements of the user.
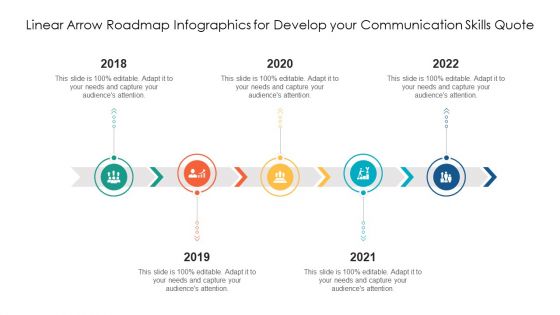
Linear Arrow Roadmap Infographics For Develop Your Communication Skills Quotes Ppt PowerPoint Presentation File Infographic Template PDF
Persuade your audience using this linear arrow roadmap infographics for develop your communication skills quotes ppt powerpoint presentation file infographic template pdf. This PPT design covers five stages, thus making it a great tool to use. It also caters to a variety of topics including linear arrow roadmap infographics for develop your communication skills quote. Download this PPT design now to present a convincing pitch that not only emphasizes the topic but also showcases your presentation skills.
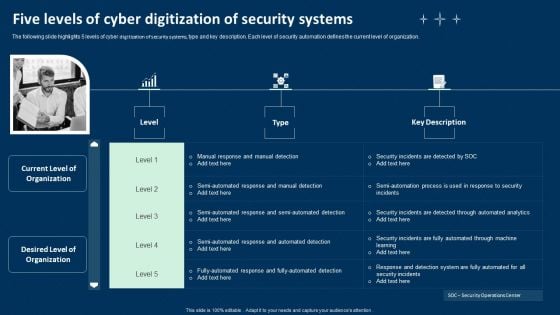
Five Levels Of Cyber Digitization Of Security Systems Ppt Infographics Graphics Tutorials PDF
The following slide highlights 5 levels of cyber digitization of security systems, type and key description. Each level of security automation defines the current level of organization. Presenting Five Levels Of Cyber Digitization Of Security Systems Ppt Infographics Graphics Tutorials PDF to dispense important information. This template comprises three stages. It also presents valuable insights into the topics including Investigating Steps, Security Analysts, Determining Responsive Action. This is a completely customizable PowerPoint theme that can be put to use immediately. So, download it and address the topic impactfully.
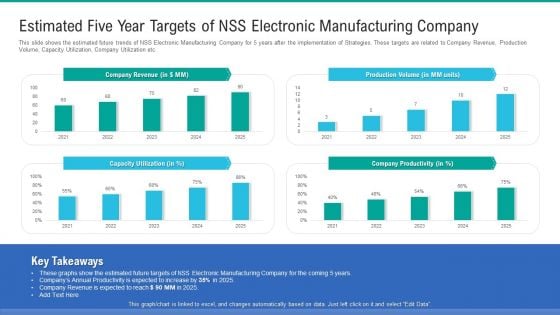
Estimated Five Year Targets Of NSS Electronic Manufacturing Company Infographics PDF
This slide shows the estimated future trends of NSS Electronic Manufacturing Company for 5 years after the implementation of Strategies. These targets are related to Company Revenue, Production Volume, Capacity Utilization, Company Utilization etc. Deliver an awe inspiring pitch with this creative estimated five year targets of nss electronic manufacturing company infographics pdf bundle. Topics like estimated five year targets of nss electronic manufacturing company can be discussed with this completely editable template. It is available for immediate download depending on the needs and requirements of the user.
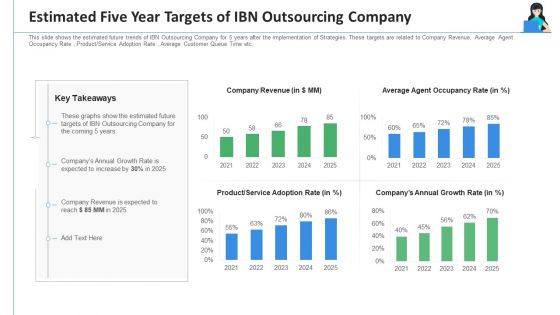
Estimated Five Year Targets Of IBN Outsourcing Company Ppt Infographics Demonstration PDF
This slide shows the estimated future trends of IBN Outsourcing Company for 5 years after the implementation of Strategies. These targets are related to Company Revenue, Average Agent Occupancy Rate , Product Service Adoption Rate , Average Customer Queue Time etc. Deliver and pitch your topic in the best possible manner with this estimated five year targets of IBN outsourcing company ppt infographics demonstration pdf. Use them to share invaluable insights on company revenue, product service, companys annual growth rate and impress your audience. This template can be altered and modified as per your expectations. So, grab it now.
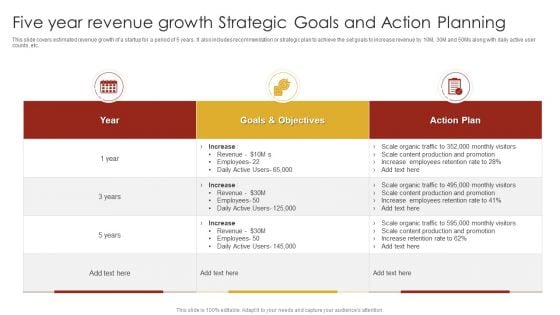
Five Year Revenue Growth Strategic Goals And Action Planning Infographics PDF
This slide covers estimated revenue growth of a startup for a period of 5 years. It also includes recommendation or strategic plan to achieve the set goals to increase revenue by 10M, 30M and 50Ms along with daily active user counts, etc. Showcasing this set of slides titled Five Year Revenue Growth Strategic Goals And Action Planning Infographics PDF. The topics addressed in these templates are Revenue, Employees, Scale Organic. All the content presented in this PPT design is completely editable. Download it and make adjustments in color, background, font etc. as per your unique business setting.
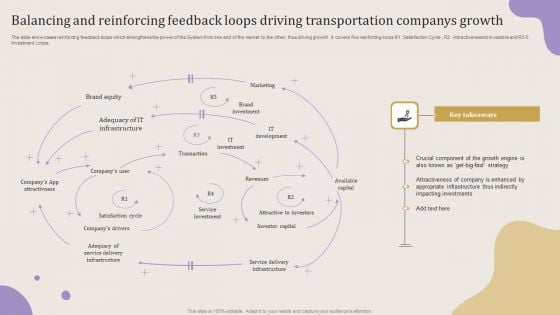
Balancing And Reinforcing Feedback Loops Driving Transportation Companys Growth Infographics PDF
The slide showcases reinforcing feedback loops which strengthens the power of the System from one end of the market to the other, thus driving growth. It covers five reinforcing loops R1 Satisfaction Cycle, R2 Attractiveness to Investors and R3 5 Investment Loops. Showcasing this set of slides titled Balancing And Reinforcing Feedback Loops Driving Transportation Companys Growth Infographics PDF. The topics addressed in these templates are Marketing, Brand Equity, Brand Investment. All the content presented in this PPT design is completely editable. Download it and make adjustments in color, background, font etc. as per your unique business setting.
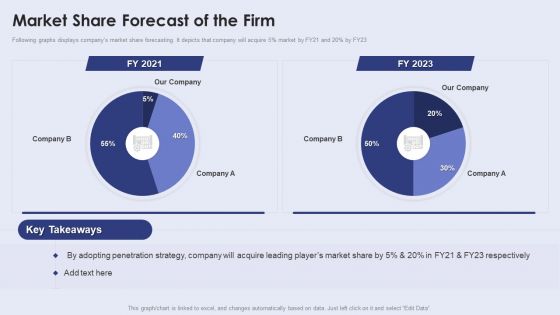
Creating New Product Launch Campaign Strategy Market Share Forecast Of The Firm Infographics PDF
Following graphs displays companys market share forecasting. It depicts that company will acquire 5 percent market by FY21 and 20 percent by FY23. This Creating New Product Launch Campaign Strategy Market Share Forecast Of The Firm Infographics PDF is perfect for any presentation, be it in front of clients or colleagues. It is a versatile and stylish solution for organizing your meetings. The product features a modern design for your presentation meetings. The adjustable and customizable slides provide unlimited possibilities for acing up your presentation. Slidegeeks has done all the homework before launching the product for you. So, dont wait, grab the presentation templates today.

Creating And Introducing A Web Based Application Development And Marketing Process Infographics PDF
This slide covers the project launch timeline for 5 months including releases, milestones, product integrations, UXandUI designs and meetings. Want to ace your presentation in front of a live audience Our Creating And Introducing A Web Based Application Development And Marketing Process Infographics PDF can help you do that by engaging all the users towards you.. Slidegeeks experts have put their efforts and expertise into creating these impeccable powerpoint presentations so that you can communicate your ideas clearly. Moreover, all the templates are customizable, and easy-to-edit and downloadable. Use these for both personal and commercial use.
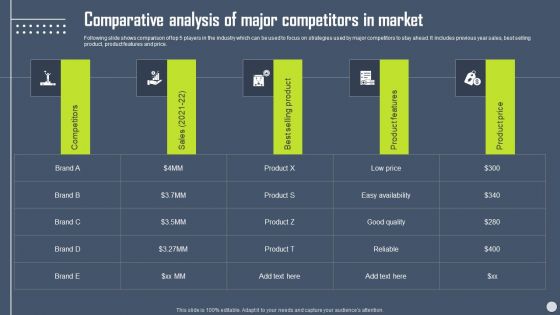
Boosting Yearly Business Revenue Comparative Analysis Of Major Competitors In Market Infographics PDF
Following slide shows comparison of top 5 players in the industry which can be used to focus on strategies used by major competitors to stay ahead. It includes previous year sales, best selling product, product features and price. If you are looking for a format to display your unique thoughts, then the professionally designed Boosting Yearly Business Revenue Comparative Analysis Of Major Competitors In Market Infographics PDF is the one for you. You can use it as a Google Slides template or a PowerPoint template. Incorporate impressive visuals, symbols, images, and other charts. Modify or reorganize the text boxes as you desire. Experiment with shade schemes and font pairings. Alter, share or cooperate with other people on your work. Download Boosting Yearly Business Revenue Comparative Analysis Of Major Competitors In Market Infographics PDF and find out how to give a successful presentation. Present a perfect display to your team and make your presentation unforgettable.
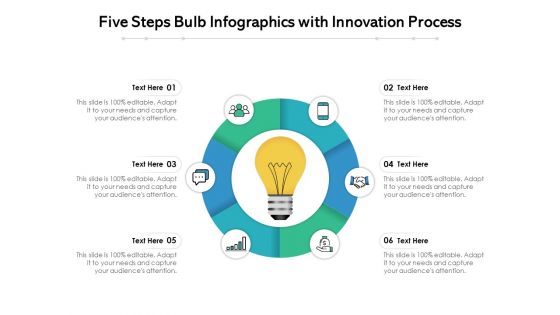
Five Steps Bulb Infographics With Innovation Process Ppt PowerPoint Presentation File Deck PDF
Presenting five steps bulb infographics with innovation process ppt powerpoint presentation file deck pdf to dispense important information. This template comprises six stages. It also presents valuable insights into the topics including five steps bulb infographics with innovation process. This is a completely customizable PowerPoint theme that can be put to use immediately. So, download it and address the topic impactfully.
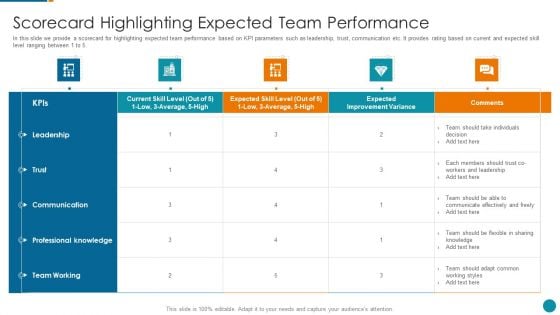
Strategic Procedure To Improve Employee Efficiency Scorecard Highlighting Expected Team Performance Infographics PDF
In this slide we provide a scorecard for highlighting expected team performance based on KPI parameters such as leadership, trust, communication etc. It provides rating based on current and expected skill level ranging between 1 to 5.Deliver an awe inspiring pitch with this creative strategic procedure to improve employee efficiency scorecard highlighting expected team performance infographics pdf bundle. Topics like professional knowledge, communication, leadership can be discussed with this completely editable template. It is available for immediate download depending on the needs and requirements of the user.
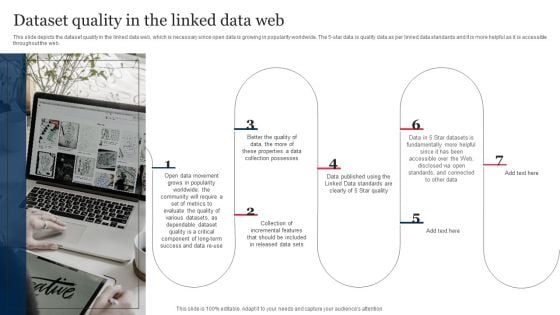
Dataset Quality In The Linked Data Web Integrating Linked Data To Enhance Operational Effectiveness Infographics PDF
This slide depicts the dataset quality in the linked data web, which is necessary since open data is growing in popularity worldwide. The 5-star data is quality data as per linked data standards and it is more helpful as it is accessible throughout the web.There are so many reasons you need a Dataset Quality In The Linked Data Web Integrating Linked Data To Enhance Operational Effectiveness Infographics PDF. The first reason is you can not spend time making everything from scratch, Thus, Slidegeeks has made presentation templates for you too. You can easily download these templates from our website easily.
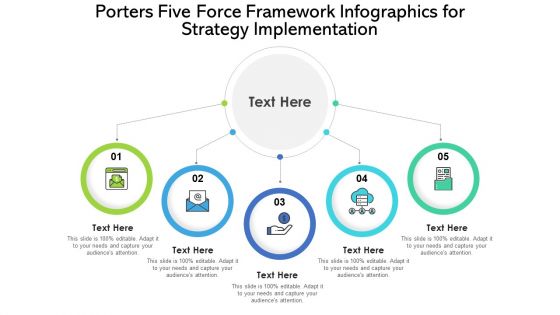
Porters Five Force Framework Infographics For Strategy Implementation Ppt PowerPoint Presentation File Graphics Design PDF
Presenting porters five force framework infographics for strategy implementation ppt powerpoint presentation file graphics design pdf to dispense important information. This template comprises five stages. It also presents valuable insights into the topics including porters five force framework infographics for strategy implementation This is a completely customizable PowerPoint theme that can be put to use immediately. So, download it and address the topic impactfully.
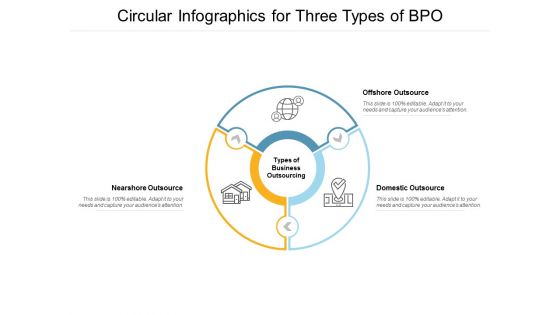
Circular Infographics For Three Types Of BPO Ppt PowerPoint Presentation Summary Microsoft
Presenting this set of slides with name circular infographics for three types of bpo ppt powerpoint presentation summary microsoft. This is a three stage process. The stages in this process are business process outsourcing, circular infographics, threats. This is a completely editable PowerPoint presentation and is available for immediate download. Download now and impress your audience.
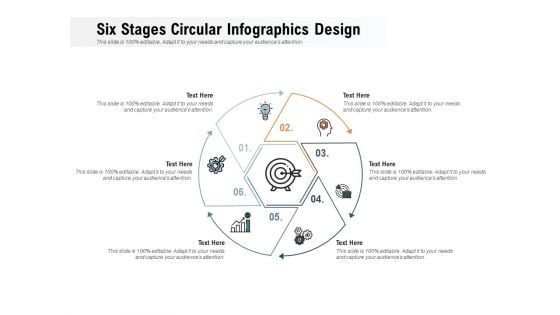
Six Stages Circular Infographics Design Ppt PowerPoint Presentation Outline Graphics Pictures
Presenting this set of slides with name six stages circular infographics design ppt powerpoint presentation outline graphics pictures. This is a six stage process. The stage in this process is six stages circular infographics design. This is a completely editable PowerPoint presentation and is available for immediate download. Download now and impress your audience.

Six Circular Arrows Diagram Infographics For Hire Purchase Loan Elements PDF
Presenting six circular arrows diagram infographics for hire purchase loan elements pdf to dispense important information. This template comprises six stages. It also presents valuable insights into the topics including six circular arrows diagram infographics for hire purchase loan. This is a completely customizable PowerPoint theme that can be put to use immediately. So, download it and address the topic impactfully.

Twelve Stages To Preparing Business Statement Ppt PowerPoint Presentation Infographics Graphics Template
Presenting this set of slides with name twelve stages to preparing business statement ppt powerpoint presentation infographics graphics template. This is a twelve stage process. The stages in this process are data report, infographics brochure, business statement. This is a completely editable PowerPoint presentation and is available for immediate download. Download now and impress your audience.

Connected Four Steps Business Process Infographics Ppt PowerPoint Presentation Gallery Inspiration
Presenting this set of slides with name connected four steps business process infographics ppt powerpoint presentation gallery inspiration. This is a four stage process. The stages in this process are connected four steps, business process, infographics. This is a completely editable PowerPoint presentation and is available for immediate download. Download now and impress your audience.
Company Four Stage Roadmap Infographics Ppt PowerPoint Presentation File Information PDF
Presenting this set of slides with name company four stage roadmap infographics ppt powerpoint presentation file information pdf. This is a four stage process. The stages in this process are company four stage roadmap infographics. This is a completely editable PowerPoint presentation and is available for immediate download. Download now and impress your audience.
3 Division Circle Infographics For Commission Structure Ppt PowerPoint Presentation File Designs PDF
Presenting 3 division circle infographics for commission structure ppt powerpoint presentation file designs pdf to dispense important information. This template comprises three stages. It also presents valuable insights into the topics including 3 division circle infographics for commission structure. This is a completely customizable PowerPoint theme that can be put to use immediately. So, download it and address the topic impactfully.
Eight Steps Infographics For Object Oriented Language Ppt PowerPoint Presentation Gallery Display PDF
Presenting eight steps infographics for object oriented language ppt powerpoint presentation gallery display pdf to dispense important information. This template comprises eight stages. It also presents valuable insights into the topics including eight steps infographics for object oriented language. This is a completely customizable PowerPoint theme that can be put to use immediately. So, download it and address the topic impactfully.
Curved Roadmap Infographics For Recession Proof Business Ppt PowerPoint Presentation File Background Image PDF
Presenting curved roadmap infographics for recession proof business ppt powerpoint presentation file background image pdf to dispense important information. This template comprises nine stages. It also presents valuable insights into the topics including curved roadmap infographics for recession proof business. This is a completely customizable PowerPoint theme that can be put to use immediately. So, download it and address the topic impactfully.

9 Process Diagram Infographics For Relevant Cost Ppt PowerPoint Presentation Model Slideshow PDF
Presenting 9 process diagram infographics for relevant cost ppt powerpoint presentation model slideshow pdf to dispense important information. This template comprises nine stages. It also presents valuable insights into the topics including 9 process diagram infographics for relevant cost. This is a completely customizable PowerPoint theme that can be put to use immediately. So, download it and address the topic impactfully.
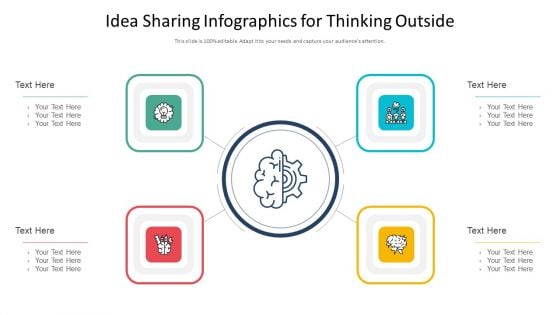
Idea Sharing Infographics For Thinking Outside Ppt PowerPoint Presentation File Tips PDF
Presenting idea sharing infographics for thinking outside ppt powerpoint presentation file tips pdf to dispense important information. This template comprises five stages. It also presents valuable insights into the topics including idea sharing infographics for thinking outside. This is a completely customizable PowerPoint theme that can be put to use immediately. So, download it and address the topic impactfully.
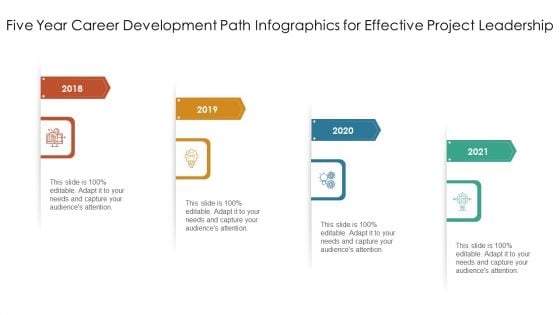
Five Year Career Development Path Infographics For Effective Project Leadership Ppt PowerPoint Presentation File Professional PDF
Presenting five year career development path infographics for effective project leadership ppt powerpoint presentation file professional pdf to dispense important information. This template comprises four stages. It also presents valuable insights into the topics including five year career development path infographics for effective project leadership This is a completely customizable PowerPoint theme that can be put to use immediately. So, download it and address the topic impactfully.
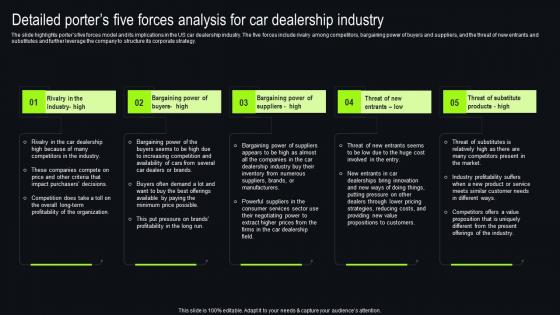
Detailed Porters Five Forces Analysis For Car New And Used Car Dealership Infographics Pdf
The slide highlights porters five forces model and its implications in the US car dealership industry. The five forces include rivalry among competitors, bargaining power of buyers and suppliers, and the threat of new entrants and substitutes and further leverage the company to structure its corporate strategy. Find highly impressive Detailed Porters Five Forces Analysis For Car New And Used Car Dealership Infographics Pdf on Slidegeeks to deliver a meaningful presentation. You can save an ample amount of time using these presentation templates. No need to worry to prepare everything from scratch because Slidegeeks experts have already done a huge research and work for you. You need to download Detailed Porters Five Forces Analysis For Car New And Used Car Dealership Infographics Pdf for your upcoming presentation. All the presentation templates are 100 percent editable and you can change the color and personalize the content accordingly. Download now The slide highlights porters five forces model and its implications in the US car dealership industry. The five forces include rivalry among competitors, bargaining power of buyers and suppliers, and the threat of new entrants and substitutes and further leverage the company to structure its corporate strategy.
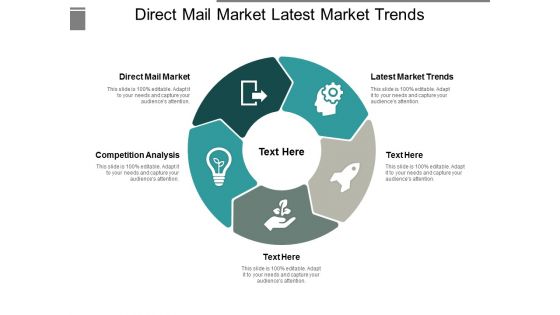
Direct Mail Market Latest Market Trends Competition Analysis Ppt PowerPoint Presentation Infographics Objects
This is a direct mail market latest market trends competition analysis ppt powerpoint presentation infographics objects. This is a five stage process. The stages in this process are direct mail market, latest market trends, competition analysis.
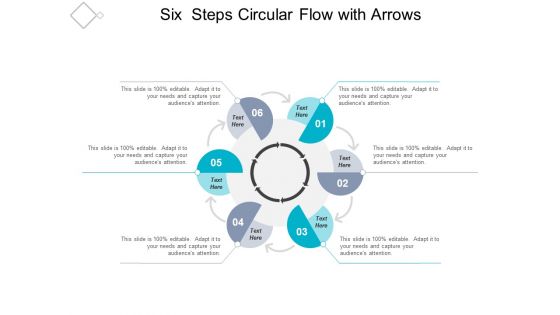
Six Steps Circular Flow With Arrows Ppt Powerpoint Presentation Infographics Good
This is a six steps circular flow with arrows ppt powerpoint presentation infographics good. This is a six stage process. The stages in this process are cycle diagram, circular process, cyclical process.
Nine Connected Steps In Circular Flow With Icons Ppt PowerPoint Presentation Infographics Themes
This is a nine connected steps in circular flow with icons ppt powerpoint presentation infographics themes. This is a nine stage process. The stages in this process are 10 circle, 10 circular diagram, 10 cycle.
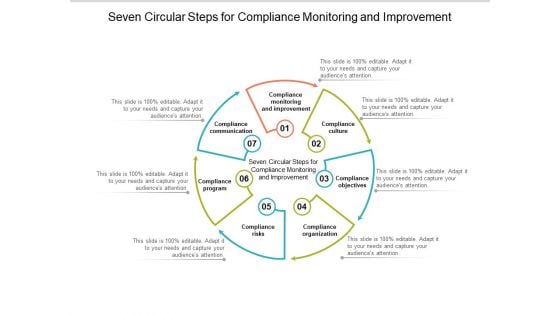
Seven Circular Steps For Compliance Monitoring And Improvement Ppt Powerpoint Presentation Infographics Professional
This is a seven circular steps for compliance monitoring and improvement ppt powerpoint presentation infographics professional. This is a seven stage process. The stages in this process are risk management, governance, compliance.
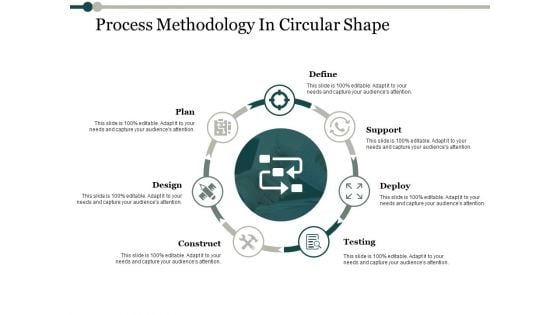
Process Methodology In Circular Shape Process Analysis Ppt PowerPoint Presentation Infographics Show
This is a process methodology in circular shape process analysis ppt powerpoint presentation infographics show. This is a seven stage process. The stages in this process are plan, support, deploy, testing, construct.

Purchasing And Logistics Management Circular Steps Ppt PowerPoint Presentation Infographics Portrait
This is a purchasing and logistics management circular steps ppt powerpoint presentation infographics portrait. This is a seven stage process. The stages in this process are purchasing, procurement, bidding.
Seven Concentric Circles With Pointers Text Holders Ppt Powerpoint Presentation Infographics Visual Aids
This is a seven concentric circles with pointers text holders ppt powerpoint presentation infographics visual aids. This is a seven stage process. The stages in this process are 7 concentric circles, 7 circular cycle, 7 circular diagram.
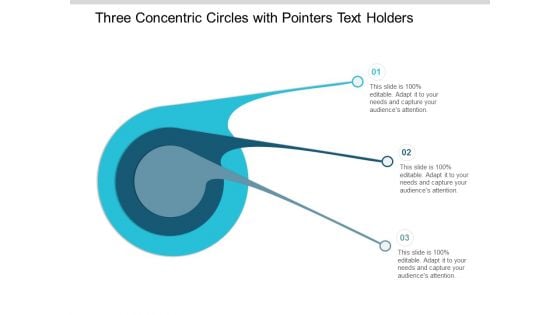
Three Concentric Circles With Pointers Text Holders Ppt Powerpoint Presentation Infographics Slides
This is a three concentric circles with pointers text holders ppt powerpoint presentation infographics slides. This is a three stage process. The stages in this process are 7 concentric circles, 7 circular cycle, 7 circular diagram.
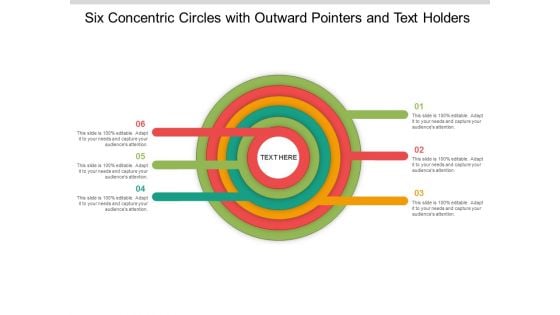
Six Concentric Circles With Outward Pointers And Text Holders Ppt Powerpoint Presentation Infographics Information
This is a six concentric circles with outward pointers and text holders ppt powerpoint presentation infographics information. This is a stage process. The stages in this process are 7 concentric circles, 7 circular cycle, 7 circular diagram.
Seven Steps Concentric Circles Process With Icons Ppt Powerpoint Presentation Infographics Introduction
This is a seven steps concentric circles process with icons ppt powerpoint presentation infographics introduction. This is a seven stage process. The stages in this process are 7 concentric circles, 7 circular cycle, 7 circular diagram.
Four Arrows Around Target Board With Icons Ppt Powerpoint Presentation Infographics Picture
This is a four arrows around target board with icons ppt powerpoint presentation infographics picture. This is a four stage process. The stages in this process are 6 Circular Arrows, 6 Cyclic Arrows, Six Circular Arrows.
Four Arrows With Icons For Business Process Flow Ppt Powerpoint Presentation Infographics File Formats
This is a four arrows with icons for business process flow ppt powerpoint presentation infographics file formats. This is a four stage process. The stages in this process are 6 Circular Arrows, 6 Cyclic Arrows, Six Circular Arrows.
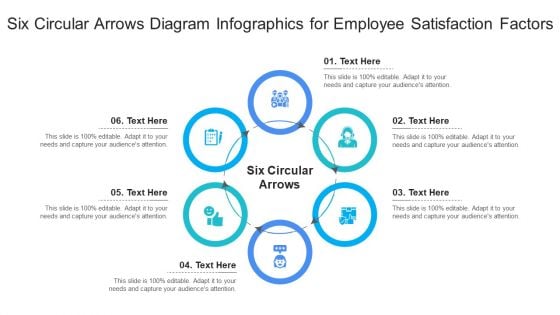
Six Circular Arrows Diagram Infographics For Employee Satisfaction Factors Pictures PDF
Persuade your audience using this six circular arrows diagram infographics for employee satisfaction factors pictures pdf. This PPT design covers six stages, thus making it a great tool to use. It also caters to a variety of topics including six circular arrows diagram infographics for employee satisfaction factors. Download this PPT design now to present a convincing pitch that not only emphasizes the topic but also showcases your presentation skills.
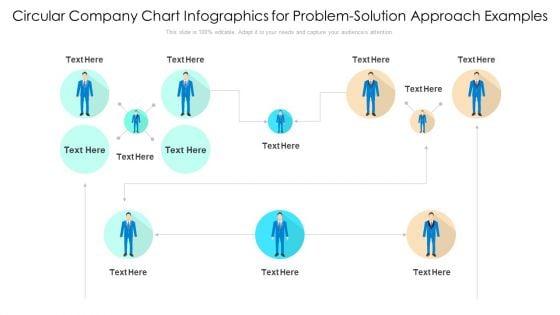
Circular Company Chart Infographics For Problem Solution Approach Examples Ppt PowerPoint Presentation File Visual Aids PDF
Persuade your audience using this circular company chart infographics for problem solution approach examples ppt powerpoint presentation file visual aids pdf. This PPT design covers one stages, thus making it a great tool to use. It also caters to a variety of topics including circular company chart infographics for problem solution approach examples. Download this PPT design now to present a convincing pitch that not only emphasizes the topic but also showcases your presentation skills.
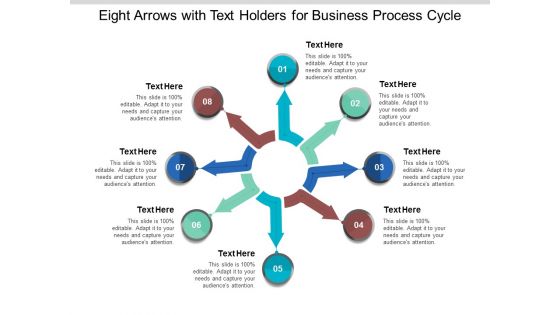
Eight Arrows With Text Holders For Business Process Cycle Ppt Powerpoint Presentation Infographics Example Introduction
This is a eight arrows with text holders for business process cycle ppt powerpoint presentation infographics example introduction. This is a eight stage process. The stages in this process are 6 circular arrows, 6 cyclic arrows, six circular arrows.

Workplace Stress And Time Management Ppt PowerPoint Presentation Infographics Designs Download
This is a workplace stress and time management ppt powerpoint presentation infographics designs download. This is a six stage process. The stages in this process are work life balance, work and leisure, career and ambition.
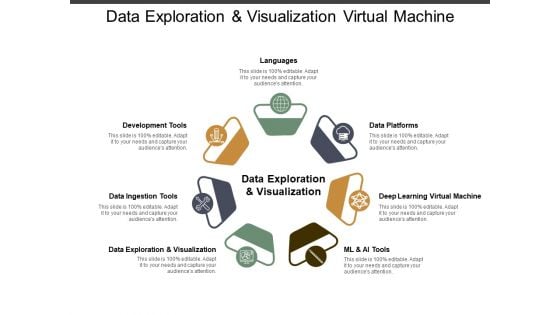
Data Exploration And Visualization Virtual Machine Ppt PowerPoint Presentation Infographics Diagrams
This is a data exploration and visualization virtual machine ppt powerpoint presentation infographics diagrams. This is a seven stage process. The stages in this process are data, analysis, data science, information science.
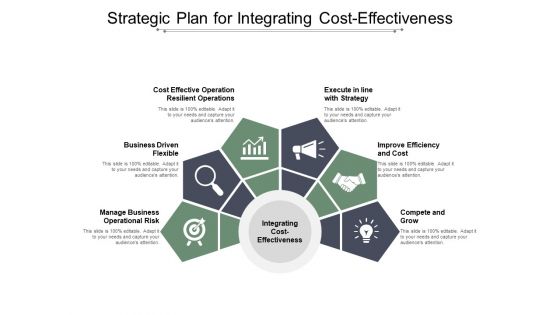
Strategic Plan For Integrating Cost Effectiveness Ppt PowerPoint Presentation Infographics Example
This is a strategic plan for integrating cost effectiveness ppt powerpoint presentation infographics example. This is a six stage process. The stages in this process are cost planning, cost efficiency, cost organization.
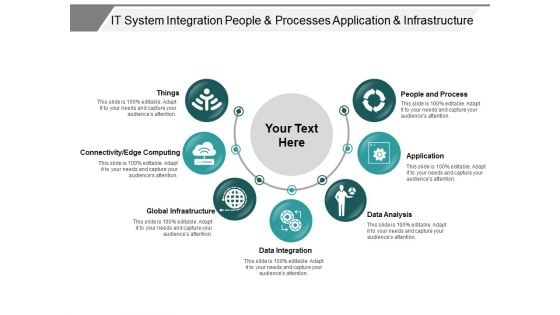
It System Integration People And Processes Application And Infrastructure Ppt PowerPoint Presentation Infographics Graphic Tips
This is a it system integration people and processes application and infrastructure ppt powerpoint presentation infographics graphic tips. This is a seven stage process. The stages in this process are osi model, technology layers, internetworking layer.
Three Stages Scp Paradigm With Icons Ppt Powerpoint Presentation Infographics Graphics
This is a three stages scp paradigm with icons ppt powerpoint presentation infographics graphics. This is a three stage process. The stages in this process are performance management, structure conduct performance, performance review and analysis.
Sperm With Male Female Icon Ppt Powerpoint Presentation Infographics Background Image
This is a sperm with male female icon ppt powerpoint presentation infographics background image. This is a two stage process. The stages in this process are fertility, productiveness, fecundity.
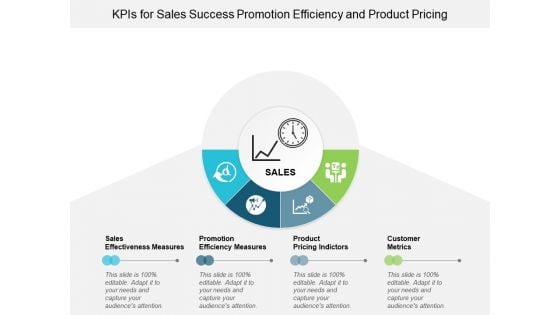
Kpis For Sales Success Promotion Efficiency And Product Pricing Ppt Powerpoint Presentation Infographics Background Images
This is a kpis for sales success promotion efficiency and product pricing ppt powerpoint presentation infographics background images. This is a four stage process. The stages in this process are dashboard, kpi, metrics.
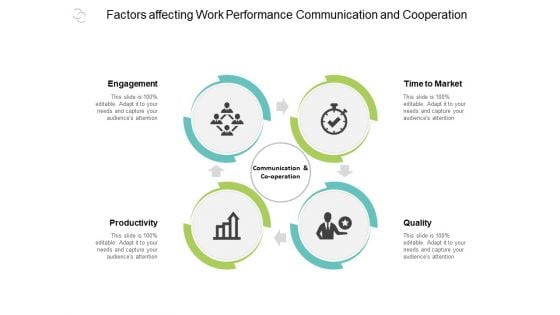
Factors Affecting Work Performance Communication And Cooperation Ppt Powerpoint Presentation Infographics Introduction
This is a factors affecting work performance communication and cooperation ppt powerpoint presentation infographics introduction. This is a four stage process. The stages in this process are business outcomes, business results, business output.
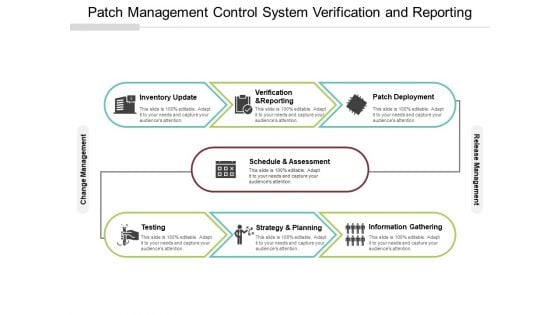
Patch Management Control System Verification And Reporting Ppt PowerPoint Presentation Infographics Backgrounds
This is a patch management control system verification and reporting ppt powerpoint presentation infographics backgrounds. This is a seven stage process. The stages in this process are patch management process, patch management procedure, patch management approach.
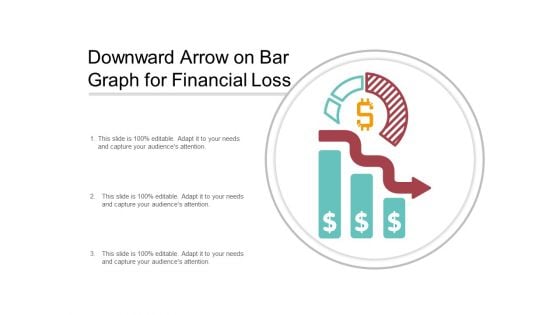
Downward Arrow On Bar Graph For Financial Loss Ppt PowerPoint Presentation Infographics Sample
This is a downward arrow on bar graph for financial loss ppt powerpoint presentation infographics sample. This is a three stage process. The stages in this process are business failure, unsuccessful business, business non success.

Implementing Clm Negotiate Approve Track And Renew Ppt PowerPoint Presentation Infographics Objects
This is a implementing clm negotiate approve track and renew ppt powerpoint presentation infographics objects. This is a eight stage process. The stages in this process are contract management, contract negotiation, deal making.
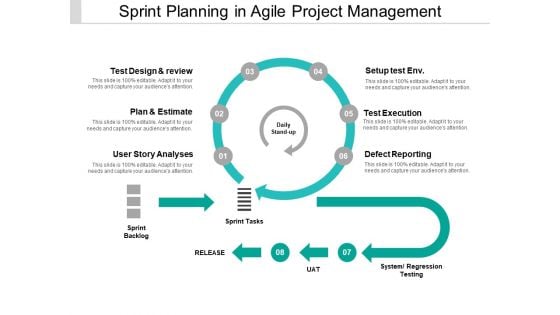
Sprint Planning In Agile Project Management Ppt PowerPoint Presentation Infographics Sample
This is a sprint planning in agile project management ppt powerpoint presentation infographics sample. This is a six stage process. The stages in this process are agile cycle, sprint cycle, scrum cycle.


 Continue with Email

 Home
Home


