5 Infographics
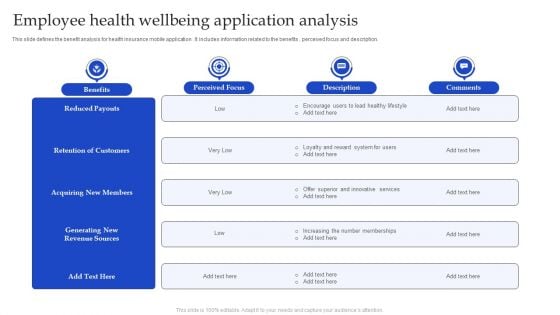
Employee Health Wellbeing Application Analysis Infographics PDF
This slide defines the benefit analysis for health insurance mobile application . It includes information related to the benefits , perceived focus and description. Presenting Employee Health Wellbeing Application Analysis Infographics PDF to dispense important information. This template comprises five stages. It also presents valuable insights into the topics including Retention Of Customers, Reduced Payouts, Innovative Services. This is a completely customizable PowerPoint theme that can be put to use immediately. So, download it and address the topic impactfully.
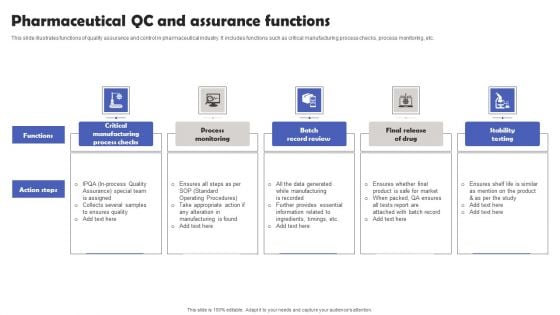
Pharmaceutical QC And Assurance Functions Infographics PDF
This slide illustrates functions of quality assurance and control in pharmaceutical industry. It includes functions such as critical manufacturing process checks, process monitoring, etc. Presenting Pharmaceutical QC And Assurance Functions Infographics PDF to dispense important information. This template comprises five stages. It also presents valuable insights into the topics including Process Monitoring, Batch Record Review, Stability Testing. This is a completely customizable PowerPoint theme that can be put to use immediately. So, download it and address the topic impactfully.
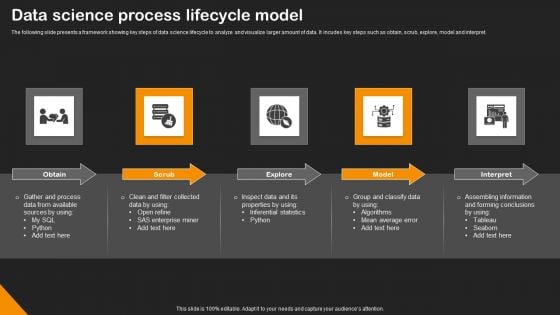
Data Science Process Lifecycle Model Infographics PDF
The following slide presents a framework showing key steps of data science lifecycle to analyze and visualize larger amount of data. It incudes key steps such as obtain, scrub, explore, model and interpret. Persuade your audience using this Data Science Process Lifecycle Model Infographics PDF. This PPT design covers five stages, thus making it a great tool to use. It also caters to a variety of topics including Scrub, Explore, Model, Interpret. Download this PPT design now to present a convincing pitch that not only emphasizes the topic but also showcases your presentation skills.
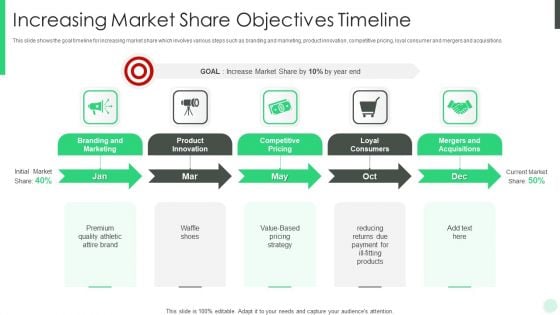
Increasing Market Share Objectives Timeline Infographics PDF
This slide shows the goal timeline for increasing market share which involves various steps such as branding and marketing, product innovation, competitive pricing, loyal consumer and mergers and acquisitions. Persuade your audience using this increasing market share objectives timeline infographics pdf. This PPT design covers five stages, thus making it a great tool to use. It also caters to a variety of topics including branding and marketing, product innovation, competitive pricing, loyal consumers. Download this PPT design now to present a convincing pitch that not only emphasizes the topic but also showcases your presentation skills.
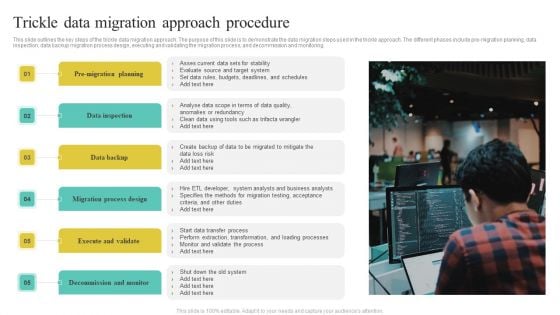
Trickle Data Migration Approach Procedure Infographics PDF
This slide outlines the key steps of the trickle data migration approach. The purpose of this slide is to demonstrate the data migration steps used in the trickle approach. The different phases include pre-migration planning, data inspection, data backup migration process design, executing and validating the migration process, and decommission and monitoring.Presenting Trickle Data Migration Approach Procedure Infographics PDF to dispense important information. This template comprises Five stages. It also presents valuable insights into the topics including Data Inspection, Data Backup, Execute And Validate . This is a completely customizable PowerPoint theme that can be put to use immediately. So, download it and address the topic impactfully.
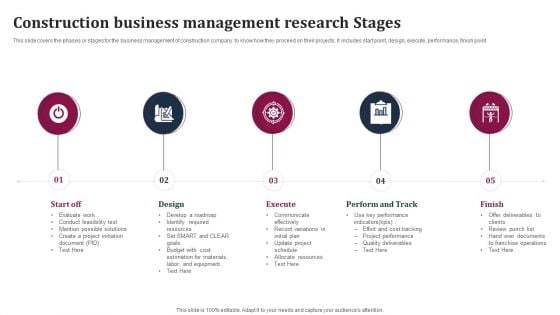
Construction Business Management Research Stages Infographics PDF
This slide covers the phases or stages for the business management of construction company to know how they proceed on their projects. It includes start point, design, execute, performance, finish point.Presenting Construction Business Management Research Stages Infographics PDF to dispense important information. This template comprises five stages. It also presents valuable insights into the topics including Communicate Effectively, Record Variations, Allocate Resources. This is a completely customizable PowerPoint theme that can be put to use immediately. So, download it and address the topic impactfully.
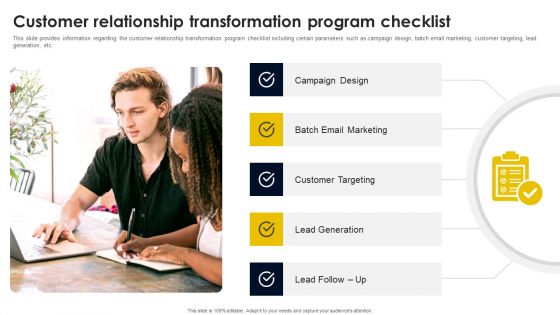
Customer Relationship Transformation Program Checklist Infographics PDF
This slide provides information regarding the customer relationship transformation program checklist including certain parameters such as campaign design, batch email marketing, customer targeting, lead generation, etc. Slidegeeks has constructed Customer Relationship Transformation Program Checklist Infographics PDF after conducting extensive research and examination. These presentation templates are constantly being generated and modified based on user preferences and critiques from editors. Here, you will find the most attractive templates for a range of purposes while taking into account ratings and remarks from users regarding the content. This is an excellent jumping-off point to explore our content and will give new users an insight into our top-notch PowerPoint Templates.
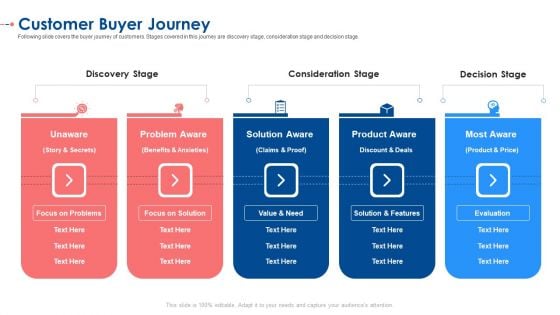
Customer Buyer Journey Ppt Infographics Mockup PDF
Following slide covers the buyer journey of customers. Stages covered in this journey are discovery stage, consideration stage and decision stage. This is a customer buyer journey ppt infographics mockup pdf. template with various stages. Focus and dispense information on five stages using this creative set, that comes with editable features. It contains large content boxes to add your information on topics like unaware, problem aware, solution aware, product aware, most aware . You can also showcase facts, figures, and other relevant content using this PPT layout. Grab it now.
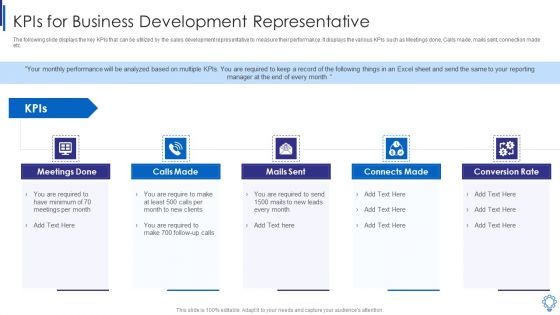
Kpis For Business Development Representative Infographics PDF
The following slide displays the key KPIs that can be utilized by the sales development representative to measure their performance. It displays the various KPIs such as Meetings done, Calls made, mails sent, connection made etc. This is a kpis for business development representative infographics pdf template with various stages. Focus and dispense information on five stages using this creative set, that comes with editable features. It contains large content boxes to add your information on topics like meetings done, mails sent, connects made, conversion rate, calls made. You can also showcase facts, figures, and other relevant content using this PPT layout. Grab it now.
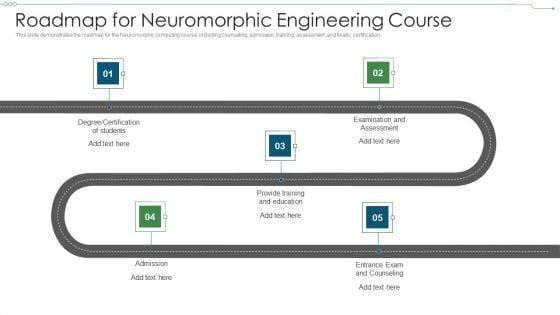
Roadmap For Neuromorphic Engineering Course Infographics PDF
This slide demonstrates the roadmap for the Neuromorphic computing course, including counseling, admission, training, assessment, and finally, certification. Presenting Roadmap For Neuromorphic Engineering Course Infographics PDF to provide visual cues and insights. Share and navigate important information on five stages that need your due attention. This template can be used to pitch topics like Degree Certification Of Students, Examination And Assessment, Provide Training And Education In addtion, this PPT design contains high resolution images, graphics, etc, that are easily editable and available for immediate download.

Developing Executive Management Team Expertise Infographics PDF
This slide mentions the executives involved that build management team of an organization which is responsible to drive change. It includes chief financial officer, director of marketing, director of human resources, chief technological officer and chief executive officer.Presenting Developing Executive Management Team Expertise Infographics PDF to dispense important information. This template comprises five stages. It also presents valuable insights into the topics including Financial Officer, Director Marketing, Director Human. This is a completely customizable PowerPoint theme that can be put to use immediately. So, download it and address the topic impactfully.
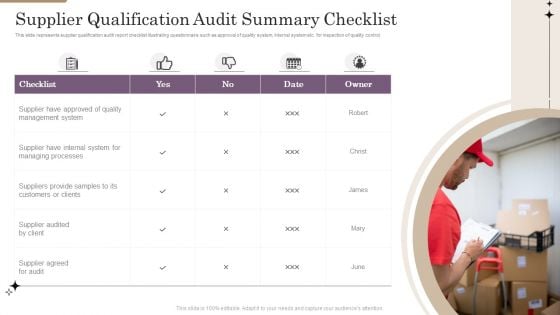
Supplier Qualification Audit Summary Checklist Infographics PDF
This slide represents supplier qualification audit report checklist illustrating questionnaire such as approval of quality system, internal system etc. for inspection of quality control. Persuade your audience using this Supplier Qualification Audit Summary Checklist Infographics PDF. This PPT design covers five stages, thus making it a great tool to use. It also caters to a variety of topics including Management System, Supplier, Quality. Download this PPT design now to present a convincing pitch that not only emphasizes the topic but also showcases your presentation skills.

Cryptocurrency Ledger Public Blockchain Technology Infographics PDF
This slide depicts the public blockchain technology framework and how data is stored in the public blockchain, bitcoin, voting are few examples of the public blockchain. Presenting Cryptocurrency Ledger Public Blockchain Technology Infographics PDF to provide visual cues and insights. Share and navigate important information on five stages that need your due attention. This template can be used to pitch topics like Network, Secure Method, Security Protocols Sincerely. In addtion, this PPT design contains high resolution images, graphics, etc, that are easily editable and available for immediate download.
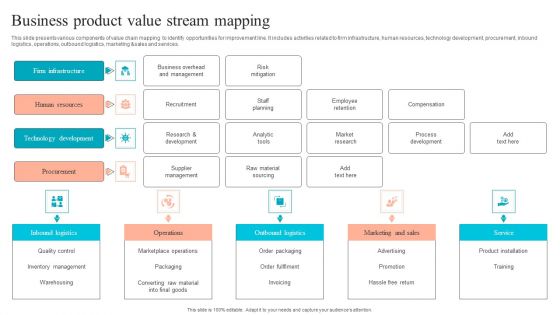
Business Product Value Stream Mapping Infographics PDF
This slide presents various components of value chain mapping to identify opportunities for improvement line. It includes activities related to firm infrastructure, human resources, technology development, procurement, inbound logistics, operations, outbound logistics, marketing and sales and services. Presenting Business Product Value Stream Mapping Infographics PDF to dispense important information. This template comprises five stages. It also presents valuable insights into the topics including Inbound Logistics, Operations, Outbound Logistics. This is a completely customizable PowerPoint theme that can be put to use immediately. So, download it and address the topic impactfully.
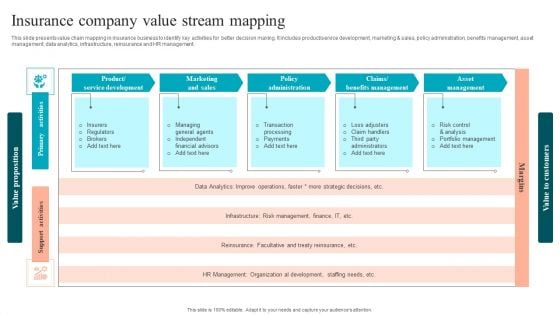
Insurance Company Value Stream Mapping Infographics PDF
This slide presents value chain mapping in insurance business to identify key activities for better decision making. It includes product service development, marketing and sales, policy administration, benefits management, asset management, data analytics, infrastructure, reinsurance and HR management. Presenting Insurance Company Value Stream Mapping Infographics PDF to dispense important information. This template comprises five stages. It also presents valuable insights into the topics including Product Service Development, Marketing Sales, Policy Administration. This is a completely customizable PowerPoint theme that can be put to use immediately. So, download it and address the topic impactfully.
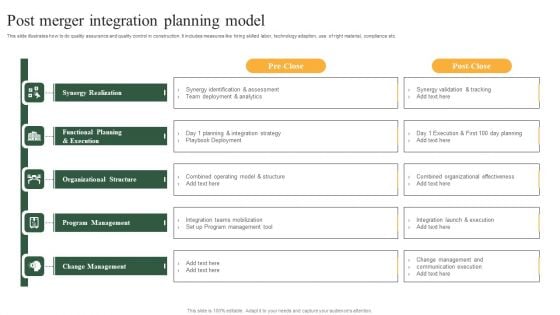
Post Merger Integration Planning Model Infographics PDF
This slide illustrates how to do quality assurance and quality control in construction. It includes measures like hiring skilled labor, technology adaption, use of right material, compliance etc. Presenting Post Merger Integration Planning Model Infographics PDF to dispense important information. This template comprises five stages. It also presents valuable insights into the topics including Synergy Realization, Functional Planning And Execution, Organizational Structure, Program Management, Change Management. This is a completely customizable PowerPoint theme that can be put to use immediately. So, download it and address the topic impactfully.
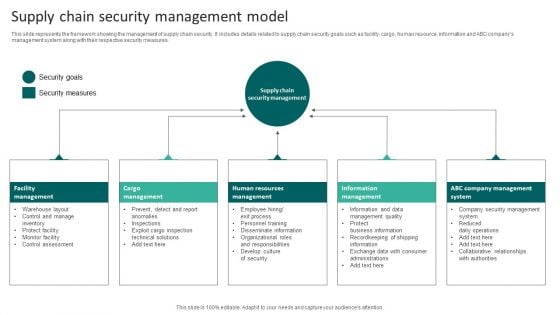
Supply Chain Security Management Model Infographics PDF
This slide represents the framework showing the management of supply chain security. It includes details related to supply chain security goals such as facility, cargo, human resource, information and ABC companys management system along with their respective security measures. Presenting Supply Chain Security Management Model Infographics PDF to dispense important information. This template comprises five stages. It also presents valuable insights into the topics including Human Resources Management, Cargo Management, Facility Management. This is a completely customizable PowerPoint theme that can be put to use immediately. So, download it and address the topic impactfully.
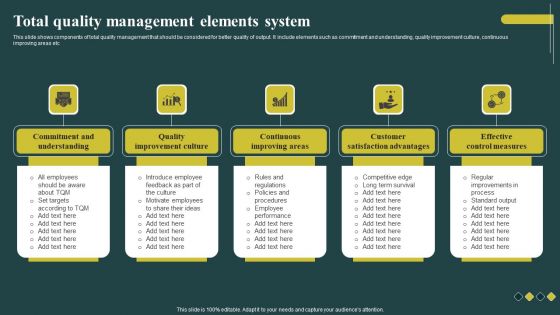
Total Quality Management Elements System Infographics PDF
This slide shows components of total quality management that should be considered for better quality of output. It include elements such as commitment and understanding, quality improvement culture, continuous improving areas etc. Persuade your audience using this Total Quality Management Elements System Infographics PDF. This PPT design covers five stages, thus making it a great tool to use. It also caters to a variety of topics including Continuous Improving Areas, Customer Satisfaction Advantages, Effective Control Measures. Download this PPT design now to present a convincing pitch that not only emphasizes the topic but also showcases your presentation skills.
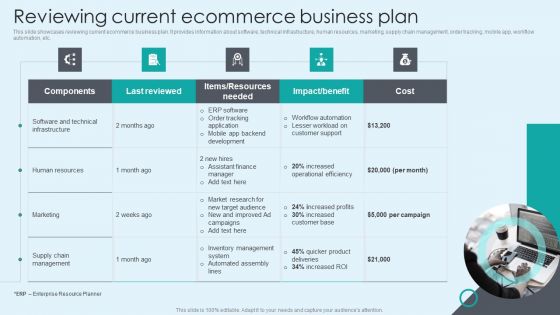
Reviewing Current Ecommerce Business Plan Infographics PDF
This slide showcases reviewing current ecommerce business plan. It provides information about software, technical infrastructure, human resources, marketing, supply chain management, order tracking, mobile app, workflow automation, etc. The best PPT templates are a great way to save time, energy, and resources. Slidegeeks have 100 percent editable powerpoint slides making them incredibly versatile. With these quality presentation templates, you can create a captivating and memorable presentation by combining visually appealing slides and effectively communicating your message. Download Reviewing Current Ecommerce Business Plan Infographics PDF from Slidegeeks and deliver a wonderful presentation.
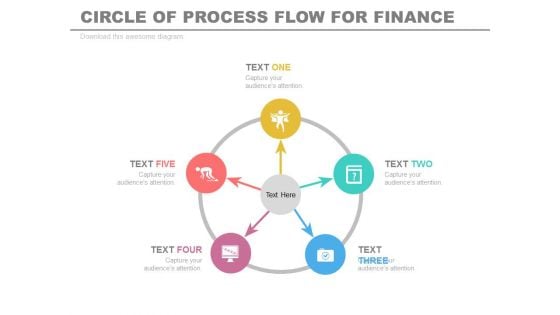
Five Steps Circular Infographics Diagram Powerpoint Template
This PowerPoint template has been designed with circular infographic diagram. This Infographic diagram may be used for business process analysis. Download this impressive diagram to build unique presentations.
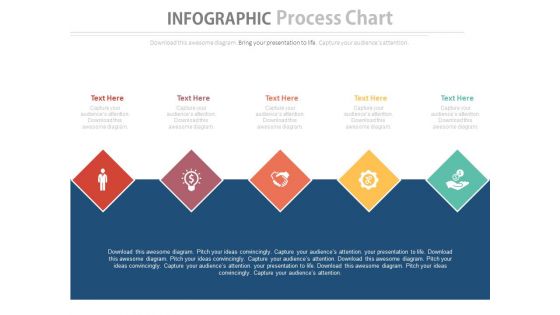
Linear Steps Infographics Process Chart Powerpoint Template
Download this exclusive business diagram to present strategic planning steps. This PowerPoint template contains linear steps infographic chart. Above slide provide ideal backdrop to make business presentations.
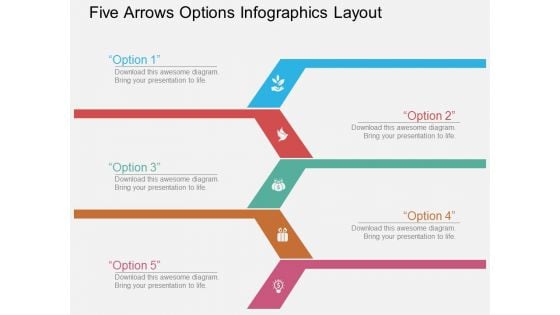
Five Arrows Options Infographics Layout Powerpoint Template
The above PPT template displays five options infographic layout. This PowerPoint diagram helps to display five business options. Adjust the above diagram in your business presentations to visually support your content.
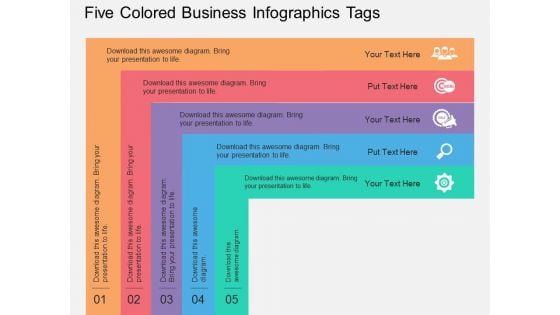
Five Colored Business Infographics Tags Powerpoint Template
Develop competitive advantage with our above template which contains business infographic tags. This diagram helps to display business information in visual manner. You can edit text, color, shade and style as per you need.
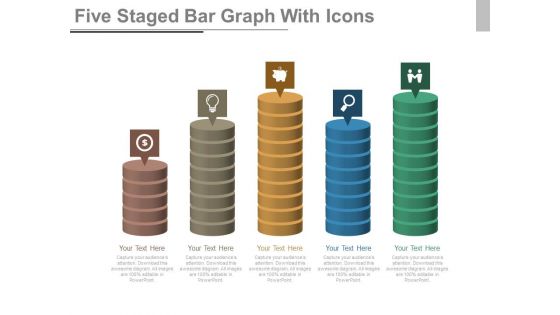
Infographics For Company Mission Statement Powerpoint Slides
This PowerPoint template has been designed with clock infographic hart. This PPT slide can be used to prepare presentations on company mission and also for time management. You can download finance PowerPoint template to prepare awesome presentations.
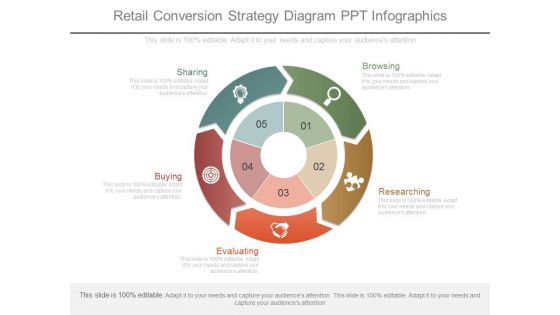
Retail Conversion Strategy Diagram Ppt Infographics
This is a retail conversion strategy diagram ppt infographics. This is a five stage process. The stages in this process are sharing, browsing, buying, researching, evaluating.
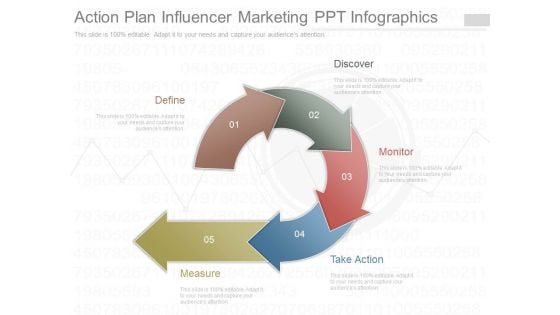
Action Plan Influencer Marketing Ppt Infographics
This is a action plan influencer marketing ppt infographics. This is a five stage process. The stages in this process are define, discover, monitor, take action, measure.
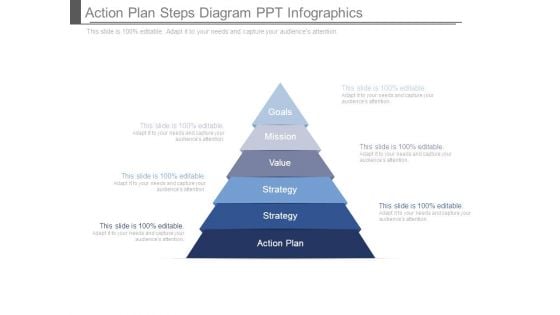
Action Plan Steps Diagram Ppt Infographics
This is a action plan steps diagram ppt infographics. This is a five stage process. The stages in this process are goals, mission, value, strategy, strategy, action plan.
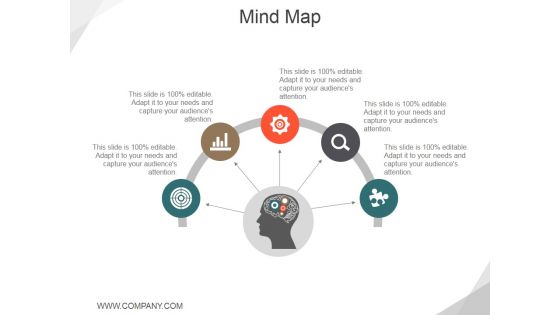
Mind Map Ppt PowerPoint Presentation File Infographics
This is a mind map ppt powerpoint presentation file infographics. This is a five stage process. The stages in this process are semi, icons, management, strategy.
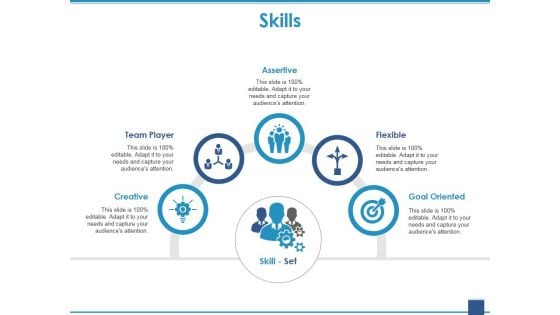
Skills Ppt PowerPoint Presentation Model Infographics
This is a skills ppt powerpoint presentation model infographics. This is a five stage process. The stages in this process are assertive, team player, creative, flexible, goal oriented.
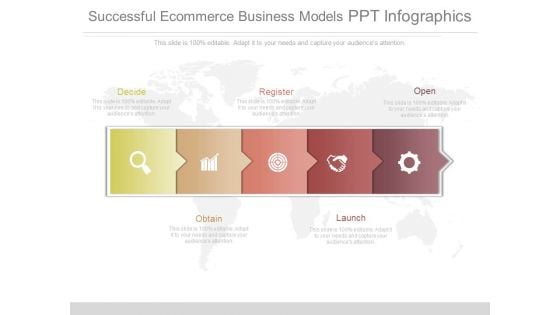
Successful Ecommerce Business Models Ppt Infographics
This is a successful ecommerce business models ppt infographics. This is a five stage process. The stages in this process are decide, register, open, obtain, launch.
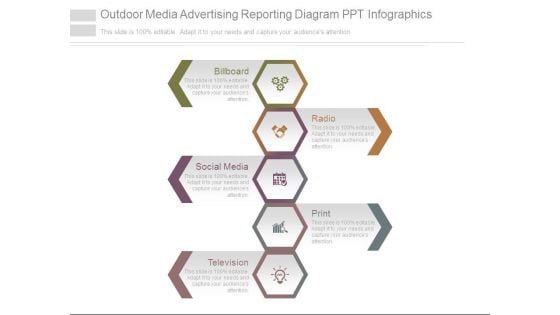
Outdoor Media Advertising Reporting Diagram Ppt Infographics
This is a outdoor media advertising reporting diagram ppt infographics. This is a five stage process. The stages in this process are billboard, radio, social media, print, television.
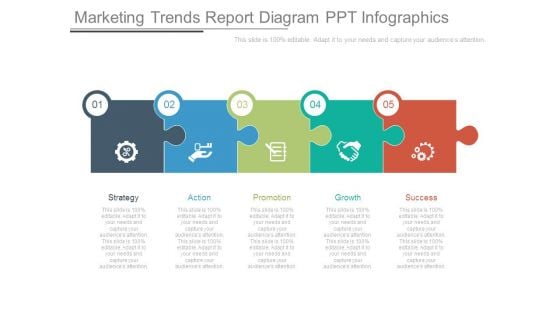
Marketing Trends Report Diagram Ppt Infographics
This is a marketing trends report diagram ppt infographics. This is a five stage process. The stages in this process are strategy, action, promotion, growth, success.
Stages Of Project Process Ppt Infographics
This is a stages of project process ppt infographics. This is a five stage process. The stages in this process are business, marketing, gears, industrial.
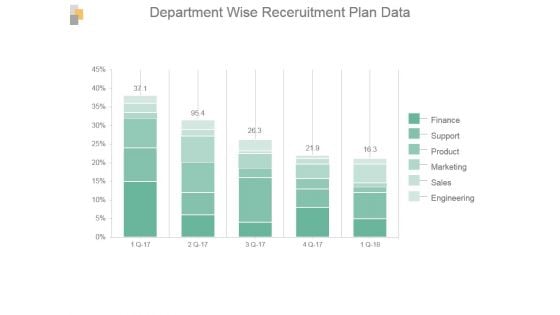
Department Wise Recruitment Plan Data Ppt Infographics
This is a department wise recruitment plan data ppt infographics. This is a five stage process. The stages in this process are finance, support, product, marketing, sales, engineering.
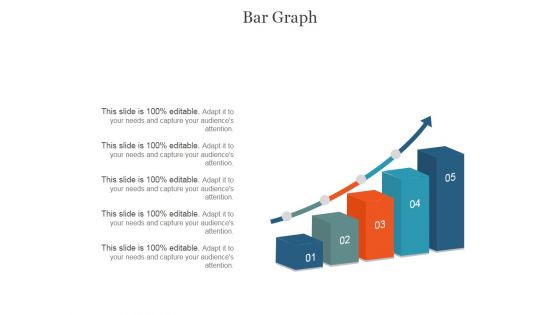
Bar Graph Ppt PowerPoint Presentation Infographics
This is a bar graph ppt powerpoint presentation infographics. This is a five stage process. The stages in this process are business, management, marketing, bar graph, analysis.
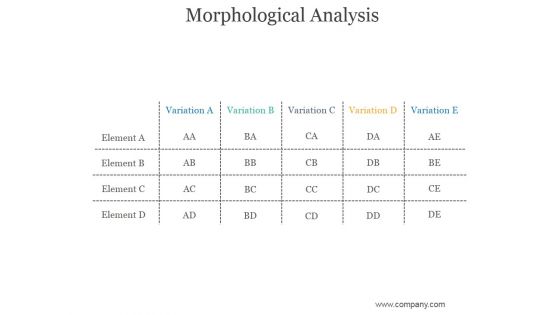
Morphological Analysis Ppt PowerPoint Presentation Infographics
This is a morphological analysis ppt powerpoint presentation infographics. This is a five stage process. The stages in this process are variation, element, business, marketing, success.
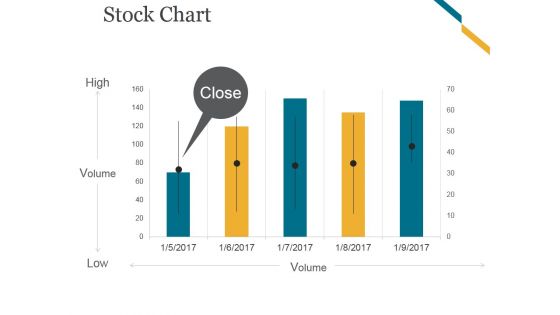
Stock Chart Ppt PowerPoint Presentation Infographics
This is a stock chart ppt powerpoint presentation infographics. This is a five stage process. The stages in this process are high, volume, low.
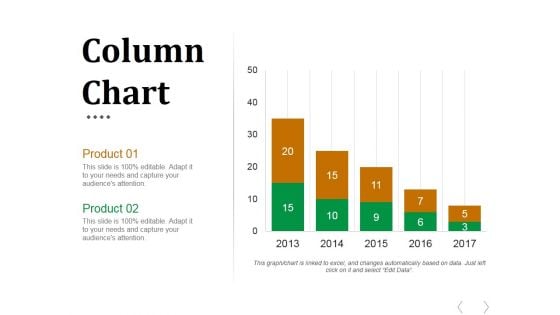
Column Chart Ppt PowerPoint Presentation Slides Infographics
This is a column chart ppt powerpoint presentation slides infographics. This is a five stage process. The stages in this process are business, marketing, management, column chart, timeline.
Timeline Ppt PowerPoint Presentation Icon Infographics
This is a timeline ppt powerpoint presentation icon infographics. This is a five stage process. The stages in this process are timeline, business, marketing, success, planning.
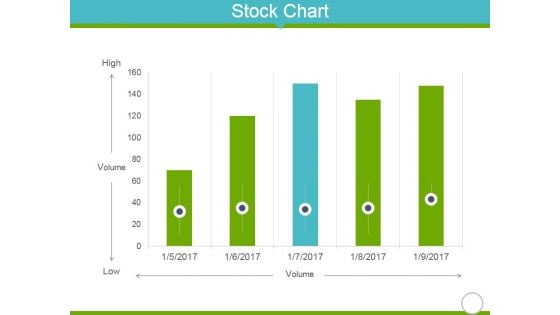
Stock Chart Ppt PowerPoint Presentation Portfolio Infographics
This is a stock chart ppt powerpoint presentation portfolio infographics. This is a five stage process. The stages in this process are high, volume, low, finance, business.
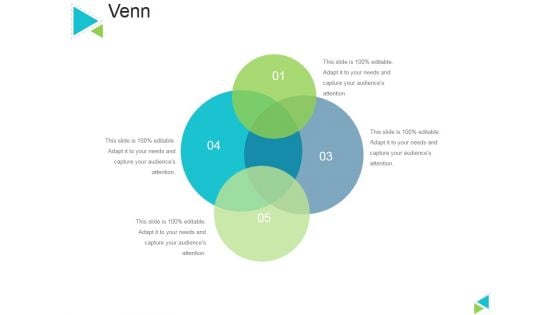
Venn Ppt PowerPoint Presentation Gallery Infographics
This is a venn ppt powerpoint presentation gallery infographics. This is a five stage process. The stages in this process are venn, business, marketing, process, management.

Iso Certificate Ppt PowerPoint Presentation Portfolio Infographics
This is a iso certificate ppt powerpoint presentation portfolio infographics. This is a five stage process. The stages in this process are certification, business, management, marketing, strategy.
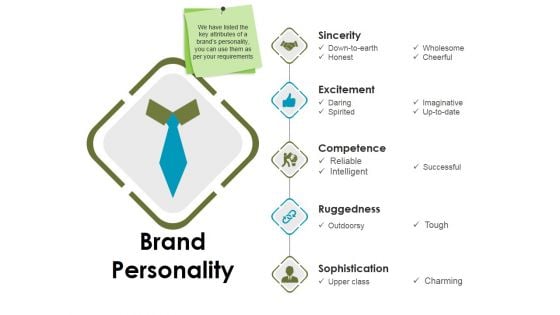
Brand Personality Ppt PowerPoint Presentation Pictures Infographics
This is a brand personality ppt powerpoint presentation pictures infographics. This is a five stage process. The stages in this process are sincerity, excitement, competence, ruggedness, sophistication.

Puzzle Ppt PowerPoint Presentation Layouts Infographics
This is a puzzle ppt powerpoint presentation layouts infographics. This is a five stage process. The stages in this process are business, marketing, puzzle, strategy, planning.
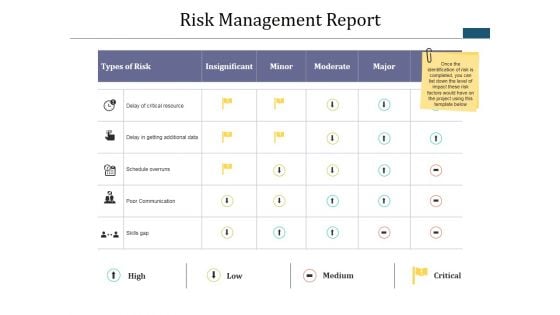
Risk Management Report Ppt PowerPoint Presentation Infographics
This is a risk management report ppt powerpoint presentation infographics. This is a five stage process. The stages in this process are insignificant, minor, moderate, major, severe.
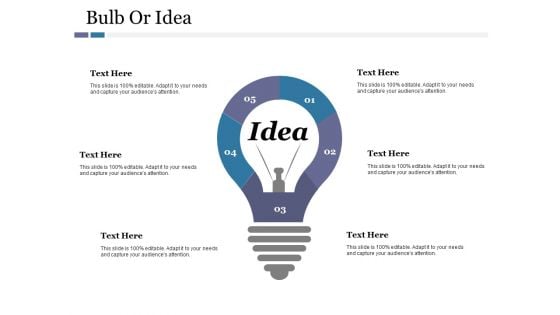
Bulb Or Idea Ppt PowerPoint Presentation Infographics
This is a bulb or idea ppt powerpoint presentation infographics. This is a five stage process. The stages in this process are bulb, technology, marketing, strategy, idea, business.
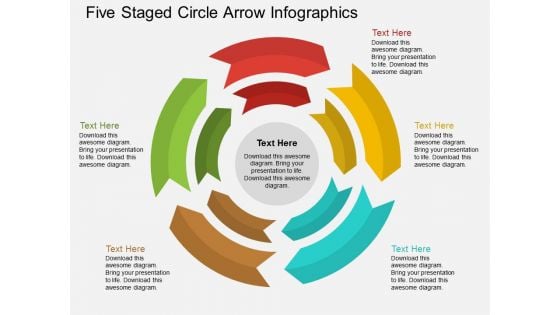
Five Staged Circle Arrow Infographics Powerpoint Template
This pre-designed and appealing graphics offer an optimized possibility to illustrate your business strategy. This PowerPoint slide displays five staged circle arrow infographic. You can present your opinions using this impressive slide.
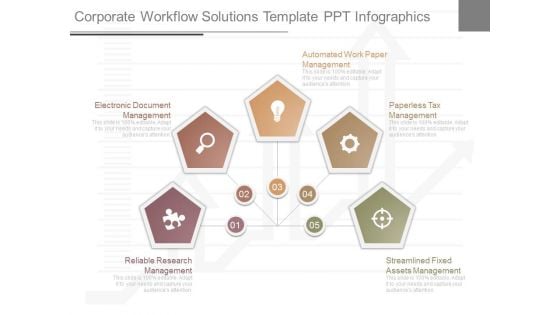
Corporate Workflow Solutions Template Ppt Infographics
This is a corporate workflow solutions template ppt infographics. This is a five stage process. The stages in this process are reliable research management, electronic document management, automated work paper management, paperless tax management, streamlined fixed assets management.
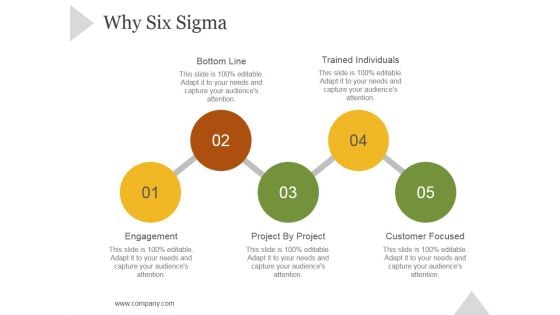
Why Six Sigma Ppt PowerPoint Presentation Infographics
This is a why six sigma ppt powerpoint presentation infographics. This is a five stage process. The stages in this process are bottom line, trained individuals, engagement, project by project, customer focused.
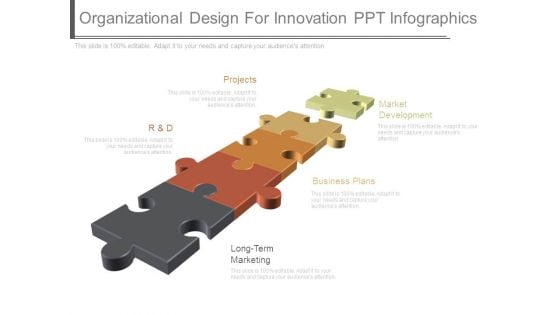
Organizational Design For Innovation Ppt Infographics
This is a organizational design for innovation ppt infographics. This is a five stage process. The stages in this process are projects, r and d, market development, business plans, long term marketing.
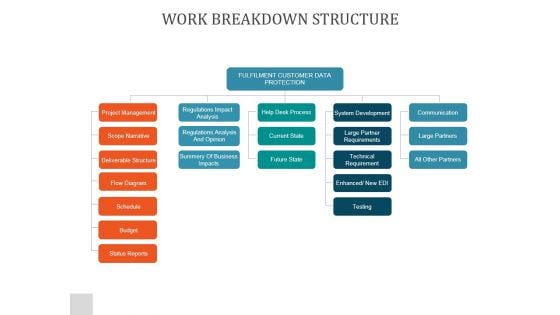
Work Breakdown Structure Ppt PowerPoint Presentation Infographics
This is a work breakdown structure ppt powerpoint presentation infographics. This is a five stage process. The stages in this process are fulfilment customer data protection, project management, regulations impact analysis, help desk process, system development, communication, scope narrative.
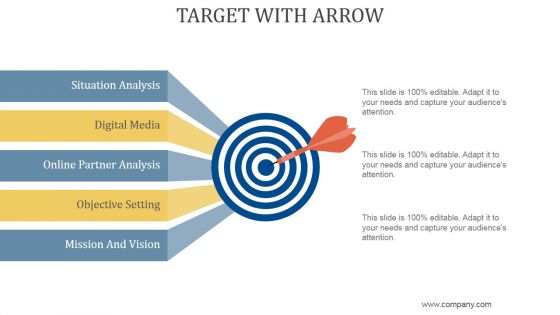
Target With Arrow Ppt PowerPoint Presentation Infographics
This is a target with arrow ppt powerpoint presentation infographics. This is a five stage process. The stages in this process are situation analysis, digital media, online partner analysis, objective setting, mission and vision.
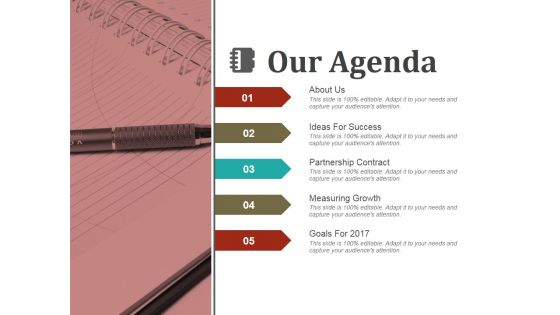
Our Agenda Ppt PowerPoint Presentation Infographics
This is a our agenda ppt powerpoint presentation infographics. This is a five stage process. The stages in this process are about us, ideas for success, partnership contract, measuring growth.
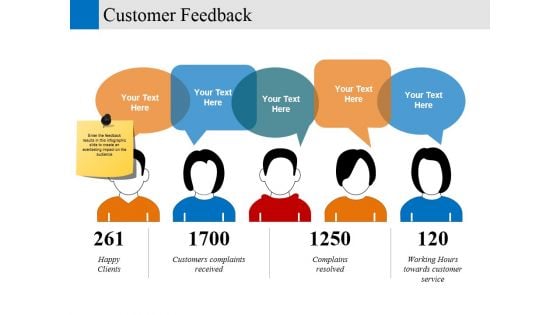
customer feedback ppt powerpoint presentation portfolio infographics
This is a customer feedback ppt powerpoint presentation portfolio infographics. This is a five stage process. The stages in this process are happy, clients, customers complaints received, complains resolved, working hours towards customer service, business.

Erp Integration Process Ppt PowerPoint Presentation Infographics
This is a erp integration process ppt powerpoint presentation infographics. This is a five stage process. The stages in this process are demand forecasting, data management, financials, enterprise resource planning, supply chain management, supply chain strategy and planning, logistics and distribution, product life cycle management, procurement, integrated forecast.
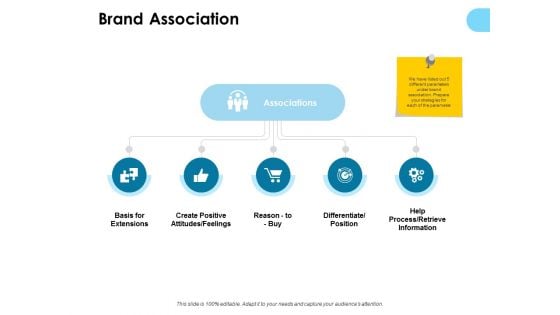
Brand Association Ppt PowerPoint Presentation Gallery Infographics
Presenting this set of slides with name brand association ppt powerpoint presentation gallery infographics. This is a five stage process. The stages in this process are business, management, planning, strategy, marketing. This is a completely editable PowerPoint presentation and is available for immediate download. Download now and impress your audience.
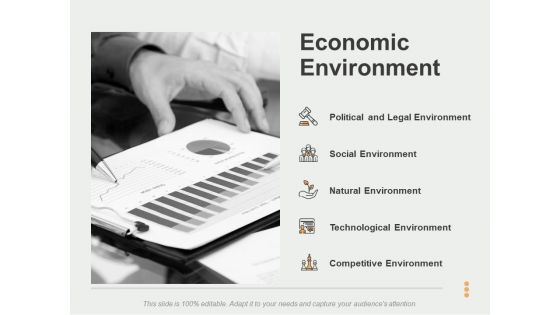
Economic Environment Ppt PowerPoint Presentation Gallery Infographics
Presenting this set of slides with name economic environment ppt powerpoint presentation gallery infographics. This is a five stage process. The stages in this process are political and legal environment, social environment, natural environment, technological environment, competitive environment. This is a completely editable PowerPoint presentation and is available for immediate download. Download now and impress your audience.

Content Ppt PowerPoint Presentation Pictures Infographics
Presenting this set of slides with name content ppt powerpoint presentation pictures infographics. This is a five stage process. The stages in this process are overview, determining the environmental areas to monitor, environmental analysis, identifying the significant changes in environment, forecasting the impact. This is a completely editable PowerPoint presentation and is available for immediate download. Download now and impress your audience.
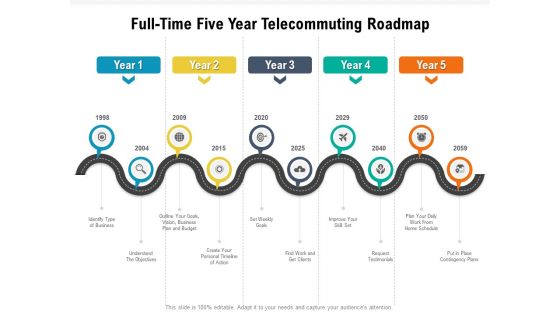
Full Time Five Year Telecommuting Roadmap Infographics
Presenting the full time five year telecommuting roadmap infographics. The template includes a roadmap that can be used to initiate a strategic plan. Not only this, the PowerPoint slideshow is completely editable and you can effortlessly modify the font size, font type, and shapes according to your needs. This PPT slide can be easily reached in standard screen and widescreen aspect ratios. The set is also available in various formats like PDF, PNG, and JPG. So download and use it multiple times as per your knowledge.
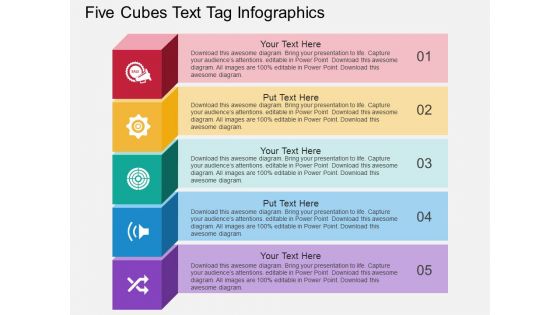
Five Cubes Text Tag Infographics Powerpoint Template
This business slide has been designed with cubes text tag infographic. You may download this PowerPoint template to display chain of business steps. This PPT diagram slide will help you to sequence your thoughts.


 Continue with Email

 Home
Home


