5 Points
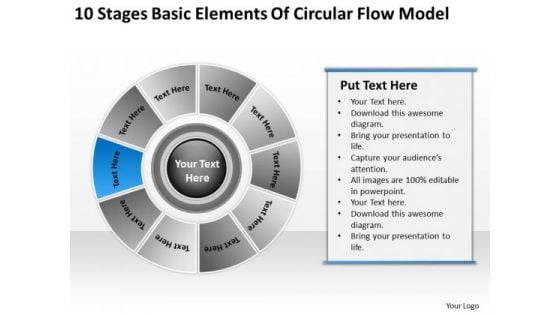
10 Stages Basic Elements Of Circular Flow Model Business Plan PowerPoint Templates
We present our 10 stages basic elements of circular flow model business plan PowerPoint templates.Use our Business PowerPoint Templates because Our PowerPoint Templates and Slides are focused like a searchlight beam. They highlight your ideas for your target audience. Download and present our Shapes PowerPoint Templates because You can Be the star of the show with our PowerPoint Templates and Slides. Rock the stage with your ideas. Present our Process and Flows PowerPoint Templates because Our PowerPoint Templates and Slides offer you the widest possible range of options. Download our Circle Charts PowerPoint Templates because You have gained great respect for your brilliant ideas. Use our PowerPoint Templates and Slides to strengthen and enhance your reputation. Download our Success PowerPoint Templates because Your audience will believe you are the cats whiskers.Use these PowerPoint slides for presentations relating to flow, business, chart, strategic, objectives, clear, corporate, plan, glowing, assessments, vector, diagram, circle, graphic, process, main, initiatives, element, final, shape, graph, illustration, icon, pie, round, clipart, design, clip, text, transparent, infographic, targets, art, puzzle. The prominent colors used in the PowerPoint template are Blue, Black, Gray. Our 10 Stages Basic Elements Of Circular Flow Model Business Plan PowerPoint Templates are destined to meet your standards. They conform to your exacting demands.
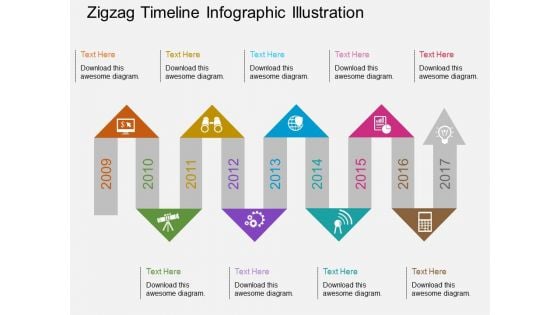
Zigzag Timeline Infographic Illustration Powerpoint Template
This PowerPoint template displays year based zigzag timeline diagram. This PPT slide helps in thoughtful interaction with your viewers. Imprint your concepts with this PPT slide in your presentations.
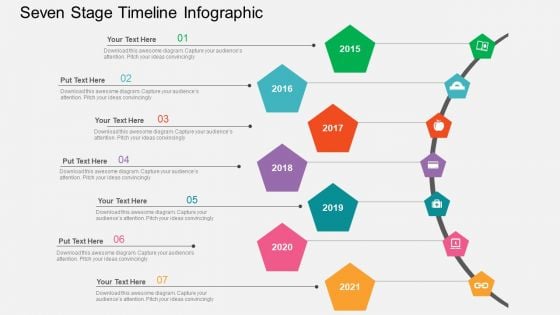
Seven Stage Timeline Infographic Powerpoint Templates
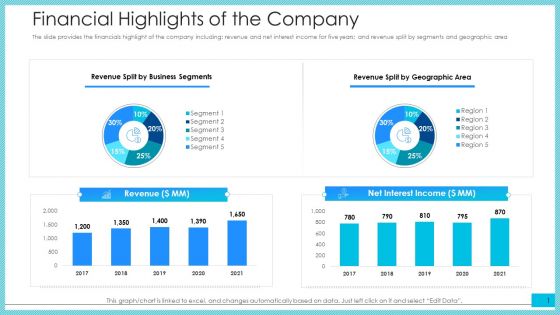
Financial Highlights Of The Company Ppt Summary Brochure PDF
The slide provides the financials highlight of the company including revenue and net interest income for five years and revenue split by segments and geographic area.Deliver an awe-inspiring pitch with this creative financial highlights of the company ppt summary brochure pdf. bundle. Topics like revenue, net interest income, 2017 to 2021 can be discussed with this completely editable template. It is available for immediate download depending on the needs and requirements of the user.
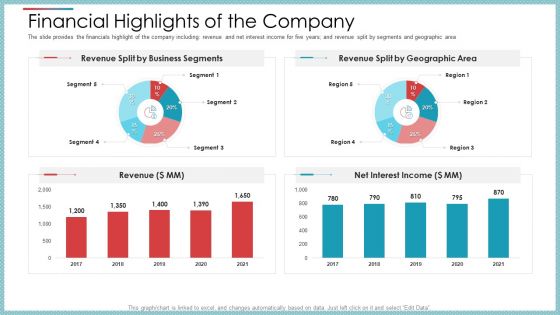
Financial Highlights Of The Company Ppt Model Layout Ideas PDF
The slide provides the financials highlight of the company including revenue and net interest income for five years and revenue split by segments and geographic area Deliver an awe-inspiring pitch with this creative financial highlights of the company ppt model layout ideas pdf. bundle. Topics like revenue, net interest income, 2017 to 2021 can be discussed with this completely editable template. It is available for immediate download depending on the needs and requirements of the user.
Financial Highlights Of The Company Ppt Outline Icon PDF
The slide provides the financials highlight of the company including revenue and net interest income for five years and revenue split by segments and geographic area Deliver an awe-inspiring pitch with this creative financial highlights of the company ppt outline icon pdf. bundle. Topics like revenue, net interest income, 2017 to 2021 can be discussed with this completely editable template. It is available for immediate download depending on the needs and requirements of the user.
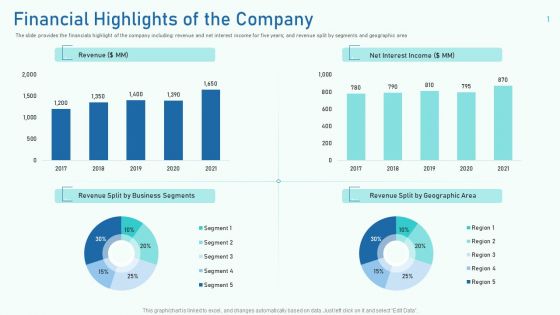
Financial Highlights Of The Company Ppt Summary Pictures PDF
The slide provides the financials highlight of the company including revenue and net interest income for five years and revenue split by segments and geographic area Deliver an awe-inspiring pitch with this creative financial highlights of the company ppt summary pictures pdf. bundle. Topics like revenue, net interest income, 2017 to 2021 can be discussed with this completely editable template. It is available for immediate download depending on the needs and requirements of the user.
Six Staged Infographics Square With Business Icons Powerpoint Templates
This business diagram displays circular puzzle infographic. This editable slide is suitable to present global communication. Use this diagram for business and finance related topics and display complete data analysis in your presentation.
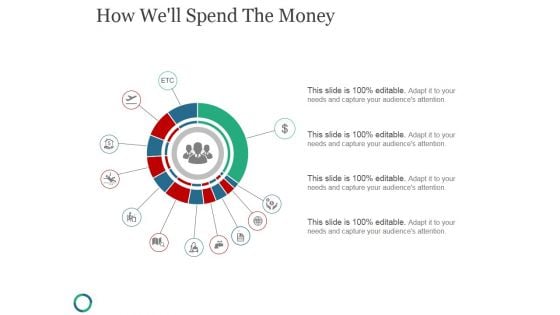
How Well Spend The Money Ppt PowerPoint Presentation Infographic Template
This is a how well spend the money ppt powerpoint presentation infographic template. This is a twelve stage process. The stages in this process are business, process, circular, marketing, management.
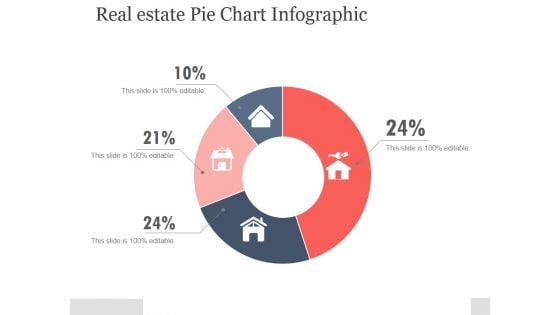
Real Estate Pie Chart Infographic Ppt PowerPoint Presentation Portfolio
This is a real estate pie chart infographic ppt powerpoint presentation portfolio. This is a four stage process. The stages in this process are circular, business, icons, marketing, process.
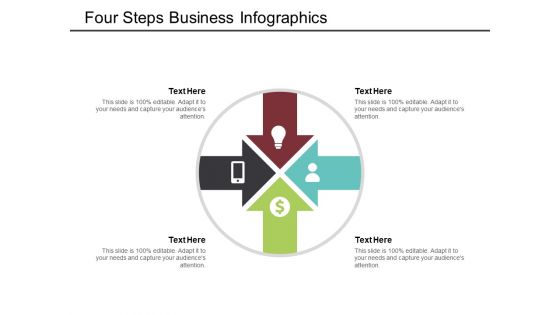
Four Steps Business Infographics Ppt PowerPoint Presentation Model Visual Aids
This is a four steps business infographics ppt powerpoint presentation model visual aids. This is a four stage process. The stages in this process are circle process 4 arrows, circle cycle 4 arrows, circular process 4 arrows.
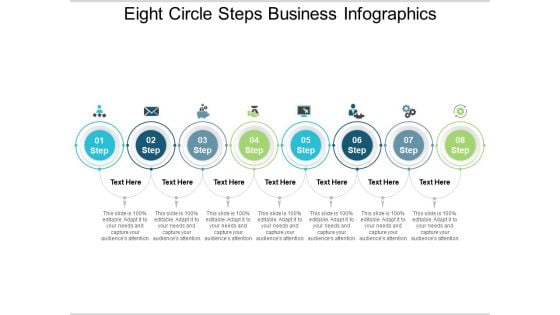
Eight Circle Steps Business Infographics Ppt PowerPoint Presentation Summary Slides
This is a eight circle steps business infographics ppt powerpoint presentation summary slides. This is a eight stage process. The stages in this process are 10 circle, 10 circular diagram, 10 cycle.
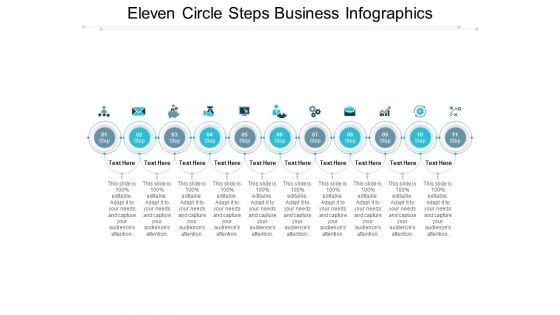
Eleven Circle Steps Business Infographics Ppt PowerPoint Presentation Layouts Example
This is a eleven circle steps business infographics ppt powerpoint presentation layouts example. This is a eleven stage process. The stages in this process are 10 circle, 10 circular diagram, 10 cycle.
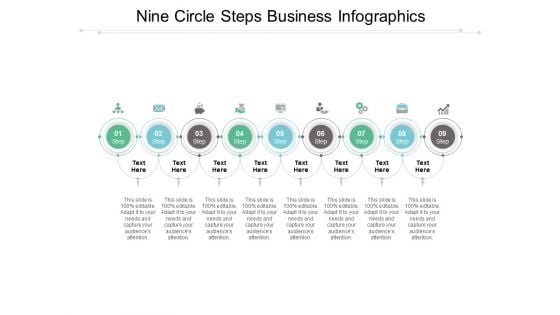
Nine Circle Steps Business Infographics Ppt PowerPoint Presentation Shapes
This is a nine circle steps business infographics ppt powerpoint presentation shapes. This is a nine stage process. The stages in this process are 10 circle, 10 circular diagram, 10 cycle.
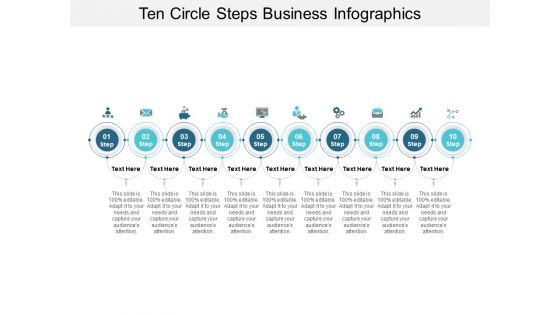
Ten Circle Steps Business Infographics Ppt PowerPoint Presentation Gallery Ideas
This is a ten circle steps business infographics ppt powerpoint presentation gallery ideas. This is a ten stage process. The stages in this process are 10 circle, 10 circular diagram, 10 cycle.
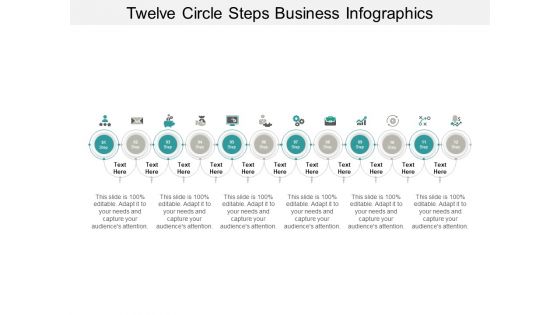
Twelve Circle Steps Business Infographics Ppt PowerPoint Presentation Gallery Information
This is a twelve circle steps business infographics ppt powerpoint presentation gallery information. This is a twelve stage process. The stages in this process are 10 circle, 10 circular diagram, 10 cycle.
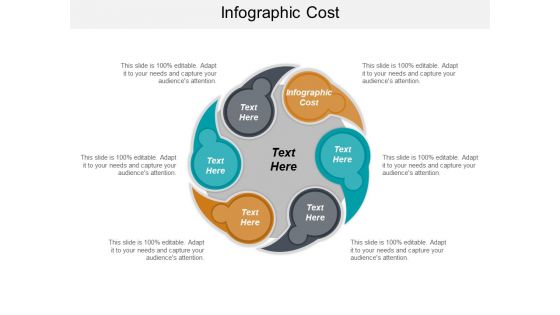
Infographic Cost Ppt PowerPoint Presentation Professional Files Cpb
This is a infographic cost ppt powerpoint presentation professional files cpb. This is a six stage process. The stages in this process are infographic cost.

Marketing Growth Strategy To Process To Successfully Develop Market Penetration Strategy SS V
The following slide outlines five-step process to build successful market penetration strategy and increase market share. The process begins with identifying target audience, conducting market research, developing and implementing promotional techniques, and tracking results. Do you have an important presentation coming up Are you looking for something that will make your presentation stand out from the rest Look no further than Marketing Growth Strategy To Process To Successfully Develop Market Penetration Strategy SS V. With our professional designs, you can trust that your presentation will pop and make delivering it a smooth process. And with Slidegeeks, you can trust that your presentation will be unique and memorable. So why wait Grab Marketing Growth Strategy To Process To Successfully Develop Market Penetration Strategy SS V today and make your presentation stand out from the rest The following slide outlines five-step process to build successful market penetration strategy and increase market share. The process begins with identifying target audience, conducting market research, developing and implementing promotional techniques, and tracking results.
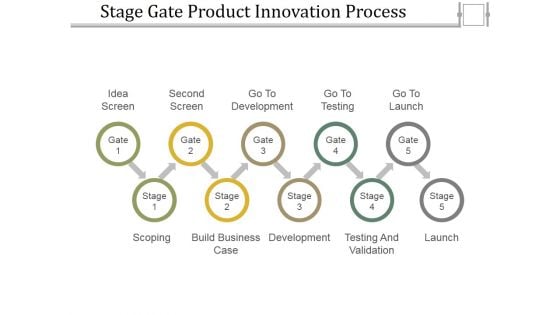
Stage Gate Product Innovation Process Ppt PowerPoint Presentation Infographic Template Example 2015
This is a stage gate product innovation process ppt powerpoint presentation infographic template example 2015. This is a ten stage process. The stages in this process are scoping, build business case, development, testing and validation, launch, idea screen, second screen.
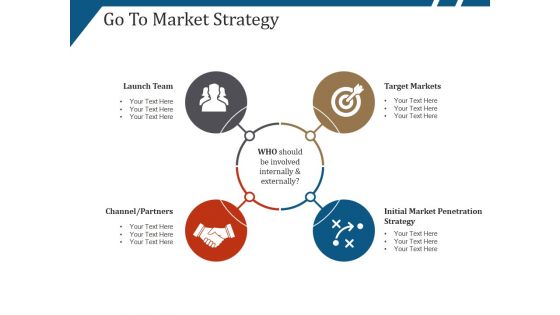
Go To Market Strategy Template 1 Ppt PowerPoint Presentation Pictures Infographics
This is a go to market strategy template 1 ppt powerpoint presentation pictures infographics. This is a four stage process. The stages in this process are launch team, target markets, channel partners.
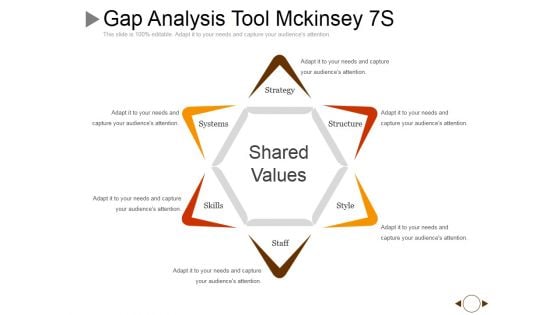
Gap Analysis Tool Mckinsey 7S Ppt PowerPoint Presentation Infographic Template Example
This is a gap analysis tool mckinsey 7s ppt powerpoint presentation infographic template example. This is a six stage process. The stages in this process are strategy, structure, style, staff, skills.

Along With Superior Technical Capabilities Ppt PowerPoint Presentation Infographic Template Background Image
This is a along with superior technical capabilities ppt powerpoint presentation infographic template background image. This is a four stage process. The stages in this process are capability, business, marketing, strategy, process.
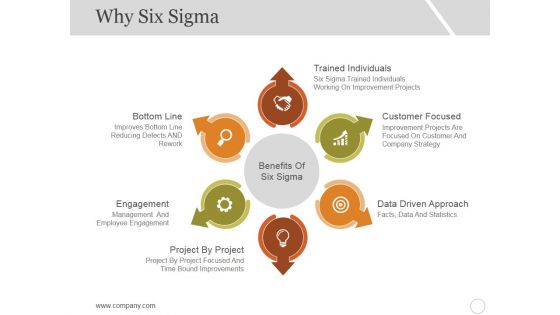
Why Six Sigma Template 2 Ppt PowerPoint Presentation Infographic Template Skills
This is a why six sigma template 2 ppt powerpoint presentation infographic template skills. This is a six stage process. The stages in this process are bottom line, engagement, project by project, customer focused, data driven approach.
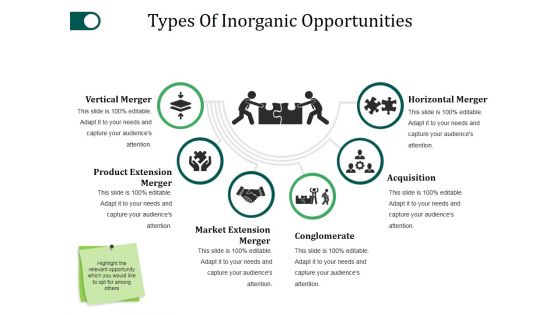
Types Of Inorganic Opportunities Template 2 Ppt PowerPoint Presentation Infographic Template Outline
This is a types of inorganic opportunities template 2 ppt powerpoint presentation infographic template outline. This is a six stage process. The stages in this process are vertical merger, conglomerate, acquisition, horizontal merger, market extension merger.

About The Product Template 2 Ppt PowerPoint Presentation Visual Aids Infographics
This is a about the product template 2 ppt powerpoint presentation visual aids infographics. This is a six stage process. The stages in this process are architectural design, originality, quality of product, ideas, cheap price.
Six Stages Business Process Flow With Icons Ppt PowerPoint Presentation Infographic Template Influencers
This is a six stages business process flow with icons ppt powerpoint presentation infographic template influencers. This is a six stage process. The stages in this process are process flow 6, process map 6.
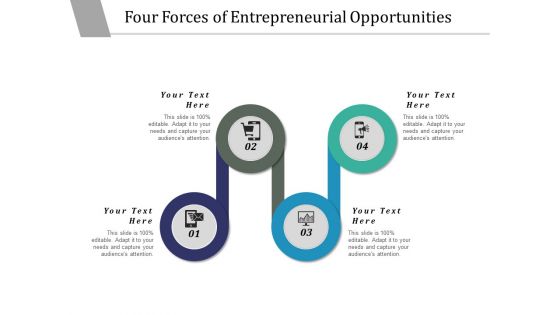
Four Forces Of Entrepreneurial Opportunities Ppt PowerPoint Presentation Infographic Template Background
This is a four forces of entrepreneurial opportunities ppt powerpoint presentation infographic template background. This is a four stage process. The stages in this process are 4 step approach, 4 step process, 4 step plan.

Workplace Stress And Time Management Ppt PowerPoint Presentation Infographics Designs Download
This is a workplace stress and time management ppt powerpoint presentation infographics designs download. This is a six stage process. The stages in this process are work life balance, work and leisure, career and ambition.
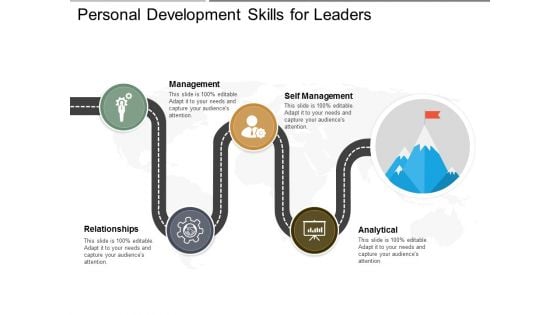
Personal Development Skills For Leaders Ppt PowerPoint Presentation Infographic Template Samples
This is a personal development skills for leaders ppt powerpoint presentation infographic template samples. This is a four stage process. The stages in this process are leadership competencies, leadership skills, leadership management.
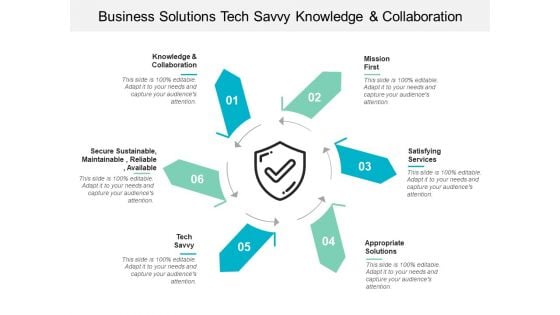
Business Solutions Tech Savvy Knowledge And Collaboration Ppt PowerPoint Presentation Show Infographics
This is a business solutions tech savvy knowledge and collaboration ppt powerpoint presentation show infographics. This is a six stage process. The stages in this process are guidelines, values, guiding principles.
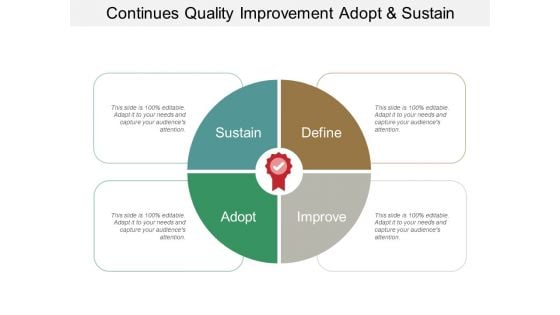
Continues Quality Improvement Adopt And Sustain Ppt PowerPoint Presentation Infographic Template Guidelines
This is a continues quality improvement adopt and sustain ppt powerpoint presentation infographic template guidelines. This is a four stage process. The stages in this process are guidelines, values, guiding principles.
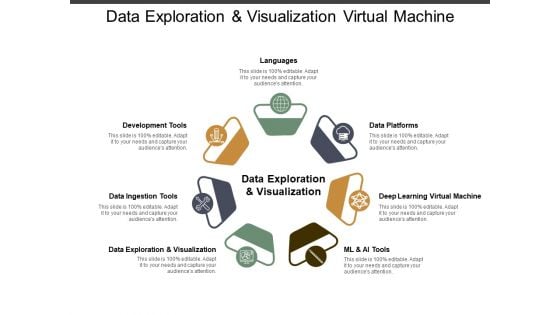
Data Exploration And Visualization Virtual Machine Ppt PowerPoint Presentation Infographics Diagrams
This is a data exploration and visualization virtual machine ppt powerpoint presentation infographics diagrams. This is a seven stage process. The stages in this process are data, analysis, data science, information science.
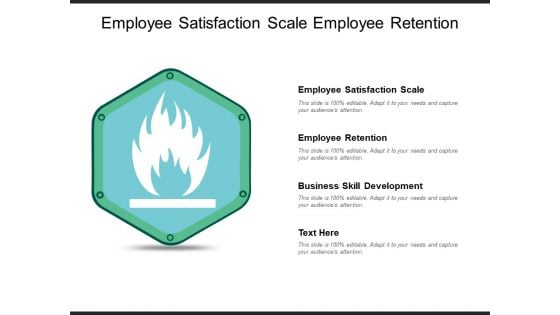
Employee Satisfaction Scale Employee Retention Business Skill Development Ppt PowerPoint Presentation Infographic Template Graphics Download
This is a employee satisfaction scale employee retention business skill development ppt powerpoint presentation infographic template graphics download. This is a one stage process. The stages in this process are employee satisfaction scale, employee retention, business skill development.
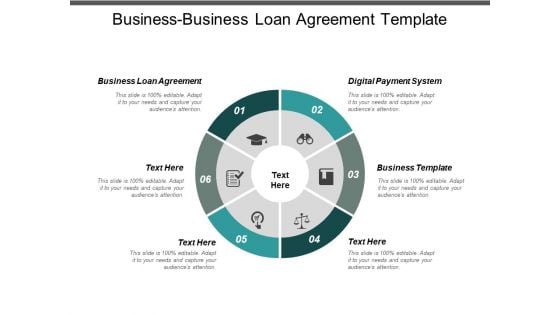
Business Business Loan Agreement Template Digital Payment System Ppt PowerPoint Presentation Infographic Template Background Designs
This is a business business loan agreement template digital payment system ppt powerpoint presentation infographic template background designs. This is a six stage process. The stages in this process are business business loan agreement template, digital payment system.
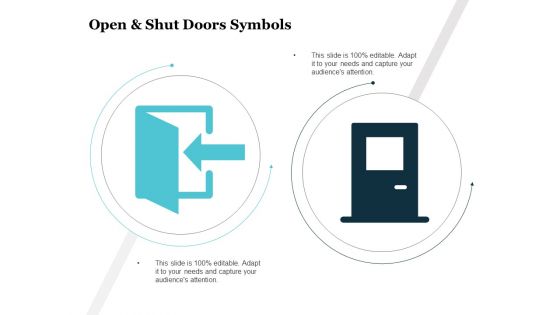
Open And Shut Doors Symbols Ppt PowerPoint Presentation Pictures Infographic Template
This is a open and shut doors symbols ppt powerpoint presentation pictures infographic template. This is a two stage process. The stages in this process are door icon, entrance icon, house front icon.
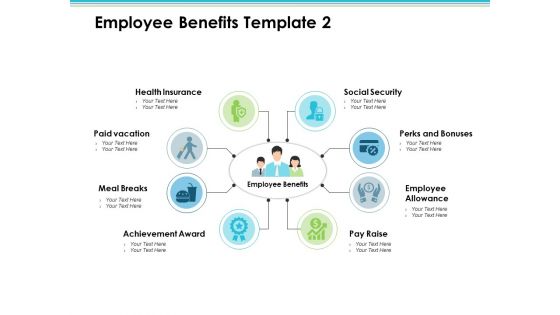
Employee Benefits Employee Value Proposition Ppt PowerPoint Presentation Visual Aids Infographic Template
This is a employee benefits employee value proposition ppt powerpoint presentation visual aids infographic template. This is a eight stage process. The stages in this process are business, management, strategy, analysis, icons.
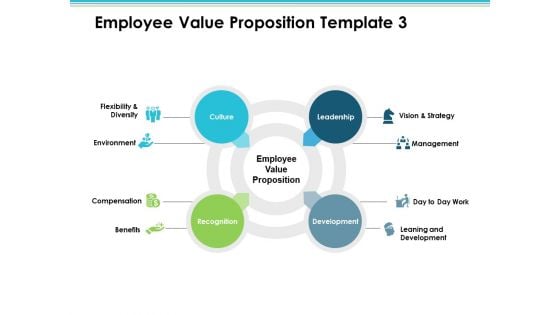
Employee Value Proposition Culture Recognition Development Leadership Ppt PowerPoint Presentation Infographic Template Inspiration
This is a employee value proposition culture recognition development leadership ppt powerpoint presentation infographic template inspiration. This is a four stage process. The stages in this process are business, management, strategy, analysis, icons.
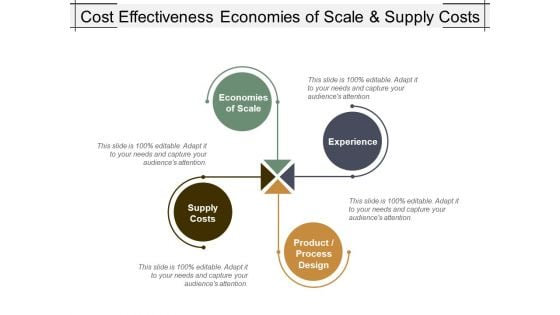
Cost Effectiveness Economies Of Scale And Supply Costs Ppt PowerPoint Presentation Infographic Template Format Ideas
This is a cost effectiveness economies of scale and supply costs ppt powerpoint presentation infographic template format ideas. This is a four stage process. The stages in this process are cost planning, cost efficiency, cost organization.
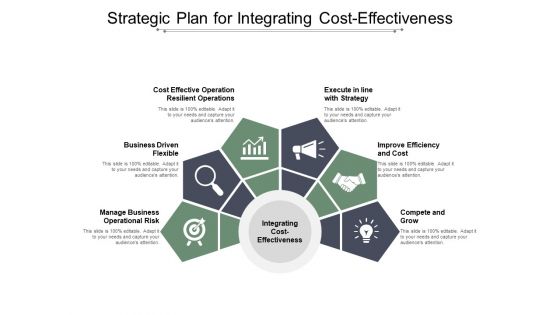
Strategic Plan For Integrating Cost Effectiveness Ppt PowerPoint Presentation Infographics Example
This is a strategic plan for integrating cost effectiveness ppt powerpoint presentation infographics example. This is a six stage process. The stages in this process are cost planning, cost efficiency, cost organization.
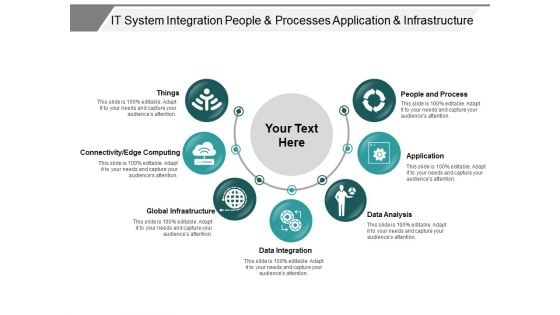
It System Integration People And Processes Application And Infrastructure Ppt PowerPoint Presentation Infographics Graphic Tips
This is a it system integration people and processes application and infrastructure ppt powerpoint presentation infographics graphic tips. This is a seven stage process. The stages in this process are osi model, technology layers, internetworking layer.
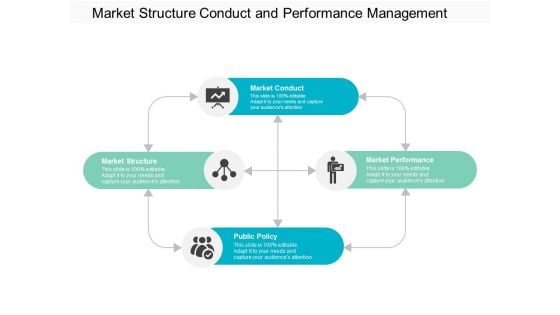
Market Structure Conduct And Performance Management Ppt Powerpoint Presentation Infographic Template Picture
This is a market structure conduct and performance management ppt powerpoint presentation infographic template picture. This is a four stage process. The stages in this process are performance management, structure conduct performance, performance review and analysis.
Three Stages Scp Paradigm With Icons Ppt Powerpoint Presentation Infographics Graphics
This is a three stages scp paradigm with icons ppt powerpoint presentation infographics graphics. This is a three stage process. The stages in this process are performance management, structure conduct performance, performance review and analysis.
Sperm With Male Female Icon Ppt Powerpoint Presentation Infographics Background Image
This is a sperm with male female icon ppt powerpoint presentation infographics background image. This is a two stage process. The stages in this process are fertility, productiveness, fecundity.
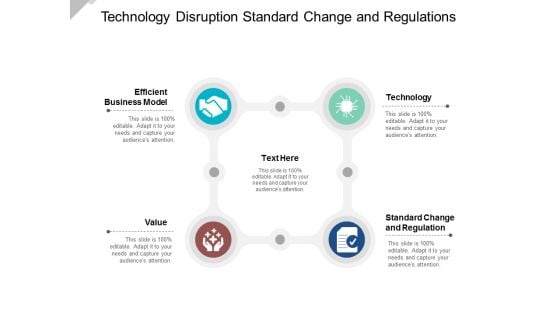
Technology Disruption Standard Change And Regulations Ppt Powerpoint Presentation Inspiration Infographic Template
This is a technology disruption standard change and regulations ppt powerpoint presentation inspiration infographic template. This is a four stage process. The stages in this process are innovation, disruptive innovation, disruptive technology.
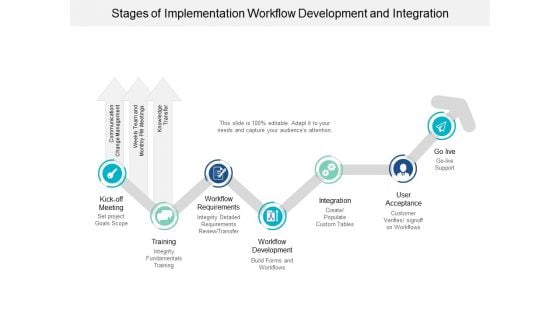
Stages Of Implementation Workflow Development And Integration Ppt Powerpoint Presentation Styles Infographic Template
This is a stages of implementation workflow development and integration ppt powerpoint presentation styles infographic template. This is a seven stage process. The stages in this process are implementation process, implementation procedure, implementation cycle.
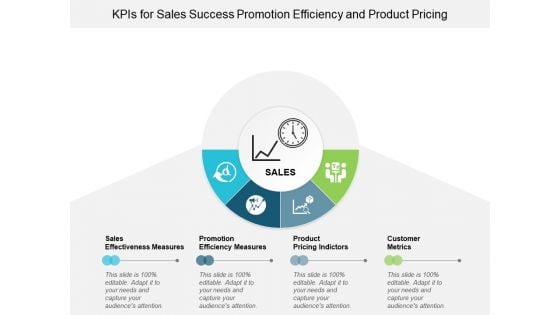
Kpis For Sales Success Promotion Efficiency And Product Pricing Ppt Powerpoint Presentation Infographics Background Images
This is a kpis for sales success promotion efficiency and product pricing ppt powerpoint presentation infographics background images. This is a four stage process. The stages in this process are dashboard, kpi, metrics.
Drill Down Hierarchies Vector Icon Ppt PowerPoint Presentation Infographic Template Format Ideas
This is a drill down hierarchies vector icon ppt powerpoint presentation infographic template format ideas. This is a four stage process. The stages in this process are hierarchy, drill down, top downwards.
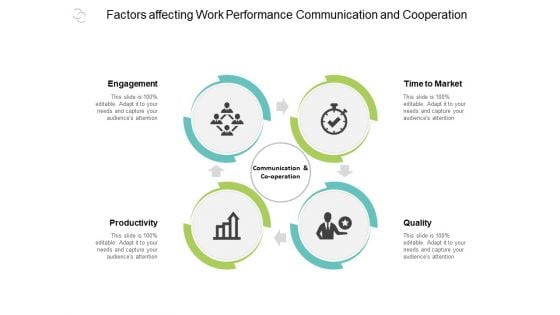
Factors Affecting Work Performance Communication And Cooperation Ppt Powerpoint Presentation Infographics Introduction
This is a factors affecting work performance communication and cooperation ppt powerpoint presentation infographics introduction. This is a four stage process. The stages in this process are business outcomes, business results, business output.
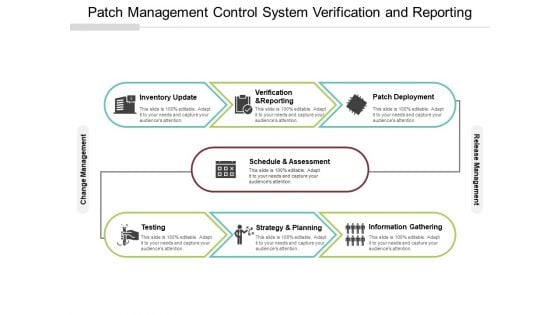
Patch Management Control System Verification And Reporting Ppt PowerPoint Presentation Infographics Backgrounds
This is a patch management control system verification and reporting ppt powerpoint presentation infographics backgrounds. This is a seven stage process. The stages in this process are patch management process, patch management procedure, patch management approach.
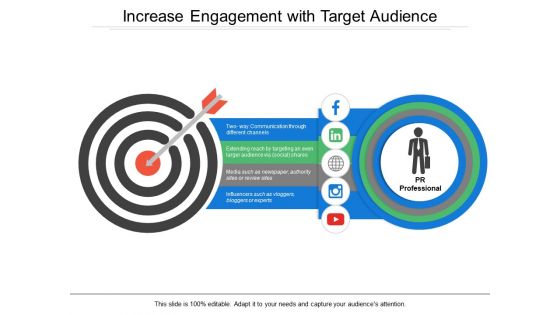
Increase Engagement With Target Audience Ppt PowerPoint Presentation Infographic Template Example 2015
This is a increase engagement with target audience ppt powerpoint presentation infographic template example 2015. This is a four stage process. The stages in this process are communication process, communication management, communication channels.
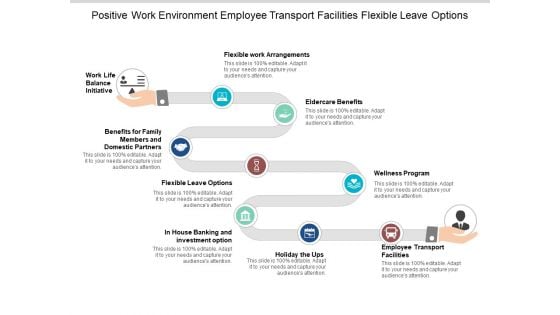
Positive Work Environment Employee Transport Facilities Flexible Leave Options Ppt PowerPoint Presentation File Infographics
This is a positive work environment employee transport facilities flexible leave options ppt powerpoint presentation file infographics. This is a nine stage process. The stages in this process are work life balance, work and leisure, career and ambition.
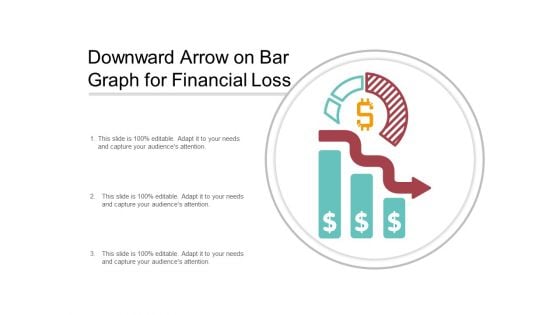
Downward Arrow On Bar Graph For Financial Loss Ppt PowerPoint Presentation Infographics Sample
This is a downward arrow on bar graph for financial loss ppt powerpoint presentation infographics sample. This is a three stage process. The stages in this process are business failure, unsuccessful business, business non success.
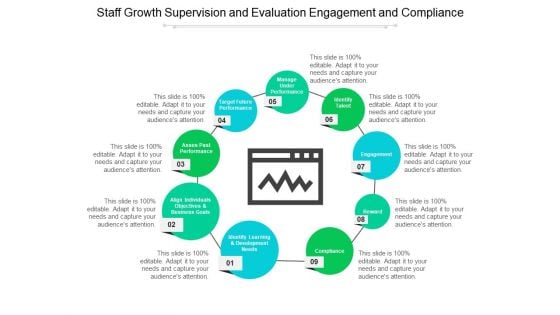
Staff Growth Supervision And Evaluation Engagement And Compliance Ppt PowerPoint Presentation Infographic Template Background Image
This is a staff growth supervision and evaluation engagement and compliance ppt powerpoint presentation infographic template background image. This is a nine stage process. The stages in this process are employee engagement, employee performance, employee evaluation.

Implementing Clm Negotiate Approve Track And Renew Ppt PowerPoint Presentation Infographics Objects
This is a implementing clm negotiate approve track and renew ppt powerpoint presentation infographics objects. This is a eight stage process. The stages in this process are contract management, contract negotiation, deal making.

Agile System Development Life Cycle Release And Design Ppt PowerPoint Presentation Infographic Template Outfit
This is a agile system development life cycle release and design ppt powerpoint presentation infographic template outfit. This is a six stage process. The stages in this process are agile cycle, sprint cycle, scrum cycle.
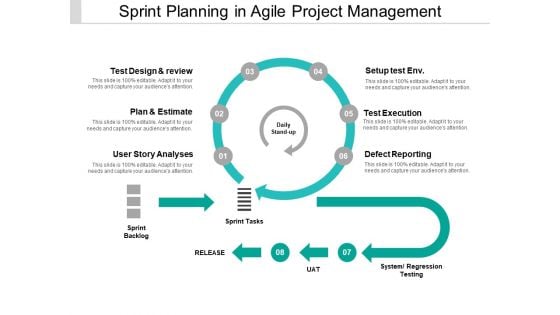
Sprint Planning In Agile Project Management Ppt PowerPoint Presentation Infographics Sample
This is a sprint planning in agile project management ppt powerpoint presentation infographics sample. This is a six stage process. The stages in this process are agile cycle, sprint cycle, scrum cycle.
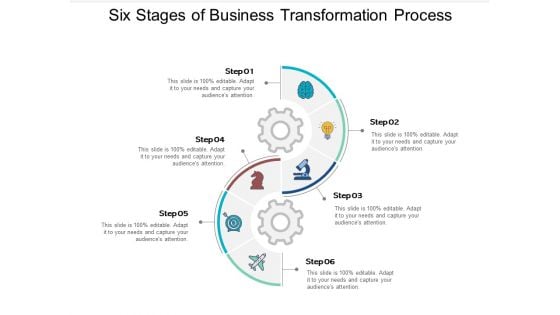
Six Stages Of Business Transformation Process Ppt PowerPoint Presentation Infographics Model
This is a six stages of business transformation process ppt powerpoint presentation infographics model. This is a six stage process. The stages in this process are 6 steps, 6 phases, 6 segments.
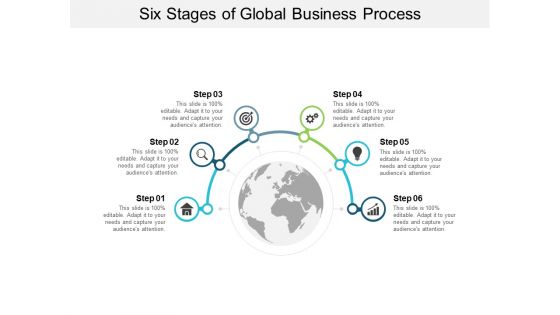
Six Stages Of Global Business Process Ppt PowerPoint Presentation Show Infographic Template
This is a six stages of global business process ppt powerpoint presentation show infographic template. This is a six stage process. The stages in this process are 6 steps, 6 phases, 6 segments.
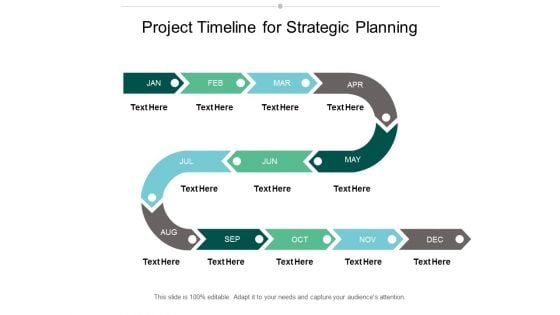
Project Timeline For Strategic Planning Ppt Powerpoint Presentation Infographic Template Professional
This is a project timeline for strategic planning ppt powerpoint presentation infographic template professional. This is a four stage process. The stages in this process are monthly roadmap, 30 day roadmap, monthly timeline.
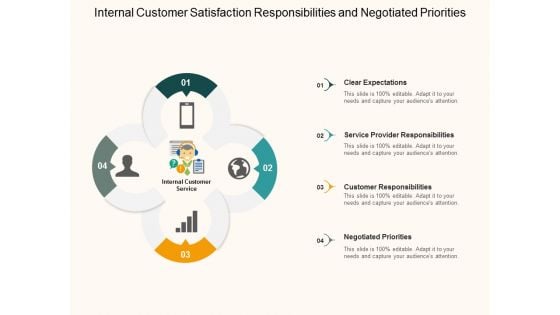
Internal Customer Satisfaction Responsibilities And Negotiated Priorities Ppt PowerPoint Presentation Infographics Aids
This is a internal customer satisfaction responsibilities and negotiated priorities ppt powerpoint presentation infographics aids. This is a four stage process. The stages in this process are internal customer services, internal customer satisfaction, internal customer management.


 Continue with Email

 Home
Home


