5 Stage Infographic
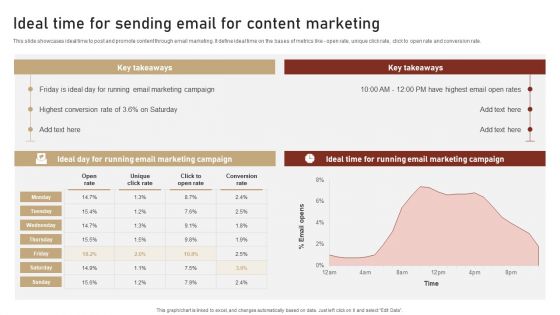
Content Delivery And Promotion Ideal Time For Sending Email For Content Marketing Infographics PDF
This slide showcases ideal content type that can be distributed on different social media platforms like Facebook, Instagram, twitter etc. It includes content like product updates, newsletters, brand announcement, polls etc. Welcome to our selection of the Content Delivery And Promotion Ideal Time For Sending Email For Content Marketing Infographics PDF. These are designed to help you showcase your creativity and bring your sphere to life. Planning and Innovation are essential for any business that is just starting out. This collection contains the designs that you need for your everyday presentations. All of our PowerPoints are 100 percent editable, so you can customize them to suit your needs. This multi-purpose template can be used in various situations. Grab these presentation templates today.

Use Of A Component Based Architecture In RUP Model Ppt Infographics Slides PDF
This slide depicts the use of a component-based architecture with the Rational Unified Process Model using components such as CORBA and component object model. Presenting use of a component based architecture in rup model ppt infographics slides pdf to provide visual cues and insights. Share and navigate important information on five stages that need your due attention. This template can be used to pitch topics like infrastructures, resources, location, developing. In addtion, this PPT design contains high resolution images, graphics, etc, that are easily editable and available for immediate download.
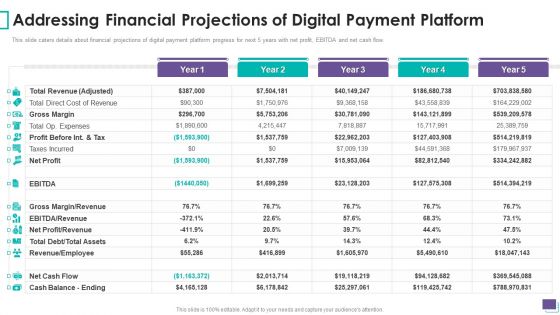
Payment Gateway Firm Addressing Financial Projections Of Digital Payment Platform Infographics PDF
This slide caters details about financial projections of digital payment platform progress for next 5 years with net profit, EBITDA and net cash flow. Deliver an awe inspiring pitch with this creative Payment Gateway Firm Addressing Financial Projections Of Digital Payment Platform Infographics PDF bundle. Topics like Gross Margin, Profit Before, Net Profit, Employee can be discussed with this completely editable template. It is available for immediate download depending on the needs and requirements of the user.
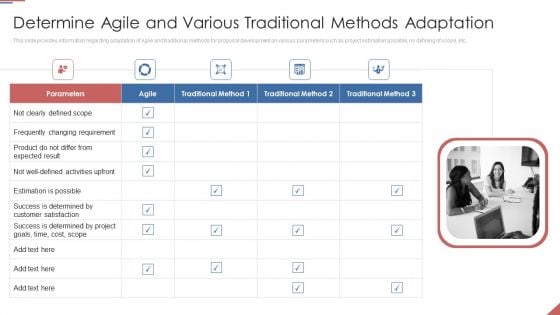
Formulating Plan And Executing Bid Projects Using Agile IT Determine Agile And Various Traditional Methods Adaptation Infographics PDF
This slide provides information regarding adaptation of Agile and traditional methods for proposal development on various parameters such as project estimation possible, no defining of scope, etc. This is a formulating plan and executing bid projects using agile it determine agile and various traditional methods adaptation infographics pdf template with various stages. Focus and dispense information on five stages using this creative set, that comes with editable features. It contains large content boxes to add your information on topics like determine agile and various traditional methods adaptation. You can also showcase facts, figures, and other relevant content using this PPT layout. Grab it now.
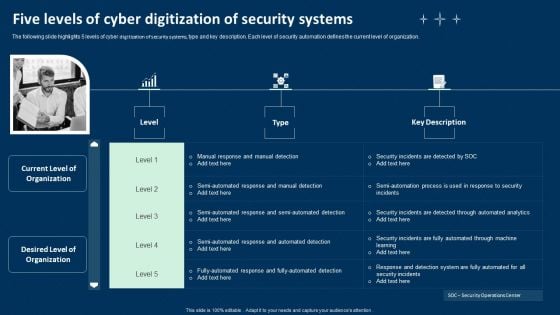
Five Levels Of Cyber Digitization Of Security Systems Ppt Infographics Graphics Tutorials PDF
The following slide highlights 5 levels of cyber digitization of security systems, type and key description. Each level of security automation defines the current level of organization. Presenting Five Levels Of Cyber Digitization Of Security Systems Ppt Infographics Graphics Tutorials PDF to dispense important information. This template comprises three stages. It also presents valuable insights into the topics including Investigating Steps, Security Analysts, Determining Responsive Action. This is a completely customizable PowerPoint theme that can be put to use immediately. So, download it and address the topic impactfully.
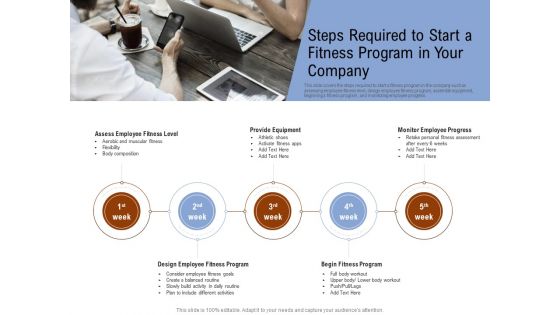
Employee Health And Fitness Program Steps Required To Start A Fitness Program In Your Company Infographics PDF
Presenting this set of slides with name employee health and fitness program steps required to start a fitness program in your company infographics pdf. This is a five stage process. The stages in this process are assess, program, equipment, monitor, design. This is a completely editable PowerPoint presentation and is available for immediate download. Download now and impress your audience.
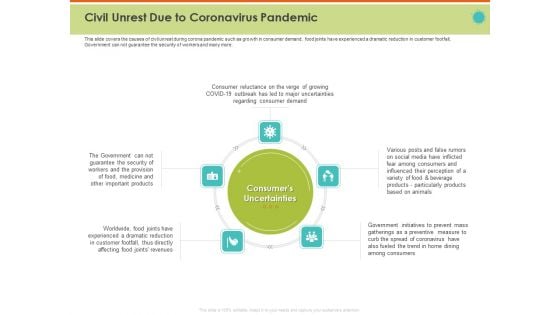
Mitigating The Impact Of COVID On Food And Agriculture Sector Civil Unrest Due To Coronavirus Pandemic Infographics PDF
Presenting this set of slides with name mitigating the impact of covid on food and agriculture sector civil unrest due to coronavirus pandemic infographics pdf. This is a five stage process. The stages in this process are revenues, government, security, initiatives, consumers. This is a completely editable PowerPoint presentation and is available for immediate download. Download now and impress your audience.
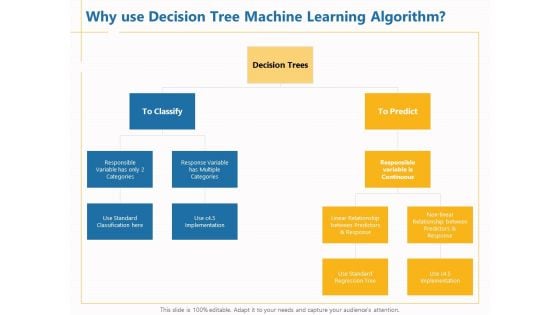
Boosting Machine Learning Why Use Decision Tree Machine Learning Algorithm Ppt PowerPoint Presentation Infographics Design Inspiration PDF
Presenting this set of slides with name boosting machine learning why use decision tree machine learning algorithm ppt powerpoint presentation infographics design inspiration pdf. This is a five stage process. The stages in this process are classification decision trees, classify, predict, implementation. This is a completely editable PowerPoint presentation and is available for immediate download. Download now and impress your audience.
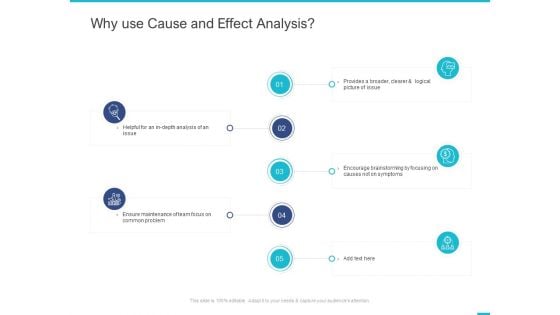
Fishbone Ishikawa Cause And Effect Analysis Why Use Cause And Effect Analysis Ppt PowerPoint Presentation Infographics Graphics Design PDF
Presenting this set of slides with name fishbone ishikawa cause and effect analysis why use cause and effect analysis ppt powerpoint presentation infographics graphics design pdf. This is a five stage process. The stages in this process are provides broader, clearer and logical picture, encourage brainstorming, focusing causes, symptoms, ensure maintenance, team focus, common problem, helpful depth analysis. This is a completely editable PowerPoint presentation and is available for immediate download. Download now and impress your audience.
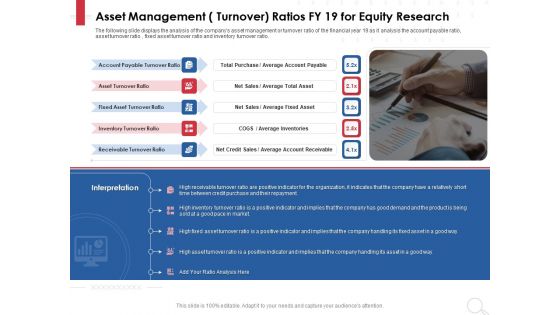
Equity Analysis Project Asset Management Turnover Ratios FY 19 For Equity Research Ppt PowerPoint Presentation Infographics Guide PDF
Presenting this set of slides with name equity analysis project asset management turnover ratios fy 19 for equity research ppt powerpoint presentation infographics guide pdf. This is a five stage process. The stages in this process are account payable turnover ratio, asset turnover ratio, fixed asset turnover ratio, inventory turnover ratio, receivable turnover ratio, net sales. This is a completely editable PowerPoint presentation and is available for immediate download. Download now and impress your audience.
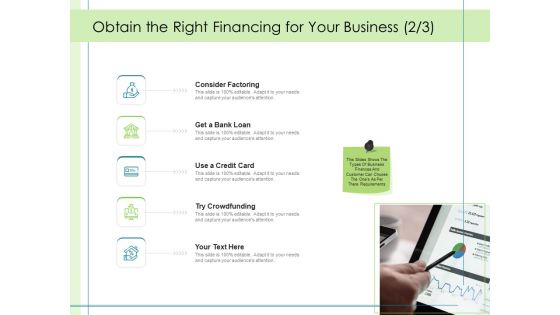
In Depth Business Assessment Obtain The Right Financing For Your Business Ppt PowerPoint Presentation Infographics Master Slide PDF
This is a in depth business assessment obtain the right financing for your business ppt powerpoint presentation infographics master slide pdf template with various stages. Focus and dispense information on five stages using this creative set, that comes with editable features. It contains large content boxes to add your information on topics like consider factoring, get bank loan, use credit card, try crowdfunding. You can also showcase facts, figures, and other relevant content using this PPT layout. Grab it now.
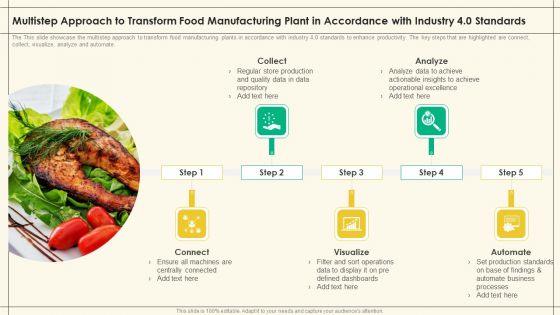
Multistep Approach Transform Food Manufacturing Plant Accordance Industry 4 0 Standards Precooked Food Industry Analysis Infographics PDF
The This slide showcase the multistep approach to transform food manufacturing plants in accordance with industry 4.0 standards to enhance productivity. The key steps that are highlighted are connect, collect, visualize, analyze and automate.Presenting Multistep Approach Transform Food Manufacturing Plant Accordance Industry 4 0 Standards Precooked Food Industry Analysis Infographics PDF to provide visual cues and insights. Share and navigate important information on five stages that need your due attention. This template can be used to pitch topics like Ensure Machines, Centrally Connected, Defined Dashboards. In addtion, this PPT design contains high resolution images, graphics, etc, that are easily editable and available for immediate download.
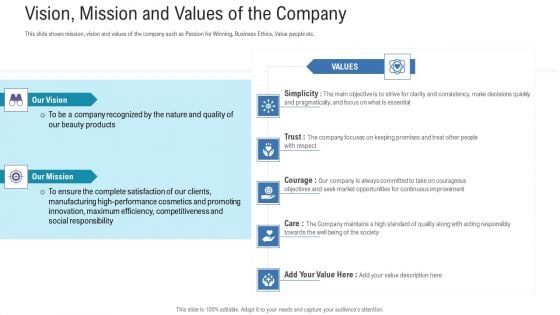
Pitch Deck For Fundraising From Angel Investors Vision Mission And Values Of The Company Ppt Infographics Slide Download PDF
This slide shows mission, vision and values of the company such as Passion for Winning, Business Ethics, Value people etc. Presenting pitch deck for fundraising from angel investors vision mission and values of the company ppt infographics slide download pdf to provide visual cues and insights. Share and navigate important information on five stages that need your due attention. This template can be used to pitch topics like our vision mission, manufacturing, competitiveness, social responsibility, opportunities. In addtion, this PPT design contains high resolution images, graphics, etc, that are easily editable and available for immediate download.
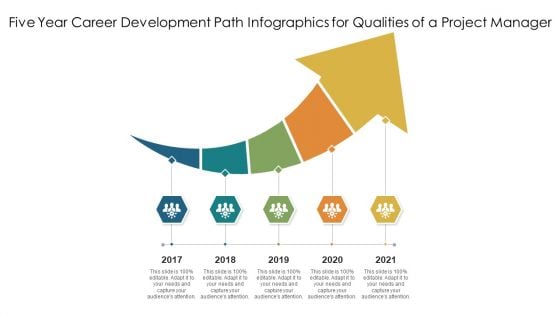
Five Year Career Development Path Infographics For Qualities Of A Project Manager Ppt PowerPoint Presentation Ideas Visuals PDF
Presenting five year career development path infographics for qualities of a project manager ppt powerpoint presentation ideas visuals pdf to dispense important information. This template comprises five stages. It also presents valuable insights into the topics including five year career development path infographics for qualities of a project manager This is a completely customizable PowerPoint theme that can be put to use immediately. So, download it and address the topic impactfully.
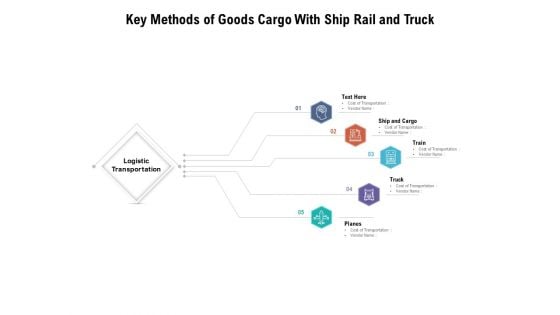
Key Methods Of Goods Cargo With Ship Rail And Truck Ppt PowerPoint Presentation Infographics Slide Download PDF
Persuade your audience using this key methods of goods cargo with ship rail and truck ppt powerpoint presentation infographics slide download pdf. This PPT design covers five stages, thus making it a great tool to use. It also caters to a variety of topics including logistic transportation, cost of transportation, cost of transportation, cost of transportation, cost of transportation, cost of transportation. Download this PPT design now to present a convincing pitch that not only emphasizes the topic but also showcases your presentation skills.
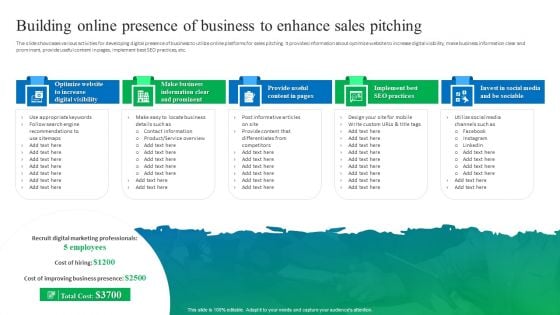
Process Enhancement Plan To Boost Sales Performance Building Online Presence Of Business To Enhance Sales Pitching Infographics PDF
The slide showcases various activities for developing digital presence of business to utilize online platforms for sales pitching. It provides information about optimize website to increase digital visibility, make business information clear and prominent, provide useful content in pages, implement best SEO practices, etc. This modern and well arranged Process Enhancement Plan To Boost Sales Performance Building Online Presence Of Business To Enhance Sales Pitching Infographics PDF provides lots of creative possibilities. It is very simple to customize and edit with the Powerpoint Software. Just drag and drop your pictures into the shapes. All facets of this template can be edited with Powerpoint no extra software is necessary. Add your own material, put your images in the places assigned for them, adjust the colors, and then you can show your slides to the world, with an animated slide included.
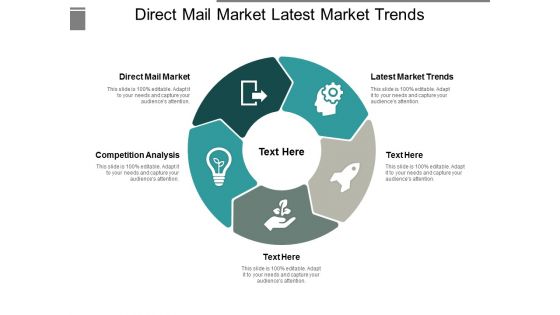
Direct Mail Market Latest Market Trends Competition Analysis Ppt PowerPoint Presentation Infographics Objects
This is a direct mail market latest market trends competition analysis ppt powerpoint presentation infographics objects. This is a five stage process. The stages in this process are direct mail market, latest market trends, competition analysis.
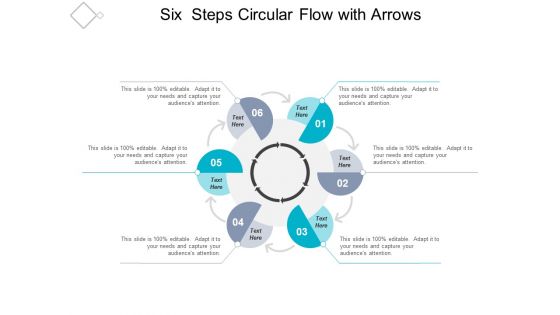
Six Steps Circular Flow With Arrows Ppt Powerpoint Presentation Infographics Good
This is a six steps circular flow with arrows ppt powerpoint presentation infographics good. This is a six stage process. The stages in this process are cycle diagram, circular process, cyclical process.
Nine Connected Steps In Circular Flow With Icons Ppt PowerPoint Presentation Infographics Themes
This is a nine connected steps in circular flow with icons ppt powerpoint presentation infographics themes. This is a nine stage process. The stages in this process are 10 circle, 10 circular diagram, 10 cycle.
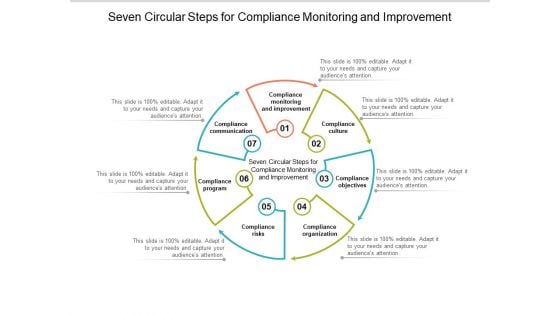
Seven Circular Steps For Compliance Monitoring And Improvement Ppt Powerpoint Presentation Infographics Professional
This is a seven circular steps for compliance monitoring and improvement ppt powerpoint presentation infographics professional. This is a seven stage process. The stages in this process are risk management, governance, compliance.
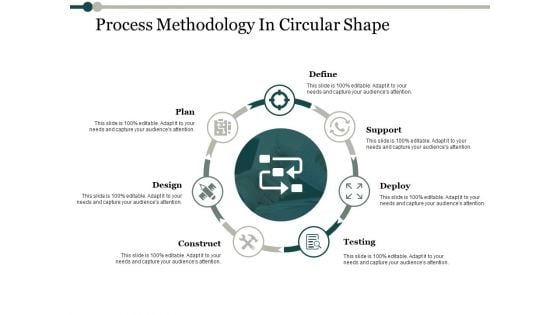
Process Methodology In Circular Shape Process Analysis Ppt PowerPoint Presentation Infographics Show
This is a process methodology in circular shape process analysis ppt powerpoint presentation infographics show. This is a seven stage process. The stages in this process are plan, support, deploy, testing, construct.

Purchasing And Logistics Management Circular Steps Ppt PowerPoint Presentation Infographics Portrait
This is a purchasing and logistics management circular steps ppt powerpoint presentation infographics portrait. This is a seven stage process. The stages in this process are purchasing, procurement, bidding.
Seven Concentric Circles With Pointers Text Holders Ppt Powerpoint Presentation Infographics Visual Aids
This is a seven concentric circles with pointers text holders ppt powerpoint presentation infographics visual aids. This is a seven stage process. The stages in this process are 7 concentric circles, 7 circular cycle, 7 circular diagram.
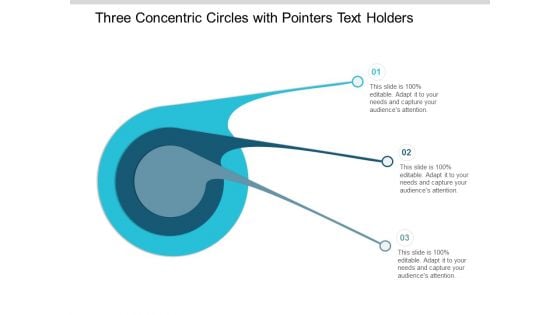
Three Concentric Circles With Pointers Text Holders Ppt Powerpoint Presentation Infographics Slides
This is a three concentric circles with pointers text holders ppt powerpoint presentation infographics slides. This is a three stage process. The stages in this process are 7 concentric circles, 7 circular cycle, 7 circular diagram.
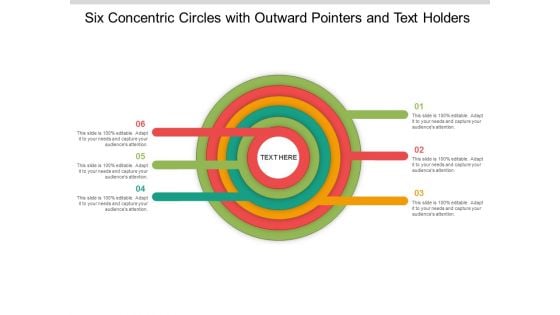
Six Concentric Circles With Outward Pointers And Text Holders Ppt Powerpoint Presentation Infographics Information
This is a six concentric circles with outward pointers and text holders ppt powerpoint presentation infographics information. This is a stage process. The stages in this process are 7 concentric circles, 7 circular cycle, 7 circular diagram.
Seven Steps Concentric Circles Process With Icons Ppt Powerpoint Presentation Infographics Introduction
This is a seven steps concentric circles process with icons ppt powerpoint presentation infographics introduction. This is a seven stage process. The stages in this process are 7 concentric circles, 7 circular cycle, 7 circular diagram.
Four Arrows Around Target Board With Icons Ppt Powerpoint Presentation Infographics Picture
This is a four arrows around target board with icons ppt powerpoint presentation infographics picture. This is a four stage process. The stages in this process are 6 Circular Arrows, 6 Cyclic Arrows, Six Circular Arrows.
Four Arrows With Icons For Business Process Flow Ppt Powerpoint Presentation Infographics File Formats
This is a four arrows with icons for business process flow ppt powerpoint presentation infographics file formats. This is a four stage process. The stages in this process are 6 Circular Arrows, 6 Cyclic Arrows, Six Circular Arrows.
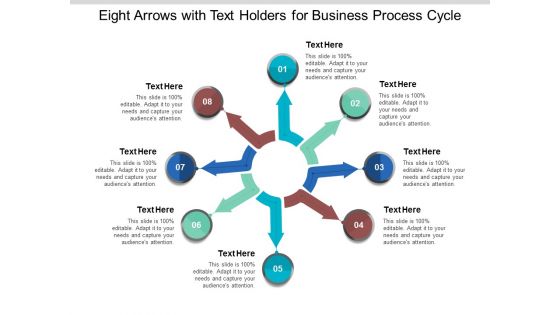
Eight Arrows With Text Holders For Business Process Cycle Ppt Powerpoint Presentation Infographics Example Introduction
This is a eight arrows with text holders for business process cycle ppt powerpoint presentation infographics example introduction. This is a eight stage process. The stages in this process are 6 circular arrows, 6 cyclic arrows, six circular arrows.

Workplace Stress And Time Management Ppt PowerPoint Presentation Infographics Designs Download
This is a workplace stress and time management ppt powerpoint presentation infographics designs download. This is a six stage process. The stages in this process are work life balance, work and leisure, career and ambition.
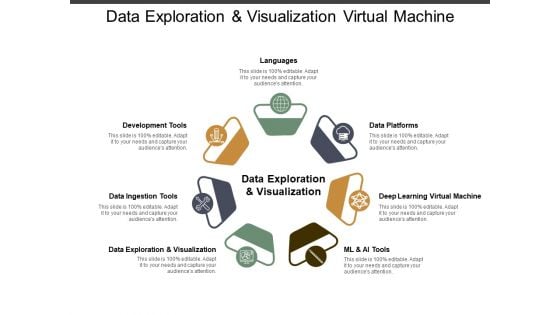
Data Exploration And Visualization Virtual Machine Ppt PowerPoint Presentation Infographics Diagrams
This is a data exploration and visualization virtual machine ppt powerpoint presentation infographics diagrams. This is a seven stage process. The stages in this process are data, analysis, data science, information science.
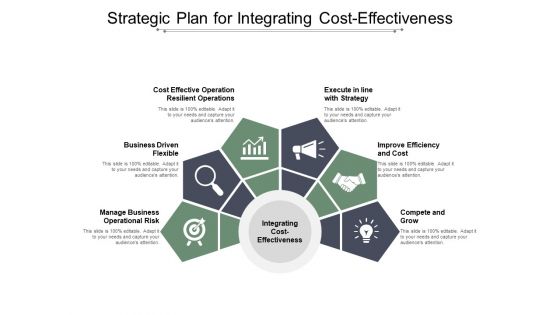
Strategic Plan For Integrating Cost Effectiveness Ppt PowerPoint Presentation Infographics Example
This is a strategic plan for integrating cost effectiveness ppt powerpoint presentation infographics example. This is a six stage process. The stages in this process are cost planning, cost efficiency, cost organization.
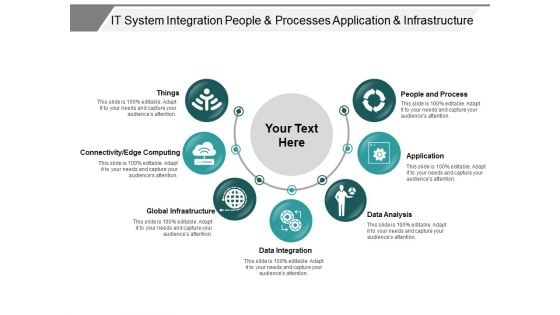
It System Integration People And Processes Application And Infrastructure Ppt PowerPoint Presentation Infographics Graphic Tips
This is a it system integration people and processes application and infrastructure ppt powerpoint presentation infographics graphic tips. This is a seven stage process. The stages in this process are osi model, technology layers, internetworking layer.
Sperm With Male Female Icon Ppt Powerpoint Presentation Infographics Background Image
This is a sperm with male female icon ppt powerpoint presentation infographics background image. This is a two stage process. The stages in this process are fertility, productiveness, fecundity.
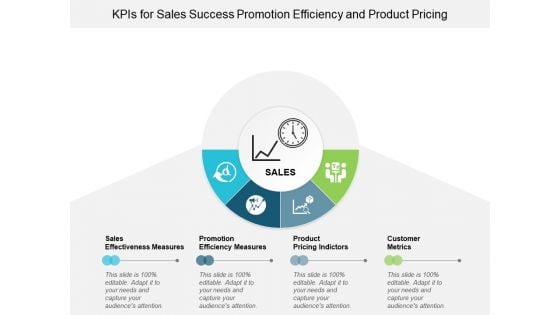
Kpis For Sales Success Promotion Efficiency And Product Pricing Ppt Powerpoint Presentation Infographics Background Images
This is a kpis for sales success promotion efficiency and product pricing ppt powerpoint presentation infographics background images. This is a four stage process. The stages in this process are dashboard, kpi, metrics.
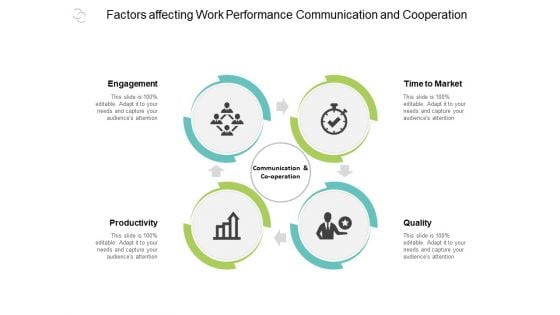
Factors Affecting Work Performance Communication And Cooperation Ppt Powerpoint Presentation Infographics Introduction
This is a factors affecting work performance communication and cooperation ppt powerpoint presentation infographics introduction. This is a four stage process. The stages in this process are business outcomes, business results, business output.
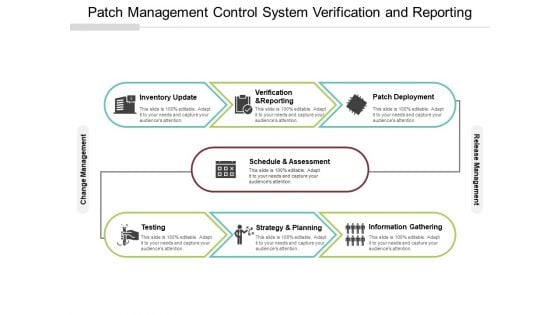
Patch Management Control System Verification And Reporting Ppt PowerPoint Presentation Infographics Backgrounds
This is a patch management control system verification and reporting ppt powerpoint presentation infographics backgrounds. This is a seven stage process. The stages in this process are patch management process, patch management procedure, patch management approach.
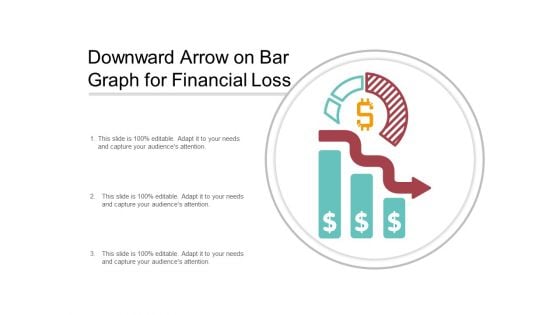
Downward Arrow On Bar Graph For Financial Loss Ppt PowerPoint Presentation Infographics Sample
This is a downward arrow on bar graph for financial loss ppt powerpoint presentation infographics sample. This is a three stage process. The stages in this process are business failure, unsuccessful business, business non success.

Implementing Clm Negotiate Approve Track And Renew Ppt PowerPoint Presentation Infographics Objects
This is a implementing clm negotiate approve track and renew ppt powerpoint presentation infographics objects. This is a eight stage process. The stages in this process are contract management, contract negotiation, deal making.
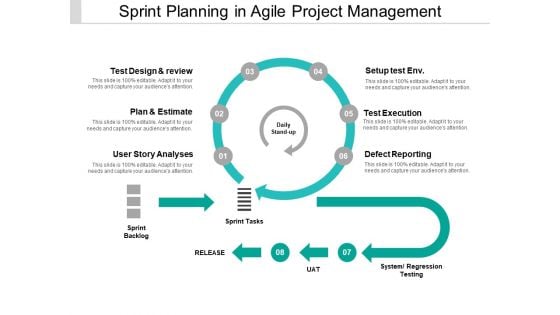
Sprint Planning In Agile Project Management Ppt PowerPoint Presentation Infographics Sample
This is a sprint planning in agile project management ppt powerpoint presentation infographics sample. This is a six stage process. The stages in this process are agile cycle, sprint cycle, scrum cycle.
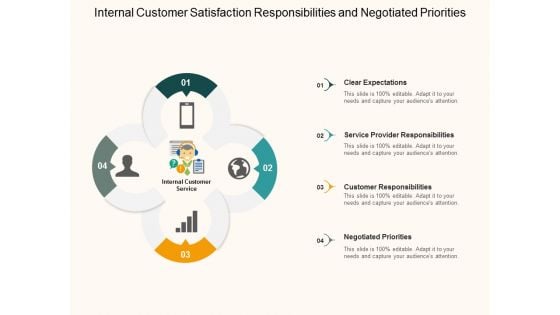
Internal Customer Satisfaction Responsibilities And Negotiated Priorities Ppt PowerPoint Presentation Infographics Aids
This is a internal customer satisfaction responsibilities and negotiated priorities ppt powerpoint presentation infographics aids. This is a four stage process. The stages in this process are internal customer services, internal customer satisfaction, internal customer management.
Eleven Steps Workflow Management With Icons Ppt PowerPoint Presentation Infographics Slides
This is a eleven steps workflow management with icons ppt powerpoint presentation infographics slides. This is a eleven stage process. The stages in this process are 10 circle, 10 circular diagram, 10 cycle.
Eleven Business Steps With Text Holders And Icons Ppt PowerPoint Presentation Infographics Guidelines
This is a eleven business steps with text holders and icons ppt powerpoint presentation infographics guidelines. This is a eleven stage process. The stages in this process are 10 circle, 10 circular diagram, 10 cycle.
Ten Business Steps With Text Holders And Icons Ppt PowerPoint Presentation Infographics Example
This is a ten business steps with text holders and icons ppt powerpoint presentation infographics example. This is a ten stage process. The stages in this process are 10 circle, 10 circular diagram, 10 cycle.
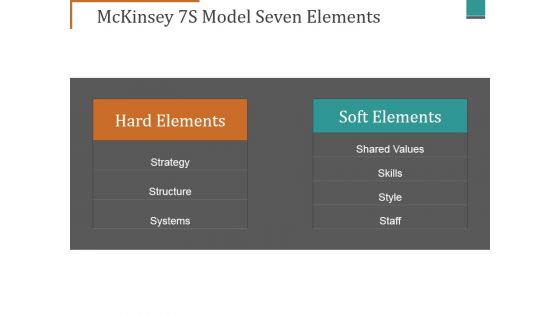
Mckinsey 7S Model Seven Elements Ppt PowerPoint Presentation Infographics Designs Download
This is a mckinsey 7s model seven elements ppt powerpoint presentation infographics designs download. This is a six stage process. The stages in this process are strategy, structure, systems, staff, style, skills, shared values.

Market Segmentation Evolution Companys Core Competency Template 1 Ppt PowerPoint Presentation Infographics Styles
This is a market segmentation evolution companys core competency template 1 ppt powerpoint presentation infographics styles. This is a four stage process. The stages in this process are bargaining power of suppliers, barriers to entry, bargaining power of buyers, substitutes.
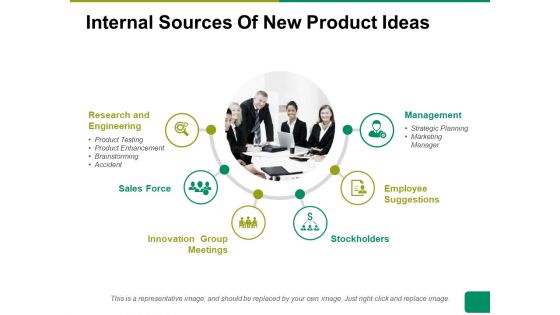
Internal Sources Of New Product Ideas Ppt PowerPoint Presentation Infographics Inspiration
This is a internal sources of new product ideas ppt powerpoint presentation infographics inspiration. This is a six stage process. The stages in this process are management, employee suggestions, stockholders, sales force, innovation group meetings.
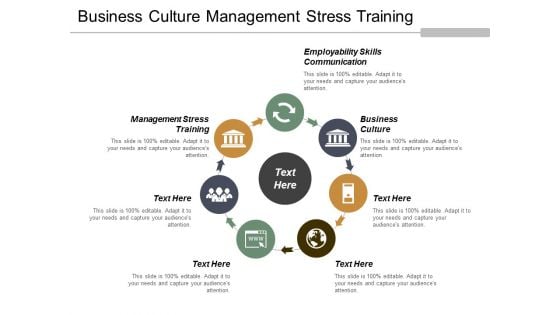
Business Culture Management Stress Training Employability Skills Communication Ppt PowerPoint Presentation Infographics Example
This is a business culture management stress training employability skills communication ppt powerpoint presentation infographics example. This is a seven stage process. The stages in this process are business culture, management stress training, employability skills communication.

Emotional Intelligence Marketing Mix Employees Appraisal Operation Research Ppt PowerPoint Presentation Infographics Layouts
This is a emotional intelligence marketing mix employees appraisal operation research ppt powerpoint presentation infographics layouts. This is a four stage process. The stages in this process are emotional intelligence, marketing mix, employees appraisal, operation research.

Project Management Lifecycle Formulation Approval Implementation Ppt PowerPoint Presentation Infographics Template
This is a project management lifecycle formulation approval implementation ppt powerpoint presentation infographics template. This is a four stage process. The stages in this process are project management, project management process, project management cycle.
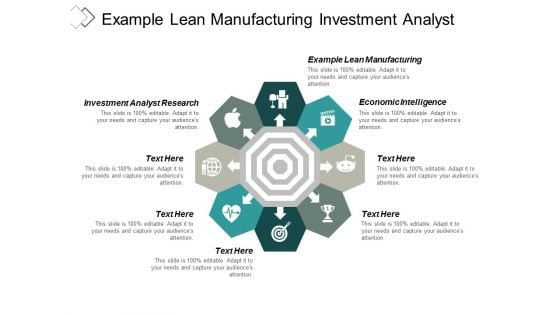
Example Lean Manufacturing Investment Analyst Research Economic Intelligence Ppt PowerPoint Presentation Infographics Demonstration
This is a example lean manufacturing investment analyst research economic intelligence ppt powerpoint presentation infographics demonstration. This is a eight stage process. The stages in this process are example lean manufacturing, investment analyst research, economic intelligence.
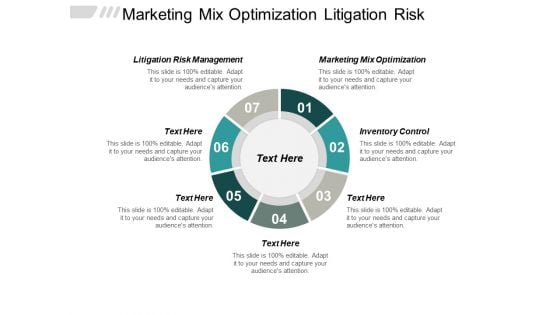
Marketing Mix Optimization Litigation Risk Management Inventory Control Ppt PowerPoint Presentation Infographics Show
This is a marketing mix optimization litigation risk management inventory control ppt powerpoint presentation infographics show. This is a seven stage process. The stages in this process are marketing mix optimization, litigation risk management, inventory control.
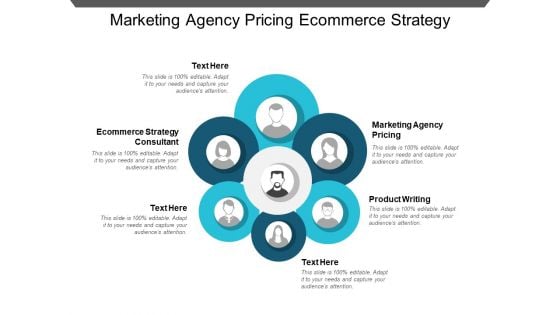
Marketing Agency Pricing Ecommerce Strategy Consultant Product Writing Ppt PowerPoint Presentation Infographics Model
This is a marketing agency pricing ecommerce strategy consultant product writing ppt powerpoint presentation infographics model. This is a six stage process. The stages in this process are marketing agency pricing, ecommerce strategy consultant, product writing.
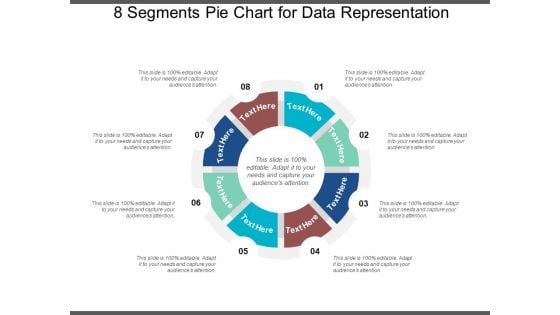
8 Segments Pie Chart For Data Representation Ppt PowerPoint Presentation Infographics Design Templates
This is a 8 segments pie chart for data representation ppt powerpoint presentation infographics design templates. This is a eight stage process. The stages in this process are 6 piece pie chart, 6 segment pie chart, 6 parts pie chart.
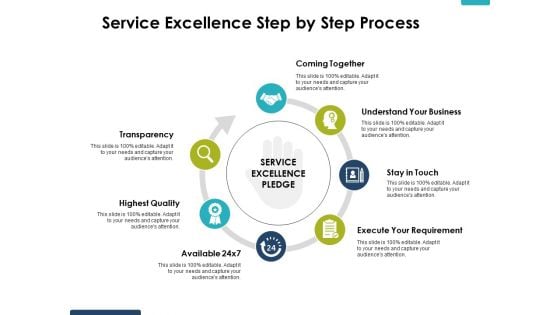
Service Excellence Step By Step Process Ppt PowerPoint Presentation Infographics Topics
This is a service excellence step by step process ppt powerpoint presentation infographics topics. This is a seven stage process. The stages in this process are transparency, highest quality, understand your business.
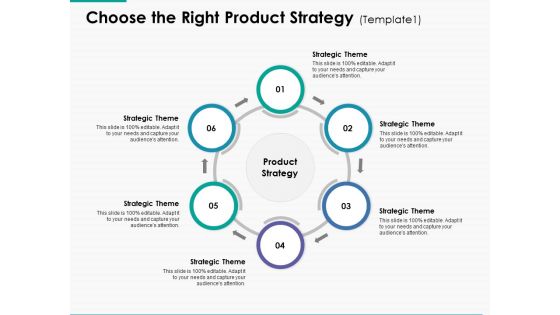
Choose The Right Product Strategy Marketing Ppt Powerpoint Presentation Infographics Guidelines
This is a choose the right product strategy marketing ppt powerpoint presentation infographics guidelines. This is a six stage process. The stages in this process are product strategy, strategic theme, business, management, strategy.
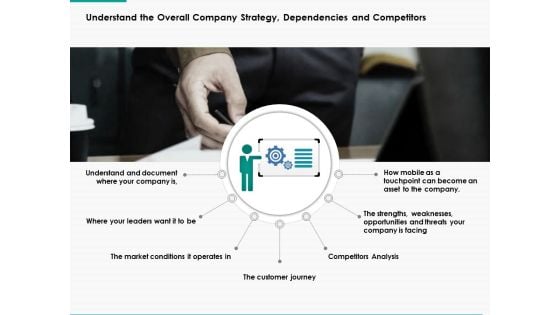
Understand The Overall Company Strategy Dependencies And Competitors Ppt Powerpoint Presentation Infographics Example File
This is a understand the overall company strategy dependencies and competitors ppt powerpoint presentation infographics example file. This is a seven stage process. The stages in this process are business, management, planning, strategy, marketing.
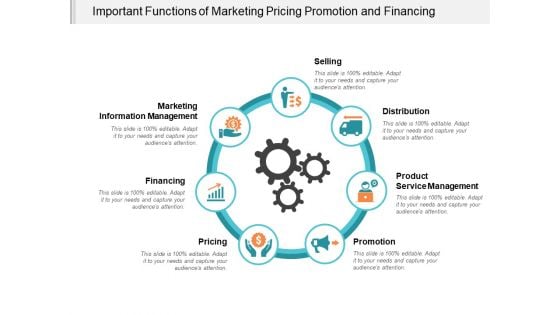
Important Functions Of Marketing Pricing Promotion And Financing Ppt Powerpoint Presentation Infographics Introduction
This is a important functions of marketing pricing promotion and financing ppt powerpoint presentation infographics introduction. This is a seven stage process. The stages in this process are core functions, main functions, key functions.
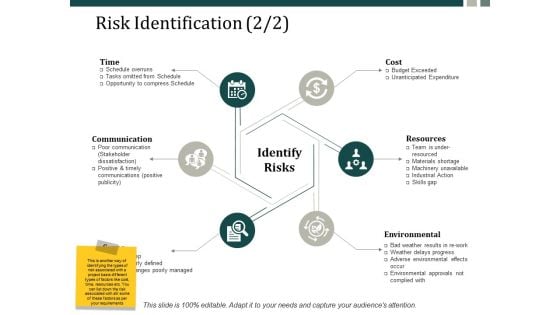
Risk Identification Communication Ppt Powerpoint Presentation Inspiration Designs Ppt Powerpoint Presentation Infographics Slide Portrait
This is a risk identification communication ppt powerpoint presentation inspiration designs ppt powerpoint presentation infographics slide portrait. This is a six stage process. The stages in this process are identify risks, communication, cost, resources, environmental.
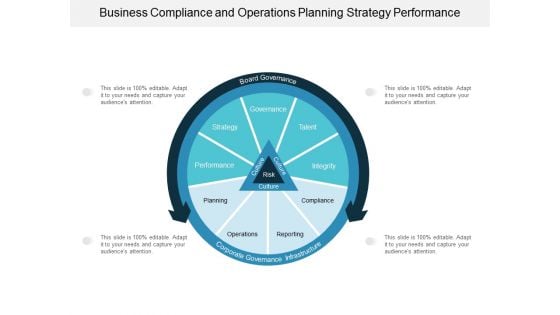
Business Compliance And Operations Planning Strategy Performance Ppt Powerpoint Presentation Infographics Portrait
This is a business compliance and operations planning strategy performance ppt powerpoint presentation infographics portrait. This is a four stage process. The stages in this process are governance model, governance flow, governance structures.


 Continue with Email

 Home
Home


