5 Stages
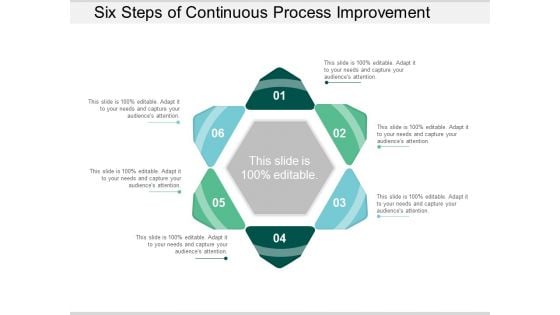
Six Steps Of Continuous Process Improvement Ppt Powerpoint Presentation Infographic Template Graphics Design
This is a six steps of continuous process improvement ppt powerpoint presentation infographic template graphics design. This is a six stage process. The stages in this process are 6 circular arrows, 6 cyclic arrows, six circular arrows.

Problems Of Online Business Ppt PowerPoint Presentation Outline Grid
This is a problems of online business ppt powerpoint presentation outline grid. This is a five stage process. The stages in this process are checklist, list of ideas, pain points.

Social Media Campaigns Guide Template Ppt Infographic Template
This is a social media campaigns guide template ppt infographic template. This is a four stage process. The stages in this process are define your forget market, map out your funnels, optimize results, launch the campaign.
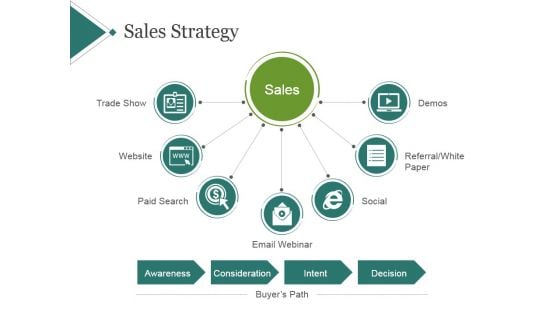
Sales Strategy Template 2 Ppt PowerPoint Presentation Infographic Template
This is a sales strategy template 2 ppt powerpoint presentation infographic template. This is a seven stage process. The stages in this process are website, trade show, paid search, social.
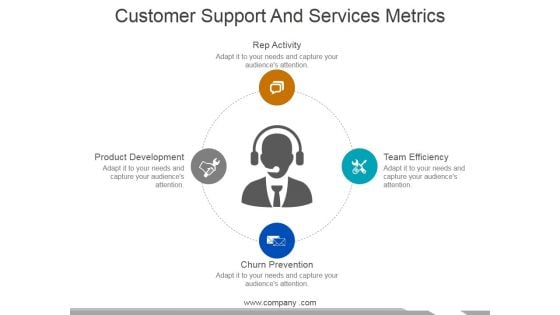
Customer Support And Services Metrics Ppt PowerPoint Presentation Infographics Ideas
This is a customer support and services metrics ppt powerpoint presentation infographics ideas. This is a four stage process. The stages in this process are rep activity, team efficiency, churn prevention, product development.
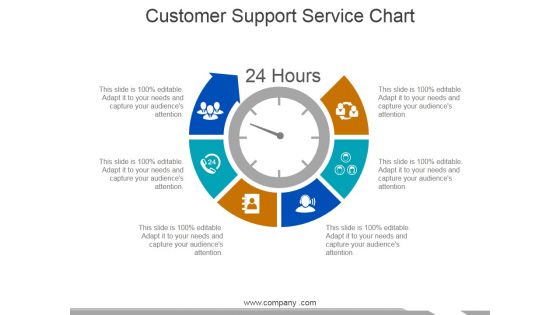
Customer Support Service Chart Ppt PowerPoint Presentation Infographic Template Graphics
This is a customer support service chart ppt powerpoint presentation infographic template graphics. This is a six stage process. The stages in this process are business, icons, strategy, marketing.
Email Marketing Report Ppt Powerpoint Presentation Infographic Template Icons
This is a email marketing report ppt powerpoint presentation infographic template icons. This is a four stage process. The stages in this process are opens, click rate, unopened, bounces.
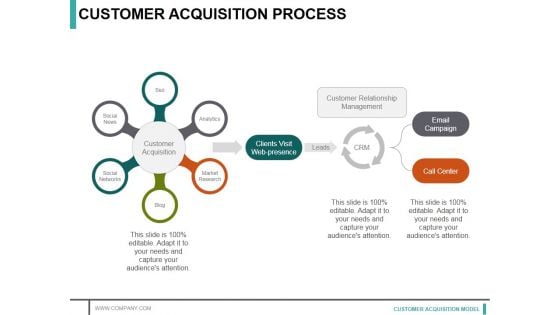
Customer Acquisition Process Ppt PowerPoint Presentation Infographics Master Slide
This is a customer acquisition process ppt powerpoint presentation infographics master slide. This is a six stage process. The stages in this process are seo, analytics, market research, blog, social networks.
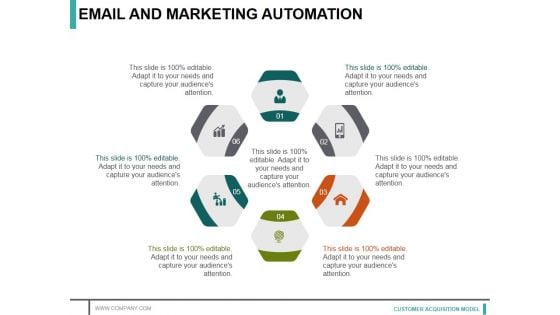
Email And Marketing Automation Ppt PowerPoint Presentation Infographic Template Microsoft
This is a email and marketing automation ppt powerpoint presentation infographic template microsoft. This is a six stage process. The stages in this process are process, marketing, icons, strategy, business.
Marketing Automation Ppt PowerPoint Presentation Infographic Template Icons
This is a marketing automation ppt powerpoint presentation infographic template icons. This is a ten stage process. The stages in this process are nurture marketing, email marketing, web tracking, integrations, social discovery.

Client Referral Report Ppt PowerPoint Presentation Infographic Template Graphics Tutorials
This is a client referral report ppt powerpoint presentation infographic template graphics tutorials. This is a three stage process. The stages in this process are received referrals, sent referrals, calendar events, proposal sent, proposal converted.
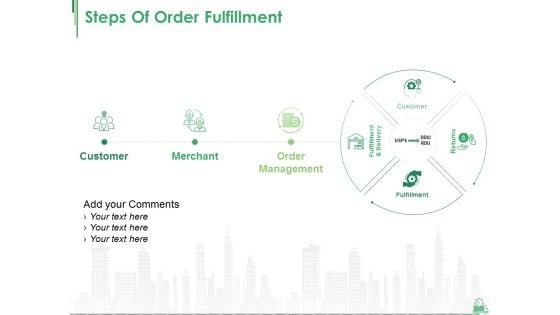
Steps Of Order Fulfillment Ppt PowerPoint Presentation Infographics Pictures
This is a steps of order fulfillment ppt powerpoint presentation infographics pictures. This is a four stage process. The stages in this process are customer, merchant, order management, fulfillment, returns.
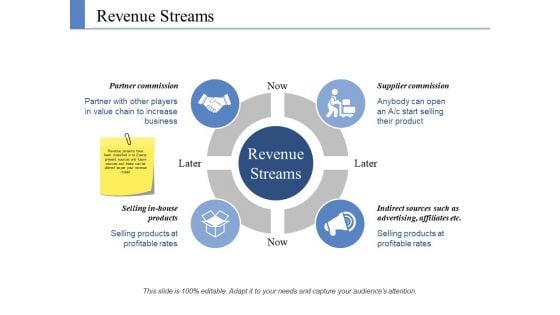
Revenue Streams Ppt PowerPoint Presentation Infographic Template Format Ideas
This is a revenue streams ppt powerpoint presentation infographic template format ideas. This is a four stage process. The stages in this process are now, supplier commission, later, partner commission, selling in house products.
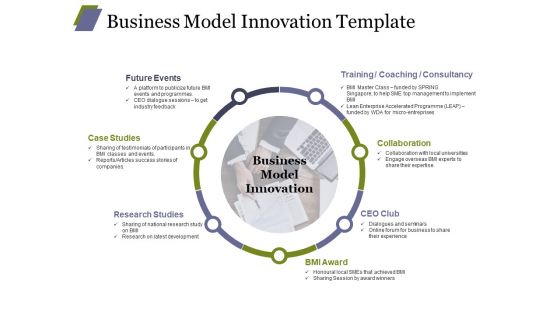
Business Model Innovation Template Ppt PowerPoint Presentation Infographics Graphics Download
This is a business model innovation template ppt powerpoint presentation infographics graphics download. This is a seven stage process. The stages in this process are collaboration, ceo club, bmi award, future events, research studies.
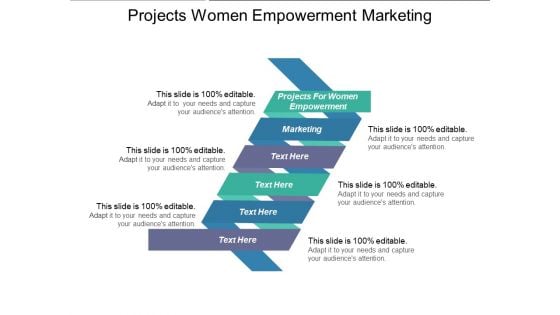
Projects Women Empowerment Marketing Ppt PowerPoint Presentation Infographic Template Outline
This is a projects women empowerment marketing ppt powerpoint presentation infographic template outline. This is a six stage process. The stages in this process are projects women empowerment, marketing.
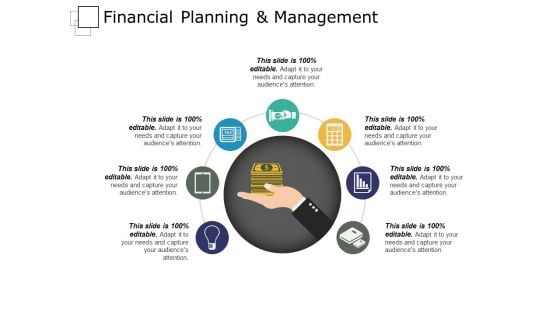
Financial Planning And Management Ppt PowerPoint Presentation Infographic Template Slideshow
This is a financial planning and management ppt powerpoint presentation infographic template slideshow. This is a seven stage process. The stages in this process are support, assistance, hand holding.
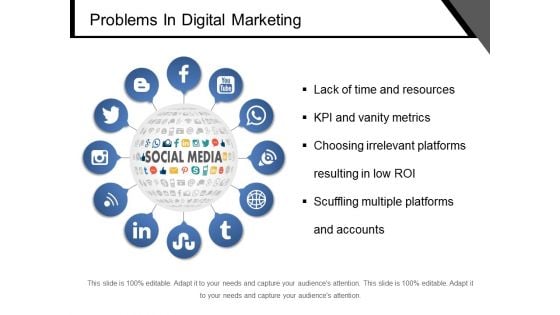
Problems In Digital Marketing Ppt PowerPoint Presentation Infographic Template Display
This is a problems in digital marketing ppt powerpoint presentation infographic template display. This is a four stage process. The stages in this process are checklist, list of ideas, pain points.
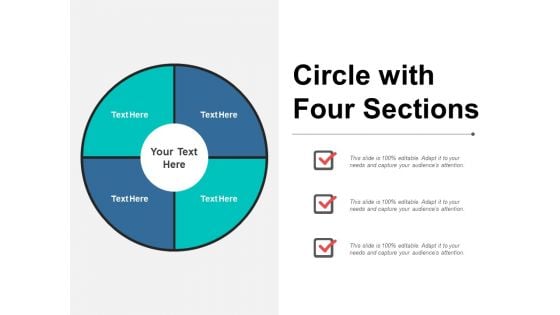
Circle With Four Sections Ppt PowerPoint Presentation Infographics Slides
This is a circle with four sections ppt powerpoint presentation infographics slides. This is a three stage process. The stages in this process are sectioned circle, segmented circle, partitioned circle.
Differentiators Marketing Icons Ppt PowerPoint Presentation Infographic Template Outfit
This is a differentiators marketing icons ppt powerpoint presentation infographic template outfit. This is a six stage process. The stages in this process are business, management, strategy, icons, marketing.

Business Process Integration Ppt PowerPoint Presentation Infographics Objects
This is a business process integration ppt powerpoint presentation infographics objects. This is a three stage process. The stages in this process are process integration, integration of processes, integration of procedure.
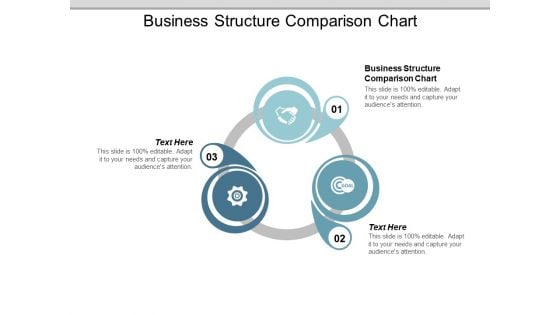
Business Structure Comparison Chart Ppt PowerPoint Presentation Infographic Template Vector
This is a business structure comparison chart ppt powerpoint presentation infographic template vector. This is a three stage process. The stages in this process are business structure comparison chart.
Circle Of Colourful Human Hands Ppt PowerPoint Presentation Infographics Elements
This is a circle of colourful human hands ppt powerpoint presentation infographics elements. This is a four stage process. The stages in this process are human hand with circle of icons, unity hand circle icons, teamwork hand circle of icons.
Consumer Loyalty Vector Icon Ppt Powerpoint Presentation Icon Infographic Template
This is a consumer loyalty vector icon ppt powerpoint presentation icon infographic template. This is a three stage process. The stages in this process are customer satisfaction, customer services, customer engagement model.
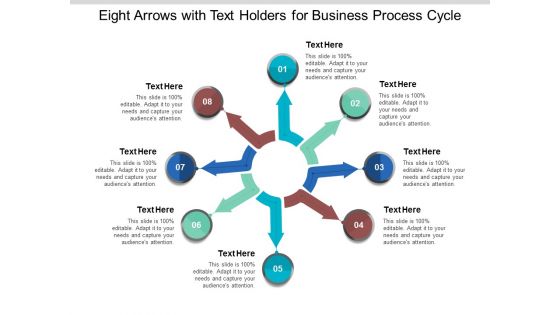
Eight Arrows With Text Holders For Business Process Cycle Ppt Powerpoint Presentation Infographics Example Introduction
This is a eight arrows with text holders for business process cycle ppt powerpoint presentation infographics example introduction. This is a eight stage process. The stages in this process are 6 circular arrows, 6 cyclic arrows, six circular arrows.
Seven Arrows Around Target Board With Icons Ppt Powerpoint Presentation Infographic Template Designs Download
This is a seven arrows around target board with icons ppt powerpoint presentation infographic template designs download. This is a seven stage process. The stages in this process are 6 circular arrows, 6 cyclic arrows, six circular arrows.
Six Arrows In Circle With Team Icon And Text Holders Ppt Powerpoint Presentation Infographic Template Guidelines
This is a six arrows in circle with team icon and text holders ppt powerpoint presentation infographic template guidelines. This is a six stage process. The stages in this process are 6 circular arrows, 6 cyclic arrows, six circular arrows.
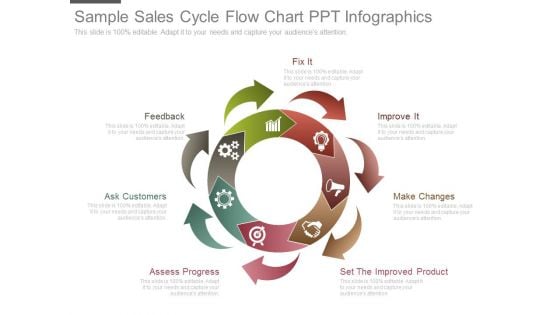
Sample Sales Cycle Flow Chart Ppt Infographics
This is a sample sales cycle flow chart ppt infographics. This is a seven stage process. The stages in this process are fix it, feedback, ask customers, assess progress, set the improved product, make changes, improve it.

Ecommerce Marketing Strategy Diagram Ppt Infographic Template
This is a ecommerce marketing strategy diagram ppt infographic template. This is a four stage process. The stages in this process are ad words method, social media ad, banner ads, seo tactics.
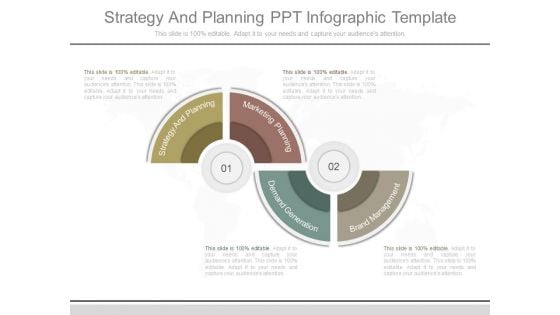
Strategy And Planning Ppt Infographic Template
This is a strategy and planning ppt infographic template. This is a two stage process. The stages in this process are strategy and planning, marketing planning, demand generation, brand management.
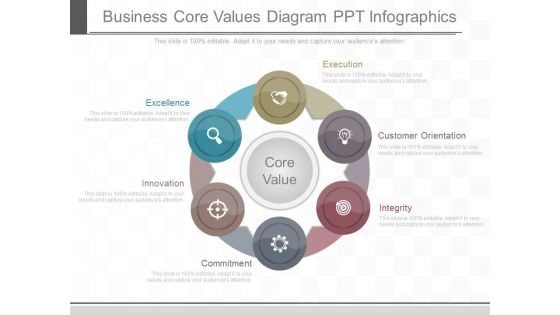
Business Core Values Diagram Ppt Infographics
This is a business core values diagram ppt infographics. This is a six stage process. The stages in this process are execution, customer orientation, integrity, commitment, innovation, excellence, core value.
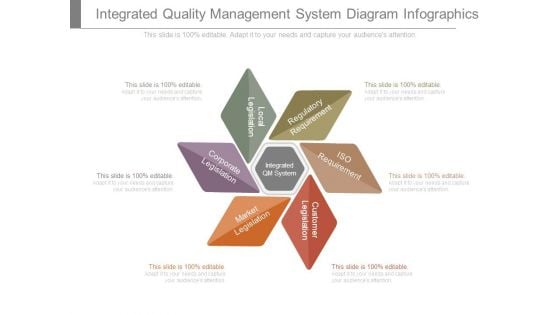
Integrated Quality Management System Diagram Infographics
This is a integrated quality management system diagram infographics. This is a six stage process. The stages in this process are integrated qm system, corporate legislation, local legislation, regulatory requirement, iso requirement, customer legislation, market legislation.
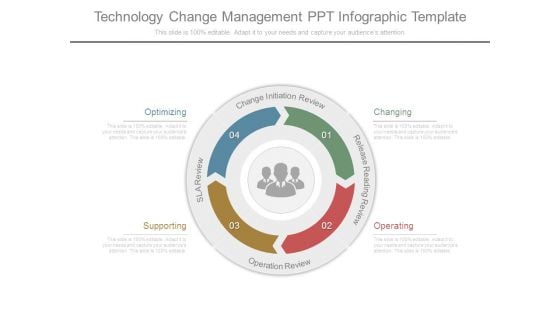
Technology Change Management Ppt Infographic Template
This is a technology change management ppt infographic template. This is a four stage process. The stages in this process are sla review, operation review, release reading review, change initiation review, optimizing, supporting, operating, changing.
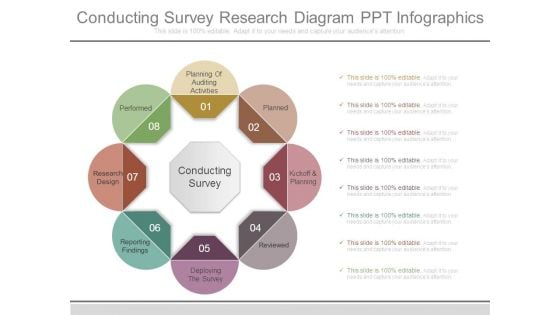
Conducting Survey Research Diagram Ppt Infographics
This is a conducting survey research diagram ppt infographics. This is a eight stage process. The stages in this process are planned, kickoff and planning, reviewed, deploying the survey, reporting findings, research design, performed, planning of auditing activities, conducting survey.
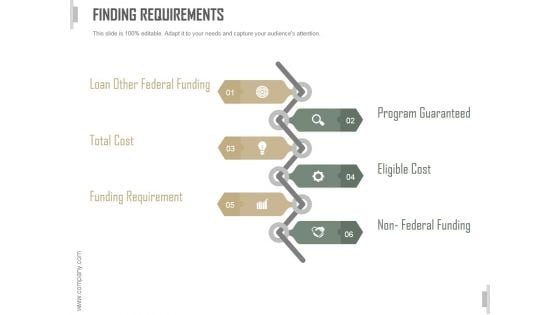
Finding Requirements Ppt PowerPoint Presentation Infographic Template
This is a finding requirements ppt powerpoint presentation infographic template. This is a six stage process. The stages in this process are loan other federal funding, total cost, funding requirement, program guaranteed , eligible cost, non federal funding.
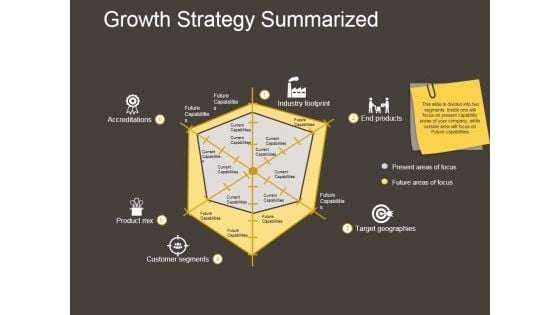
Growth Strategy Summarized Ppt PowerPoint Presentation Infographics
This is a growth strategy summarized ppt powerpoint presentation infographics. This is a six stage process. The stages in this process are accreditations, product mix, customer segments, target geographies, end products, industry footprint.
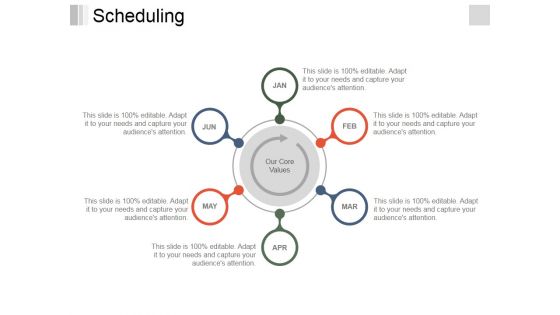
Scheduling Ppt PowerPoint Presentation Infographics Slides
This is a scheduling ppt powerpoint presentation infographics slides. This is a six stage process. The stages in this process are jan, feb, mar, apr, may, jun, our core values.
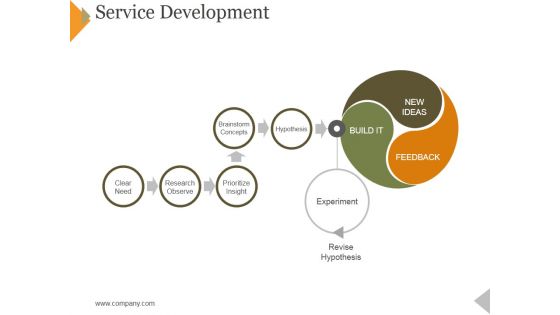
Service Development Ppt PowerPoint Presentation Infographics Visuals
This is a service development ppt powerpoint presentation infographics visuals. This is a three stage process. The stages in this process are brainstorm concepts, prioritize insight, hypothesis, experiment, clear need.

Financial Measures Ppt PowerPoint Presentation Model Infographics
This is a financial measures ppt powerpoint presentation model infographics. This is a seven stage process. The stages in this process are cost of raw material, revenue from goods sold, inventory holding cost, transportation cost, cost of expired perishable goods.
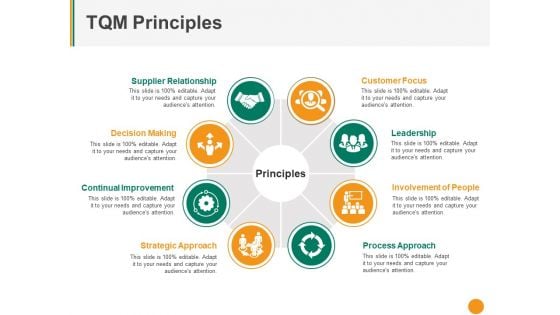
Tqm Principles Ppt PowerPoint Presentation Model Infographics
This is a tqm principles ppt powerpoint presentation model infographics. This is a eight stage process. The stages in this process are supplier relationship, decision making, continual improvement, strategic approach, process approach.
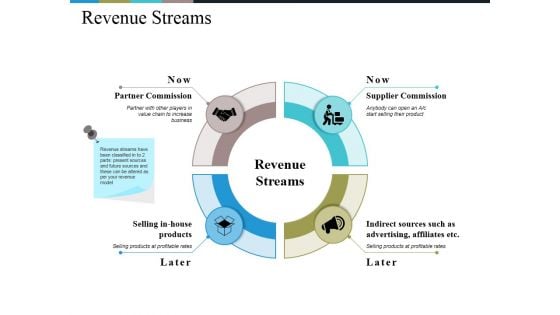
Revenue Streams Ppt PowerPoint Presentation Infographics Layout
This is a revenue streams ppt powerpoint presentation infographics layout. This is a four stage process. The stages in this process are partner commission, supplier commission, selling in house products, indirect sources such as advertising, affiliates etc.
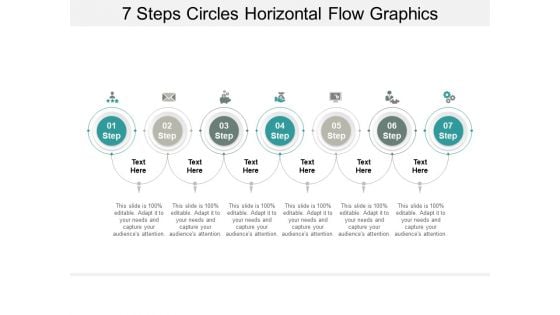
Seven Circle Steps Business Infographics Ppt PowerPoint Presentation Infographic Template Slide Portrait
This is a seven circle steps business infographics ppt powerpoint presentation infographic template slide portrait. This is a seven stage process. The stages in this process are 10 circle, 10 circular diagram, 10 cycle.
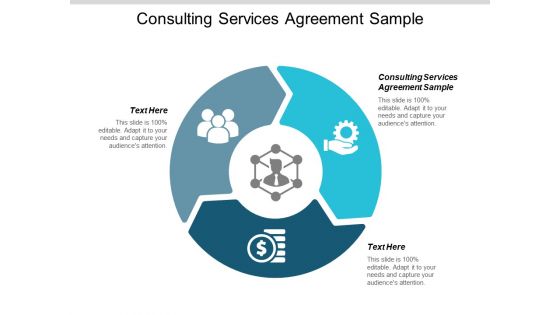
Consulting Services Agreement Sample Ppt PowerPoint Presentation Infographic Template Infographic Template Cpb
This is a consulting services agreement sample ppt powerpoint presentation infographic template infographic template cpb. This is a three stage process. The stages in this process are consulting services agreement sample, management, marketing, business.
Six Sections Business Process Flow Ppt PowerPoint Presentation Icon Infographics
This is a six sections business process flow ppt powerpoint presentation icon infographics. This is a six stage process. The stages in this process are 6 circular arrows, 6 circle arrows, 6 cycle arrows.
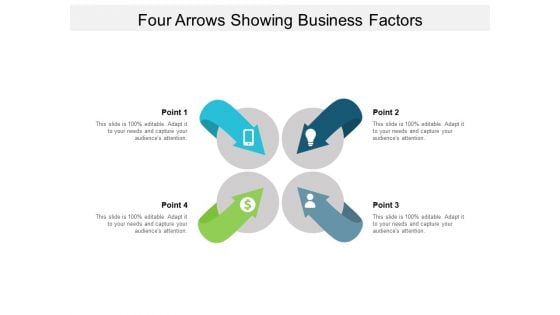
Four Arrows Showing Buisness Factors Ppt PowerPoint Presentation Ideas Infographics
This is a four arrows showing buisness factors ppt powerpoint presentation ideas infographics. This is a four stage process. The stages in this process are circle process 4 arrows, circle cycle 4 arrows, circular process 4 arrows.
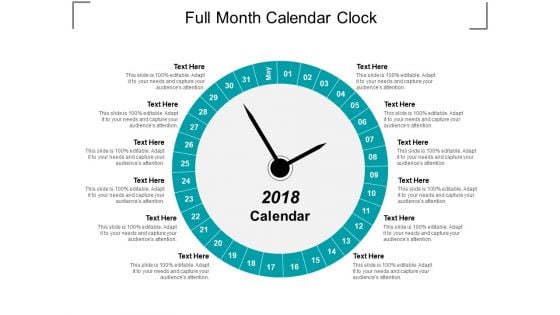
Full Month Calendar Clock Ppt Powerpoint Presentation Infographic Template Clipart
This is a full month calendar clock ppt powerpoint presentation infographic template clipart. This is a twelve stage process. The stages in this process are circular calendar, circle calendar, cyclic calendar.
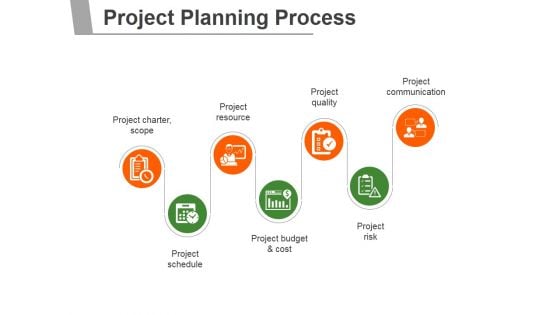
Project Planning Process Ppt PowerPoint Presentation Infographics
This is a project planning process ppt powerpoint presentation infographics. This is a seven stage process. The stages in this process are project charter scope, project resource, project quality, project communication, project schedule, project budget and cost, project risk.
Local Marketing Platform Ppt PowerPoint Presentation Icon Design Inspiration Cpb
This is a local marketing platform ppt powerpoint presentation icon design inspiration cpb. This is a five stage process. The stages in this process are technology, marketing, business, management.
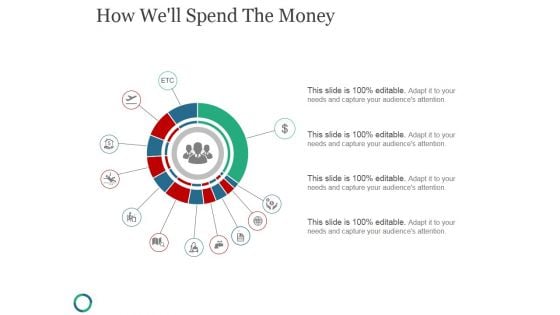
How Well Spend The Money Ppt PowerPoint Presentation Infographic Template
This is a how well spend the money ppt powerpoint presentation infographic template. This is a twelve stage process. The stages in this process are business, process, circular, marketing, management.
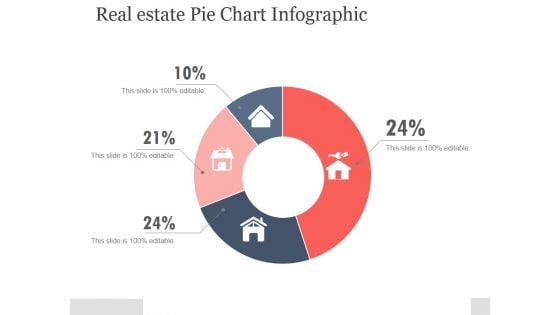
Real Estate Pie Chart Infographic Ppt PowerPoint Presentation Portfolio
This is a real estate pie chart infographic ppt powerpoint presentation portfolio. This is a four stage process. The stages in this process are circular, business, icons, marketing, process.
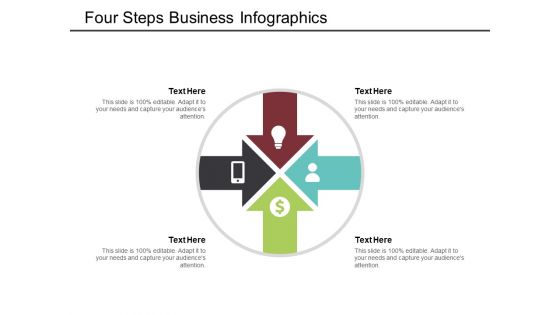
Four Steps Business Infographics Ppt PowerPoint Presentation Model Visual Aids
This is a four steps business infographics ppt powerpoint presentation model visual aids. This is a four stage process. The stages in this process are circle process 4 arrows, circle cycle 4 arrows, circular process 4 arrows.
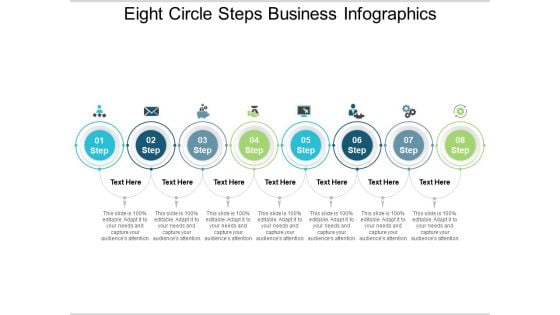
Eight Circle Steps Business Infographics Ppt PowerPoint Presentation Summary Slides
This is a eight circle steps business infographics ppt powerpoint presentation summary slides. This is a eight stage process. The stages in this process are 10 circle, 10 circular diagram, 10 cycle.
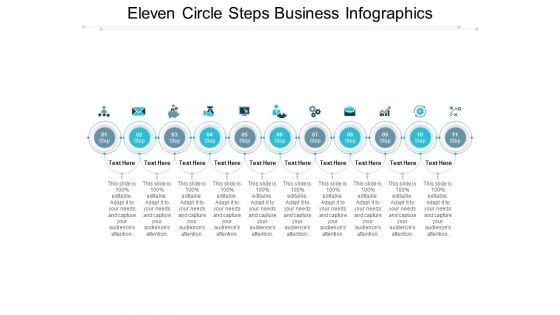
Eleven Circle Steps Business Infographics Ppt PowerPoint Presentation Layouts Example
This is a eleven circle steps business infographics ppt powerpoint presentation layouts example. This is a eleven stage process. The stages in this process are 10 circle, 10 circular diagram, 10 cycle.
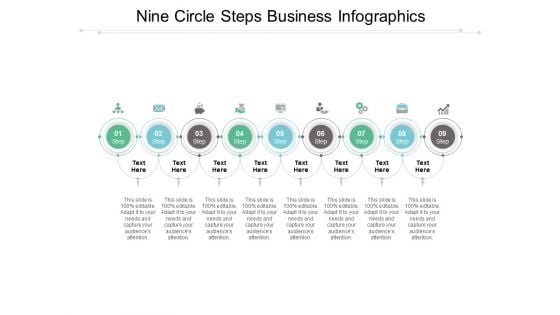
Nine Circle Steps Business Infographics Ppt PowerPoint Presentation Shapes
This is a nine circle steps business infographics ppt powerpoint presentation shapes. This is a nine stage process. The stages in this process are 10 circle, 10 circular diagram, 10 cycle.
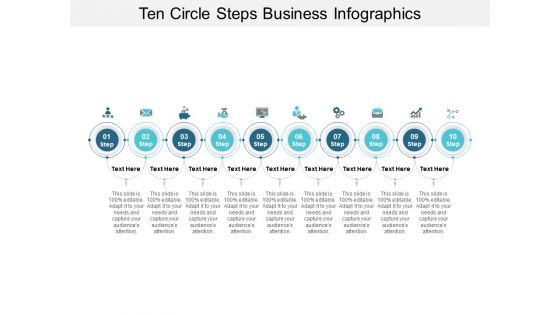
Ten Circle Steps Business Infographics Ppt PowerPoint Presentation Gallery Ideas
This is a ten circle steps business infographics ppt powerpoint presentation gallery ideas. This is a ten stage process. The stages in this process are 10 circle, 10 circular diagram, 10 cycle.
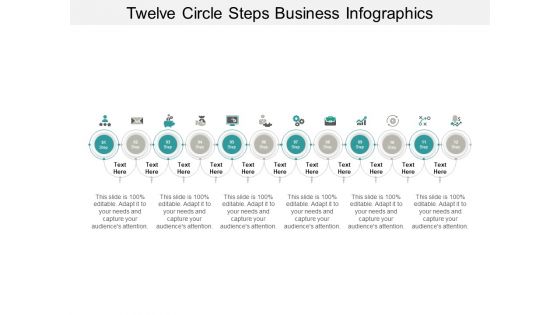
Twelve Circle Steps Business Infographics Ppt PowerPoint Presentation Gallery Information
This is a twelve circle steps business infographics ppt powerpoint presentation gallery information. This is a twelve stage process. The stages in this process are 10 circle, 10 circular diagram, 10 cycle.
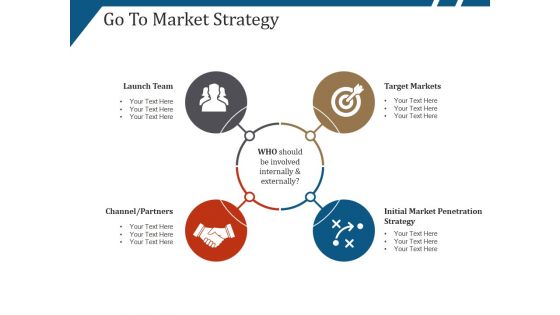
Go To Market Strategy Template 1 Ppt PowerPoint Presentation Pictures Infographics
This is a go to market strategy template 1 ppt powerpoint presentation pictures infographics. This is a four stage process. The stages in this process are launch team, target markets, channel partners.
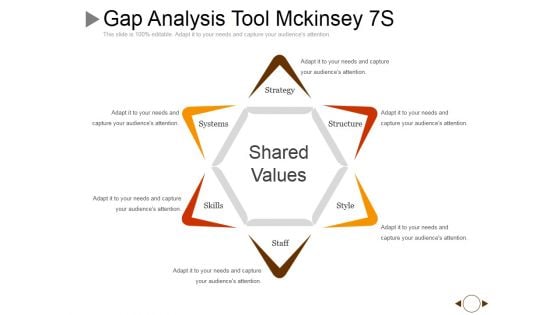
Gap Analysis Tool Mckinsey 7S Ppt PowerPoint Presentation Infographic Template Example
This is a gap analysis tool mckinsey 7s ppt powerpoint presentation infographic template example. This is a six stage process. The stages in this process are strategy, structure, style, staff, skills.

Along With Superior Technical Capabilities Ppt PowerPoint Presentation Infographic Template Background Image
This is a along with superior technical capabilities ppt powerpoint presentation infographic template background image. This is a four stage process. The stages in this process are capability, business, marketing, strategy, process.
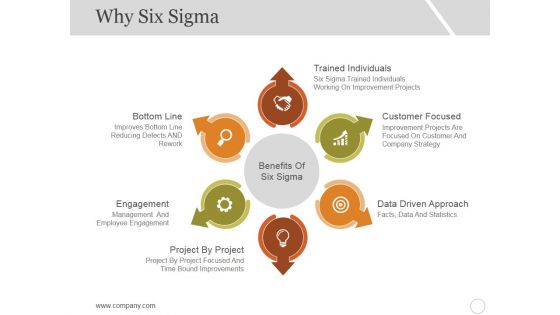
Why Six Sigma Template 2 Ppt PowerPoint Presentation Infographic Template Skills
This is a why six sigma template 2 ppt powerpoint presentation infographic template skills. This is a six stage process. The stages in this process are bottom line, engagement, project by project, customer focused, data driven approach.
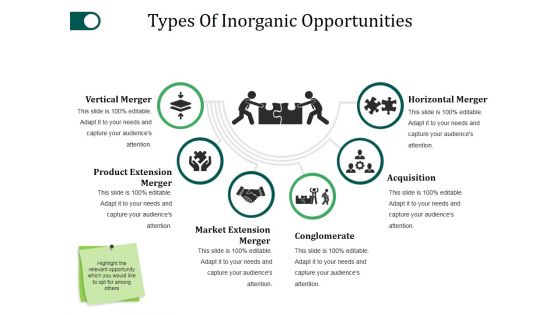
Types Of Inorganic Opportunities Template 2 Ppt PowerPoint Presentation Infographic Template Outline
This is a types of inorganic opportunities template 2 ppt powerpoint presentation infographic template outline. This is a six stage process. The stages in this process are vertical merger, conglomerate, acquisition, horizontal merger, market extension merger.


 Continue with Email

 Home
Home


