5 Year
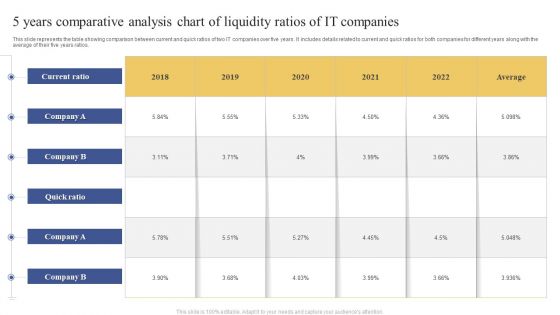
5 Years Comparative Analysis Chart Of Liquidity Ratios Of IT Companies Ppt Portfolio Visual Aids PDF
This slide represents the table showing comparison between current and quick ratios of two IT companies over five years. It includes details related to current and quick ratios for both companies for different years along with the average of their five years ratios. Pitch your topic with ease and precision using this 5 Years Comparative Analysis Chart Of Liquidity Ratios Of IT Companies Ppt Portfolio Visual Aids PDF. This layout presents information on Current Ratio, Average, 2018 To 2022. It is also available for immediate download and adjustment. So, changes can be made in the color, design, graphics or any other component to create a unique layout.
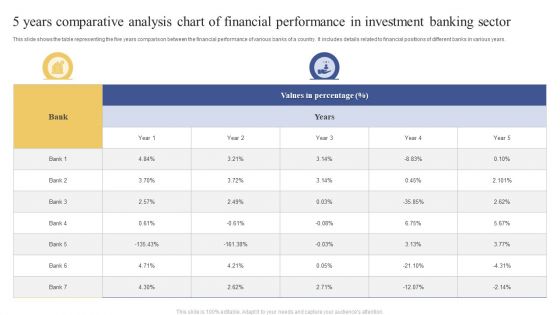
5 Years Comparative Analysis Chart Of Financial Performance In Investment Banking Sector Themes PDF
This slide shows the table representing the five years comparison between the financial performance of various banks of a country. It includes details related to financial positions of different banks in various years. Showcasing this set of slides titled 5 Years Comparative Analysis Chart Of Financial Performance In Investment Banking Sector Themes PDF. The topics addressed in these templates are Values Percentage, Bank, Year. All the content presented in this PPT design is completely editable. Download it and make adjustments in color, background, font etc. as per your unique business setting.
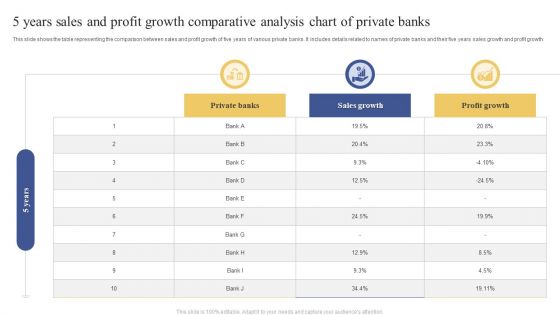
5 Years Sales And Profit Growth Comparative Analysis Chart Of Private Banks Infographics PDF
This slide shows the table representing the comparison between sales and profit growth of five years of various private banks. It includes details related to names of private banks and their five years sales growth and profit growth. Pitch your topic with ease and precision using this 5 Years Sales And Profit Growth Comparative Analysis Chart Of Private Banks Infographics PDF. This layout presents information on Private Banks, Sales Growth, Profit Growth. It is also available for immediate download and adjustment. So, changes can be made in the color, design, graphics or any other component to create a unique layout.
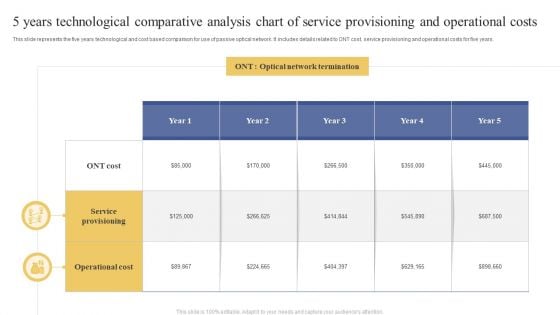
5 Years Technological Comparative Analysis Chart Of Service Provisioning And Operational Costs Information PDF
This slide represents the five years technological and cost based comparison for use of passive optical network. It includes details related to ONT cost, service provisioning and operational costs for five years. Pitch your topic with ease and precision using this 5 Years Technological Comparative Analysis Chart Of Service Provisioning And Operational Costs Information PDF. This layout presents information on Optical Network Termination, Service Provisioning, Operational Cost. It is also available for immediate download and adjustment. So, changes can be made in the color, design, graphics or any other component to create a unique layout.
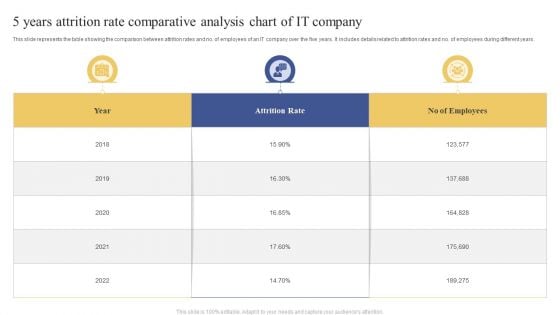
5 Years Attrition Rate Comparative Analysis Chart Of IT Company Ppt Layouts Examples PDF
This slide represents the table showing the comparison between attrition rates and no. of employees of an IT company over the five years. It includes details related to attrition rates and no. of employees during different years. Showcasing this set of slides titled 5 Years Attrition Rate Comparative Analysis Chart Of IT Company Ppt Layouts Examples PDF. The topics addressed in these templates are Attrition Rate, No Employees, 2018 To 2022. All the content presented in this PPT design is completely editable. Download it and make adjustments in color, background, font etc. as per your unique business setting.
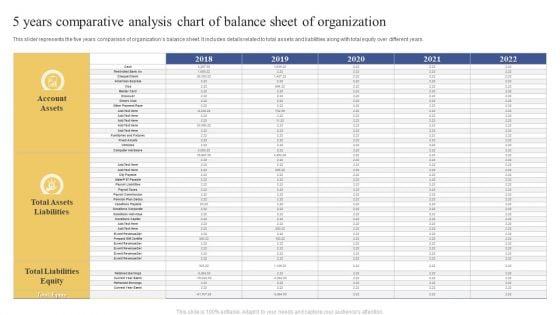
5 Years Comparative Analysis Chart Of Balance Sheet Of Organization Ppt Inspiration Slide PDF
This slider represents the five years comparison of organizations balance sheet. It includes details related to total assets and liabilities along with total equity over different years. Pitch your topic with ease and precision using this 5 Years Comparative Analysis Chart Of Balance Sheet Of Organization Ppt Inspiration Slide PDF. This layout presents information on Account Assets, Total Assets Liabilities, Total Liabilities Equity. It is also available for immediate download and adjustment. So, changes can be made in the color, design, graphics or any other component to create a unique layout.
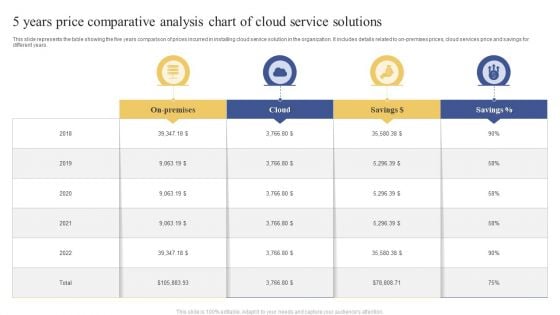
5 Years Price Comparative Analysis Chart Of Cloud Service Solutions Brochure PDF
This slide represents the table showing the five years comparison of prices incurred in installing cloud service solution in the organization. It includes details related to on-premises prices, cloud services price and savings for different years. Showcasing this set of slides titled 5 Years Price Comparative Analysis Chart Of Cloud Service Solutions Brochure PDF. The topics addressed in these templates are Cloud, Savings, 2018 To 2022. All the content presented in this PPT design is completely editable. Download it and make adjustments in color, background, font etc. as per your unique business setting.
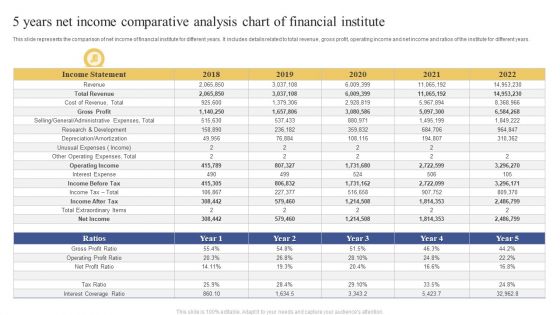
5 Years Net Income Comparative Analysis Chart Of Financial Institute Ppt Show Designs PDF
This slide represents the comparison of net income of financial institute for different years. It includes details related to total revenue, gross profit, operating income and net income and ratios of the institute for different years. Showcasing this set of slides titled 5 Years Net Income Comparative Analysis Chart Of Financial Institute Ppt Show Designs PDF. The topics addressed in these templates are Income Statement, 2018 To 2022, Ratios. All the content presented in this PPT design is completely editable. Download it and make adjustments in color, background, font etc. as per your unique business setting.
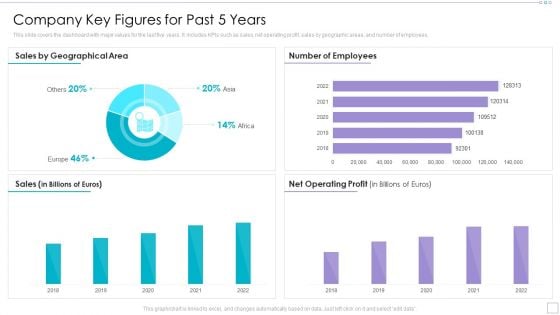
Clothing Business Market Entry Strategy Company Key Figures For Past 5 Years Infographics PDF
This slide covers the dashboard with major values for the last five years. It includes KPIs such as sales, net operating profit, sales by geographic areas, and number of employees. Deliver an awe inspiring pitch with this creative Clothing Business Market Entry Strategy Company Key Figures For Past 5 Years Infographics PDF bundle. Topics like Geographical Area, Operating Profit, Billions Of Euros can be discussed with this completely editable template. It is available for immediate download depending on the needs and requirements of the user.
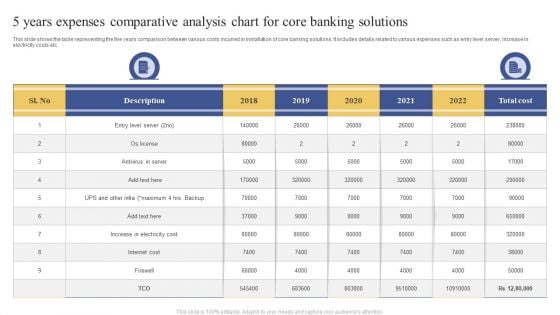
5 Years Expenses Comparative Analysis Chart For Core Banking Solutions Ppt Portfolio Clipart Images PDF
This slide shows the table representing the five years comparison between various costs incurred in installation of core banking solutions. It includes details related to various expenses such as entry level server, increase in electricity costs etc. Pitch your topic with ease and precision using this 5 Years Expenses Comparative Analysis Chart For Core Banking Solutions Ppt Portfolio Clipart Images PDF. This layout presents information on Entry Level Server, Antivirus Server, Increase Electricity Cost. It is also available for immediate download and adjustment. So, changes can be made in the color, design, graphics or any other component to create a unique layout.
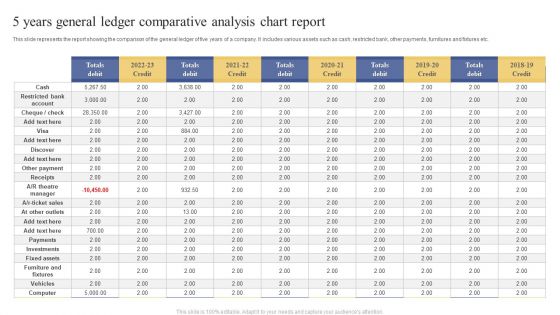
5 Years General Ledger Comparative Analysis Chart Report Ppt Model Slide PDF
This slide represents the report showing the comparison of the general ledger of five years of a company. It includes various assets such as cash, restricted bank, other payments, furnitures and fixtures etc. Showcasing this set of slides titled 5 Years General Ledger Comparative Analysis Chart Report Ppt Model Slide PDF. The topics addressed in these templates are Other Payment, Investments, Fixed Assets. All the content presented in this PPT design is completely editable. Download it and make adjustments in color, background, font etc. as per your unique business setting.
5 Years Profit And Loss Comparative Analysis Chart Of Enterprise Ppt Icon Graphics PDF
This slide represents the comparison of profit and loss of an organization for the five years. It includes details related to profit and loss from various accounts such as order fees, concession income, facility rental etc. Pitch your topic with ease and precision using this 5 Years Profit And Loss Comparative Analysis Chart Of Enterprise Ppt Icon Graphics PDF. This layout presents information on Account, 2018 To 2022, Exchange Fees. It is also available for immediate download and adjustment. So, changes can be made in the color, design, graphics or any other component to create a unique layout.
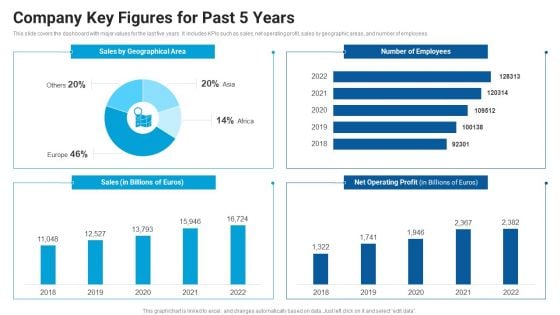
Company Key Figures For Past 5 Years Market Entry Approach For Apparel Sector Clipart PDF
This slide covers the dashboard with major values for the last five years. It includes KPIs such as sales, net operating profit, sales by geographic areas, and number of employees. Deliver an awe inspiring pitch with this creative Company Key Figures For Past 5 Years Market Entry Approach For Apparel Sector Clipart PDF bundle. Topics like Sales Geographical, Number Employees, Operating Profit can be discussed with this completely editable template. It is available for immediate download depending on the needs and requirements of the user.
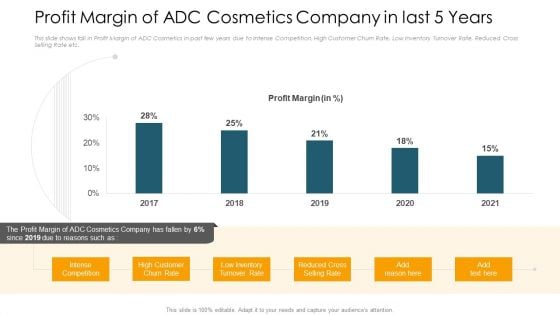
Profit Margin Of ADC Cosmetics Company In Last 5 Years Background PDF
This slide shows fall in Profit Margin of ADC Cosmetics in past few years due to Intense Competition, High Customer Churn Rate, Low Inventory Turnover Rate, Reduced Cross Selling Rate etc. Deliver and pitch your topic in the best possible manner with this profit margin of adc cosmetics company in last 5 years background pdf. Use them to share invaluable insights on intense competition, low inventory turnover rate, 2017 to 2021 and impress your audience. This template can be altered and modified as per your expectations. So, grab it now.
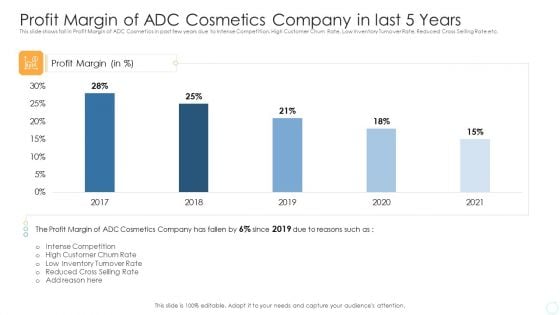
Profit Margin Of ADC Cosmetics Company In Last 5 Years Information PDF
This slide shows fall in Profit Margin of ADC Cosmetics in past few years due to Intense Competition, High Customer Churn Rate, Low Inventory Turnover Rate, Reduced Cross Selling Rate etc. Deliver and pitch your topic in the best possible manner with this profit margin of adc cosmetics company in last 5 years information pdf. Use them to share invaluable insights on profit margin, high customer churn rate, low inventory turnover rate, reduced cross selling rate and impress your audience. This template can be altered and modified as per your expectations. So, grab it now.
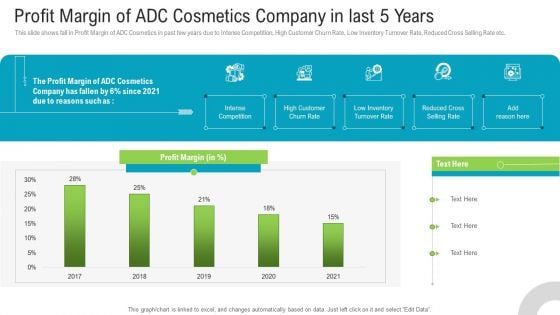
Profit Margin Of Adc Cosmetics Company In Last 5 Years Designs PDF
This slide shows fall in Profit Margin of ADC Cosmetics in past few years due to Intense Competition, High Customer Churn Rate, Low Inventory Turnover Rate, Reduced Cross Selling Rate etc. Deliver and pitch your topic in the best possible manner with this profit margin of adc cosmetics company in last 5 years designs pdf. Use them to share invaluable insights on profit margin, customer churn rate, low inventory turnover rate and impress your audience. This template can be altered and modified as per your expectations. So, grab it now.
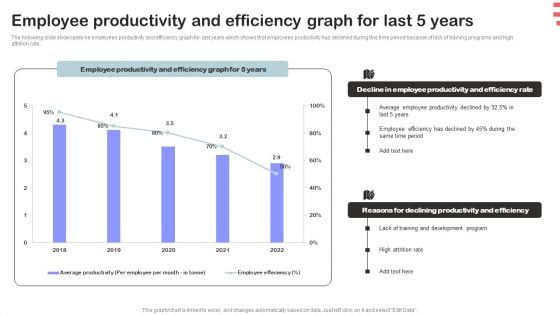
Corporate Training Program Employee Productivity And Efficiency Graph For Last 5 Years Elements PDF
The following slide showcases he employees productivity and efficiency graph for last years which shows that employees productivity has declined during this time period because of lack of training programs and high attrition rate. Make sure to capture your audiences attention in your business displays with our gratis customizable Corporate Training Program Employee Productivity And Efficiency Graph For Last 5 Years Elements PDF. These are great for business strategies, office conferences, capital raising or task suggestions. If you desire to acquire more customers for your tech business and ensure they stay satisfied, create your own sales presentation with these plain slides.
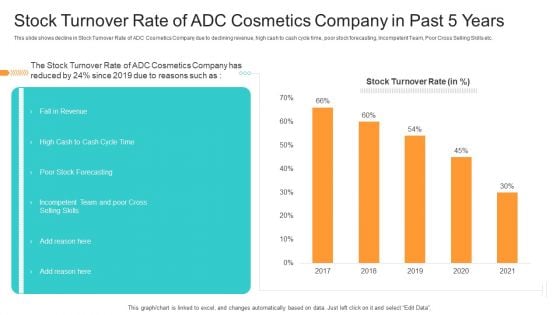
Competition Stock Turnover Rate Of ADC Cosmetics Company In Past 5 Years Stock Rules PDF
This slide shows decline in Stock Turnover Rate of ADC Cosmetics Company due to declining revenue, high cash to cash cycle time, poor stock forecasting, Incompetent Team, Poor Cross Selling Skills etc. Deliver and pitch your topic in the best possible manner with this competition stock turnover rate of adc cosmetics company in past 5 years stock rules pdf. Use them to share invaluable insights on high cash to cash cycle time, poor stock forecasting, incompetent team and poor cross selling skills and impress your audience. This template can be altered and modified as per your expectations. So, grab it now.
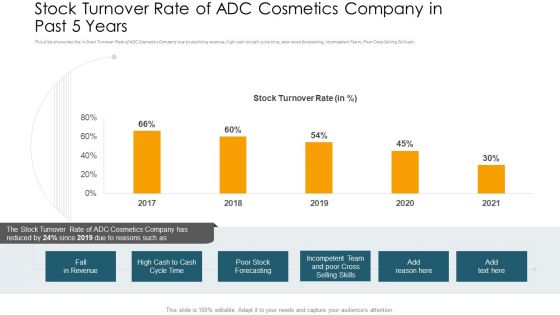
Stock Turnover Rate Of ADC Cosmetics Company In Past 5 Years Infographics PDF
This slide shows decline in Stock Turnover Rate of ADC Cosmetics Company due to declining revenue, high cash to cash cycle time, poor stock forecasting, Incompetent Team, Poor Cross Selling Skills etc. Deliver and pitch your topic in the best possible manner with this stock turnover rate of adc cosmetics company in past 5 years infographics pdf. Use them to share invaluable insights on stock turnover rate, 2017 to 2021 and impress your audience. This template can be altered and modified as per your expectations. So, grab it now.
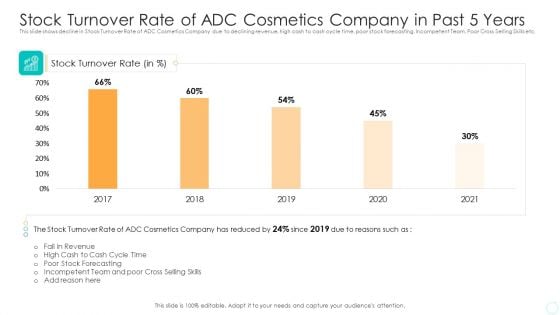
Stock Turnover Rate Of ADC Cosmetics Company In Past 5 Years Rules PDF
This slide shows decline in Stock Turnover Rate of ADC Cosmetics Company due to declining revenue, high cash to cash cycle time, poor stock forecasting, Incompetent Team, Poor Cross Selling Skills etc. Deliver an awe-inspiring pitch with this creative stock turnover rate of adc cosmetics company in past 5 years rules pdf bundle. Topics like stock turnover, revenue, stock forecasting, incompetent team, cross selling skills can be discussed with this completely editable template. It is available for immediate download depending on the needs and requirements of the user.
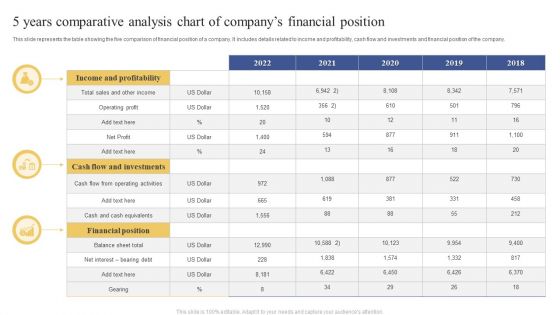
5 Years Comparative Analysis Chart Of Companys Financial Position Ppt Layouts Structure PDF
This slide represents the table showing the five comparison of financial position of a company. It includes details related to income and profitability, cash flow and investments and financial position of the company. Showcasing this set of slides titled 5 Years Comparative Analysis Chart Of Companys Financial Position Ppt Layouts Structure PDF. The topics addressed in these templates are Income And Profitability, Financial Position, Balance Sheet Total. All the content presented in this PPT design is completely editable. Download it and make adjustments in color, background, font etc. as per your unique business setting.
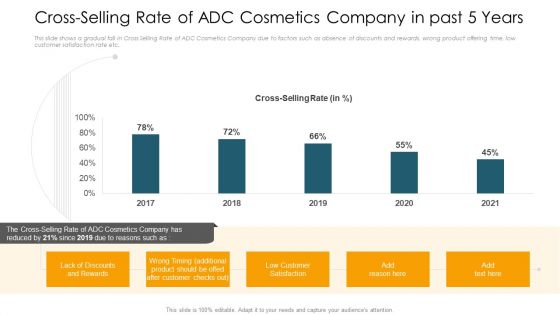
Cross Selling Rate Of ADC Cosmetics Company In Past 5 Years Background PDF
This slide shows a gradual fall in Cross Selling Rate of ADC Cosmetics Company due to factors such as absence of discounts and rewards, wrong product offering time, low customer satisfaction rate etc. Deliver an awe-inspiring pitch with this creative cross selling rate of adc cosmetics company in past 5 years background pdf. bundle. Topics like cross selling rate, 2017 to 2020 can be discussed with this completely editable template. It is available for immediate download depending on the needs and requirements of the user.
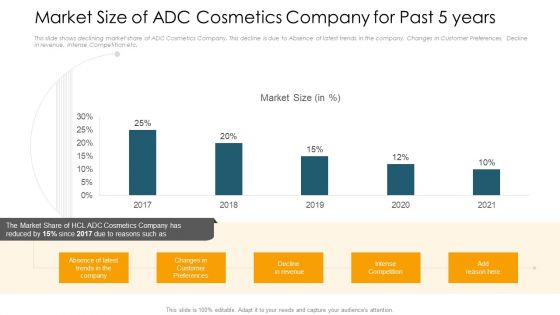
Market Size Of ADC Cosmetics Company For Past 5 Years Brochure PDF
This slide shows declining market share of ADC Cosmetics Company. This decline is due to Absence of latest trends in the company, Changes in Customer Preferences, Decline in revenue, Intense Competition etc. Deliver an awe-inspiring pitch with this creative market size of adc cosmetics company for past 5 years brochure pdf. bundle. Topics like decline in revenue, intense competition, 2017 to 2021 can be discussed with this completely editable template. It is available for immediate download depending on the needs and requirements of the user.
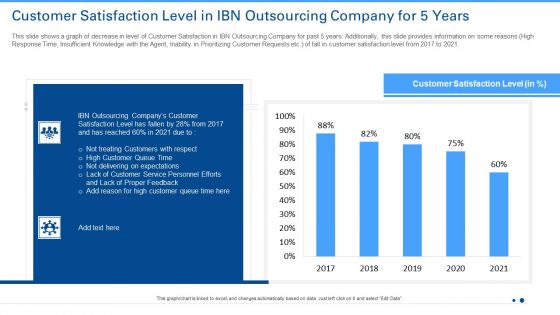
Customer Satisfaction Level In IBN Outsourcing Company For 5 Years Ppt Show Ideas PDF
This slide shows a Customer Attrition Rate Dashboard with KPIs such as Company Revenue , Customer Attrition Rate in 2021 , Annual Growth Rate , Average Customer Queue Time , Onboarding Process Effectiveness etc.Deliver and pitch your topic in the best possible manner with this customer satisfaction level in ibn outsourcing company for 5 years ppt show ideas pdf. Use them to share invaluable insights on customer satisfaction level, 2017 to 2021 and impress your audience. This template can be altered and modified as per your expectations. So, grab it now.
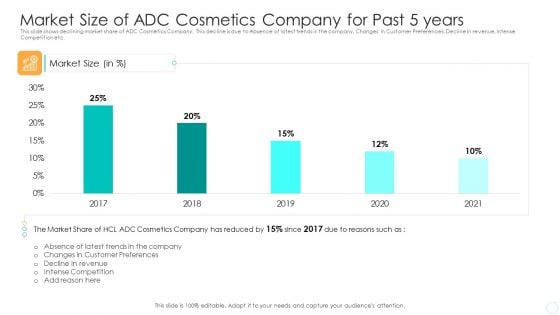
Market Size Of ADC Cosmetics Company For Past 5 Years Designs PDF
This slide shows declining market share of ADC Cosmetics Company. This decline is due to Absence of latest trends in the company, Changes in Customer Preferences, Decline in revenue, Intense Competition etc. Deliver an awe-inspiring pitch with this creative market size of adc cosmetics company for past 5 years designs pdf bundle. Topics like market share, customer preferences, decline, revenue, intense competition can be discussed with this completely editable template. It is available for immediate download depending on the needs and requirements of the user.
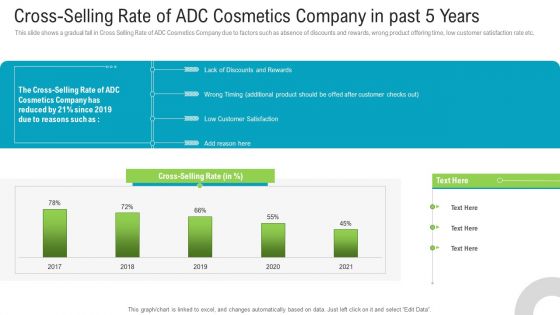
Cross-Selling Rate Of ADC Cosmetics Company In Past 5 Years Guidelines PDF
This slide shows a gradual fall in Cross Selling Rate of ADC Cosmetics Company due to factors such as absence of discounts and rewards, wrong product offering time, low customer satisfaction rate etc. Deliver an awe inspiring pitch with this creative cross selling rate of adc cosmetics company in past 5 years guidelines pdf bundle. Topics like cross selling rate, discounts and rewards, low customer satisfaction can be discussed with this completely editable template. It is available for immediate download depending on the needs and requirements of the user.
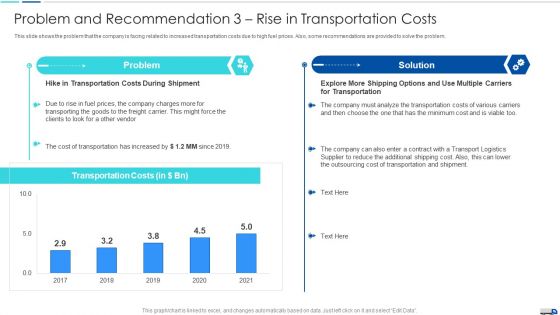
Revenue Trends Of HCL Plus Logistics Company For Past 5 Years Slides PDF
This slide shows the past trends in revenue of HCL Plus Logistics Company worldwide. The companys revenue is constantly declining due to reasons such as High Procurement Costs, Inadequate Inventory Management, High Storage Costs, Use of Outdated Logistic Technologies etc. Deliver and pitch your topic in the best possible manner with this revenue trends of hcl plus logistics company for past 5 years slides pdf. Use them to share invaluable insights on management, inadequate inventory and impress your audience. This template can be altered and modified as per your expectations. So, grab it now.
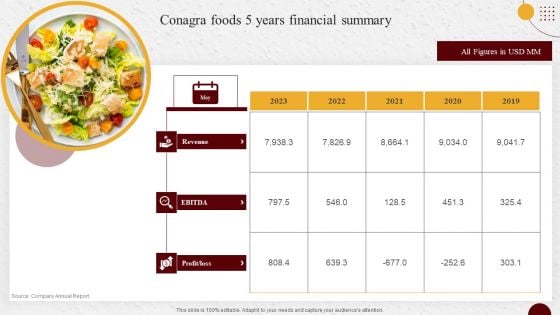
Industry Report Of Packaged Food Products Part 1 Conagra Foods 5 Years Financial Summary Topics PDF
Slidegeeks is one of the best resources for PowerPoint templates. You can download easily and regulate Industry Report Of Packaged Food Products Part 1 Conagra Foods 5 Years Financial Summary Topics PDF for your personal presentations from our wonderful collection. A few clicks is all it takes to discover and get the most relevant and appropriate templates. Use our Templates to add a unique zing and appeal to your presentation and meetings. All the slides are easy to edit and you can use them even for advertisement purposes.
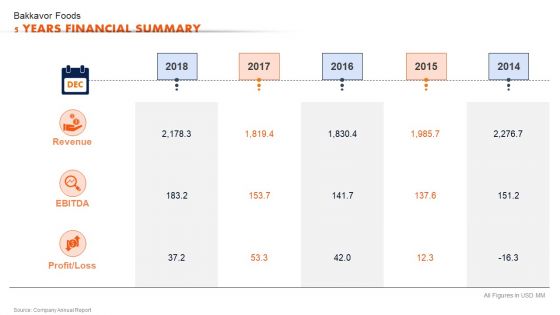
Ready To Eat Food Market Analysis Bakkavor Foods 5 Years Financial Summary Inspiration PDF
Slidegeeks is one of the best resources for PowerPoint templates. You can download easily and regulate Ready To Eat Food Market Analysis Bakkavor Foods 5 Years Financial Summary Inspiration PDF for your personal presentations from our wonderful collection. A few clicks is all it takes to discover and get the most relevant and appropriate templates. Use our Templates to add a unique zing and appeal to your presentation and meetings. All the slides are easy to edit and you can use them even for advertisement purposes.
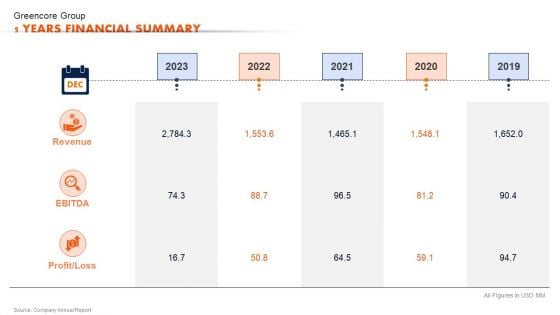
Ready To Eat Food Market Analysis Greencore Group 5 Years Financial Summary Topics PDF
Are you in need of a template that can accommodate all of your creative concepts This one is crafted professionally and can be altered to fit any style. Use it with Google Slides or PowerPoint. Include striking photographs, symbols, depictions, and other visuals. Fill, move around, or remove text boxes as desired. Test out color palettes and font mixtures. Edit and save your work, or work with colleagues. Download Ready To Eat Food Market Analysis Greencore Group 5 Years Financial Summary Topics PDF and observe how to make your presentation outstanding. Give an impeccable presentation to your group and make your presentation unforgettable.
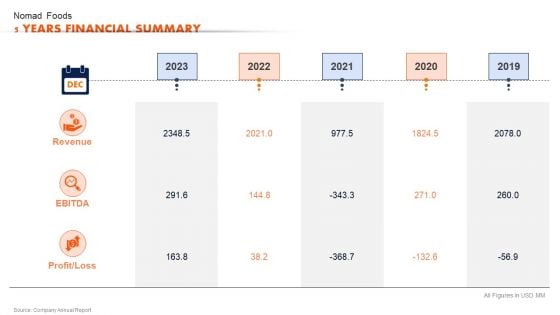
Ready To Eat Food Market Analysis Nomad Foods 5 Years Financial Summary Diagrams PDF
Welcome to our selection of the Ready To Eat Food Market Analysis Nomad Foods 5 Years Financial Summary Diagrams PDF. These are designed to help you showcase your creativity and bring your sphere to life. Planning and Innovation are essential for any business that is just starting out. This collection contains the designs that you need for your everyday presentations. All of our PowerPoints are 100 percent editable, so you can customize them to suit your needs. This multi purpose template can be used in various situations. Grab these presentation templates today.
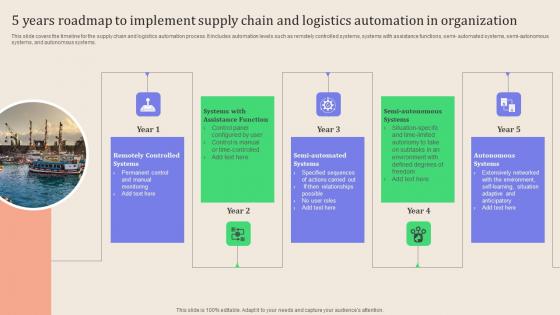
Leveraging Logistics Automation 5 Years Roadmap To Implement Supply Chain Introduction Pdf
This slide covers the timeline for the supply chain and logistics automation process. It includes automation levels such as remotely controlled systems, systems with assistance functions, semi automated systems, semi autonomous systems, and autonomous systems.Slidegeeks is one of the best resources for PowerPoint templates. You can download easily and regulate Leveraging Logistics Automation 5 Years Roadmap To Implement Supply Chain Introduction Pdf for your personal presentations from our wonderful collection. A few clicks is all it takes to discover and get the most relevant and appropriate templates. Use our Templates to add a unique zing and appeal to your presentation and meetings. All the slides are easy to edit and you can use them even for advertisement purposes. This slide covers the timeline for the supply chain and logistics automation process. It includes automation levels such as remotely controlled systems, systems with assistance functions, semi automated systems, semi autonomous systems, and autonomous systems.
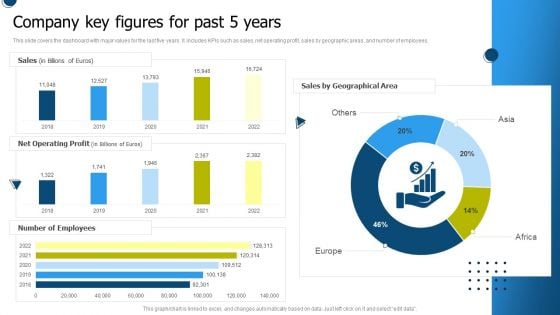
International Market Entry Strategies Company Key Figures For Past 5 Years Designs PDF
This slide covers the dashboard with major values for the last five years. It includes KPIs such as sales, net operating profit, sales by geographic areas, and number of employees. Retrieve professionally designed International Market Entry Strategies Company Key Figures For Past 5 Years Designs PDF to effectively convey your message and captivate your listeners. Save time by selecting pre-made slideshows that are appropriate for various topics, from business to educational purposes. These themes come in many different styles, from creative to corporate, and all of them are easily adjustable and can be edited quickly. Access them as PowerPoint templates or as Google Slides themes. You dont have to go on a hunt for the perfect presentation because Slidegeeks got you covered from everywhere.
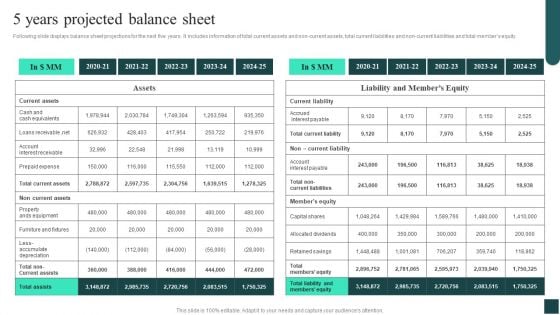
Credibility Assessment Summary For Construction Project 5 Years Projected Balance Sheet Clipart PDF
Following slide displays balance sheet projections for the next five years. It includes information of total current assets and non current assets, total current liabilities and non current liabilities and total members equity. Boost your pitch with our creative Credibility Assessment Summary For Construction Project 5 Years Projected Balance Sheet Clipart PDF. Deliver an awe inspiring pitch that will mesmerize everyone. Using these presentation templates you will surely catch everyones attention. You can browse the ppts collection on our website. We have researchers who are experts at creating the right content for the templates. So you don not have to invest time in any additional work. Just grab the template now and use them.
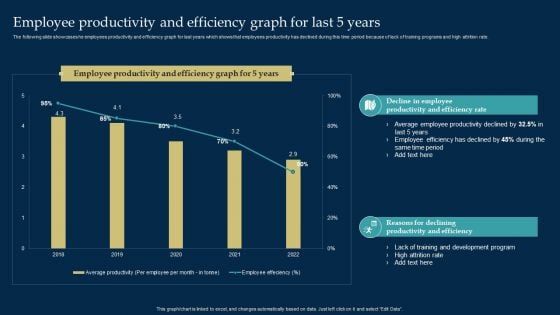
Employee Training And Development Strategy Employee Productivity And Efficiency Graph For Last 5 Years Graphics PDF
The following slide showcases he employees productivity and efficiency graph for last years which shows that employees productivity has declined during this time period because of lack of training programs and high attrition rate. Do you know about Slidesgeeks Employee Training And Development Strategy Employee Productivity And Efficiency Graph For Last 5 Years Graphics PDF These are perfect for delivering any kind od presentation. Using it, create PowerPoint presentations that communicate your ideas and engage audiences. Save time and effort by using our pre designed presentation templates that are perfect for a wide range of topic. Our vast selection of designs covers a range of styles, from creative to business, and are all highly customizable and easy to edit. Download as a PowerPoint template or use them as Google Slides themes.
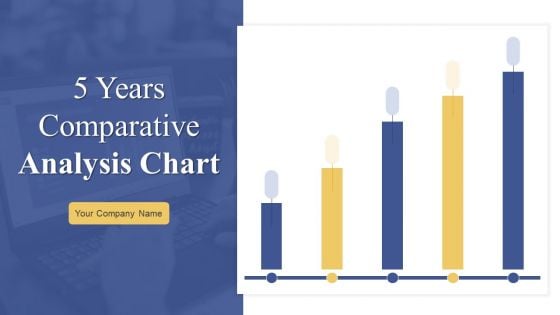
5 Years Comparative Analysis Chart Ppt PowerPoint Presentation Complete Deck With Slides
Improve your presentation delivery using this 5 Years Comparative Analysis Chart Ppt PowerPoint Presentation Complete Deck With Slides. Support your business vision and objectives using this well-structured PPT deck. This template offers a great starting point for delivering beautifully designed presentations on the topic of your choice. Comprising twenty slides this professionally designed template is all you need to host discussion and meetings with collaborators. Each slide is self-explanatory and equipped with high-quality graphics that can be adjusted to your needs. Therefore, you will face no difficulty in portraying your desired content using this PPT slideshow. This PowerPoint slideshow contains every important element that you need for a great pitch. It is not only editable but also available for immediate download and utilization. The color, font size, background, shapes everything can be modified to create your unique presentation layout. Therefore, download it now.
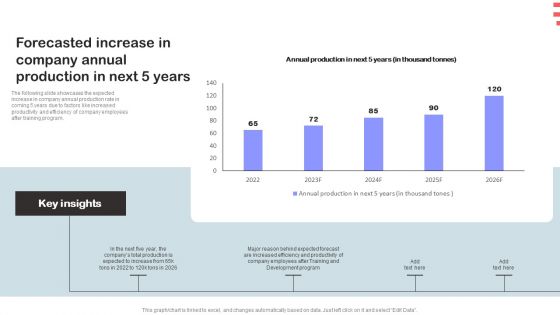
Corporate Training Program Forecasted Increase In Company Annual Production In Next 5 Years Themes PDF
The following slide showcases the expected increase in company annual production rate in coming 5 years due to factors like increased productivity and efficiency of company employees after training program. Coming up with a presentation necessitates that the majority of the effort goes into the content and the message you intend to convey. The visuals of a PowerPoint presentation can only be effective if it supplements and supports the story that is being told. Keeping this in mind our experts created Corporate Training Program Employee Satisfaction Level After Training Program Slides PDF to reduce the time that goes into designing the presentation. This way, you can concentrate on the message while our designers take care of providing you with the right template for the situation.
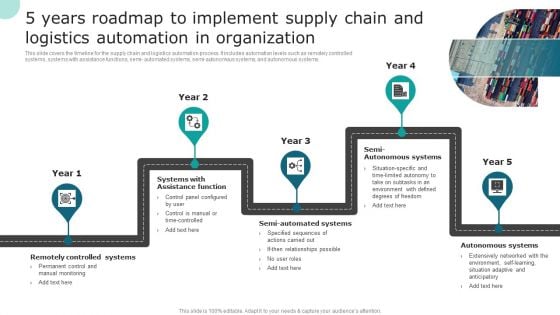
5 Years Roadmap To Implement Supply Chain And Logistics Automation In Organization Structure PDF
This slide covers the timeline for the supply chain and logistics automation process. It includes automation levels such as remotely controlled systems, systems with assistance functions, semi- automated systems, semi-autonomous systems, and autonomous systems. Find a pre designed and impeccable ars Roadmap To Implement Supply Chain And Logistics Automation In Organization Structure PDF. The templates can ace your presentation without additional effort. You can download these easy to edit presentation templates to make your presentation stand out from others. So, what are you waiting for Download the template from Slidegeeks today and give a unique touch to your presentation.
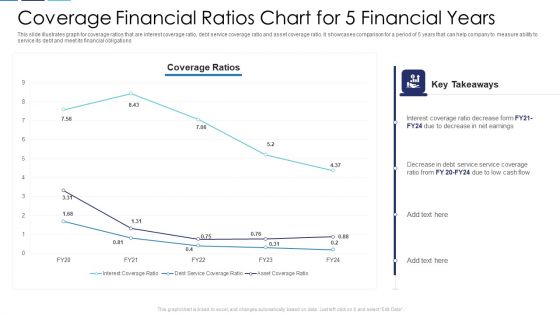
Coverage Financial Ratios Chart For 5 Financial Years Themes PDF
This slide illustrates graph for coverage ratios that are interest coverage ratio, debt service coverage ratio and asset coverage ratio. It showcases comparison for a period of 5 years that can help company to measure ability to service its debt and meet its financial obligations Showcasing this set of slides titled coverage financial ratios chart for 5 financial years themes pdf. The topics addressed in these templates are coverage financial ratios chart for 5 financial years. All the content presented in this PPT design is completely editable. Download it and make adjustments in color, background, font etc. as per your unique business setting.
Skill Shortage In A Production Firm Case Study Solution NSS Electronic Company Productivity In Last 5 Years Icons PDF
This slide shows a graph of declining Productivity of NSS Electronic Manufacturing Company for past 5 years 2017-2021. Additionally, this slide provides key reasons for the fall in the productivity Shortage of Labor, High Labor Turnover, Decline on Production Volumes etc. Deliver an awe inspiring pitch with this creative skill shortage in a production firm case study solution NSS electronic company productivity in last 5 years icons pdf bundle. Topics like NSS electronic company productivity in last 5 years can be discussed with this completely editable template. It is available for immediate download depending on the needs and requirements of the user.
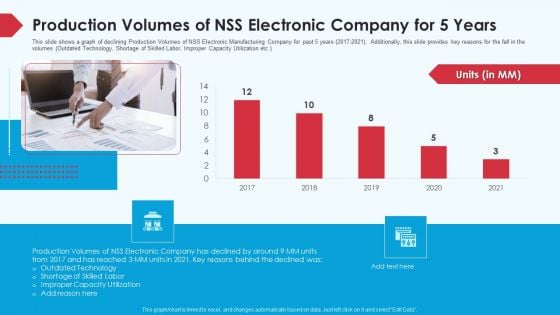
Skill Shortage In A Production Firm Case Study Solution Production Volumes Of NSS Electronic Company For 5 Years Infographics PDF
This slide shows a graph of declining Production Volumes of NSS Electronic Manufacturing Company for past 5 years 2017-2021. Additionally, this slide provides key reasons for the fall in the volumes Outdated Technology, Shortage of Skilled Labor, Improper Capacity Utilization etc. Deliver an awe inspiring pitch with this creative skill shortage in a production firm case study solution production volumes of NSS electronic company for 5 years infographics pdf bundle. Topics like production volumes of NSS electronic company for 5 years can be discussed with this completely editable template. It is available for immediate download depending on the needs and requirements of the user.
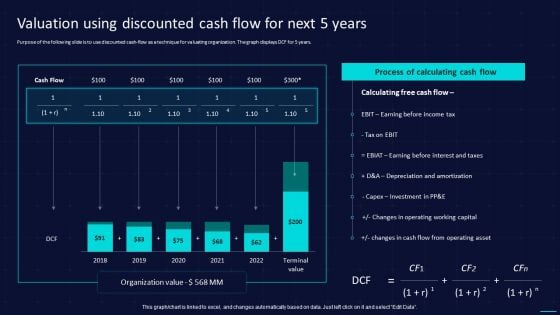
Action Plan To Implement Exit Strategy For Investors Valuation Using Discounted Cash Flow For Next 5 Years Sample PDF
Purpose of the following slide is to use discounted cash flow as a technique for valuating organization. The graph displays DCF for 5 years. Deliver an awe inspiring pitch with this creative Action Plan To Implement Exit Strategy For Investors Valuation Using Discounted Cash Flow For Next 5 Years Sample PDF bundle. Topics like Income Tax, Operating Working Capital, Investment can be discussed with this completely editable template. It is available for immediate download depending on the needs and requirements of the user.
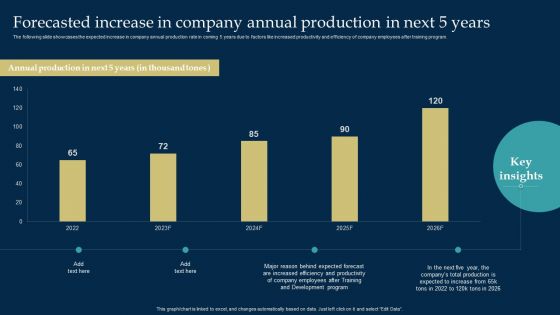
Employee Training And Development Strategy Forecasted Increase In Company Annual Production In Next 5 Years Download PDF
The following slide showcases the expected increase in company annual production rate in coming 5 years due to factors like increased productivity and efficiency of company employees after training program. Do you have to make sure that everyone on your team knows about any specific topic I yes, then you should give Employee Training And Development Strategy Forecasted Increase In Company Annual Production In Next 5 Years Download PDF a try. Our experts have put a lot of knowledge and effort into creating this impeccable Employee Training And Development Strategy Forecasted Increase In Company Annual Production In Next 5 Years Download PDF. You can use this template for your upcoming presentations, as the slides are perfect to represent even the tiniest detail. You can download these templates from the Slidegeeks website and these are easy to edit. So grab these today.
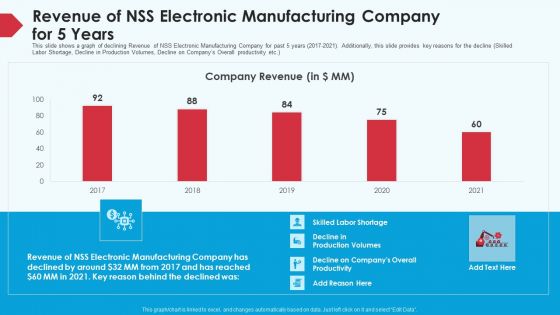
Skill Shortage In A Production Firm Case Study Solution Revenue Of NSS Electronic Manufacturing Company For 5 Years Diagrams PDF
This slide shows a graph of declining Revenue of NSS Electronic Manufacturing Company for past 5 years 2017-2021. Additionally, this slide provides key reasons for the decline Skilled Labor Shortage, Decline in Production Volumes, Decline on Companys Overall productivity etc. Deliver an awe inspiring pitch with this creative skill shortage in a production firm case study solution revenue of NSS electronic manufacturing company for 5 years diagrams pdf bundle. Topics like revenue, manufacturing, companys overall productivity, 2017 to 2021 can be discussed with this completely editable template. It is available for immediate download depending on the needs and requirements of the user.
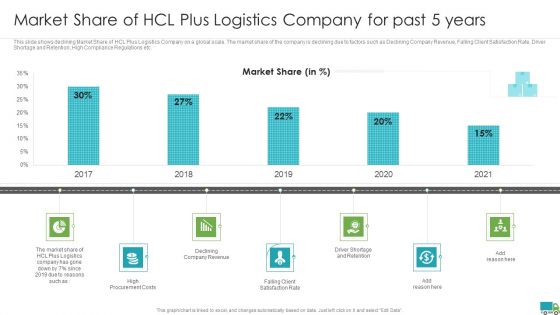
Generating Logistics Value Business Market Share Of Hcl Plus Logistics Company For Past 5 Years Template PDF
This slide shows declining Market Share of HCL Plus Logistics Company on a global scale. The market share of the company is declining due to factors such as Declining Company Revenue, Falling Client Satisfaction Rate, Driver Shortage and Retention, High Compliance Regulations etc. Deliver an awe inspiring pitch with this creative generating logistics value business market share of hcl plus logistics company for past 5 years template pdf bundle. Topics like market share of hcl plus logistics company for past 5 years can be discussed with this completely editable template. It is available for immediate download depending on the needs and requirements of the user.
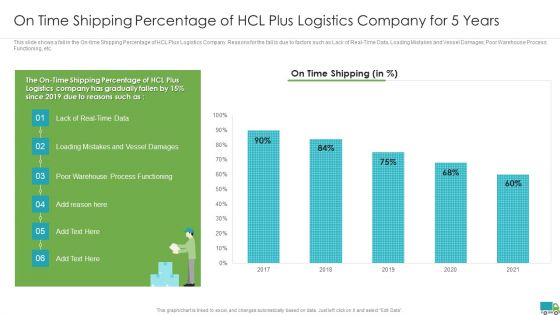
Generating Logistics Value Business On Time Shipping Percentage Of Hcl Plus Logistics Company For 5 Years Rules PDF
This slide shows a fall in the On-time Shipping Percentage of HCL Plus Logistics Company. Reasons for the fall is due to factors such as Lack of Real-Time Data, Loading Mistakes and Vessel Damages, Poor Warehouse Process Functioning, etc. Deliver and pitch your topic in the best possible manner with this generating logistics value business on time shipping percentage of hcl plus logistics company for 5 years rules pdf. Use them to share invaluable insights on on time shipping percentage of hcl plus logistics company for 5 years and impress your audience. This template can be altered and modified as per your expectations. So, grab it now.
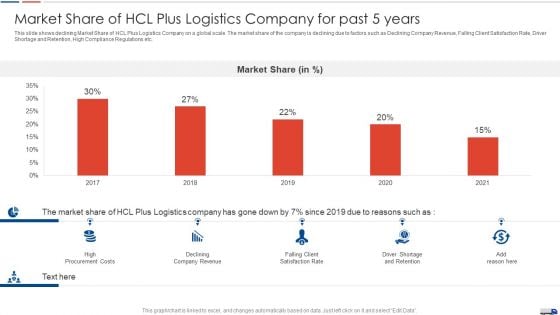
Strategies Create Good Proposition Market Share Of Hcl Plus Logistics Company For Past 5 Years Brochure PDF
This slide shows declining Market Share of HCL Plus Logistics Company on a global scale. The market share of the company is declining due to factors such as Declining Company Revenue, Falling Client Satisfaction Rate, Driver Shortage and Retention, High Compliance Regulations etc. Deliver and pitch your topic in the best possible manner with this strategies create good proposition market share of hcl plus logistics company for past 5 years brochure pdf. Use them to share invaluable insights on market share of hcl plus logistics company for past 5 years and impress your audience. This template can be altered and modified as per your expectations. So, grab it now.
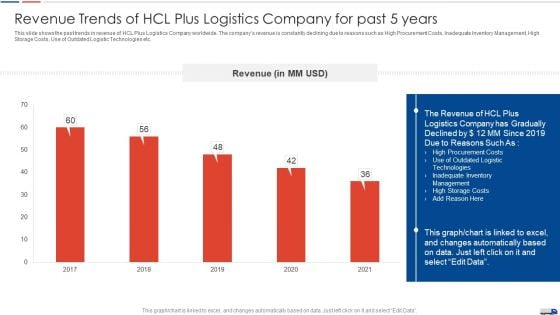
Strategies Create Good Proposition Revenue Trends Of Hcl Plus Logistics Company For Past 5 Years Topics PDF
This slide shows the past trends in revenue of HCL Plus Logistics Company worldwide. The companys revenue is constantly declining due to reasons such as High Procurement Costs, Inadequate Inventory Management, High Storage Costs, Use of Outdated Logistic Technologies etc. Deliver an awe inspiring pitch with this creative strategies create good proposition revenue trends of hcl plus logistics company for past 5 years topics pdf bundle. Topics like revenue trends of hcl plus logistics company for past 5 years can be discussed with this completely editable template. It is available for immediate download depending on the needs and requirements of the user.
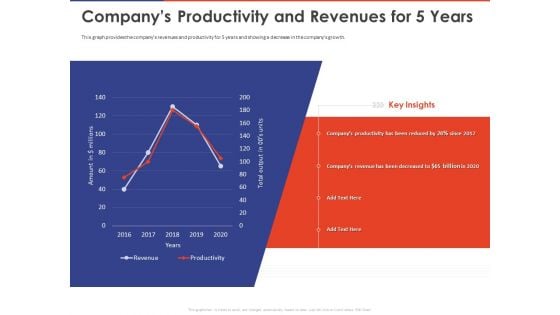
Key Prioritization Techniques For Project Team Management Companys Productivity And Revenues For 5 Years Ppt Outline PDF
Presenting this set of slides with name key prioritization techniques for project team management companys productivity and revenues for 5 years ppt outline pdf. The topics discussed in these slide is companys productivity. This is a completely editable PowerPoint presentation and is available for immediate download. Download now and impress your audience.
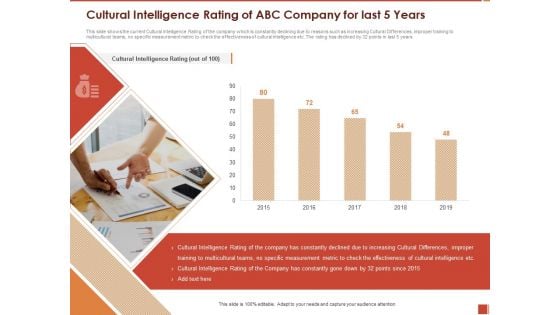
Cultural Intelligence Importance Workplace Productivity Cultural Intelligence Rating Of Abc Company For Last 5 Years Mockup PDF
Presenting this set of slides with name cultural intelligence importance workplace productivity cultural intelligence rating of abc company for last 5 years mockup pdf. The topics discussed in these slides are cultural intelligence rating of the company has constantly gone down by 32 points since 2015. This is a completely editable PowerPoint presentation and is available for immediate download. Download now and impress your audience.
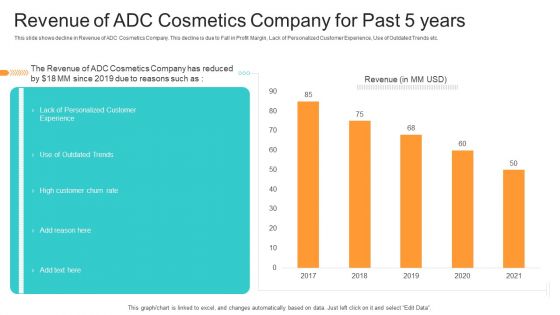
Utilization Of Current Techniques To Improve Efficiency Case Competition Revenue Of ADC Cosmetics Company For Past 5 Years Brochure PDF
This slide shows decline in Revenue of ADC Cosmetics Company. This decline is due to Fall in Profit Margin, Lack of Personalized Customer Experience, Use of Outdated Trends etc. Deliver an awe-inspiring pitch with this creative utilization of current techniques to improve efficiency case competition revenue of adc cosmetics company for past 5 years brochure pdf bundle. Topics like lack of personalized customer experience, high customer churn rate, use of outdated trends can be discussed with this completely editable template. It is available for immediate download depending on the needs and requirements of the user.
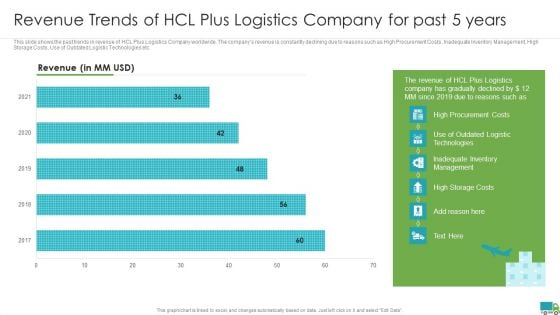
Generating Logistics Value Business Revenue Trends Of Hcl Plus Logistics Company For Past 5 Years Professional PDF
This slide shows the past trends in revenue of HCL Plus Logistics Company worldwide. The companys revenue is constantly declining due to reasons such as High Procurement Costs, Inadequate Inventory Management, High Storage Costs, Use of Outdated Logistic Technologies etc. Deliver an awe inspiring pitch with this creative generating logistics value business real time supply chain visibility scv and shipment tracking systems professional pdf bundle. Topics like revenue trends of hcl plus logistics company for past 5 years can be discussed with this completely editable template. It is available for immediate download depending on the needs and requirements of the user.
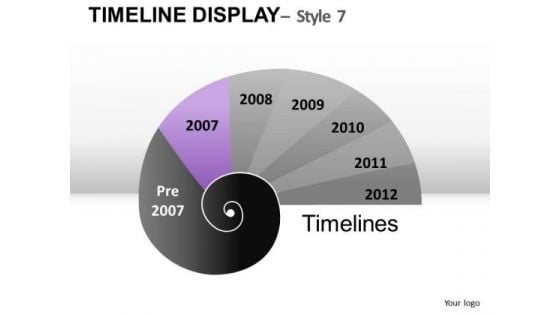
5 10 Year Forecast Planning PowerPoint Slides And Ppt Diagram Templates
5 10 Year Forecast Planning PowerPoint Slides And PPT Diagram Templates-These high quality, editable pre-designed powerpoint slides have been carefully created by our professional team to help you impress your audience. Each graphic in every slide is vector based and is 100% editable in powerpoint. Each and every property of any slide - color, size, shading etc can be modified to build an effective powerpoint presentation. Use these slides to convey complex business concepts in a simplified manner. Any text can be entered at any point in the powerpoint slide. Simply DOWNLOAD, TYPE and PRESENT! Locate problems with our 5 10 Year Forecast Planning PowerPoint Slides And Ppt Diagram Templates. Download without worries with our money back guaranteee.
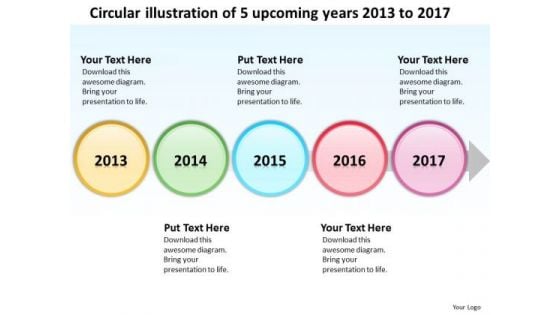
Circular Illustration Of 5 Upcoming Years 2013 To 2017 PowerPoint Templates Ppt Slides Graphics
We present our Circular illustration of 5 upcoming years 2013 to 2017 PowerPoint Templates PPT Slides Graphics.Download and present our Marketing PowerPoint Templates because generation of sales is the core of any business. Present our Timelines PowerPoint Templates because they are the indicators of the path you have in mind. Download our Business PowerPoint Templates because the fruits of your labour are beginning to show.Enlighten them on the great plans you have for their enjoyment. Present our Arrows PowerPoint Templates because this diagram helps you to show goal also clearly etched in your mind. Download and present our Time planning PowerPoint Templates because this diagram helps you to discuss each step slowly but surely move up the pyramid narrowing down to the best and most success oriented project.Use these PowerPoint slides for presentations relating to Art, Background, Button, Call, City, Colorful, Concept, Country, Destination, Editable, Flag, Fuel, Geography, Graphic, Home, Icon, Illustration, Journey, Land, Locate, Location, Macro, Map, Mapping, Mark, Navigate, Needle, Petrol, Pin, Pinpoint, Place, Pointing, Pump, Push, Pushpin, Restaurant, Road, Roadmap, Service, Set, Shiny, Space, Symbol, Town, Travel, Trip. The prominent colors used in the PowerPoint template are Red, Green, Blue. PowerPoint presentation experts tell us our Circular illustration of 5 upcoming years 2013 to 2017 PowerPoint Templates PPT Slides Graphics are designed to make your presentations professional. Customers tell us our Call PowerPoint templates and PPT Slides are Charming. Customers tell us our Circular illustration of 5 upcoming years 2013 to 2017 PowerPoint Templates PPT Slides Graphics are Fashionable. Customers tell us our Concept PowerPoint templates and PPT Slides are designed to make your presentations professional. PowerPoint presentation experts tell us our Circular illustration of 5 upcoming years 2013 to 2017 PowerPoint Templates PPT Slides Graphics are Great. People tell us our Colorful PowerPoint templates and PPT Slides are aesthetically designed to attract attention. We guarantee that they will grab all the eyeballs you need. It is time to say farewell to failure. Our Circular Illustration Of 5 Upcoming Years 2013 To 2017 PowerPoint Templates Ppt Slides Graphics assure achievement.
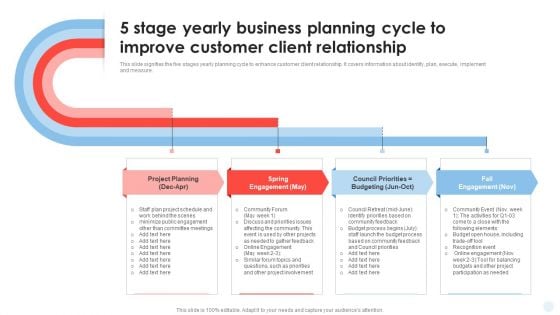
5 Stage Yearly Business Planning Cycle To Improve Customer Client Relationship Background PDF
This slide signifies the five stages yearly planning cycle to enhance customer client relationship. It covers information about identify, plan, execute, implement and measure.Presenting 5 Stage Yearly Business Planning Cycle To Improve Customer Client Relationship Background PDF to dispense important information. This template comprises four stages. It also presents valuable insights into the topics including Committee Meetings, Minimize Public Engagement, Affecting Community. This is a completely customizable PowerPoint theme that can be put to use immediately. So, download it and address the topic impactfully.
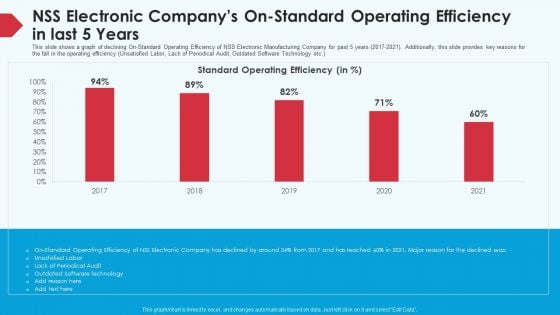
Skill Shortage In A Production Firm Case Study Solution NSS Electronic Companys On Standard Operating Efficiency In Last 5 Years Background PDF
This slide shows a graph of declining On-Standard Operating Efficiency of NSS Electronic Manufacturing Company for past 5 years 2017-2021. Additionally, this slide provides key reasons for the fall in the operating efficiency Unsatisfied Labor, Lack of Periodical Audit, Outdated Software Technology etc. Deliver an awe inspiring pitch with this creative skill shortage in a production firm case study solution NSS electronic companys on standard operating efficiency in last 5 years background pdf bundle. Topics like NSS electronic companys on standard operating efficiency in last 5 years can be discussed with this completely editable template. It is available for immediate download depending on the needs and requirements of the user.
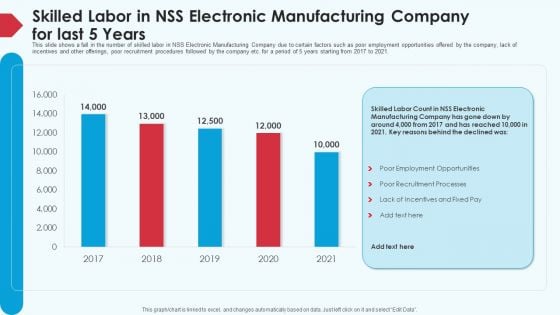
Skill Shortage In A Production Firm Case Study Solution Skilled Labor In NSS Electronic Manufacturing Company For Last 5 Years Graphics PDF
This slide shows a fall in the number of skilled labor in NSS Electronic Manufacturing Company due to certain factors such as poor employment opportunities offered by the company, lack of incentives and other offerings, poor recruitment procedures followed by the company etc. for a period of 5 years starting from 2017 to 2021. Deliver an awe inspiring pitch with this creative skill shortage in a production firm case study solution skilled labor in NSS electronic manufacturing company for last 5 years graphics pdf bundle. Topics like skilled labor in NSS electronic manufacturing company for last 5 years, 2017 to 2021 can be discussed with this completely editable template. It is available for immediate download depending on the needs and requirements of the user.
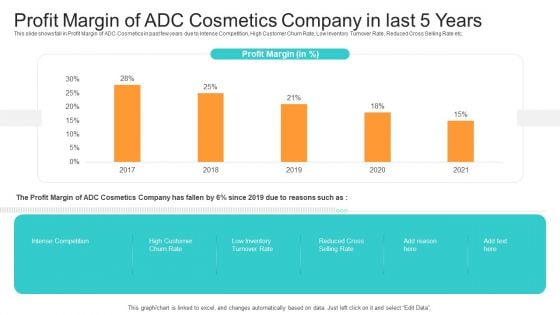
Utilization Of Current Techniques To Improve Efficiency Case Competition Profit Margin Of ADC Cosmetics Company In Last 5 Years Brochure PDF
This slide shows fall in Profit Margin of ADC Cosmetics in past few years due to Intense Competition, High Customer Churn Rate, Low Inventory Turnover Rate, Reduced Cross Selling Rate etc. Deliver and pitch your topic in the best possible manner with this utilization of current techniques to improve efficiency case competition profit margin of adc cosmetics company in last 5 years brochure pdf. Use them to share invaluable insights on intense competition, reduced cross selling rate, low inventory turnover rate and impress your audience. This template can be altered and modified as per your expectations. So, grab it now.
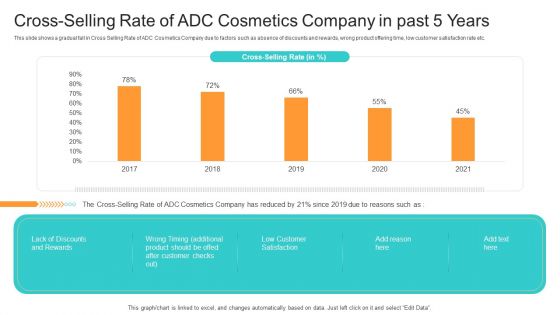
Utilization Of Current Techniques To Improve Efficiency Case Competition Cross Selling Rate Of ADC Cosmetics Company In Past 5 Years Information PDF
This slide shows a gradual fall in Cross Selling Rate of ADC Cosmetics Company due to factors such as absence of discounts and rewards, wrong product offering time, low customer satisfaction rate etc. Deliver and pitch your topic in the best possible manner with this utilization of current techniques to improve efficiency case competition cross selling rate of adc cosmetics company in past 5 years information pdf. Use them to share invaluable insights on lack of discounts and rewards, low customer satisfaction, wrong timing additional product should be offed after customer checks out and impress your audience. This template can be altered and modified as per your expectations. So, grab it now.
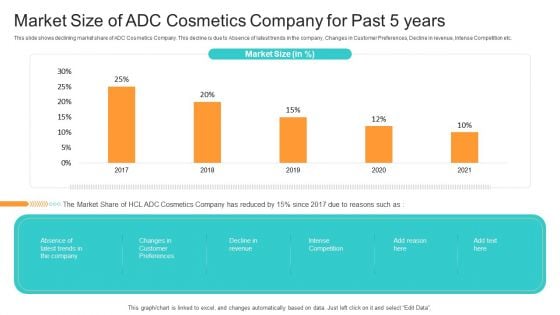
Utilization Of Current Techniques To Improve Efficiency Case Competition Market Size Of ADC Cosmetics Company For Past 5 Years Portrait PDF
This slide shows declining market share of ADC Cosmetics Company. This decline is due to Absence of latest trends in the company, Changes in Customer Preferences, Decline in revenue, Intense Competition etc. Deliver an awe inspiring pitch with this creative utilization of current techniques to improve efficiency case competition market size of adc cosmetics company for past 5 years portrait pdf bundle. Topics like absence of latest trends in the company, changes in customer preferences, decline in revenue can be discussed with this completely editable template. It is available for immediate download depending on the needs and requirements of the user.

 Home
Home