5 circle diagram
Flowchart To Implement Effective Customer Support Process Ppt Icon Slideshow PDF
This slide covers flowchart to implement effective customer service procedure. It involves five departments such as development, tester, technical support, sales and customer. Presenting Flowchart To Implement Effective Customer Support Process Ppt Icon Slideshow PDF to dispense important information. This template comprises one stages. It also presents valuable insights into the topics including Development, Tester, Technical support, Sales. This is a completely customizable PowerPoint theme that can be put to use immediately. So, download it and address the topic impactfully.
Post Employment Interview Panel Interview Icon Icons PDF
Persuade your audience using this Post Employment Interview Panel Interview Icon Icons PDF. This PPT design covers Five stages, thus making it a great tool to use. It also caters to a variety of topics including Post Employment, Interview Panel Interview. Download this PPT design now to present a convincing pitch that not only emphasizes the topic but also showcases your presentation skills.
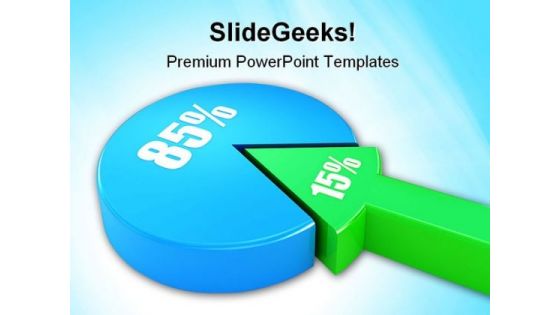
Pie With Financial Arrow Business PowerPoint Templates And PowerPoint Backgrounds 0411
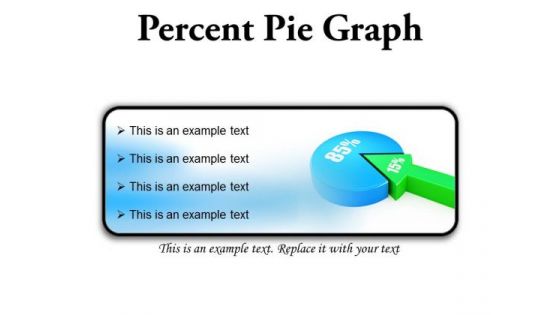
Microsoft PowerPoint Template and Background with fifteen and eighty five percent proportion pie chart Many a popular belief turn out fallacious. Establish the factual position with our Pie With Financial Arrow Business PowerPoint Templates And PowerPoint Backgrounds 0411.
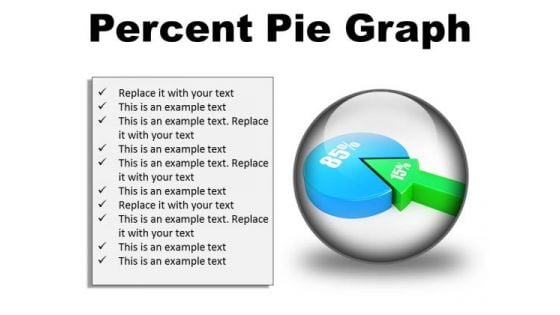
Percent Pie Graph Business PowerPoint Presentation Slides C
Microsoft PowerPoint Slides and Backgrounds with fifteen and eighty five percent proportion pie chart Figure out the finances with our Percent Pie Graph Business PowerPoint Presentation Slides C. They help you get the calculations correct.
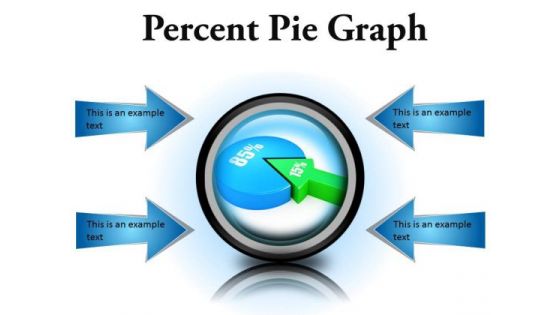
Percent Pie Graph Business PowerPoint Presentation Slides Cc
Microsoft PowerPoint Slides and Backgrounds with fifteen and eighty five percent proportion pie chart Record growth with our Percent Pie Graph Business PowerPoint Presentation Slides Cc. Download without worries with our money back guaranteee.
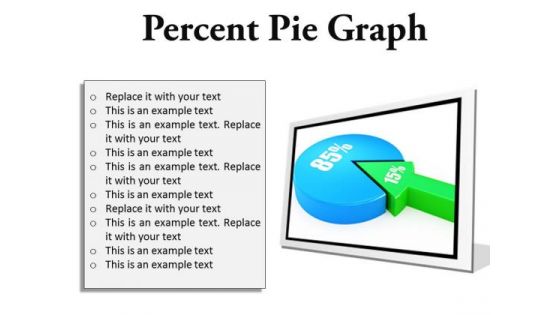
Percent Pie Graph Business PowerPoint Presentation Slides F
Microsoft PowerPoint Slides and Backgrounds with fifteen and eighty five percent proportion pie chart Prove your equity with our Percent Pie Graph Business PowerPoint Presentation Slides F. Display the sound judgement of your thoughts.
Percent Pie Graph Business PowerPoint Presentation Slides R
Microsoft PowerPoint Slides and Backgrounds with fifteen and eighty five percent proportion pie chart Our Percent Pie Graph Business PowerPoint Presentation Slides R are designed by an avant-garde team. They are always abreast of the state of the art.
Percent Pie Graph Business PowerPoint Presentation Slides S
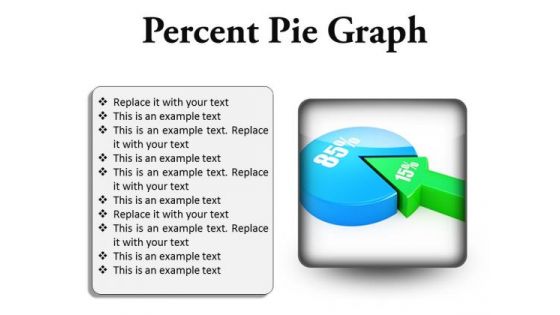
Microsoft PowerPoint Slides and Backgrounds with fifteen and eighty five percent proportion pie chart Put your ideas out to farm. Our Percent Pie Graph Business PowerPoint Presentation Slides S will get your plans to grow.
Crm Dashboard Opportunity By Rating Ppt PowerPoint Presentation Template
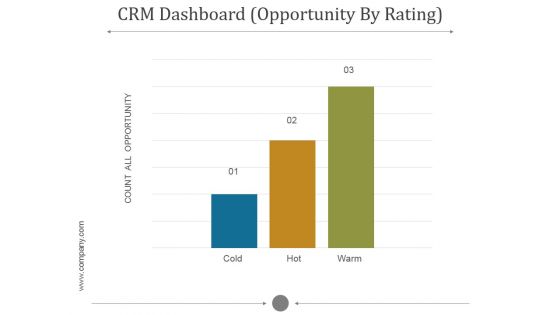
This is a crm dashboard opportunity by rating ppt powerpoint presentation template. This is a five stage process. The stages in this process are count all opportunity, cold, hot, warm.
Shape To Represent 16 Variable In It Business Continuity Plan Sample PowerPoint Templates
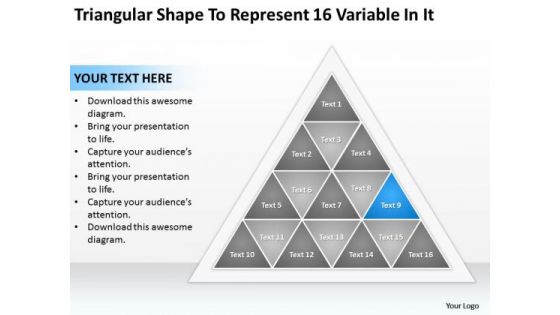
We present our shape to represent 16 variable in it business continuity plan sample PowerPoint templates.Download our Marketing PowerPoint Templates because Our PowerPoint Templates and Slides will let you Illuminate the road ahead to Pinpoint the important landmarks along the way. Download our Finance PowerPoint Templates because Our PowerPoint Templates and Slides will let you meet your Deadlines. Present our Layers PowerPoint Templates because Our PowerPoint Templates and Slides will let your team Walk through your plans. See their energy levels rise as you show them the way. Use our Triangles PowerPoint Templates because Our PowerPoint Templates and Slides help you meet the demand of the Market. Just browse and pick the slides that appeal to your intuitive senses. Download our Pyramids PowerPoint Templates because Our PowerPoint Templates and Slides are conceived by a dedicated team. Use them and give form to your wondrous ideas.Use these PowerPoint slides for presentations relating to Pyramid, chart, paper, origami, compare, advertisement, sequence, step, layout, triangle, tutorial, business, concept, sign, hierarchy, presentation, glossy, bright, gradation, template, cone, data, clean, process, element, workflow, shape, modern, creative, economic, rhythm, options, shiny, futuristic, web, design, trendy, blue, text, composition, choice, info, five, version, progress, menu, information, promotion, infographics. The prominent colors used in the PowerPoint template are Blue, Gray, Black. Any audience can be critical. Draw out their appreciation with our Shape To Represent 16 Variable In It Business Continuity Plan Sample PowerPoint Templates.
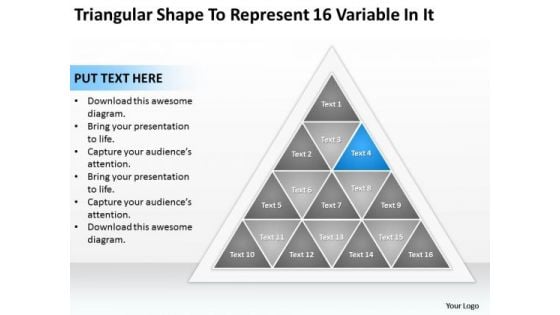
Shape To Represent 16 Variable In It Ppt Business Plan Downloads PowerPoint Slides
We present our shape to represent 16 variable in it ppt business plan downloads PowerPoint Slides.Download our Marketing PowerPoint Templates because Our PowerPoint Templates and Slides will weave a web of your great ideas. They are gauranteed to attract even the most critical of your colleagues. Download and present our Finance PowerPoint Templates because Your audience will believe you are the cats whiskers. Download our Layers PowerPoint Templates because You should Bet on your luck with our PowerPoint Templates and Slides. Be assured that you will hit the jackpot. Download our Triangles PowerPoint Templates because You should Kick up a storm with our PowerPoint Templates and Slides. The heads of your listeners will swirl with your ideas. Download our Pyramids PowerPoint Templates because You can Connect the dots. Fan expectations as the whole picture emerges.Use these PowerPoint slides for presentations relating to Pyramid, chart, paper, origami, compare, advertisement, sequence, step, layout, triangle, tutorial, business, concept, sign, hierarchy, presentation, glossy, bright, gradation, template, cone, data, clean, process, element, workflow, shape, modern, creative, economic, rhythm, options, shiny, futuristic, web, design, trendy, blue, text, composition, choice, info, five, version, progress, menu, information, promotion, infographics. The prominent colors used in the PowerPoint template are Blue, Gray, Black. Give your thoughts an artistic backing. Add on the craftsmanship of our Shape To Represent 16 Variable In It Ppt Business Plan Downloads PowerPoint Slides.
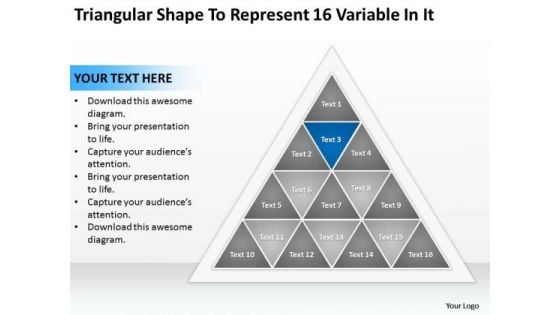
Shape To Represent 16 Variable In It Ppt Example Business Plan PowerPoint Templates
We present our shape to represent 16 variable in it ppt example business plan PowerPoint templates.Use our Marketing PowerPoint Templates because Our PowerPoint Templates and Slides are designed to help you succeed. They have all the ingredients you need. Download and present our Finance PowerPoint Templates because It can Bubble and burst with your ideas. Download our Layers PowerPoint Templates because It will Strengthen your hand with your thoughts. They have all the aces you need to win the day. Download our Triangles PowerPoint Templates because Our PowerPoint Templates and Slides are focused like a searchlight beam. They highlight your ideas for your target audience. Use our Pyramids PowerPoint Templates because It will get your audience in sync.Use these PowerPoint slides for presentations relating to Pyramid, chart, paper, origami, compare, advertisement, sequence, step, layout, triangle, tutorial, business, concept, sign, hierarchy, presentation, glossy, bright, gradation, template, cone, data, clean, process, element, workflow, shape, modern, creative, economic, rhythm, options, shiny, futuristic, web, design, trendy, blue, text, composition, choice, info, five, version, progress, menu, information, promotion, infographics. The prominent colors used in the PowerPoint template are Blue, Gray, Black. Excavate away with our Shape To Represent 16 Variable In It Ppt Example Business Plan PowerPoint Templates. Explore new depths and ways to go.
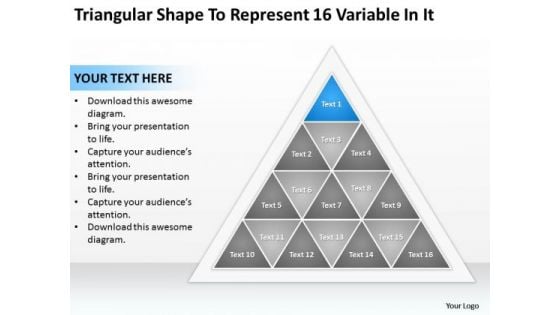
Shape To Represent 16 Variable In It Ppt Business Financial Planning PowerPoint Templates
We present our shape to represent 16 variable in it ppt business financial planning PowerPoint templates.Present our Marketing PowerPoint Templates because Our PowerPoint Templates and Slides offer you the widest possible range of options. Download and present our Finance PowerPoint Templates because Our PowerPoint Templates and Slides will let Your superior ideas hit the target always and everytime. Present our Layers PowerPoint Templates because Our PowerPoint Templates and Slides will give you great value for your money. Be assured of finding the best projection to highlight your words. Present our Triangles PowerPoint Templates because These PowerPoint Templates and Slides will give the updraft to your ideas. See them soar to great heights with ease. Present our Pyramids PowerPoint Templates because our PowerPoint Templates and Slides will give your ideas the shape.Use these PowerPoint slides for presentations relating to Pyramid, chart, paper, origami, compare, advertisement, sequence, step, layout, triangle, tutorial, business, concept, sign, hierarchy, presentation, glossy, bright, gradation, template, cone, data, clean, process, element, workflow, shape, modern, creative, economic, rhythm, options, shiny, futuristic, web, design, trendy, blue, text, composition, choice, info, five, version, progress, menu, information, promotion, infographics. The prominent colors used in the PowerPoint template are Blue, Gray, Black. Our Shape To Represent 16 Variable In It Ppt Business Financial Planning PowerPoint Templates are clear and concise. Your assessment will be completely accurate.
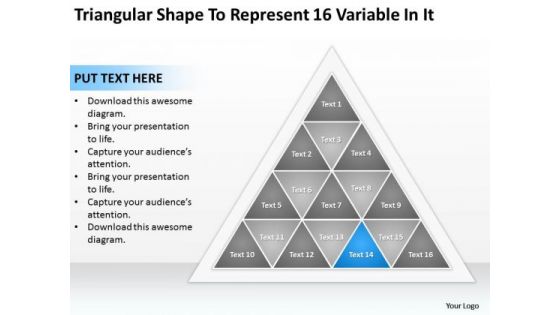
Shape To Represent 16 Variable In It Ppt Business Plan Outline Sample PowerPoint Slides
We present our shape to represent 16 variable in it ppt business plan outline sample PowerPoint Slides.Present our Marketing PowerPoint Templates because Our PowerPoint Templates and Slides will definately Enhance the stature of your presentation. Adorn the beauty of your thoughts with their colourful backgrounds. Present our Finance PowerPoint Templates because you should Whip up a frenzy with our PowerPoint Templates and Slides. They will fuel the excitement of your team. Download and present our Layers PowerPoint Templates because Our PowerPoint Templates and Slides will provide you the cutting edge. Slice through the doubts in the minds of your listeners. Use our Triangles PowerPoint Templates because Your success is our commitment. Our PowerPoint Templates and Slides will ensure you reach your goal. Present our Pyramids PowerPoint Templates because Our PowerPoint Templates and Slides will generate and maintain the level of interest you desire. They will create the impression you want to imprint on your audience.Use these PowerPoint slides for presentations relating to Pyramid, chart, paper, origami, compare, advertisement, sequence, step, layout, triangle, tutorial, business, concept, sign, hierarchy, presentation, glossy, bright, gradation, template, cone, data, clean, process, element, workflow, shape, modern, creative, economic, rhythm, options, shiny, futuristic, web, design, trendy, blue, text, composition, choice, info, five, version, progress, menu, information, promotion, infographics. The prominent colors used in the PowerPoint template are Blue, Gray, Black. Our Shape To Represent 16 Variable In It Ppt Business Plan Outline Sample PowerPoint Slides are able catalysts. They will churn your thoughts and extract good plans.
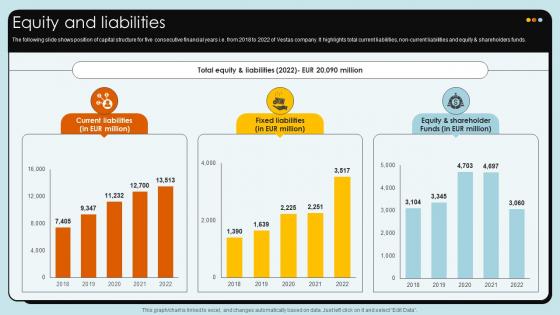
Equity And Liabilities Wind Turbines Manufacturer Company Profile CP SS V
The following slide shows position of capital structure for five consecutive financial years i.e. from 2018 to 2022 of Vestas company. It highlights total current liabilities, non-current liabilities and equity and shareholders funds. Slidegeeks is here to make your presentations a breeze with Equity And Liabilities Wind Turbines Manufacturer Company Profile CP SS V With our easy-to-use and customizable templates, you can focus on delivering your ideas rather than worrying about formatting. With a variety of designs to choose from, you are sure to find one that suits your needs. And with animations and unique photos, illustrations, and fonts, you can make your presentation pop. So whether you are giving a sales pitch or presenting to the board, make sure to check out Slidegeeks first The following slide shows position of capital structure for five consecutive financial years i.e. from 2018 to 2022 of Vestas company. It highlights total current liabilities, non-current liabilities and equity and shareholders funds.
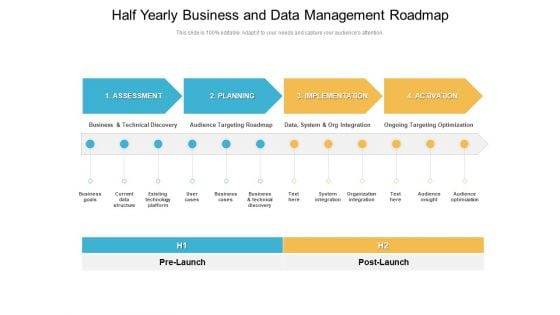
Half Yearly Business And Data Management Roadmap Demonstration
We present our five years business and data management roadmap background. This PowerPoint layout is easy-to-edit so you can change the font size, font type, color, and shape conveniently. In addition to this, the PowerPoint layout is Google Slides compatible, so you can share it with your audience and give them access to edit it. Therefore, download and save this well-researched five years business and data management roadmap background in different formats like PDF, PNG, and JPG to smoothly execute your business plan.
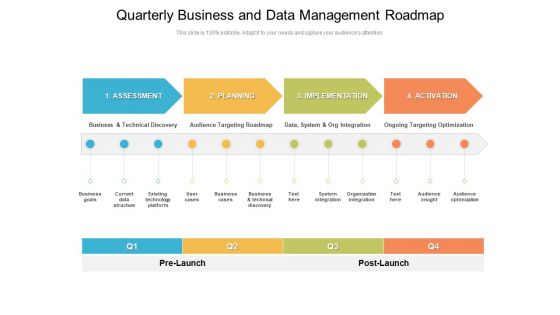
Quarterly Business And Data Management Roadmap Microsoft
We present our five years business and data management roadmap background. This PowerPoint layout is easy-to-edit so you can change the font size, font type, color, and shape conveniently. In addition to this, the PowerPoint layout is Google Slides compatible, so you can share it with your audience and give them access to edit it. Therefore, download and save this well-researched five years business and data management roadmap background in different formats like PDF, PNG, and JPG to smoothly execute your business plan.
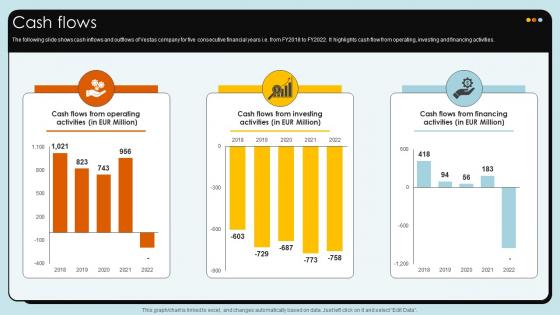
Cash Flows Wind Turbines Manufacturer Company Profile CP SS V
The following slide shows cash inflows and outflows of Vestas company for five consecutive financial years i.e. from FY2018 to FY2022. It highlights cash flow from operating, investing and financing activities. There are so many reasons you need a Cash Flows Wind Turbines Manufacturer Company Profile CP SS V. The first reason is you can not spend time making everything from scratch, Thus, Slidegeeks has made presentation templates for you too. You can easily download these templates from our website easily. The following slide shows cash inflows and outflows of Vestas company for five consecutive financial years i.e. from FY2018 to FY2022. It highlights cash flow from operating, investing and financing activities.
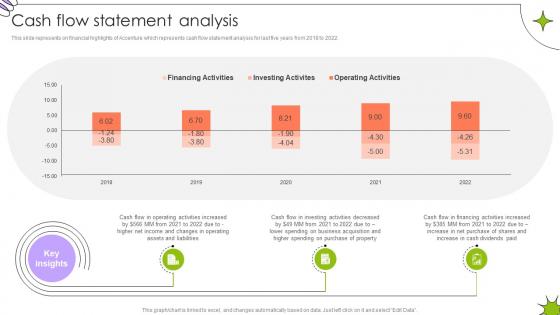
Cash Flow Statement Analysis Global Innovation And Business Solutions Company Profile CP SS V
This slide represents on financial highlights of Accenture which represents cash flow statement analysis for last five years from 2018 to 2022.There are so many reasons you need a Cash Flow Statement Analysis Global Innovation And Business Solutions Company Profile CP SS V. The first reason is you can not spend time making everything from scratch, Thus, Slidegeeks has made presentation templates for you too. You can easily download these templates from our website easily. This slide represents on financial highlights of Accenture which represents cash flow statement analysis for last five years from 2018 to 2022.
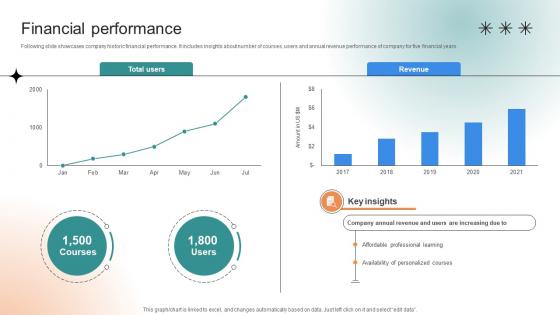
Financial Performance Professional Learning Platform Funding Pitch Deck
Following slide showcases company historic financial performance. It includes insights about number of courses, users and annual revenue performance of company for five financial years. From laying roadmaps to briefing everything in detail, our templates are perfect for you. You can set the stage with your presentation slides. All you have to do is download these easy-to-edit and customizable templates. Financial Performance Professional Learning Platform Funding Pitch Deck will help you deliver an outstanding performance that everyone would remember and praise you for. Do download this presentation today. Following slide showcases company historic financial performance. It includes insights about number of courses, users and annual revenue performance of company for five financial years.
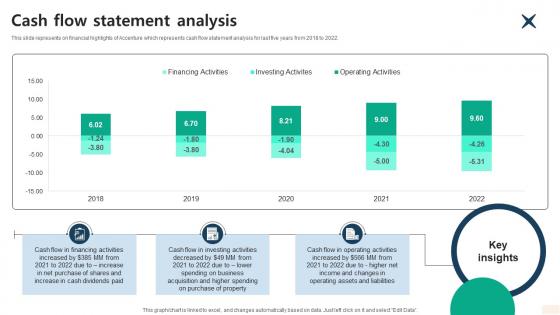
Cash Flow Statement Analysis Global Consulting And Technology Services Company Profile CP SS V
This slide represents on financial highlights of Accenture which represents cash flow statement analysis for last five years from 2018 to 2022.There are so many reasons you need a Cash Flow Statement Analysis Global Consulting And Technology Services Company Profile CP SS V. The first reason is you can not spend time making everything from scratch, Thus, Slidegeeks has made presentation templates for you too. You can easily download these templates from our website easily. This slide represents on financial highlights of Accenture which represents cash flow statement analysis for last five years from 2018 to 2022.
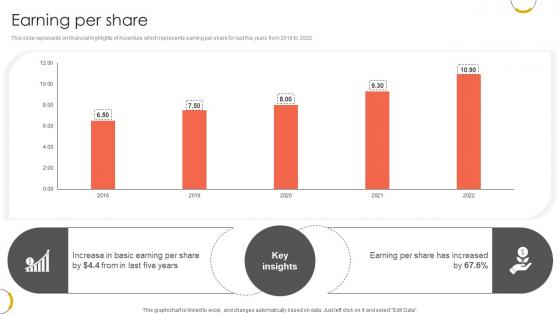
Earning Per Share Professional Services And Technology Consulting Ppt Powerpoint CP SS V
This slide represents on financial highlights of Accenture which represents earning per share for last five years from 2018 to 2022. The best PPT templates are a great way to save time, energy, and resources. Slidegeeks have 100 percent editable powerpoint slides making them incredibly versatile. With these quality presentation templates, you can create a captivating and memorable presentation by combining visually appealing slides and effectively communicating your message. Download Earning Per Share Professional Services And Technology Consulting Ppt Powerpoint CP SS V from Slidegeeks and deliver a wonderful presentation. This slide represents on financial highlights of Accenture which represents earning per share for last five years from 2018 to 2022.
Assets Branded Clothing Company Profile PPT PowerPoint CP SS V
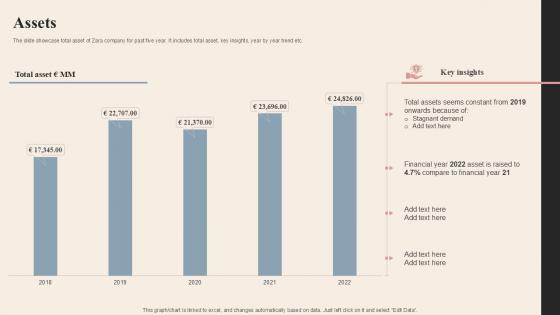
The slide showcase total asset of Zara company for past five year. It includes total asset, key insights, year by year trend etc. Find a pre-designed and impeccable Assets Branded Clothing Company Profile PPT PowerPoint CP SS V. The templates can ace your presentation without additional effort. You can download these easy-to-edit presentation templates to make your presentation stand out from others. So, what are you waiting for Download the template from Slidegeeks today and give a unique touch to your presentation. The slide showcase total asset of Zara company for past five year. It includes total asset, key insights, year by year trend etc.
Total Deals International Trade Of Products And Services PPT Sample CP SS V
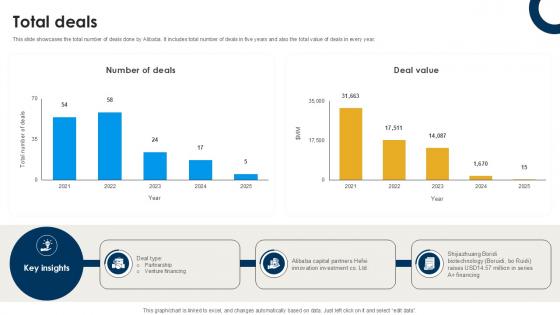
This slide showcases the total number of deals done by Alibaba. It includes total number of deals in five years and also the total value of deals in every year. There are so many reasons you need a Total Deals International Trade Of Products And Services PPT Sample CP SS V. The first reason is you can not spend time making everything from scratch, Thus, Slidegeeks has made presentation templates for you too. You can easily download these templates from our website easily. This slide showcases the total number of deals done by Alibaba. It includes total number of deals in five years and also the total value of deals in every year.
Quarterly Business Management Competitive Strategy Formation Roadmap Topics
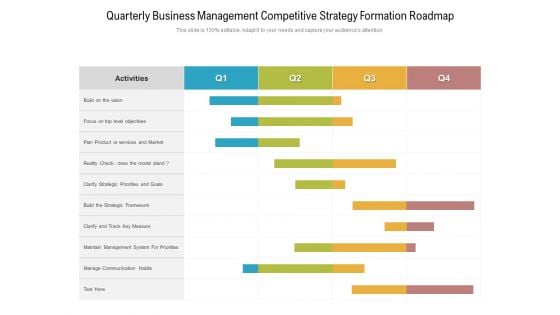
Presenting our innovatively-structured five years business and data management roadmap background Template. Showcase your roadmap process in different formats like PDF, PNG, and JPG by clicking the download button below. This PPT design is available in both Standard Screen and Widescreen aspect ratios. It can also be easily personalized and presented with modified font size, font type, color, and shapes to measure your progress in a clear way.
Crm Dashboard Leads By Source Ppt PowerPoint Presentation Example File
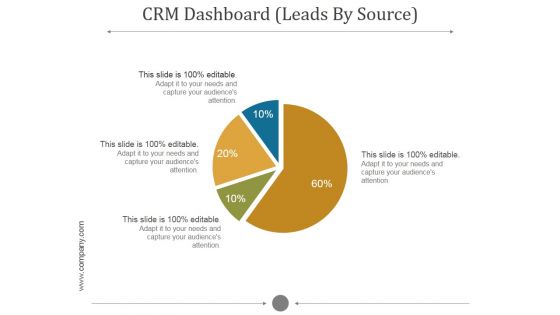
This is a crm dashboard leads by source ppt powerpoint presentation example file. This is a five stage process. The stages in this process are pie, division, finance, dashboard, percent.
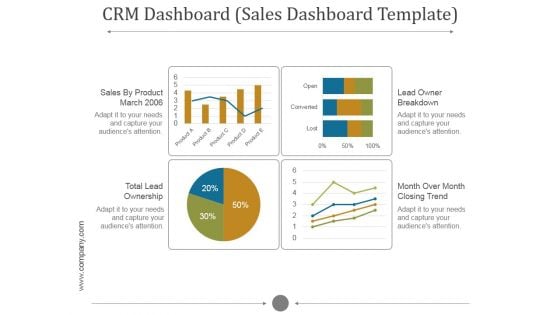
Crm Dashboard Sales Dashboard Template Ppt PowerPoint Presentation Inspiration
This is a crm dashboard sales dashboard template ppt powerpoint presentation inspiration. This is a five stage process. The stages in this process are sales by product march, lead owner breakdown, total lead ownership, month over month closing trend.
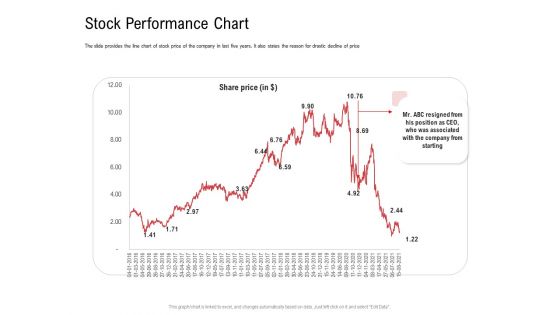
Investor Pitch Deck Collect Funding Spot Market Stock Performance Chart Demonstration PDF
The slide provides the line chart of stock price of the company in last five years. It also states the reason for drastic decline of price. Deliver an awe-inspiring pitch with this creative investor pitch deck collect funding spot market stock performance chart demonstration pdf bundle. Topics like stock performance chart can be discussed with this completely editable template. It is available for immediate download depending on the needs and requirements of the user.
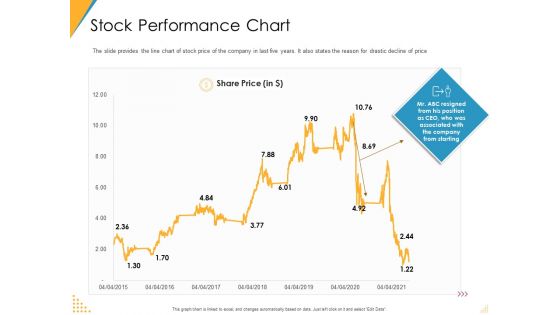
Investor Pitch Deck Post Market Financing Stock Performance Chart Ppt Summary Inspiration PDF
The slide provides the line chart of stock price of the company in last five years. It also states the reason for drastic decline of price. Deliver an awe-inspiring pitch with this creative investor pitch deck post market financing stock performance chart ppt summary inspiration pdf bundle. Topics like stock performance chart can be discussed with this completely editable template. It is available for immediate download depending on the needs and requirements of the user.
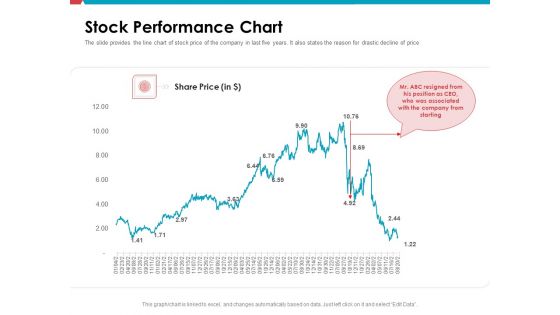
Investor Pitch Deck Public Offering Market Stock Performance Chart Mockup PDF
The slide provides the line chart of stock price of the company in last five years. It also states the reason for drastic decline of price. Deliver an awe-inspiring pitch with this creative investor pitch deck public offering market stock performance chart mockup pdf bundle. Topics like stock performance chart can be discussed with this completely editable template. It is available for immediate download depending on the needs and requirements of the user.
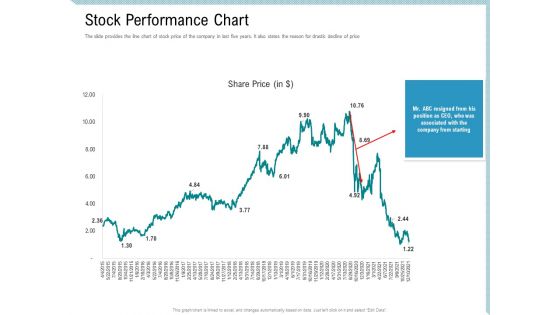
Investor Pitch Deck Collect Capital Financial Market Stock Performance Chart Designs PDF
The slide provides the line chart of stock price of the company in last five years. It also states the reason for drastic decline of price. Deliver an awe-inspiring pitch with this creative investor pitch deck collect capital financial market stock performance chart designs pdf bundle. Topics like stock performance chart can be discussed with this completely editable template. It is available for immediate download depending on the needs and requirements of the user.
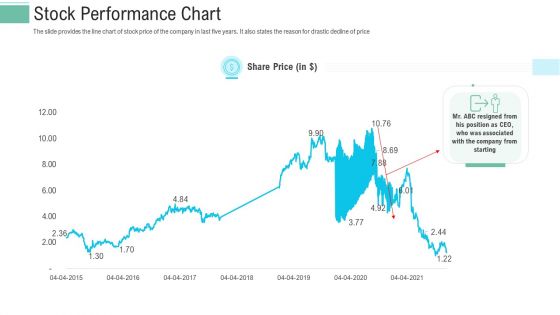
Pitch Presentation Raise Money Spot Market Stock Performance Chart Ppt Portfolio Rules PDF
The slide provides the line chart of stock price of the company in last five years. It also states the reason for drastic decline of price. Deliver and pitch your topic in the best possible manner with this pitch presentation raise money spot market stock performance chart ppt portfolio rules pdf. Use them to share invaluable insights on stock performance chart and impress your audience. This template can be altered and modified as per your expectations. So, grab it now.
Digital Application Software Development Business Profile Financial Statements Icons PDF
The slide showcases income statement, balance sheet and cashflow statement of last five years to represent current financial position of organisation. Crafting an eye-catching presentation has never been more straightforward. Let your presentation shine with this tasteful yet straightforward Digital Application Software Development Business Profile Financial Statements Icons PDF template. It offers a minimalistic and classy look that is great for making a statement. The colors have been employed intelligently to add a bit of playfulness while still remaining professional. Construct the ideal Digital Application Software Development Business Profile Financial Statements Icons PDF that effortlessly grabs the attention of your audience Begin now and be certain to wow your customers.

Happy Child With Painted Hands Art PowerPoint Themes And PowerPoint Slides 0711
Microsoft PowerPoint Theme and Slide with five year old boy with hands painted in colorful paints ready for hand prints Our Happy Child With Painted Hands Art PowerPoint Themes And PowerPoint Slides 0711 afford you different approaches. Cope with constantly changing demands.
Yearly Outcomes Summary Of Profit And Loss Trends Icons PDF
This slide shows the graphical representation of result summary of profit and loss trends for five consecutive years that shows revenues, cost of goods sold, selling, general and administrative expenses, net income, etc.Pitch your topic with ease and precision using this Yearly Outcomes Summary Of Profit And Loss Trends Icons PDF This layout presents information on Earned Maximum, Selling General, Administrative Expenses It is also available for immediate download and adjustment. So, changes can be made in the color, design, graphics or any other component to create a unique layout.
IT Application Services Company Outline Company Revenue Icons PDF
The slide shows annual revenue growth of the company with the CAGR for last five financial years from 2018 to 2022. It also highlights year on year growth along with key insights. Deliver and pitch your topic in the best possible manner with this IT Application Services Company Outline Company Revenue Icons PDF. Use them to share invaluable insights on Gross Profit Margin, Revenue, Business and impress your audience. This template can be altered and modified as per your expectations. So, grab it now.
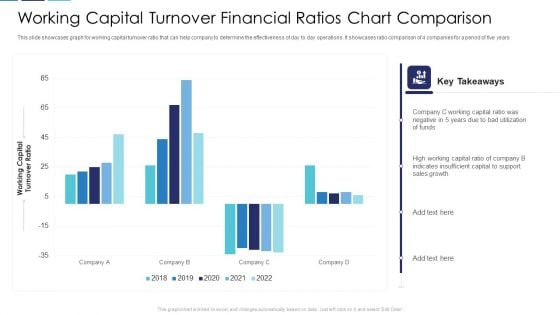
Working Capital Turnover Financial Ratios Chart Comparison Clipart PDF
This slide showcases graph for working capital turnover ratio that can help company to determine the effectiveness of day to day operations. It showcases ratio comparison of 4 companies for a period of five years Pitch your topic with ease and precision using this working capital turnover financial ratios chart comparison clipart pdf. This layout presents information on working capital turnover financial ratios chart comparison. It is also available for immediate download and adjustment. So, changes can be made in the color, design, graphics or any other component to create a unique layout.
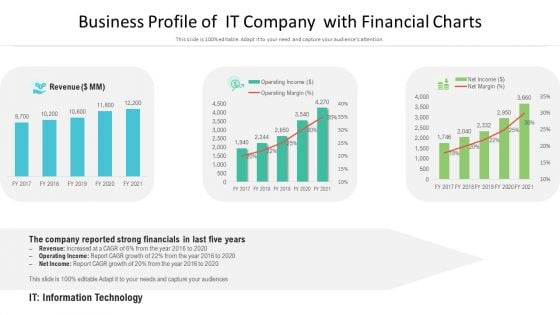
Business Profile Of It Company With Financial Charts Ppt PowerPoint Presentation Model Ideas PDF
Deliver and pitch your topic in the best possible manner with this business profile of it company with financial charts ppt powerpoint presentation model ideas pdf. Use them to share invaluable insights on the company reported strong financials in last five years, operating income, net income and impress your audience. This template can be altered and modified as per your expectations. So, grab it now.
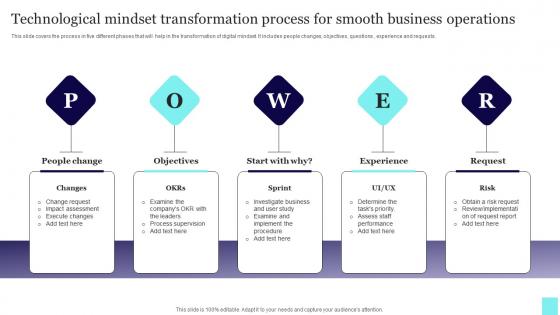
Technological Mindset Transformation Process For Smooth Business Operations Mockup Pdf
This slide covers the process in five different phases that will help in the transformation of digital mindset. It includes people changes, objectives, questions , experience and requests. Pitch your topic with ease and precision using this Technological Mindset Transformation Process For Smooth Business Operations Mockup Pdf. This layout presents information on People Change, Objectives, Experience. It is also available for immediate download and adjustment. So, changes can be made in the color, design, graphics or any other component to create a unique layout. This slide covers the process in five different phases that will help in the transformation of digital mindset. It includes people changes, objectives, questions , experience and requests.
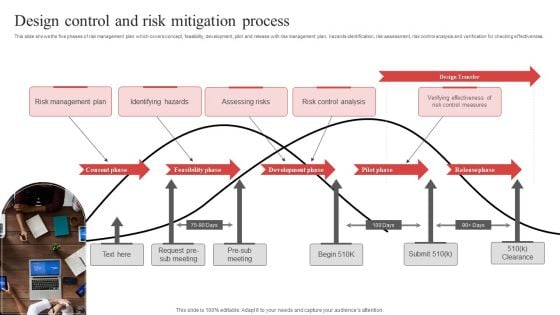
Design Control And Risk Mitigation Process Ppt PowerPoint Presentation File Grid PDF
This slide shows the five phases of risk management plan which covers concept, feasibility, development, pilot and release with risk management plan, hazards identification, risk assessment, risk control analysis and verification for checking effectiveness. Presenting Design Control And Risk Mitigation Process Ppt PowerPoint Presentation File Grid PDF to dispense important information. This template comprises one stages. It also presents valuable insights into the topics including Consent Phase, Feasibility Phase, Development Phase, Pilot Phase. This is a completely customizable PowerPoint theme that can be put to use immediately. So, download it and address the topic impactfully.
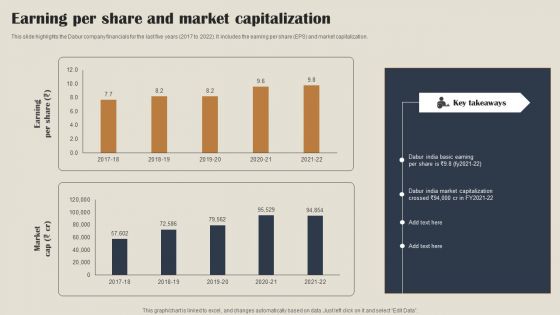
Self Care Products Company Outline Earning Per Share And Market Capitalization Themes PDF
This slide highlights the Dabur company financials for the last five years 2017 to 2022. It includes the earning per share EPS and market capitalization. Find highly impressive Self Care Products Company Outline Earning Per Share And Market Capitalization Themes PDF on Slidegeeks to deliver a meaningful presentation. You can save an ample amount of time using these presentation templates. No need to worry to prepare everything from scratch because Slidegeeks experts have already done a huge research and work for you. You need to download Self Care Products Company Outline Earning Per Share And Market Capitalization Themes PDF for your upcoming presentation. All the presentation templates are 100 percent editable and you can change the color and personalize the content accordingly. Download now.
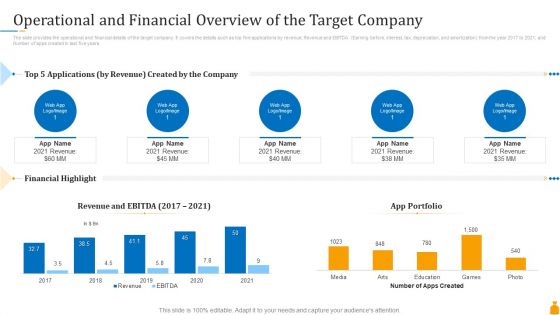
Financial Banking PPT Operational And Financial Overview Of The Target Company Pictures PDF
The slide provides the operational and financial details of the target company. It covers the details such as top five applications by revenue, Revenue and EBITDA Earning before, interest, tax, depreciation, and amortization from the year 2017 to 2021, and Number of apps created in last five years. Deliver and pitch your topic in the best possible manner with this financial banking ppt operational and financial overview of the target company pictures pdf. Use them to share invaluable insights on portfolio, revenue, operational and financial details and impress your audience. This template can be altered and modified as per your expectations. So, grab it now.
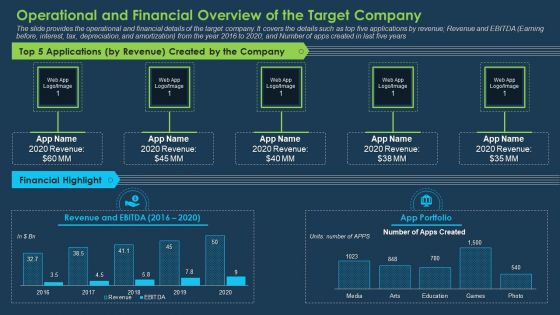
Commercial Banking Template Collection Operational And Financial Overview Of The Target Company Inspiration PDF
The slide provides the operational and financial details of the target company. It covers the details such as top five applications by revenue Revenue and EBITDA Earning before, interest, tax, depreciation, and amortization from the year 2016 to 2020 and Number of apps created in last five years. Deliver an awe-inspiring pitch with this creative commercial banking template collection operational and financial overview of the target company inspiration pdf bundle. Topics like financial highlight, revenue and ebitda, app portfolio can be discussed with this completely editable template. It is available for immediate download depending on the needs and requirements of the user.
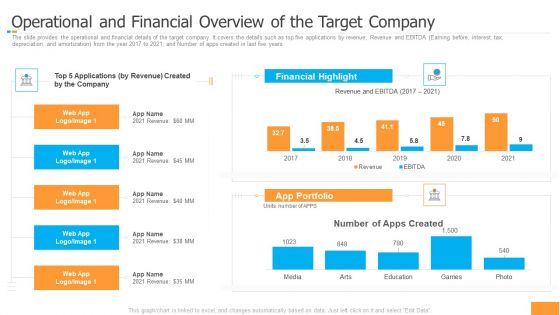
Funding Pitch Book Outline Operational And Financial Overview Of The Target Company Portrait PDF
The slide provides the operational and financial details of the target company. It covers the details such as top five applications by revenue Revenue and EBITDA Earning before, interest, tax, depreciation, and amortization from the year 2016 to 2020 and Number of apps created in last five years. Deliver an awe inspiring pitch with this creative funding pitch book outline operational and financial overview of the target company portrait pdf bundle. Topics like portfolio, financial, revenue can be discussed with this completely editable template. It is available for immediate download depending on the needs and requirements of the user.
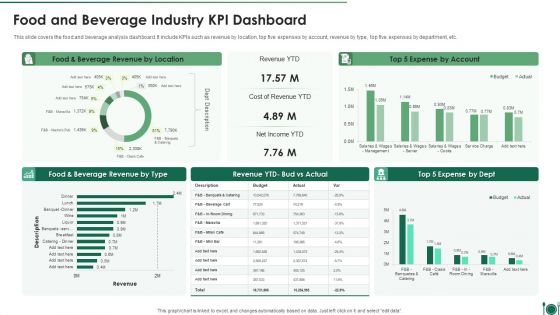
Food And Beverage Industry Kpi Dashboard Professional PDF
This slide covers the food and beverage analysis dashboard. It include KPIs such as revenue by location, top five expenses by account, revenue by type, top five expenses by department, etc.Showcasing this set of slides titled Food And Beverage Industry Kpi Dashboard Professional PDF. The topics addressed in these templates are Food And Beverage Industry KPI Dashboard. All the content presented in this PPT design is completely editable. Download it and make adjustments in color, background, font etc. as per your unique business setting
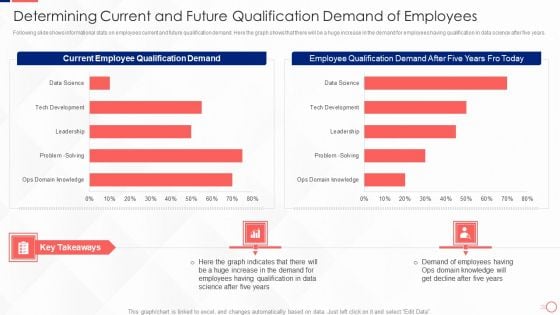
Investing In Tech Innovation Determining Current And Future Qualification Demand Graphics PDF
Following slide shows informational stats on employees current and future qualification demand. Here the graph shows that there will be a huge increase in the demand for employees having qualification in data science after five years. Deliver an awe inspiring pitch with this creative Investing In Tech Innovation Determining Current And Future Qualification Demand Graphics PDF bundle. Topics like Current Employee Qualification Demand, Employee Qualification, Demand After Five Years can be discussed with this completely editable template. It is available for immediate download depending on the needs and requirements of the user.
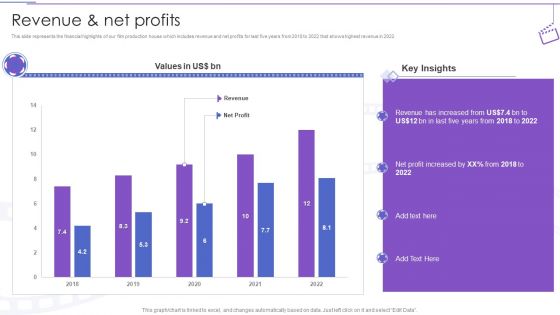
Film Making Company Outline Revenue And Net Profits Ppt PowerPoint Presentation Ideas Slide Portrait PDF
This slide represents the financial highlights of our film production house which includes revenue and net profits for last five years from 2018 to 2022 that shows highest revenue in 2022.Deliver an awe inspiring pitch with this creative Film Making Company Outline Revenue And Net Profits Ppt PowerPoint Presentation Ideas Slide Portrait PDF bundle. Topics like Revenue Increased, Five Years, Profit Increased can be discussed with this completely editable template. It is available for immediate download depending on the needs and requirements of the user.
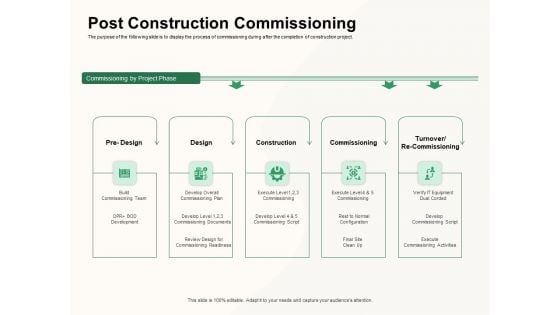
How To Effectively Manage A Construction Project Post Construction Commissioning Pictures PDF
The purpose of the following slide is to display the process of commissioning during after the completion of construction project.Presenting how to effectively manage a construction project post construction commissioning pictures pdf. to provide visual cues and insights. Share and navigate important information on five stages that need your due attention. This template can be used to pitch topics like commissioning, construction, design, turnover re commissioning, pre design. In addtion, this PPT design contains high resolution images, graphics, etc, that are easily editable and available for immediate download.
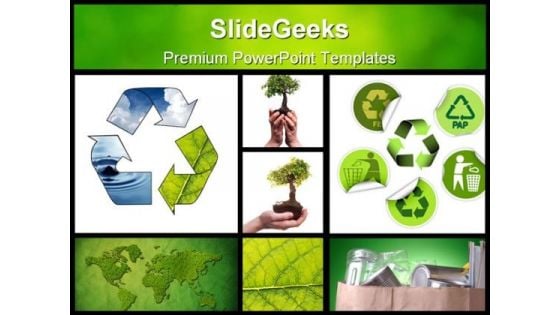
Environmental Collage Nature PowerPoint Backgrounds And Templates 1210
Microsoft PowerPoint Template and Background with Environmental themed collage made from five images With our Environmental Collage Nature PowerPoint Backgrounds And Templates 1210 there is no sitting on the fence. The audience will see a definite choice ahead.
Retail Marketing Strategic Foundation Approach With Impact Icons PDF
This slide represents the five foundation strategies for retail marketing along with their impact. It includes five retail marketing strategies such as create impressive storefronts, motivate employees with better wages, provide adequate employee training, engage customers and leverage social media capabilities. Showcasing this set of slides titled Retail Marketing Strategic Foundation Approach With Impact Icons PDF. The topics addressed in these templates are Create Impressive Storefronts, Engage Customers, Adequate Employee Training. All the content presented in this PPT design is completely editable. Download it and make adjustments in color, background, font etc. as per your unique business setting.
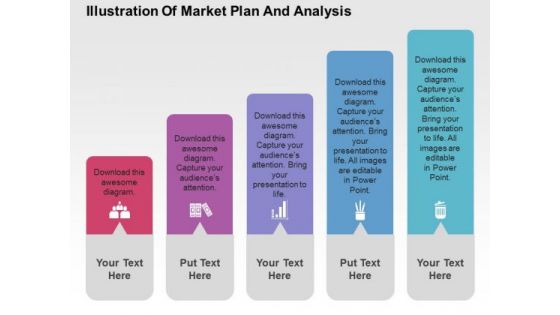
Illustration Of Market Plan And Analysis PowerPoint Templates
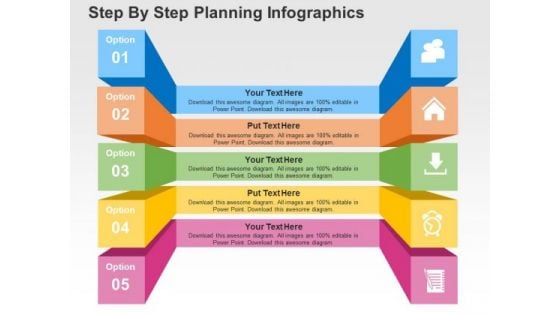
The above slide displays five text boxes with icons. This template has been designed to present market plan and analysis. Imprint your concepts with this PPT slide in your presentations.
Step By Step Planning Infographics PowerPoint Templates
The above slide displays five text boxes with icons. This template has been designed to present market plan and analysis. Imprint your concepts with this PPT slide in your presentations.
Infographic To Define Market Research PowerPoint Template
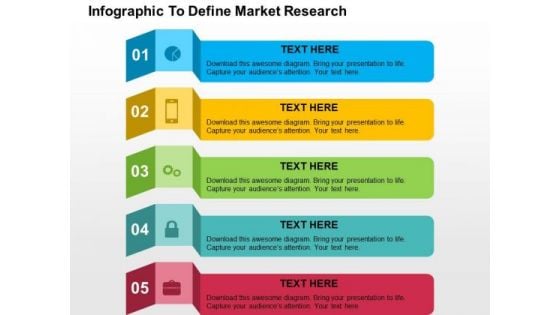
This slide contains graphics of five steps with icons. You may download this professional slide to define marketing research. Use this editable slide to build quality presentation for your viewers.
Business Service Management Mind Map Ppt PowerPoint Presentation Template
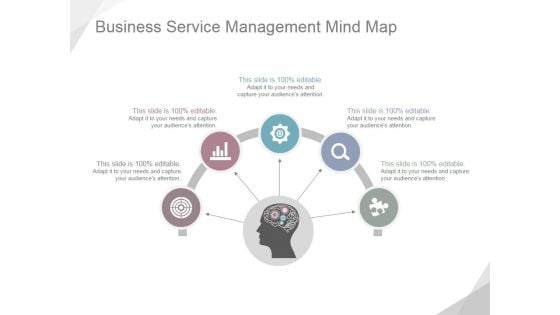
This is a business service management mind map ppt powerpoint presentation template. This is a five stage process. The stages in this process are business, icons, marketing, management, mind map.
Brainstorm For Judging The Alternatives Ppt PowerPoint Presentation Picture
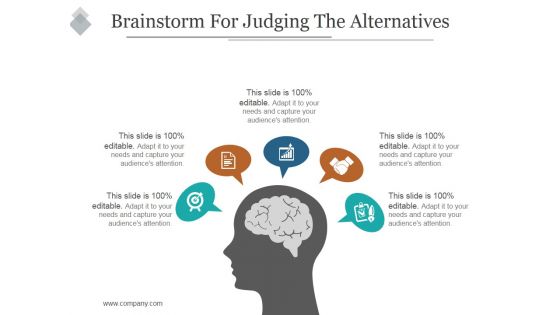
This is a brainstorm for judging the alternatives ppt powerpoint presentation picture. This is a five stage process. The stages in this process are icon, brain, idea, innovation, mind map.
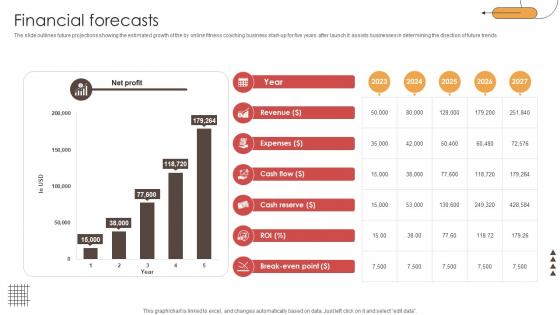
Financial Forecasts Digital Physical Training Business Market Entry Plan GTM SS V
The slide outlines future projections showing the estimated growth of the by online fitness coaching business start-up for five years after launch It assists businesses in determining the direction of future trends.Retrieve professionally designed Financial Forecasts Digital Physical Training Business Market Entry Plan GTM SS V to effectively convey your message and captivate your listeners. Save time by selecting pre-made slideshows that are appropriate for various topics, from business to educational purposes. These themes come in many different styles, from creative to corporate, and all of them are easily adjustable and can be edited quickly. Access them as PowerPoint templates or as Google Slides themes. You do not have to go on a hunt for the perfect presentation because Slidegeeks got you covered from everywhere. The slide outlines future projections showing the estimated growth of the by online fitness coaching business start-up for five years after launch It assists businesses in determining the direction of future trends.
Cyber Physical Systems In Manufacturing Ppt Icon Good PDF
This slide represents the application of CPS in manufacturing, including its five C structure such as connection, conversion, cyber, cognition, and configuration. Deliver an awe inspiring pitch with this creative Cyber Physical Systems In Manufacturing Ppt Icon Good PDF bundle. Topics like Manufacturing Industry, Industrial Processes, Manufacturing Environment can be discussed with this completely editable template. It is available for immediate download depending on the needs and requirements of the user.
Profit And Loss Account Statement Summary Elderly Care Business Plan Go To Market Strategy Icons Pdf
The slides provide a glimpse of the projected profit and loss statement to visualize the platforms financial performance for the next five years. The key components are total revenue from operations, gross profit, EBITDA, etc. Presenting this PowerPoint presentation, titled Profit And Loss Account Statement Summary Elderly Care Business Plan Go To Market Strategy Icons Pdf, with topics curated by our researchers after extensive research. This editable presentation is available for immediate download and provides attractive features when used. Download now and captivate your audience. Presenting this Profit And Loss Account Statement Summary Elderly Care Business Plan Go To Market Strategy Icons Pdf. Our researchers have carefully researched and created these slides with all aspects taken into consideration. This is a completely customizable Profit And Loss Account Statement Summary Elderly Care Business Plan Go To Market Strategy Icons Pdf that is available for immediate downloading. Download now and make an impact on your audience. Highlight the attractive features available with our PPTs. The slides provide a glimpse of the projected profit and loss statement to visualize the platforms financial performance for the next five years. The key components are total revenue from operations, gross profit, EBITDA, etc.
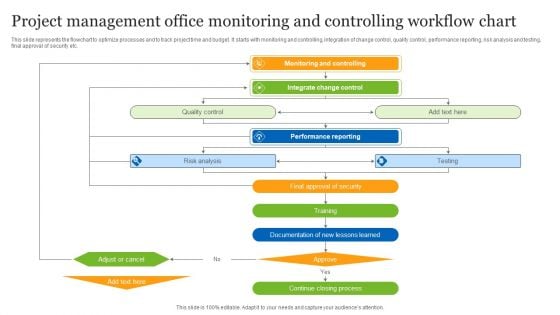
Project Management Office Monitoring And Controlling Workflow Chart Ppt Slides Mockup PDF
This slide represents the flowchart to optimize processes and to track project time and budget. It starts with monitoring and controlling, integration of change control, quality control, performance reporting, risk analysis and testing, final approval of security etc. Presenting Project Management Office Monitoring And Controlling Workflow Chart Ppt Slides Mockup PDF to dispense important information. This template comprises five stages. It also presents valuable insights into the topics including Monitoring And Controlling, Integrate Change Control, Performance Reporting. This is a completely customizable PowerPoint theme that can be put to use immediately. So, download it and address the topic impactfully.
Factor Influencing User Experience Dairy Industry Company Revenue And Market Share Icons PDF
This slide shows the companys total revenue and its brand share in the global market. It shows the increase in the total revenue in next five years and also increase in the market share of the company globally. Deliver and pitch your topic in the best possible manner with this factor influencing user experience dairy industry company revenue and market share icons pdf . Use them to share invaluable insights on company revenue and market share after the implementation of strategies and impress your audience. This template can be altered and modified as per your expectations. So, grab it now.


 Continue with Email

 Home
Home


