5 point diagram
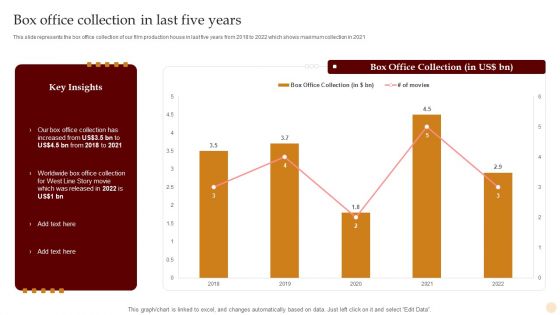
Motion Pictures Production Company Profile Box Office Collection In Last Five Years Diagrams PDF
This slide represents the box office collection of our film production house in last five years from 2018 to 2022 which shows maximum collection in 2021. Deliver and pitch your topic in the best possible manner with this Motion Pictures Production Company Profile Box Office Collection In Last Five Years Diagrams PDF. Use them to share invaluable insights on Box Office Collection, 2018 To 2022 and impress your audience. This template can be altered and modified as per your expectations. So, grab it now.
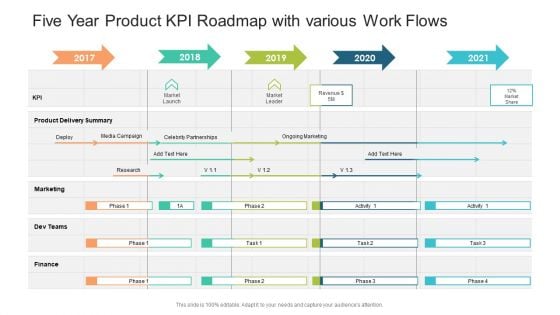
Five Year Product KPI Roadmap With Various Work Flows Diagrams PDF
Presenting the five year product kpi roadmap with various work flows diagrams pdf. The template includes a roadmap that can be used to initiate a strategic plan. Not only this, the PowerPoint slideshow is completely editable and you can effortlessly modify the font size, font type, and shapes according to your needs. This PPT slide can be easily reached in standard screen and widescreen aspect ratios. The set is also available in various formats like PDF, PNG, and JPG. So download and use it multiple times as per your knowledge.
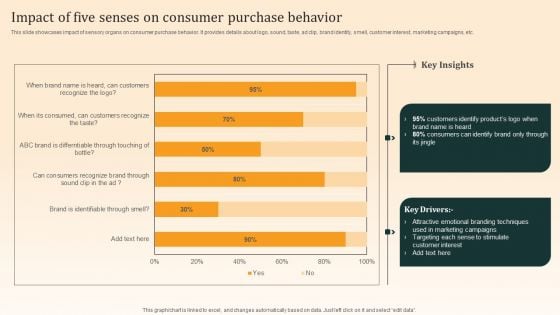
Nike Emotional Branding Strategy Impact Of Five Senses On Consumer Purchase Behavior Diagrams PDF
This slide showcases impact of sensory organs on consumer purchase behavior. It provides details about logo, sound, taste, ad clip, brand identity, smell, customer interest, marketing campaigns, etc. The best PPT templates are a great way to save time, energy, and resources. Slidegeeks have 100 percent editable powerpoint slides making them incredibly versatile. With these quality presentation templates, you can create a captivating and memorable presentation by combining visually appealing slides and effectively communicating your message. Download Nike Emotional Branding Strategy Impact Of Five Senses On Consumer Purchase Behavior Diagrams PDF from Slidegeeks and deliver a wonderful presentation.
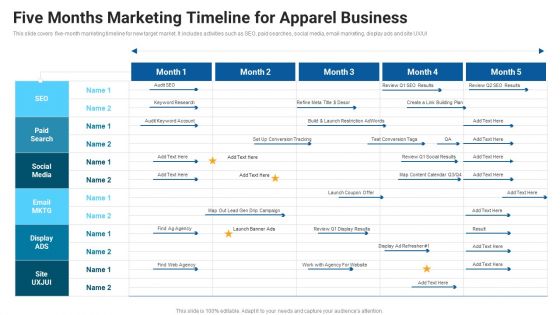
Five Months Marketing Timeline For Apparel Business Market Entry Approach For Apparel Sector Diagrams PDF
This slide covers five month marketing timeline for new target market. It includes activities such as SEO, paid searches, social media, email marketing, display ads and site UXorUI Deliver and pitch your topic in the best possible manner with this Five Months Marketing Timeline For Apparel Business Market Entry Approach For Apparel Sector Diagrams PDF. Use them to share invaluable insights on Social Media, Launch Restriction, Conversion Tracking and impress your audience. This template can be altered and modified as per your expectations. So, grab it now.
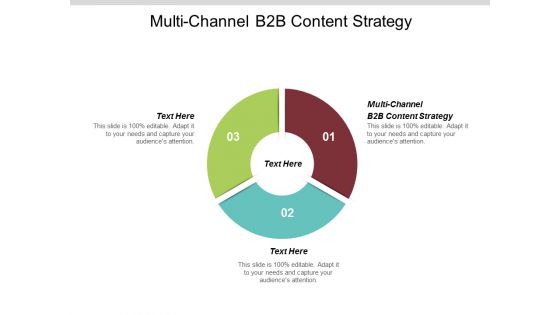
Multi Channel B2B Content Strategy Ppt PowerPoint Presentation Infographic Template Diagrams Cpb
Presenting this set of slides with name multi channel b2b content strategy ppt powerpoint presentation infographic template diagrams cpb. This is a three stage process. The stages in this process are multi channel b2b content strategy. This is a completely editable PowerPoint presentation and is available for immediate download. Download now and impress your audience.
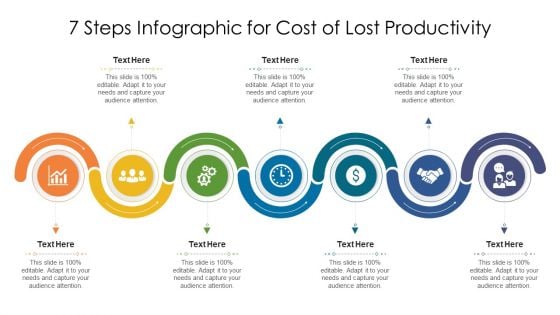
7 Steps Infographic For Cost Of Lost Productivity Ppt PowerPoint Presentation Summary Diagrams PDF
Persuade your audience using this 7 steps infographic for cost of lost productivity ppt powerpoint presentation summary diagrams pdf. This PPT design covers seven stages, thus making it a great tool to use. It also caters to a variety of topics including 7 steps infographic for cost of lost productivity. Download this PPT design now to present a convincing pitch that not only emphasizes the topic but also showcases your presentation skills.
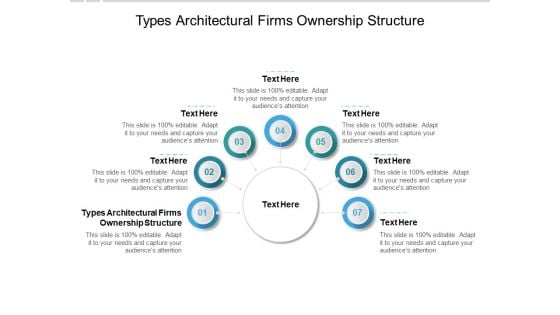
Types Architectural Firms Ownership Structure Ppt PowerPoint Presentation Infographics Diagrams Cpb
Presenting this set of slides with name types architectural firms ownership structure ppt powerpoint presentation infographics diagrams cpb. This is an editable Powerpoint seven stages graphic that deals with topics like types architectural firms ownership structure to help convey your message better graphically. This product is a premium product available for immediate download and is 100 percent editable in Powerpoint. Download this now and use it in your presentations to impress your audience.
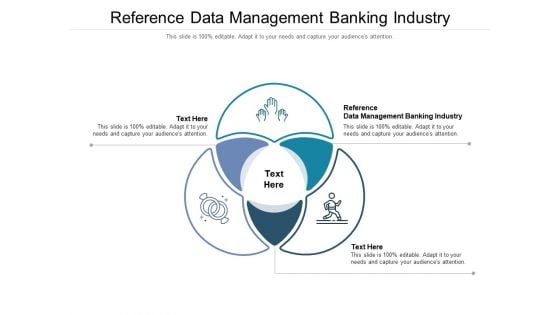
Reference Data Management Banking Industry Ppt PowerPoint Presentation Infographics Diagrams Cpb Pdf
Presenting this set of slides with name reference data management banking industry ppt powerpoint presentation infographics diagrams cpb pdf. This is an editable Powerpoint three stages graphic that deals with topics like reference data management banking industry to help convey your message better graphically. This product is a premium product available for immediate download and is 100 percent editable in Powerpoint. Download this now and use it in your presentations to impress your audience.
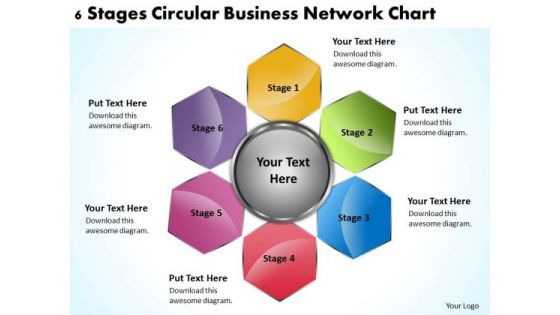
Business Process Flow Diagrams Network Chart PowerPoint Templates Ppt Backgrounds For Slides
We present our business process flow diagrams network chart PowerPoint templates PPT backgrounds for slides.Download and present our Hexagon PowerPoint Templates because you should once Tap the ingenuity of our PowerPoint Templates and Slides. They are programmed to succeed. Use our Business PowerPoint Templates because It can be used to Set your controls for the heart of the sun. Our PowerPoint Templates and Slides will be the propellant to get you there. Download and present our Shapes PowerPoint Templates because Our PowerPoint Templates and Slides will steer your racing mind. Hit the right buttons and spur on your audience. Present our Process and Flows PowerPoint Templates because Your success is our commitment. Our PowerPoint Templates and Slides will ensure you reach your goal. Present our Marketing PowerPoint Templates because Our PowerPoint Templates and Slides will provide the perfect balance. Your weighty ideas will get the ideal impetus.Use these PowerPoint slides for presentations relating to 3d, Abstract, Around, Arrow, Arrow Circles, Chart, Circle, Circular, Circular Arrows, Circular Flow, Circulation, Color, Cycle, Cyclic, Direction, Element, Flow, Glossy, Hexagon, Icon, Illustration, Isolated, Loop, Motion, Movement, Pentagon, Refresh, Ring, Rotation, Round, Section, Set, Shape, Sign, Square, Symbol, Triangle, Vector, Vibrant. The prominent colors used in the PowerPoint template are Red, Blue, Green. The adaptability of our Business Process Flow Diagrams Network Chart PowerPoint Templates Ppt Backgrounds For Slides is a fact. They will align with your bidding.
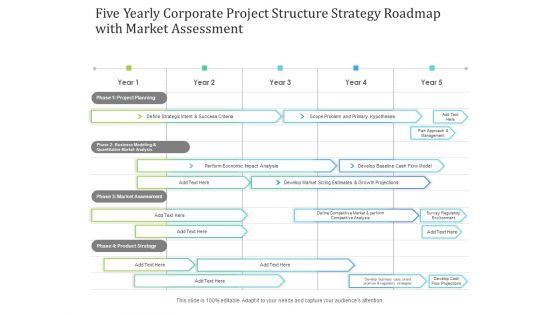
Five Yearly Corporate Project Structure Strategy Roadmap With Market Assessment Diagrams
Introducing our five yearly corporate project structure strategy roadmap with market assessment diagrams. This PPT presentation is Google Slides compatible, therefore, you can share it easily with the collaborators for measuring the progress. Also, the presentation is available in both standard screen and widescreen aspect ratios. So edit the template design by modifying the font size, font type, color, and shapes as per your requirements. As this PPT design is fully editable it can be presented in PDF, JPG and PNG formats.
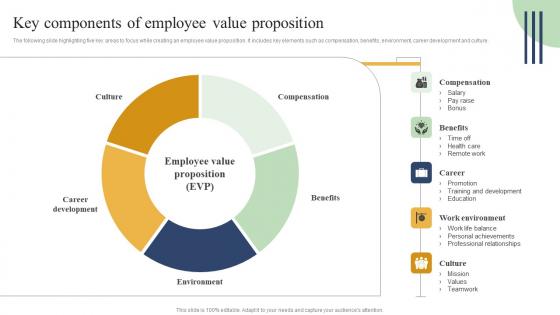
Action Measures To Build Staff Key Components Of Employee Value Proposition Diagrams Pdf
The following slide highlighting five key areas to focus while creating an employee value proposition. It includes key elements such as compensation, benefits, environment, career development and culture. Explore a selection of the finest Action Measures To Build Staff Key Components Of Employee Value Proposition Diagrams Pdf here. With a plethora of professionally designed and pre-made slide templates, you can quickly and easily find the right one for your upcoming presentation. You can use our Action Measures To Build Staff Key Components Of Employee Value Proposition Diagrams Pdf to effectively convey your message to a wider audience. Slidegeeks has done a lot of research before preparing these presentation templates. The content can be personalized and the slides are highly editable. Grab templates today from Slidegeeks. The following slide highlighting five key areas to focus while creating an employee value proposition. It includes key elements such as compensation, benefits, environment, career development and culture.
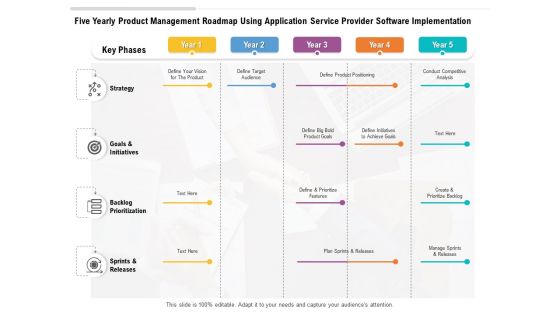
Five Yearly Product Management Roadmap Using Application Service Provider Software Implementation Diagrams
Presenting the five yearly product management roadmap using application service provider software implementation diagrams. The template includes a roadmap that can be used to initiate a strategic plan. Not only this, the PowerPoint slideshow is completely editable and you can effortlessly modify the font size, font type, and shapes according to your needs. This PPT slide can be easily reached in standard screen and widescreen aspect ratios. The set is also available in various formats like PDF, PNG, and JPG. So download and use it multiple times as per your knowledge.
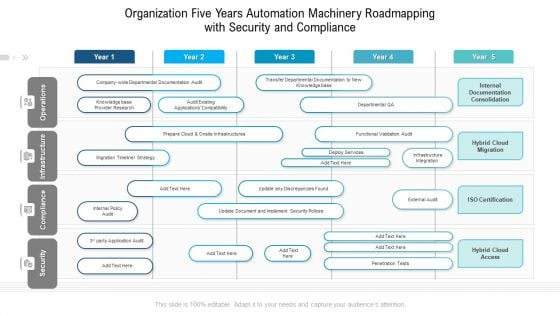
Organization Five Years Automation Machinery Roadmapping With Security And Compliance Diagrams
Presenting the organization five years automation machinery roadmapping with security and compliance diagrams. The template includes a roadmap that can be used to initiate a strategic plan. Not only this, the PowerPoint slideshow is completely editable and you can effortlessly modify the font size, font type, and shapes according to your needs. This PPT slide can be easily reached in standard screen and widescreen aspect ratios. The set is also available in various formats like PDF, PNG, and JPG. So download and use it multiple times as per your knowledge.
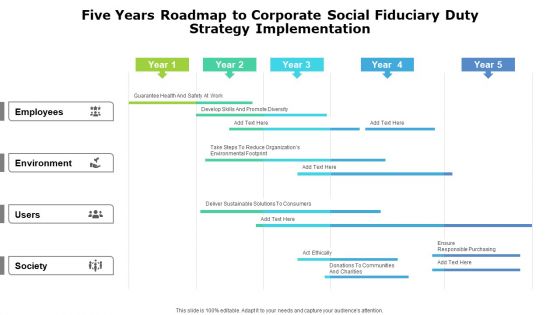
Five Years Roadmap To Corporate Social Fiduciary Duty Strategy Implementation Diagrams
Presenting the five years roadmap to corporate social fiduciary duty strategy implementation diagrams. The template includes a roadmap that can be used to initiate a strategic plan. Not only this, the PowerPoint slideshow is completely editable and you can effortlessly modify the font size, font type, and shapes according to your needs. This PPT slide can be easily reached in standard screen and widescreen aspect ratios. The set is also available in various formats like PDF, PNG, and JPG. So download and use it multiple times as per your knowledge.
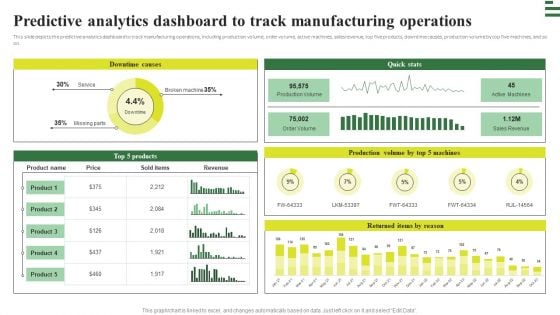
Transforming Manufacturing With Automation Predictive Analytics Dashboard To Track Diagrams PDF
This slide depicts the predictive analytics dashboard to track manufacturing operations, including production volume, order volume, active machines, sales revenue, top five products, downtime causes, production volume by top five machines, and so on. Get a simple yet stunning designed Transforming Manufacturing With Automation Predictive Analytics Dashboard To Track Diagrams PDF. It is the best one to establish the tone in your meetings. It is an excellent way to make your presentations highly effective. So, download this PPT today from Slidegeeks and see the positive impacts. Our easy to edit Transforming Manufacturing With Automation Predictive Analytics Dashboard To Track Diagrams PDF can be your go to option for all upcoming conferences and meetings. So, what are you waiting for Grab this template today.
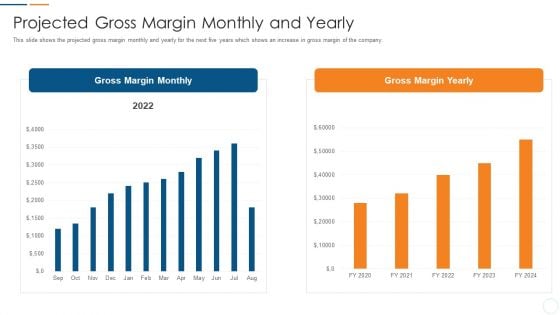
Organization Development Initiatives For Startups Projected Gross Margin Monthly And Yearly Diagrams PDF
This slide shows the projected gross margin monthly and yearly for the next five years which shows an increase in gross margin of the company. Deliver and pitch your topic in the best possible manner with this organization development initiatives for startups projected gross margin monthly and yearly diagrams pdf. Use them to share invaluable insights on projected gross margin monthly and yearly and impress your audience. This template can be altered and modified as per your expectations. So, grab it now.
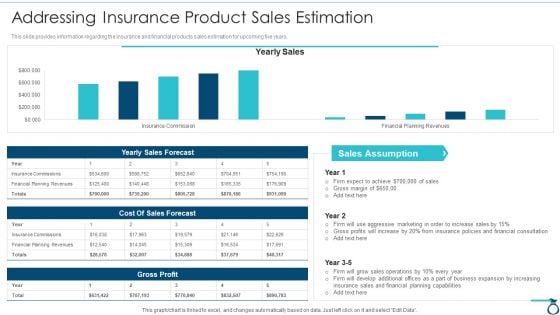
Financial Services Advisory Business Plan Addressing Insurance Product Sales Estimation Diagrams PDF
This slide provides information regarding the insurance and financial products sales estimation for upcoming five years. Deliver an awe inspiring pitch with this creative Financial Services Advisory Business Plan Addressing Insurance Product Sales Estimation Diagrams PDF bundle. Topics like Gross Profit, Cost Of Sales, Sales Assumption, Aggressive Marketing, Increasing Insurance can be discussed with this completely editable template. It is available for immediate download depending on the needs and requirements of the user.

Tour Agency Business Profile Operating Profit 2018 To 2022 Diagrams PDF
This slide covers the operating profit of travel agency for last five years from 2018 to 2022 which shows increase in operating profits year after year due to more efficient use of resources.Deliver an awe inspiring pitch with this creative Tour Agency Business Profile Operating Profit 2018 To 2022 Diagrams PDF bundle. Topics like Operating Profit, Primary Reason, Improved Operating can be discussed with this completely editable template. It is available for immediate download depending on the needs and requirements of the user.
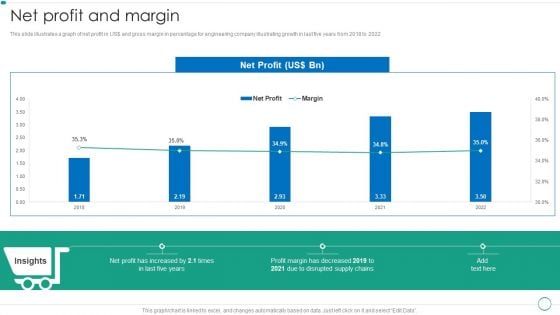
Real Estate Construction And Engineering Company Profile Net Profit And Margin Diagrams PDF
This slide illustrates a graph of net profit in US and gross margin in percentage for engineering company illustrating growth in last five years from 2018 to 2022.Deliver an awe inspiring pitch with this creative Real Estate Construction And Engineering Company Profile Net Profit And Margin Diagrams PDF bundle. Topics like Disrupted Supply, Profit Margin, Increased can be discussed with this completely editable template. It is available for immediate download depending on the needs and requirements of the user.
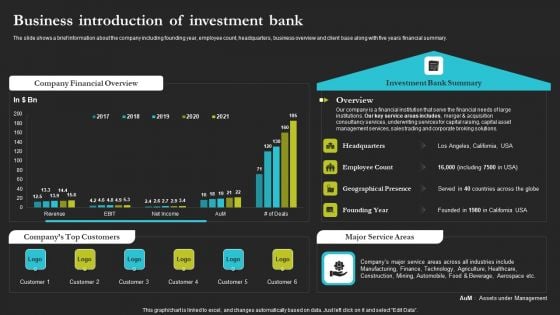
Sell Side Merger And Acquisition Business Introduction Of Investment Bank Diagrams PDF
The slide shows a brief information about the company including founding year, employee count, headquarters, business overview and client base along with five years financial summary. Deliver an awe inspiring pitch with this creative Sell Side Merger And Acquisition Business Introduction Of Investment Bank Diagrams PDF bundle. Topics like Company Financial Overview, Companys Top Customers, Major Service Areas can be discussed with this completely editable template. It is available for immediate download depending on the needs and requirements of the user.
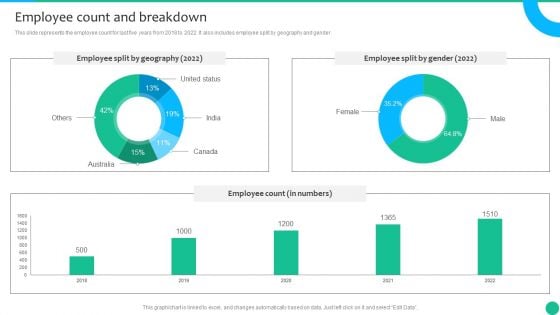
Strategic Management Consultancy Business Profile Employee Count And Breakdown Diagrams PDF
This slide represents the employee count for last five years from 2018 to 2022. It also includes employee split by geography and gender. Deliver an awe inspiring pitch with this creative Strategic Management Consultancy Business Profile Employee Count And Breakdown Diagrams PDF bundle. Topics like Employee Split By Gender, Employee Split By Geography, Employee Count can be discussed with this completely editable template. It is available for immediate download depending on the needs and requirements of the user.
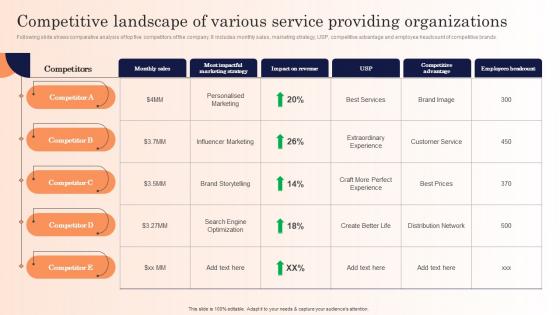
Competitive Landscape Of Various Service Providing Strategic Marketing Campaign Diagrams Pdf
Following slide shows comparative analysis of top five competitors of the company. It includes monthly sales, marketing strategy, USP, competitive advantage and employee headcount of competitive brands.Find highly impressive Competitive Landscape Of Various Service Providing Strategic Marketing Campaign Diagrams Pdf on Slidegeeks to deliver a meaningful presentation. You can save an ample amount of time using these presentation templates. No need to worry to prepare everything from scratch because Slidegeeks experts have already done a huge research and work for you. You need to download Competitive Landscape Of Various Service Providing Strategic Marketing Campaign Diagrams Pdf for your upcoming presentation. All the presentation templates are 100Precent editable and you can change the color and personalize the content accordingly. Download now. Following slide shows comparative analysis of top five competitors of the company. It includes monthly sales, marketing strategy, USP, competitive advantage and employee headcount of competitive brands.
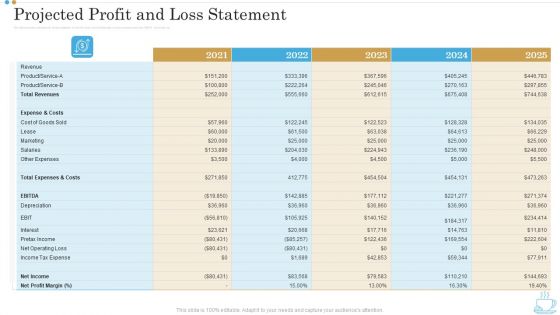
Projected Profit And Loss Statement Business Plan For Opening A Coffeehouse Ppt Diagrams PDF
This slide shows the projected profit and loss statement for next five years which includes total revenue, expenses and costs, EBITDA, net income, etc. Deliver an awe inspiring pitch with this creative projected profit and loss statement business plan for opening a coffeehouse ppt diagrams pdf bundle. Topics like revenues, depreciation, service, marketing, costs can be discussed with this completely editable template. It is available for immediate download depending on the needs and requirements of the user.
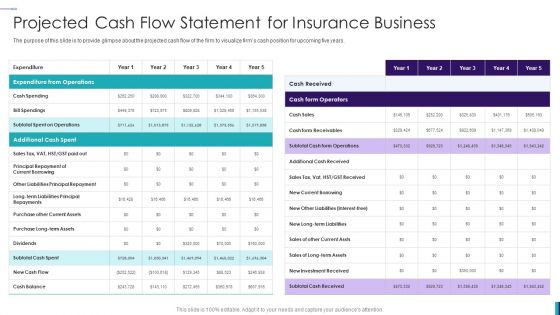
Establishing Insurance Company Projected Cash Flow Statement For Insurance Business Diagrams PDF
The purpose of this slide is to provide glimpse about the projected cash flow of the firm to visualize firms cash position for upcoming five years. Deliver and pitch your topic in the best possible manner with this Establishing Insurance Company Projected Cash Flow Statement For Insurance Business Diagrams PDF. Use them to share invaluable insights on Additional Cash Spent, Cash Spending, Cash Received and impress your audience. This template can be altered and modified as per your expectations. So, grab it now.
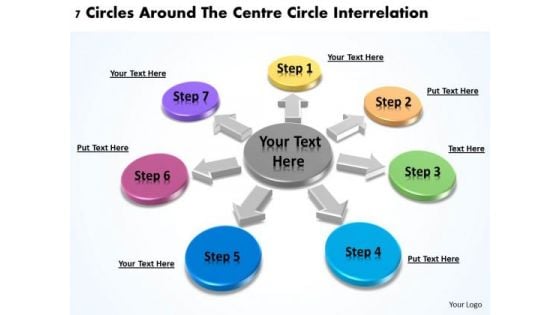
Business Model Diagrams 7 Circles Around The Centre Interrelation PowerPoint Slides
We present our business model diagrams 7 circles around the centre interrelation PowerPoint Slides.Present our Advertising PowerPoint Templates because Our PowerPoint Templates and Slides will weave a web of your great ideas. They are gauranteed to attract even the most critical of your colleagues. Present our Circle Charts PowerPoint Templates because It will let you Set new benchmarks with our PowerPoint Templates and Slides. They will keep your prospects well above par. Use our Business PowerPoint Templates because Our PowerPoint Templates and Slides will provide you a launch platform. Give a lift off to your ideas and send them into orbit. Use our Shapes PowerPoint Templates because You can Create a matrix with our PowerPoint Templates and Slides. Feel the strength of your ideas click into place. Present our Arrows PowerPoint Templates because You are an avid believer in ethical practices. Highlight the benefits that accrue with our PowerPoint Templates and Slides.Use these PowerPoint slides for presentations relating to Abstract, Arrow, Brochure, Business, Businessman, Button, Chart, Circle, Company, Cyclic, Data, Demonstration, Diagram, Economic, Financial, Five, Glossy, Goal, Graph, Illustration, Info, Information, Investment, Man, Manage, Marketing, Model, Navigation, Option, Part, People, Person, Pie, Presentation, Process, Result, Section, Segmented, Sharing, Silhouette, Sphere, Statistics, Stock, Strategy, Template, Variation, Vector, Wheel. The prominent colors used in the PowerPoint template are Orange, Green, Blue. Feature your views with our Business Model Diagrams 7 Circles Around The Centre Interrelation PowerPoint Slides. They will get the desired exposure.
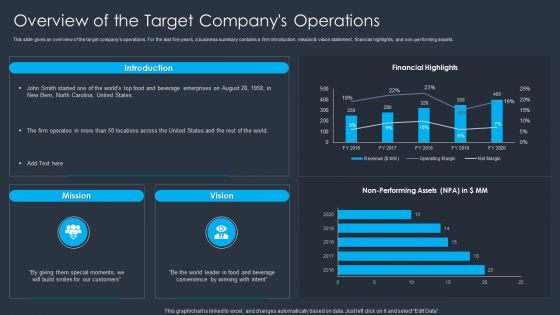
Merger And Acquisition Buying Strategy For Business Growth Overview Of The Target Companys Operations Diagrams PDF
This slide gives an overview of the target companys operations. For the last five years, a business summary contains a firm introduction, mission and vision statement, financial highlights, and non performing assets. Deliver and pitch your topic in the best possible manner with this Merger And Acquisition Buying Strategy For Business Growth Overview Of The Target Companys Operations Diagrams PDF. Use them to share invaluable insights on Customers, Financial Highlights, Enterprises and impress your audience. This template can be altered and modified as per your expectations. So, grab it now.
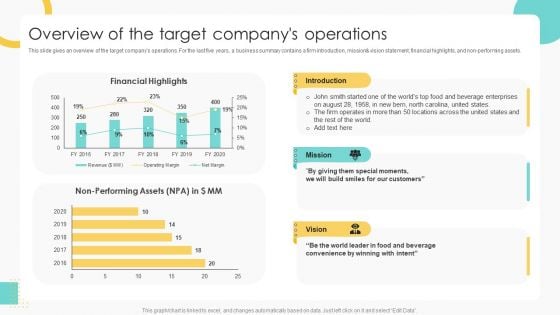
Buy Side Merger And Acquisition Pitch Book Overview Of The Target Companys Operations Diagrams PDF
This slide gives an overview of the target companys operations. For the last five years, a business summary contains a firm introduction, mission and vision statement, financial highlights, and non performing assets. Deliver and pitch your topic in the best possible manner with this Buy Side Merger And Acquisition Pitch Book Overview Of The Target Companys Operations Diagrams PDF. Use them to share invaluable insights on Financial Highlights, Enterprises, Customers and impress your audience. This template can be altered and modified as per your expectations. So, grab it now.
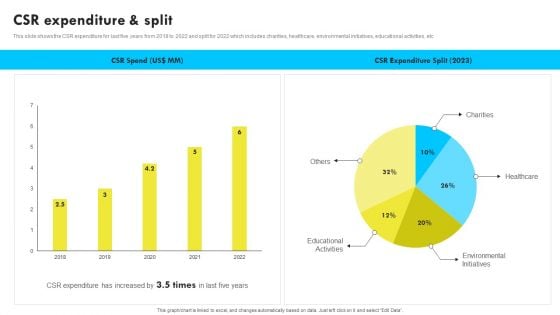
CSR Expenditure And Split Web Design And Development Company Profile Diagrams PDF
This slide shows the CSR expenditure for last five years from 2018 to 2022 and split for 2022 which includes charities, healthcare, environmental initiatives, educational activities, etc Do you have to make sure that everyone on your team knows about any specific topic I yes, then you should give CSR Expenditure And Split Web Design And Development Company Profile Diagrams PDF a try. Our experts have put a lot of knowledge and effort into creating this impeccable CSR Expenditure And Split Web Design And Development Company Profile Diagrams PDF. You can use this template for your upcoming presentations, as the slides are perfect to represent even the tiniest detail. You can download these templates from the Slidegeeks website and these are easy to edit. So grab these today.
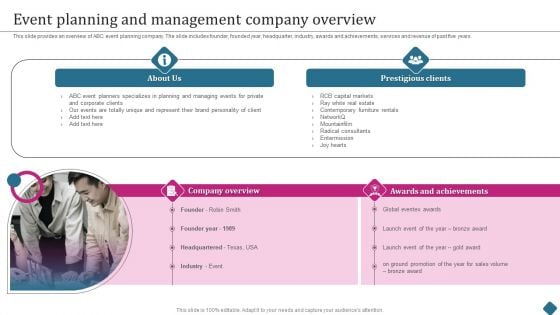
Smart Phone Launch Event Management Tasks Event Planning And Management Company Overview Diagrams PDF
This slide provides an overview of ABC event planning company. The slide includes founder, founded year, headquarter, industry, awards and achievements, services and revenue of past five years. Do you have to make sure that everyone on your team knows about any specific topic I yes, then you should give Smart Phone Launch Event Management Tasks Event Planning And Management Company Overview Diagrams PDF a try. Our experts have put a lot of knowledge and effort into creating this impeccable Smart Phone Launch Event Management Tasks Event Planning And Management Company Overview Diagrams PDF. You can use this template for your upcoming presentations, as the slides are perfect to represent even the tiniest detail. You can download these templates from the Slidegeeks website and these are easy to edit. So grab these today.
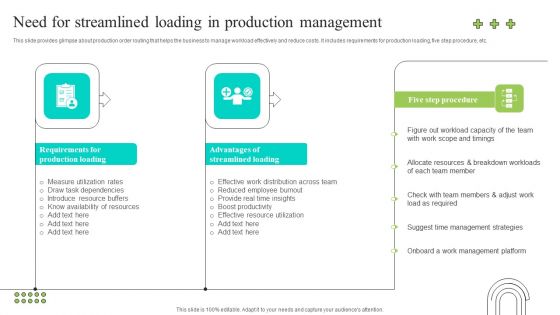
Effective Production Planning And Monitoring Techniques Need For Streamlined Loading In Production Diagrams PDF
This slide provides glimpse about production order routing that helps the business to manage workload effectively and reduce costs. It includes requirements for production loading, five step procedure, etc. Do you have to make sure that everyone on your team knows about any specific topic I yes, then you should give Effective Production Planning And Monitoring Techniques Need For Streamlined Loading In Production Diagrams PDF a try. Our experts have put a lot of knowledge and effort into creating this impeccable Effective Production Planning And Monitoring Techniques Need For Streamlined Loading In Production Diagrams PDF. You can use this template for your upcoming presentations, as the slides are perfect to represent even the tiniest detail. You can download these templates from the Slidegeeks website and these are easy to edit. So grab these today.
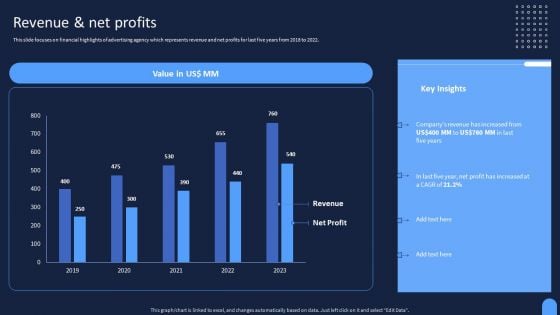
Ad And Media Agency Company Profile Revenue And Net Profits Diagrams PDF
This slide focuses on financial highlights of advertising agency which represents revenue and net profits for last five years from 2018 to 2022. Welcome to our selection of the Ad And Media Agency Company Profile Revenue And Net Profits Diagrams PDF. These are designed to help you showcase your creativity and bring your sphere to life. Planning and Innovation are essential for any business that is just starting out. This collection contains the designs that you need for your everyday presentations. All of our PowerPoints are 100 percent editable, so you can customize them to suit your needs. This multi-purpose template can be used in various situations. Grab these presentation templates today.
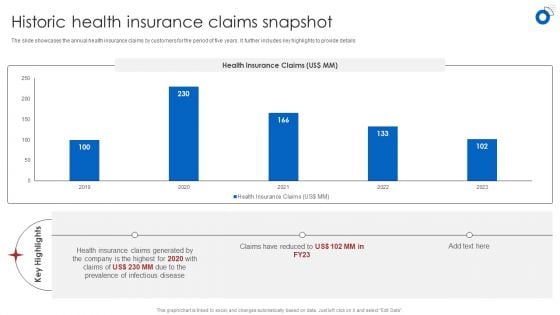
Insurance Business Financial Analysis Historic Health Insurance Claims Snapshot Diagrams PDF
The slide showcases the annual health insurance claims by customers for the period of five years. It further includes key highlights to provide details Boost your pitch with our creative Insurance Business Financial Analysis Historic Health Insurance Claims Snapshot Diagrams PDF. Deliver an awe-inspiring pitch that will mesmerize everyone. Using these presentation templates you will surely catch everyones attention. You can browse the ppts collection on our website. We have researchers who are experts at creating the right content for the templates. So you dont have to invest time in any additional work. Just grab the template now and use them.
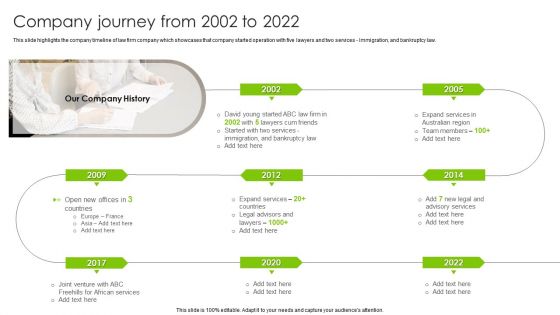
International Legal And Business Services Company Profile Company Journey From 2002 To 2022 Diagrams PDF
This slide highlights the company timeline of law firm company which showcases that company started operation with five lawyers and two services Immigration, and bankruptcy law. This is a International Legal And Business Services Company Profile Company Journey From 2002 To 2022 Diagrams PDF template with various stages. Focus and dispense information on eight stages using this creative set, that comes with editable features. It contains large content boxes to add your information on topics like Services, Team Members, Immigration. You can also showcase facts, figures, and other relevant content using this PPT layout. Grab it now.
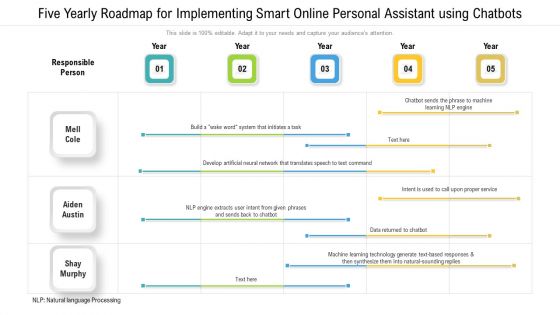
Five Yearly Roadmap For Implementing Smart Online Personal Assistant Using Chatbots Diagrams
Presenting the 3 months project future vision viability and mission roadmap formats. The template includes a roadmap that can be used to initiate a strategic plan. Not only this, the PowerPoint slideshow is completely editable and you can effortlessly modify the font size, font type, and shapes according to your needs. This PPT slide can be easily reached in standard screen and widescreen aspect ratios. The set is also available in various formats like PDF, PNG, and JPG. So download and use it multiple times as per your knowledge.
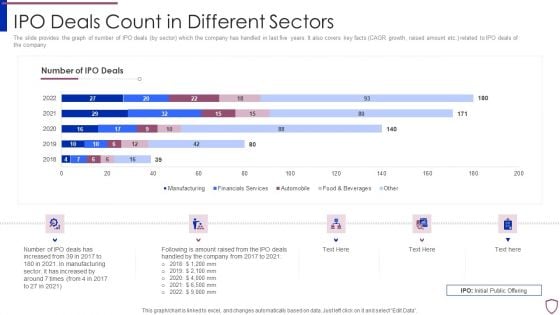
Financing Catalogue For Security Underwriting Agreement IPO Deals Count In Different Sectors Diagrams PDF
The slide provides the graph of number of IPO deals by sector which the company has handled in last five years. It also covers key facts CAGR growth, raised amount etc. related to IPO deals of the company. Deliver an awe inspiring pitch with this creative financing catalogue for security underwriting agreement ipo deals count in different sectors diagrams pdf bundle. Topics like manufacturing, financial services, automobile, food and beverages can be discussed with this completely editable template. It is available for immediate download depending on the needs and requirements of the user.
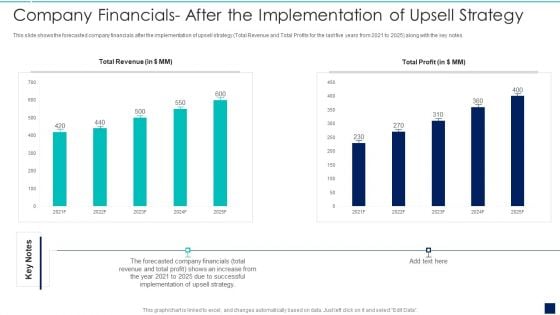
Influence Buyers To Purchase Additional High Company Financials After The Implementation Diagrams PDF
This slide shows the forecasted company financials after the implementation of upsell strategy total Revenue and Total Profits for the last five years from 2021 to 2025 along with the key notes.Deliver an awe inspiring pitch with this creative Influence Buyers To Purchase Additional High Company Financials After The Implementation Diagrams PDF bundle. Topics like Company Financials After The Implementation Of Upsell Strategy can be discussed with this completely editable template. It is available for immediate download depending on the needs and requirements of the user.
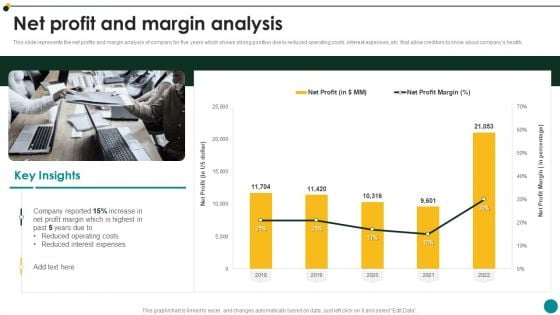
IT Services And Consulting Company Profile Net Profit And Margin Analysis Diagrams PDF
This slide represents the net profits and margin analysis of company for five years which shows strong position due to reduced operating costs, interest expenses, etc. that allow creditors to know about companys health.Deliver an awe inspiring pitch with this creative IT Services And Consulting Company Profile Net Profit And Margin Analysis Diagrams PDF bundle. Topics like Reduced Expenses, Reduced Operating Costs, Profit Highest can be discussed with this completely editable template. It is available for immediate download depending on the needs and requirements of the user.
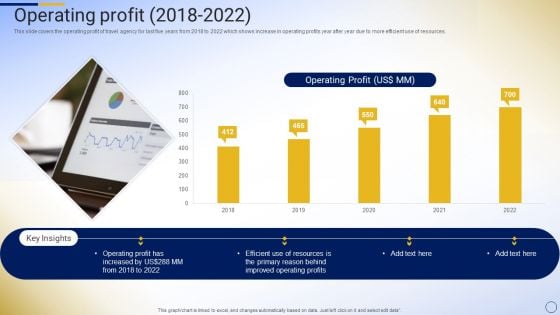
Online Tour And Travel Company Profile Operating Profit 2018 To 2022 Diagrams PDF
This slide covers the operating profit of travel agency for last five years from 2018 to 2022 which shows increase in operating profits year after year due to more efficient use of resources.Deliver and pitch your topic in the best possible manner with this Online Tour And Travel Company Profile Operating Profit 2018 To 2022 Diagrams PDF. Use them to share invaluable insights on Operating Profit, Improved Operating, Primary Reason and impress your audience. This template can be altered and modified as per your expectations. So, grab it now.
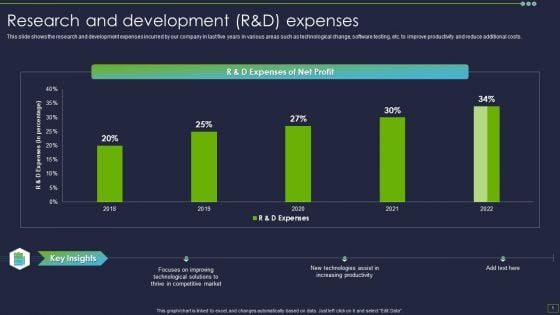
IT Consultancy Services Company Profile Research And Development Randd Expenses Diagrams PDF
This slide shows the research and development expenses incurred by our company in last five years in various areas such as technological change, software testing, etc. to improve productivity and reduce additional costs.Deliver an awe inspiring pitch with this creative IT Consultancy Services Company Profile Research And Development Randd Expenses Diagrams PDF bundle. Topics like Focuses Improving, Technological Solutions, Competitive Market can be discussed with this completely editable template. It is available for immediate download depending on the needs and requirements of the user.
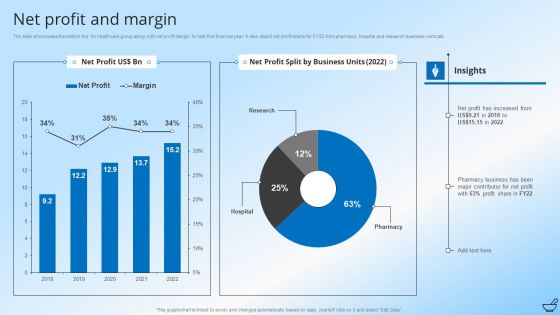
Pharmaceutical And Clinical Research Summary Net Profit And Margin Diagrams PDF
The slide showcases the bottom line for healthcare group along with net profit margin for last five financial year. It also depict net profit share for FY22 from pharmacy, hospital and research business verticals. Deliver an awe inspiring pitch with this creative Pharmaceutical And Clinical Research Summary Net Profit And Margin Diagrams PDF bundle. Topics like Pharmacy Business, Profit Share, Business Units can be discussed with this completely editable template. It is available for immediate download depending on the needs and requirements of the user.
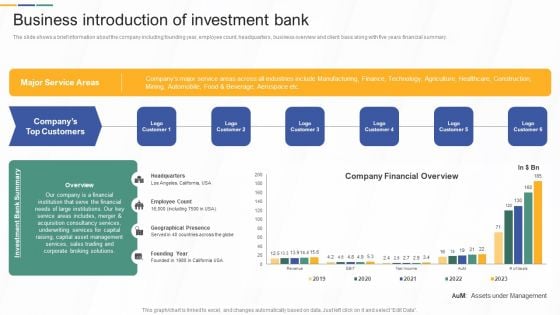
Business Introduction Of Investment Bank Investment Banking And Deal Pitchbook Diagrams PDF
The slide shows a brief information about the company including founding year, employee count, headquarters, business overview and client base along with five years financial summary. If your project calls for a presentation, then Slidegeeks is your go-to partner because we have professionally designed, easy-to-edit templates that are perfect for any presentation. After downloading, you can easily edit Business Introduction Of Investment Bank Investment Banking And Deal Pitchbook Diagrams PDF and make the changes accordingly. You can rearrange slides or fill them with different images. Check out all the handy templates.
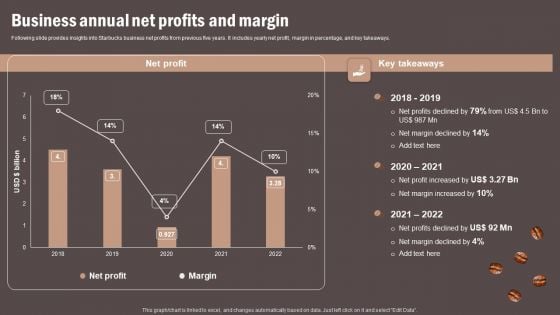
Coffee Cafe Company Profile Business Annual Net Profits And Margin Diagrams PDF
Following slide provides insights into Starbucks business net profits from previous five years. It includes yearly net profit, margin in percentage, and key takeaways. Want to ace your presentation in front of a live audience Our Coffee Cafe Company Profile Business Annual Net Profits And Margin Diagrams PDF can help you do that by engaging all the users towards you. Slidegeeks experts have put their efforts and expertise into creating these impeccable powerpoint presentations so that you can communicate your ideas clearly. Moreover, all the templates are customizable, and easy to edit and downloadable. Use these for both personal and commercial use.
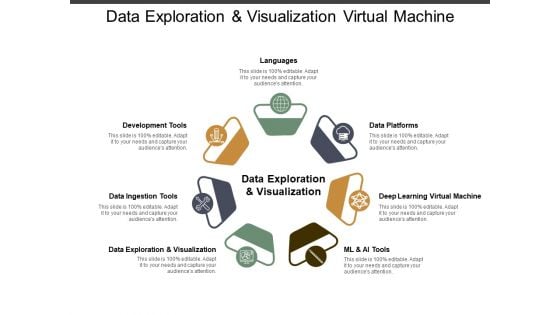
Data Exploration And Visualization Virtual Machine Ppt PowerPoint Presentation Infographics Diagrams
This is a data exploration and visualization virtual machine ppt powerpoint presentation infographics diagrams. This is a seven stage process. The stages in this process are data, analysis, data science, information science.
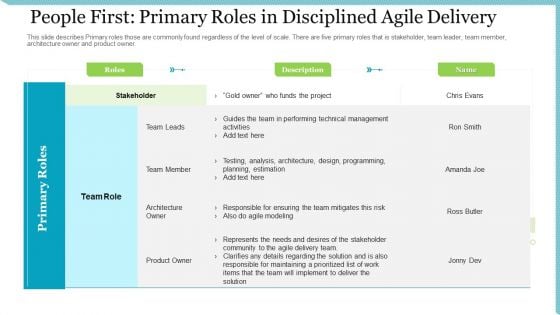
Agile Delivery Methodology For IT Project People First Primary Roles In Disciplined Agile Delivery Diagrams PDF
This slide describes Primary roles those are commonly found regardless of the level of scale. There are five primary roles that is stakeholder, team leader, team member, architecture owner and product owner. Deliver and pitch your topic in the best possible manner with this agile delivery methodology for IT project people first primary roles in disciplined agile delivery diagrams pdf. Use them to share invaluable insights on testing, analysis, architecture, design programming, planning estimation, responsible for ensuring the team mitigates this risk and impress your audience. This template can be altered and modified as per your expectations. So, grab it now.
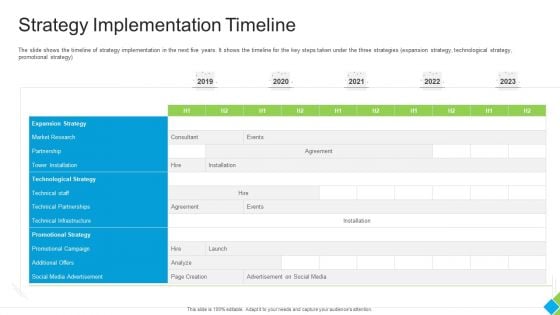
Diminishing Market Share Of A Telecommunication Firm Case Competition Strategy Implementation Timeline Diagrams PDF
The slide shows the timeline of strategy implementation in the next five years. It shows the timeline for the key steps taken under the three strategies expansion strategy, technological strategy, promotional strategy. Deliver an awe inspiring pitch with this creative diminishing market share of a telecommunication firm case competition strategy implementation timeline diagrams pdf bundle. Topics like expansion strategy, market research, technological strategy, technical partnerships, promotional strategy, social media advertisement can be discussed with this completely editable template. It is available for immediate download depending on the needs and requirements of the user.
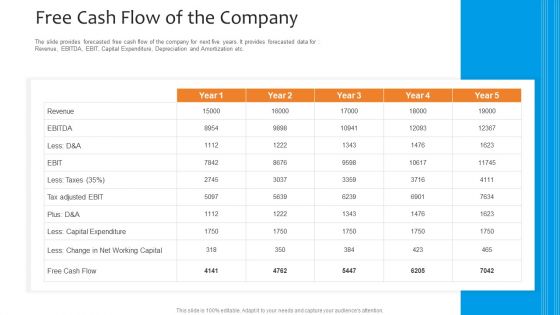
Funding Pitch To Raise Funds From PE Free Cash Flow Of The Company Diagrams PDF
The slide provides forecasted free cash flow of the company for next five years. It provides forecasted data for Revenue, EBITDA, EBIT, Capital Expenditure, Depreciation and Amortization etc. Deliver and pitch your topic in the best possible manner with this funding pitch to raise funds from pe free cash flow of the company diagrams pdf. Use them to share invaluable insights on capital expenditure, revenue, change in net working capital, cash flow and impress your audience. This template can be altered and modified as per your expectations. So, grab it now.
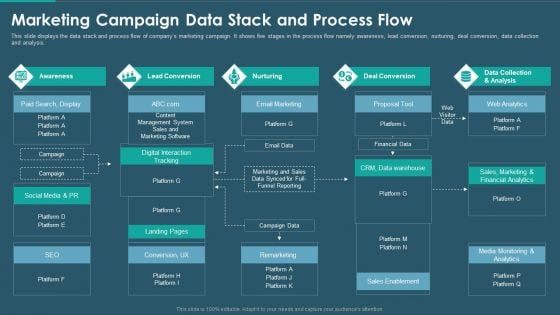
Sales And Promotion Playbook Marketing Campaign Data Stack And Process Flow Diagrams PDF
This slide displays the data stack and process flow of companys marketing campaign. It shows five stages in the process flow namely awareness, lead conversion, nurturing, deal conversion, data collection and analysis. Deliver and pitch your topic in the best possible manner with this sales and promotion playbook marketing campaign data stack and process flow diagrams pdf. Use them to share invaluable insights on deal conversion, data collection, lead conversion, awareness and impress your audience. This template can be altered and modified as per your expectations. So, grab it now.
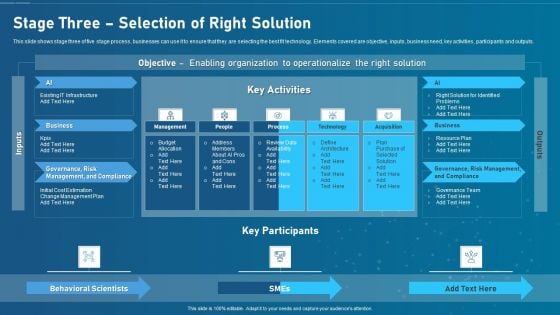
Artificial Intelligence Transformation Playbook Stage Three Selection Of Right Solution Diagrams PDF
This slide shows stage three of five stage process, businesses can use it to ensure that they are selecting the best fit technology. Elements covered are objective, inputs, business need, key activities, participants and outputs. Presenting artificial intelligence transformation playbook stage three selection of right solution diagrams pdf to provide visual cues and insights. Share and navigate important information on three stages that need your due attention. This template can be used to pitch topics like behavioral scientists, smes. In addtion, this PPT design contains high resolution images, graphics, etc, that are easily editable and available for immediate download.
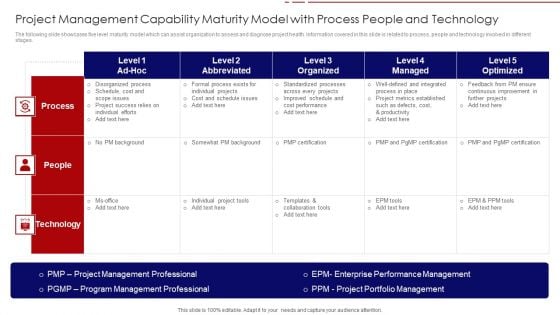
Project Management Capability Maturity Model With Process People And Technology Diagrams PDF
The following slide showcases five level maturity model which can assist organization to assess and diagnose project health. Information covered in this slide is related to process, people and technology involved in different stages. Pitch your topic with ease and precision using this project management capability maturity model with process people and technology diagrams pdf. This layout presents information on process, technology, people, project management professional. It is also available for immediate download and adjustment. So, changes can be made in the color, design, graphics or any other component to create a unique layout.
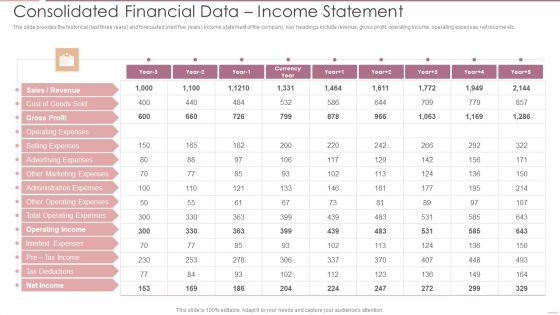
Investment Banking Security Underwriting Pitchbook Consolidated Financial Data Income Statement Diagrams PDF
The slide provides the historical last three years and forecasted next five years income statement of the company. Key headings include revenue, gross profit, operating income, operating expenses, net income etc.Deliver and pitch your topic in the best possible manner with this Investment Banking Security Underwriting Pitchbook Consolidated Financial Data Income Statement Diagrams PDF Use them to share invaluable insights on Gross Profit, Operating Expenses, Advertising Expenses and impress your audience. This template can be altered and modified as per your expectations. So, grab it now.
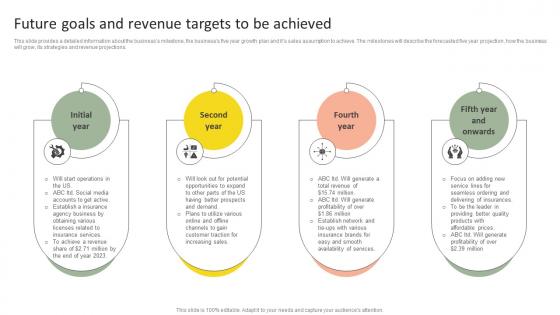
Future Goals And Revenue Insurance Agency Startup Business Plan Go To Market Strategy Diagrams Pdf
This slide provides a detailed information about the businesss milestone, the businesss five year growth plan and its sales assumption to achieve. The milestones will describe the forecasted five year projection, how the business will grow, its strategies and revenue projections. There are so many reasons you need a Future Goals And Revenue Insurance Agency Startup Business Plan Go To Market Strategy Diagrams Pdf. The first reason is you can not spend time making everything from scratch, Thus, Slidegeeks has made presentation templates for you too. You can easily download these templates from our website easily. This slide provides a detailed information about the businesss milestone, the businesss five year growth plan and its sales assumption to achieve. The milestones will describe the forecasted five year projection, how the business will grow, its strategies and revenue projections.
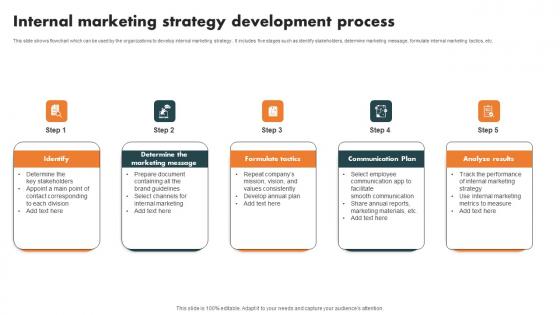
Internal Marketing Strategy Development Internal Branding Strategy Enhanced Advocacy Diagrams Pdf
This slide shows flowchart which can be used by the organizations to develop internal marketing strategy. It includes five stages such as identify stakeholders, determine marketing message, formulate internal marketing tactics, etc. Formulating a presentation can take up a lot of effort and time, so the content and message should always be the primary focus. The visuals of the PowerPoint can enhance the presenters message, so our Internal Marketing Strategy Development Internal Branding Strategy Enhanced Advocacy Diagrams Pdf was created to help save time. Instead of worrying about the design, the presenter can concentrate on the message while our designers work on creating the ideal templates for whatever situation is needed. Slidegeeks has experts for everything from amazing designs to valuable content, we have put everything into Internal Marketing Strategy Development Internal Branding Strategy Enhanced Advocacy Diagrams Pdf This slide shows flowchart which can be used by the organizations to develop internal marketing strategy. It includes five stages such as identify stakeholders, determine marketing message, formulate internal marketing tactics, etc.
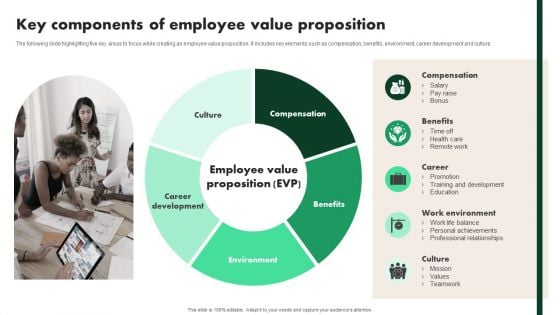
Creating Employee Value Proposition Key Components Of Employee Value Proposition Diagrams PDF
The following slide highlighting five key areas to focus while creating an employee value proposition. It includes key elements such as compensation, benefits, environment, career development and culture. Retrieve professionally designed Creating Employee Value Proposition Key Components Of Employee Value Proposition Diagrams PDF to effectively convey your message and captivate your listeners. Save time by selecting pre-made slideshows that are appropriate for various topics, from business to educational purposes. These themes come in many different styles, from creative to corporate, and all of them are easily adjustable and can be edited quickly. Access them as PowerPoint templates or as Google Slides themes. You dont have to go on a hunt for the perfect presentation because Slidegeeks got you covered from everywhere.
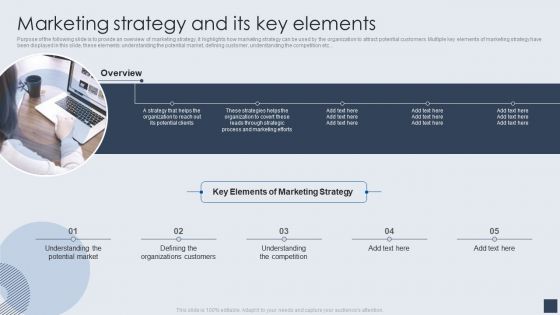
Implementing Marketing Mix Strategy To Enhance Overall Performance Marketing Strategy And Its Key Elements Diagrams PDF
Purpose of the following slide is to provide an overview of marketing strategy, it highlights how marketing strategy can be used by the organization to attract potential customers. Multiple key elements of marketing strategy have been displayed in this slide, these elements understanding the potential market, defining customer, understanding the competition etc. This is a Implementing Marketing Mix Strategy To Enhance Overall Performance Marketing Strategy And Its Key Elements Diagrams PDF template with various stages. Focus and dispense information on five stages using this creative set, that comes with editable features. It contains large content boxes to add your information on topics like Key Elements, Marketing Strategy, Organizations Customers. You can also showcase facts, figures, and other relevant content using this PPT layout. Grab it now.
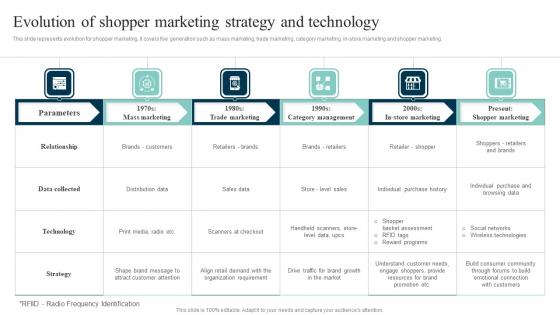
Evolution Of Shopper Marketing Out Of The Box Shopper Marketing Strategies Diagrams Pdf
This slide represents evolution for shopper marketing. It covers five generation such as mass marketing, trade marketing, category marketing, in store marketing and shopper marketing. Slidegeeks is here to make your presentations a breeze with Evolution Of Shopper Marketing Out Of The Box Shopper Marketing Strategies Diagrams Pdf With our easy to use and customizable templates, you can focus on delivering your ideas rather than worrying about formatting. With a variety of designs to choose from, you are sure to find one that suits your needs. And with animations and unique photos, illustrations, and fonts, you can make your presentation pop. So whether you are giving a sales pitch or presenting to the board, make sure to check out Slidegeeks first. This slide represents evolution for shopper marketing. It covers five generation such as mass marketing, trade marketing, category marketing, in store marketing and shopper marketing.
Metrics For Tracking Effectiveness Of Safety Measures In The Organization Ppt PowerPoint Presentation File Diagrams PDF
The following slide showcases five safety metrics to monitor the effectiveness of current safety measures. Key KPIs inluded here are reported incidents, accident free days, cases of near misses, audit acore, BBS score etc. Want to ace your presentation in front of a live audience Our Metrics For Tracking Effectiveness Of Safety Measures In The Organization Ppt PowerPoint Presentation File Diagrams PDF can help you do that by engaging all the users towards you. Slidegeeks experts have put their efforts and expertise into creating these impeccable powerpoint presentations so that you can communicate your ideas clearly. Moreover, all the templates are customizable, and easy to edit and downloadable. Use these for both personal and commercial use.

Regenerative Artificial Intelligence Systems Impact Of Chatgpt On Artificial Intelligence Tokens Diagrams PDF
This slide depicts the change in the prices of five artificial intelligence tokens after the launch of OpenAIs ChatGPT model. These artificial intelligence tokens are DeepBrain Chain, Numeraire, Fetch.ai, SingularityNET, and Alethea Artificial Liquid Intelligence. Coming up with a presentation necessitates that the majority of the effort goes into the content and the message you intend to convey. The visuals of a PowerPoint presentation can only be effective if it supplements and supports the story that is being told. Keeping this in mind our experts created Regenerative Artificial Intelligence Systems Impact Of Chatgpt On Artificial Intelligence Tokens Diagrams PDF to reduce the time that goes into designing the presentation. This way, you can concentrate on the message while our designers take care of providing you with the right template for the situation.
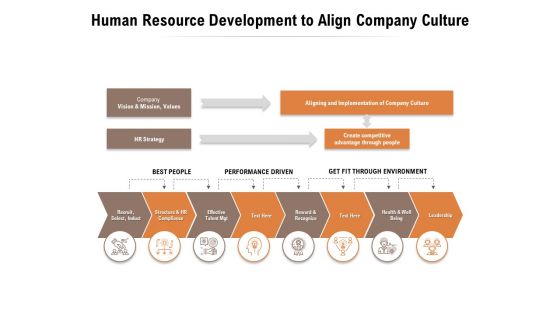
Human Resource Development To Align Company Culture Ppt PowerPoint Presentation Infographic Template Diagrams
Presenting this set of slides with name human resource development to align company culture ppt powerpoint presentation infographic template diagrams. This is a eight stage process. The stages in this process are company vision, mission, values, hr strategy, performance driven, recruit, induct, structure, hr compliance, effective talent mgt, leadership. This is a completely editable PowerPoint presentation and is available for immediate download. Download now and impress your audience.
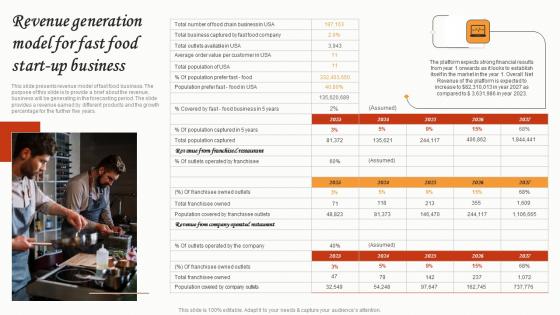
Revenue Generation Model For Fast Food Start Up Business Small Restaurant Business Diagrams Pdf
This slide presents revenue model of fast food business. The purpose of this slide is to provide a brief about the revenue, business will be generating in the forecasting period. The slide provides a revenue earned by different products and the growth percentage for the further five years. Present like a pro with Revenue Generation Model For Fast Food Start Up Business Small Restaurant Business Diagrams Pdf Create beautiful presentations together with your team, using our easy-to-use presentation slides. Share your ideas in real-time and make changes on the fly by downloading our templates. So whether you are in the office, on the go, or in a remote location, you can stay in sync with your team and present your ideas with confidence. With Slidegeeks presentation got a whole lot easier. Grab these presentations today. This slide presents revenue model of fast food business. The purpose of this slide is to provide a brief about the revenue, business will be generating in the forecasting period. The slide provides a revenue earned by different products and the growth percentage for the further five years.
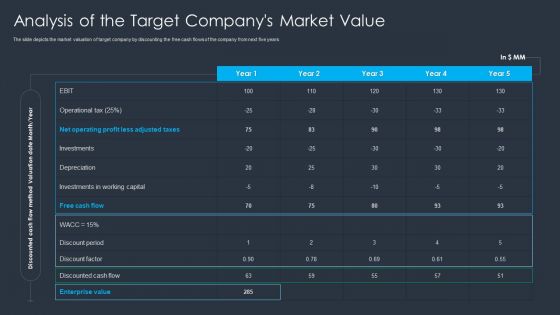
Merger And Acquisition Buying Strategy For Business Growth Analysis Of The Target Companys Market Value Diagrams PDF
The slide depicts the market valuation of target company by discounting the free cash flows of the company from next five years. Deliver and pitch your topic in the best possible manner with this Merger And Acquisition Buying Strategy For Business Growth Analysis Of The Target Companys Market Value Diagrams PDF. Use them to share invaluable insights on Investments, Discounted Cash Flow, Operational Tax and impress your audience. This template can be altered and modified as per your expectations. So, grab it now.


 Continue with Email

 Home
Home


