Action Plan Infographic
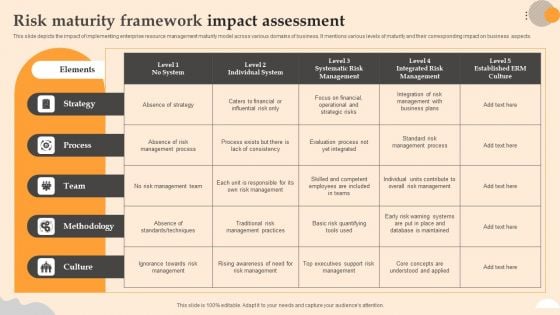
Risk Maturity Framework Impact Assessment Infographics PDF
This slide depicts the impact of implementing enterprise resource management maturity model across various domains of business. It mentions various levels of maturity and their corresponding impact on business aspects. Showcasing this set of slides titled Risk Maturity Framework Impact Assessment Infographics PDF. The topics addressed in these templates are Methodology, Team, Strategy. All the content presented in this PPT design is completely editable. Download it and make adjustments in color, background, font etc. as per your unique business setting.
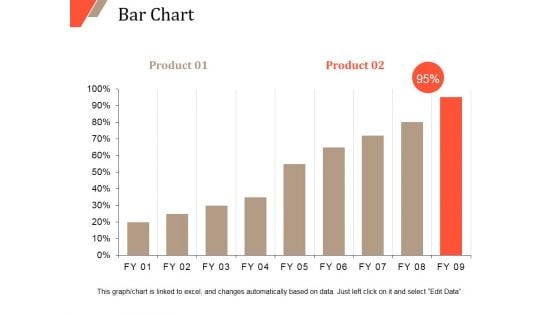
Bar Chart Ppt PowerPoint Presentation Outline Infographics
This is a bar chart ppt powerpoint presentation outline infographics. This is a two stage process. The stages in this process are bar chart, finance, marketing, strategy, analysis, business.
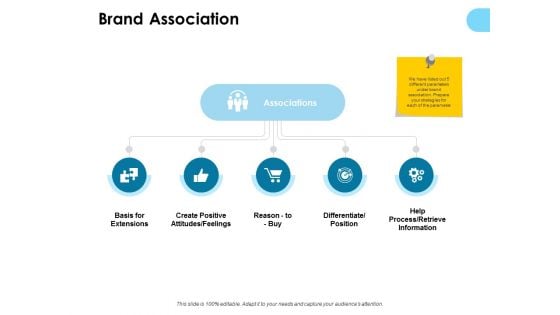
Brand Association Ppt PowerPoint Presentation Gallery Infographics
Presenting this set of slides with name brand association ppt powerpoint presentation gallery infographics. This is a five stage process. The stages in this process are business, management, planning, strategy, marketing. This is a completely editable PowerPoint presentation and is available for immediate download. Download now and impress your audience.
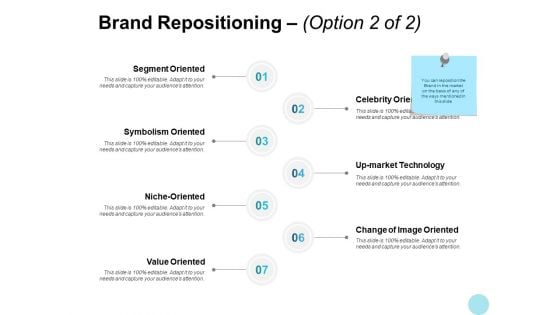
Brand Repositioning Symbolism Ppt PowerPoint Presentation Infographics
Presenting this set of slides with name brand repositioning symbolism ppt powerpoint presentation infographics. This is a seven stage process. The stages in this process are marketing, business, management, planning, strategy. This is a completely editable PowerPoint presentation and is available for immediate download. Download now and impress your audience.
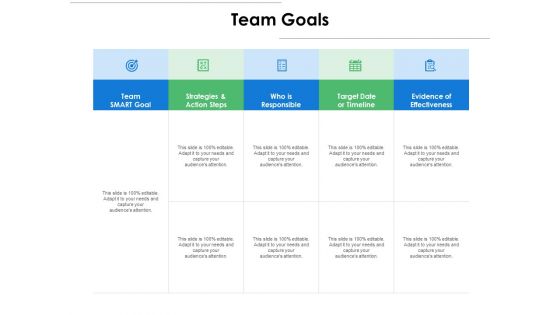
Team Goals Ppt PowerPoint Presentation Infographics Mockup
Presenting this set of slides with name team goals ppt powerpoint presentation infographics mockup. The topics discussed in these slides are strategies, responsible, target, evidence, effectiveness. This is a completely editable PowerPoint presentation and is available for immediate download. Download now and impress your audience.
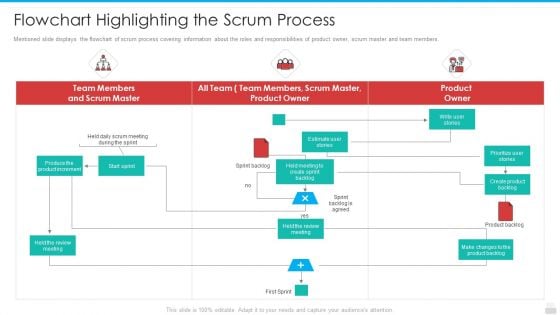
Flowchart Highlighting The Scrum Process Infographics PDF
Mentioned slide displays the flowchart of scrum process covering information about the roles and responsibilities of product owner, scrum master and team members.Presenting flowchart highlighting the scrum process infographics pdf to provide visual cues and insights. Share and navigate important information on three stages that need your due attention. This template can be used to pitch topics like estimate user stories, write user stories, prioritize user stories. In addtion, this PPT design contains high resolution images, graphics, etc, that are easily editable and available for immediate download.
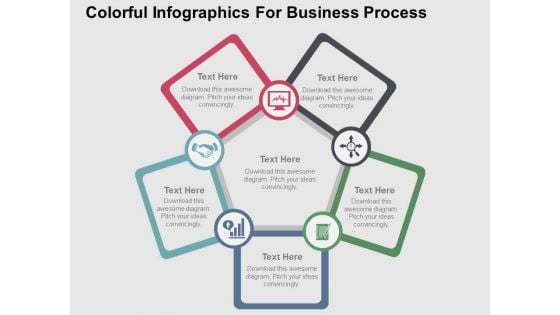
Colorful Infographics For Business Process Powerpoint Templates
Our professionally designed business diagram is as an effective tool for communicating ideas and planning. It contains circular graphics for project task and resources. Convey your views with this diagram slide. It will amplify the strength of your logic.
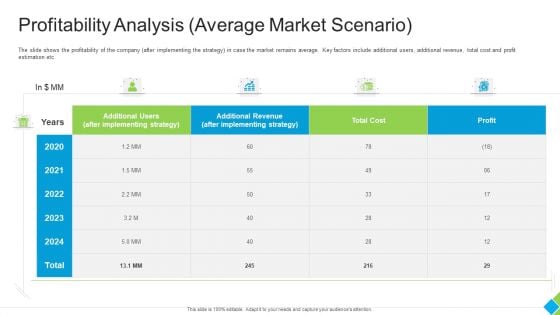
Profitability Analysis Average Market Scenario Infographics PDF
The slide shows the profitability of the company after implementing the strategy in case the market remains average. Key factors include additional users, additional revenue, total cost and profit estimation etc. Deliver an awe inspiring pitch with this creative profitability analysis average market scenario infographics pdf bundle. Topics like additional users after implementing strategy, additional revenue after implementing strategy, total cost, profit can be discussed with this completely editable template. It is available for immediate download depending on the needs and requirements of the user.
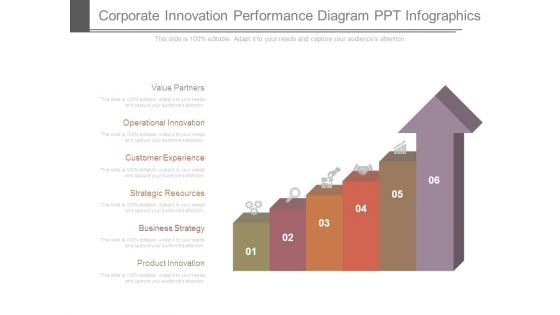
Corporate Innovation Performance Diagram Ppt Infographics
This is a corporate innovation performance diagram ppt infographics. This is a six stage process. The stages in this process are value partners, operational innovation, customer experience, strategic resources, business strategy, product innovation.
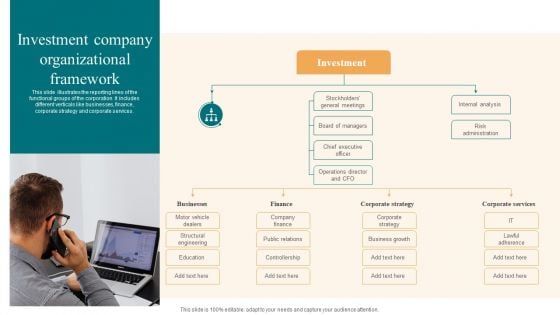
Investment Company Organizational Framework Infographics PDF
This slide illustrates the reporting lines of the functional groups of the corporation. It includes different verticals like businesses, finance, corporate strategy and corporate services. Presenting Investment Company Organizational Framework Infographics PDF to dispense important information. This template comprises one stages. It also presents valuable insights into the topics including Company Finance, Corporate Strategy, Business Growth. This is a completely customizable PowerPoint theme that can be put to use immediately. So, download it and address the topic impactfully.
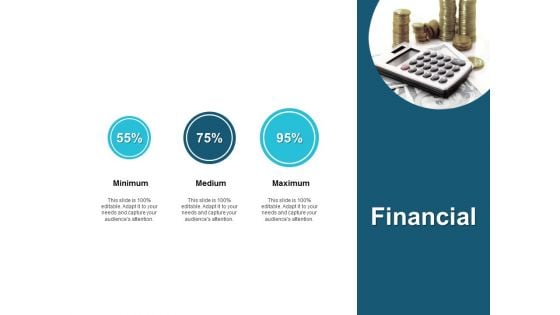
Financial Maximum Ppt PowerPoint Presentation Infographics Influencers
Presenting this set of slides with name financial maximum ppt powerpoint presentation infographics influencers. This is a three stage process. The stages in this process are financial, minimum, maximum, marketing, strategy. This is a completely editable PowerPoint presentation and is available for immediate download. Download now and impress your audience.
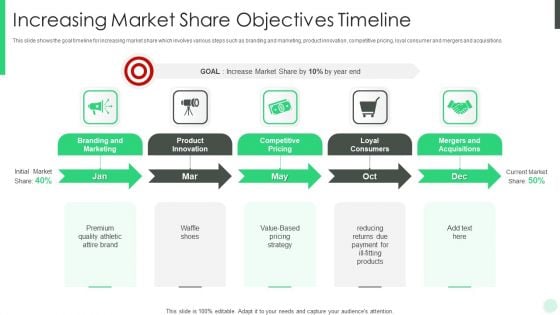
Increasing Market Share Objectives Timeline Infographics PDF
This slide shows the goal timeline for increasing market share which involves various steps such as branding and marketing, product innovation, competitive pricing, loyal consumer and mergers and acquisitions. Persuade your audience using this increasing market share objectives timeline infographics pdf. This PPT design covers five stages, thus making it a great tool to use. It also caters to a variety of topics including branding and marketing, product innovation, competitive pricing, loyal consumers. Download this PPT design now to present a convincing pitch that not only emphasizes the topic but also showcases your presentation skills.
Mind Map Ppt PowerPoint Presentation File Infographics
This is a mind map ppt powerpoint presentation file infographics. This is a five stage process. The stages in this process are semi, icons, management, strategy.
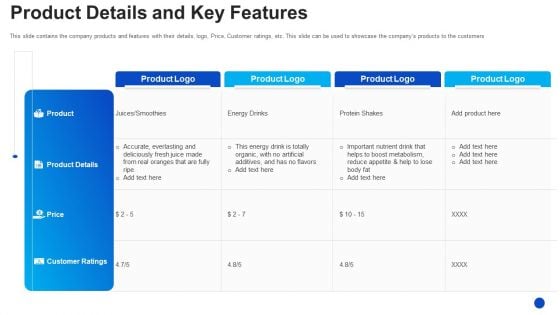
Product Details And Key Features Infographics PDF
This slide contains the company products and features with their details, logo, Price, Customer ratings, etc. This slide can be used to showcase the companys products to the customers Deliver and pitch your topic in the best possible manner with this product details and key features infographics pdf. Use them to share invaluable insights on accurate everlasting, energy drinks, protein shakes and impress your audience. This template can be altered and modified as per your expectations. So, grab it now.
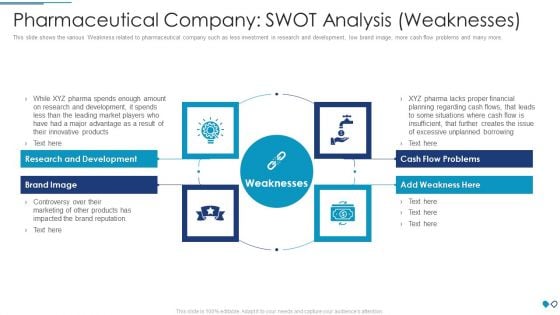
Pharmaceutical Company SWOT Analysis Weaknesses Infographics PDF
This slide shows the various Weakness related to pharmaceutical company such as less investment in research and development, low brand image, more cash flow problems and many more.This is a pharmaceutical company swot analysis weaknesses infographics pdf template with various stages. Focus and dispense information on four stages using this creative set, that comes with editable features. It contains large content boxes to add your information on topics like research and development, cash flow problems, brand image You can also showcase facts, figures, and other relevant content using this PPT layout. Grab it now.

Combo Chart Ppt PowerPoint Presentation Professional Infographics
This is a combo chart ppt powerpoint presentation professional infographics. This is a three stage process. The stages in this process are combo chart, market size, product.
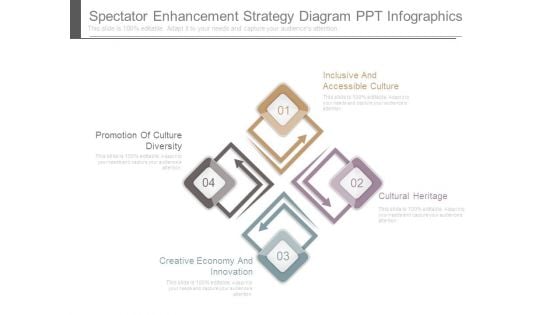
Spectator Enhancement Strategy Diagram Ppt Infographics
This is a spectator enhancement strategy diagram ppt infographics. This is a four stage process. The stages in this process are promotion of culture diversity, creative economy and innovation, cultural heritage, inclusive and accessible culture.
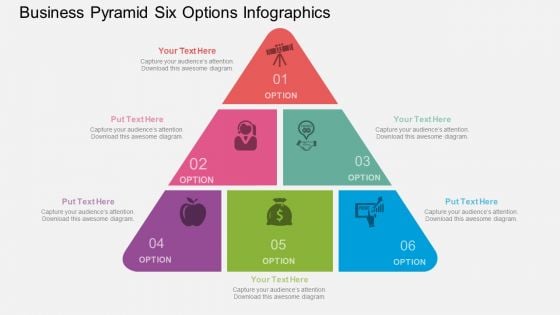
Business Pyramid Six Options Infographics Powerpoint Template
This professional diagram slide has been designed with graphics of pyramid six options infographic. You may use this diagram to display success strategy. Download this slide to build impressive presentations.
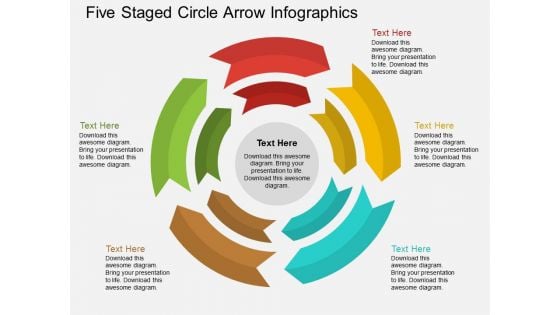
Five Staged Circle Arrow Infographics Powerpoint Template
This pre-designed and appealing graphics offer an optimized possibility to illustrate your business strategy. This PowerPoint slide displays five staged circle arrow infographic. You can present your opinions using this impressive slide.
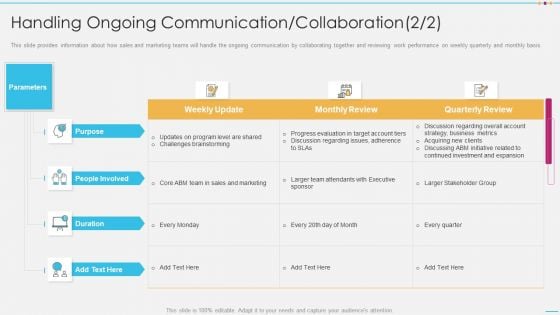
Handling Ongoing Communication Collaboration Infographics PDF
This slide provides information about how sales and marketing teams will handle the ongoing communication by collaborating together and reviewing work performance on weekly quarterly and monthly basis. Deliver an awe inspiring pitch with this creative handling ongoing communication collaboration infographics pdf bundle. Topics like progress evaluation, target account, metrics, business, strategy can be discussed with this completely editable template. It is available for immediate download depending on the needs and requirements of the user.
Scm Advantages Ppt PowerPoint Presentation Infographics Icons
This is a scm advantages ppt powerpoint presentation infographics icons. This is a seven stage process. The stages in this process are improvises productivity and business functions, minimizes warehouse and transportation costs, minimizes direct and indirect costs, develops better customer relationship and service, icons.
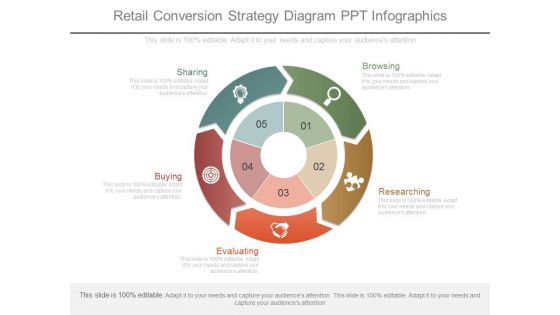
Retail Conversion Strategy Diagram Ppt Infographics
This is a retail conversion strategy diagram ppt infographics. This is a five stage process. The stages in this process are sharing, browsing, buying, researching, evaluating.

Customer Need Assessment Kpi Dashboard Infographics PDF
The following slide highlights the spas to assess customers changing needs and make strategies to improve. It consists of NPS, responses, weekly variations in needs, positive and negative feedback etc. Showcasing this set of slides titled customer need assessment kpi dashboard infographics pdf. The topics addressed in these templates are customer need assessment kpi dashboard. All the content presented in this PPT design is completely editable. Download it and make adjustments in color, background, font etc. as per your unique business setting.
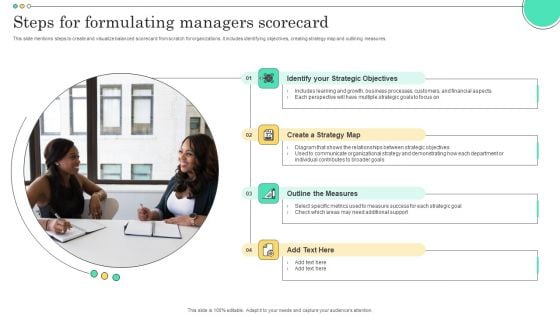
Steps For Formulating Managers Scorecard Infographics PDF
Communication Strategy Ppt PowerPoint Presentation Infographics
This is a communication strategy ppt powerpoint presentation infographics. This is a six stage process. The stages in this process are business, marketing, diagram, presentation.
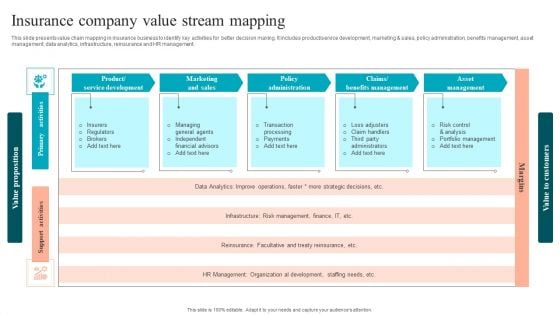
Insurance Company Value Stream Mapping Infographics PDF
This slide presents value chain mapping in insurance business to identify key activities for better decision making. It includes product service development, marketing and sales, policy administration, benefits management, asset management, data analytics, infrastructure, reinsurance and HR management. Presenting Insurance Company Value Stream Mapping Infographics PDF to dispense important information. This template comprises five stages. It also presents valuable insights into the topics including Product Service Development, Marketing Sales, Policy Administration. This is a completely customizable PowerPoint theme that can be put to use immediately. So, download it and address the topic impactfully.
Lego Ppt PowerPoint Presentation Outline Infographics
This is a lego ppt powerpoint presentation outline infographics. This is a four stage process. The stages in this process are lego, sports, management, business, success.

Exit Strategy Ppt PowerPoint Presentation Infographics
This is a exit strategy ppt powerpoint presentation infographics. This is a two stage process. The stages in this process are failure, success.
About Us Ppt PowerPoint Presentation Infographics
This is a about us ppt powerpoint presentation infographics. This is a one stage process. The stages in this process are business, strategy, analysis, about us, icons.
Bar Graph Ppt PowerPoint Presentation Infographics
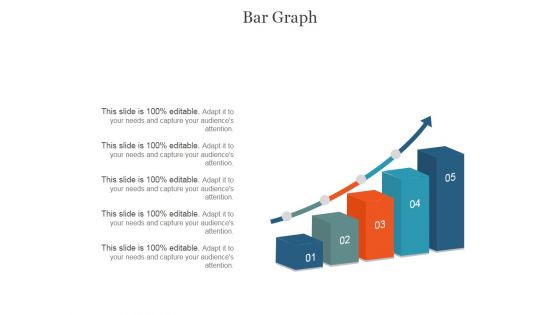
This is a bar graph ppt powerpoint presentation infographics. This is a five stage process. The stages in this process are business, management, marketing, bar graph, analysis.
Business Product Value Stream Mapping Infographics PDF
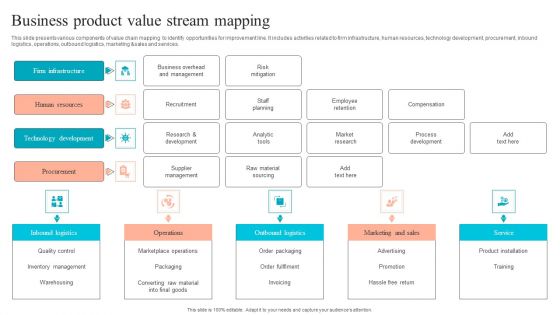
This slide presents various components of value chain mapping to identify opportunities for improvement line. It includes activities related to firm infrastructure, human resources, technology development, procurement, inbound logistics, operations, outbound logistics, marketing and sales and services. Presenting Business Product Value Stream Mapping Infographics PDF to dispense important information. This template comprises five stages. It also presents valuable insights into the topics including Inbound Logistics, Operations, Outbound Logistics. This is a completely customizable PowerPoint theme that can be put to use immediately. So, download it and address the topic impactfully.
Skills Ppt PowerPoint Presentation Model Infographics
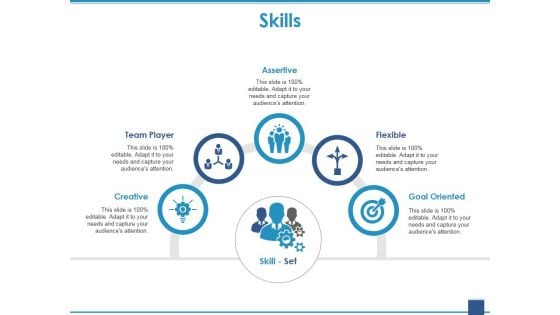
This is a skills ppt powerpoint presentation model infographics. This is a five stage process. The stages in this process are assertive, team player, creative, flexible, goal oriented.

Training Evaluation Ppt PowerPoint Presentation File Infographics
This is a training evaluation ppt powerpoint presentation file infographics. This is a four stage process. The stages in this process are results, behavior, learning, reaction, business.
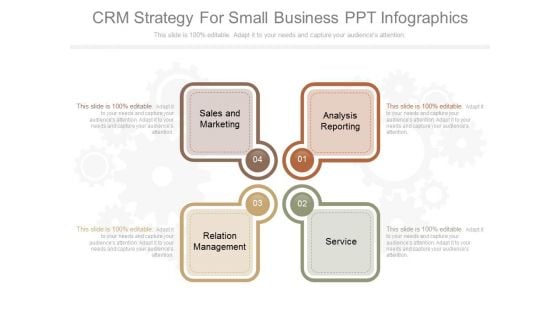
Crm Strategy For Small Business Ppt Infographics
This is a crm strategy for small business ppt infographics. This is a four stage process. The stages in this process are sales and marketing, analysis reporting, relation management, service.
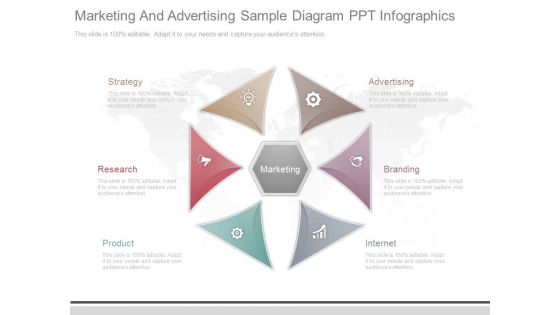
Marketing And Advertising Sample Diagram Ppt Infographics
This is a marketing and advertising sample diagram ppt infographics. This is a six stage process. The stages in this process are marketing, strategy, research, product, advertising, branding, internet.
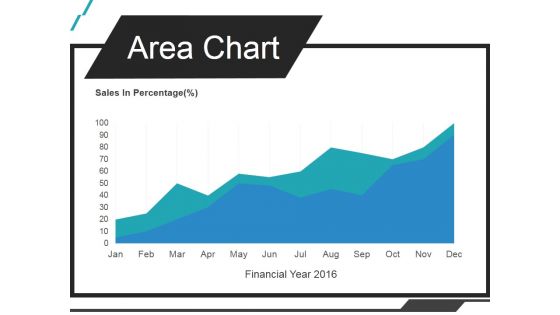
Area Chart Ppt PowerPoint Presentation Infographics
This is a area chart ppt powerpoint presentation infographics. This is a one stage process. The stages in this process are sales in percentage, jan, feb, mar, apr.

Banners Infographics For Financial Process Powerpoint Slides
This PowerPoint template contains diagram of banners infographic. You may download this slide to display strategy steps for financial process. You can easily customize this template to make it more unique as per your need.
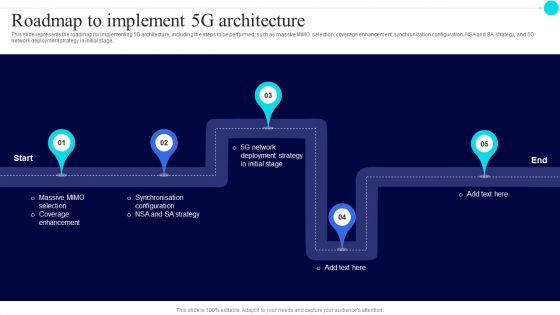
Roadmap To Implement 5G Architecture Infographics PDF
This slide represents the roadmap for implementing 5G architecture, including the steps to be performed, such as massive MIMO selection, coverage enhancement, synchronization configuration, NSA and SA strategy, and 5G network deployment strategy in initial stage.Presenting Roadmap To Implement 5G Architecture Infographics PDF to provide visual cues and insights. Share and navigate important information on five stages that need your due attention. This template can be used to pitch topics like Deployment Strategy, Synchronisation, Coverage Enhancement. In addtion, this PPT design contains high resolution images, graphics, etc, that are easily editable and available for immediate download.
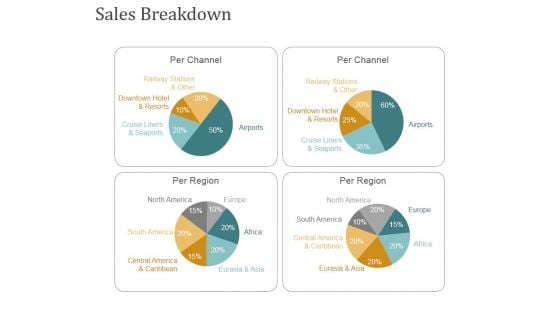
Sales Breakdown Ppt PowerPoint Presentation Summary Infographics
This is a sales breakdown ppt powerpoint presentation summary infographics. This is a four stage process. The stages in this process are per channel, per region.
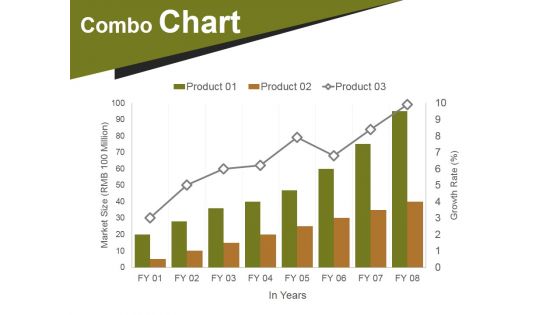
Combo Chart Ppt PowerPoint Presentation Portfolio Infographics
This is a combo chart ppt powerpoint presentation portfolio infographics. This is a eight stage process. The stages in this process are market size, growth, years, finance, business.
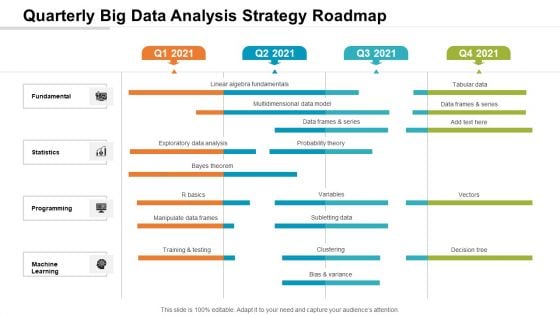
Quarterly Big Data Analysis Strategy Roadmap Infographics
Presenting our jaw-dropping quarterly big data analysis strategy roadmap infographics. You can alternate the color, font size, font type, and shapes of this PPT layout according to your strategic process. This PPT presentation is compatible with Google Slides and is available in both standard screen and widescreen aspect ratios. You can also download this well-researched PowerPoint template design in different formats like PDF, JPG, and PNG. So utilize this visually-appealing design by clicking the download button given below.
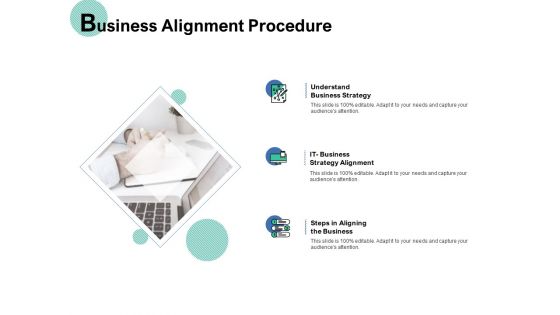
Business Alignment Procedure Ppt PowerPoint Presentation Infographics
Presenting this set of slides with name business alignment procedure ppt powerpoint presentation infographics. This is a three stage process. The stages in this process are understand business strategy, it business strategy alignment, steps aligning business. This is a completely editable PowerPoint presentation and is available for immediate download. Download now and impress your audience.
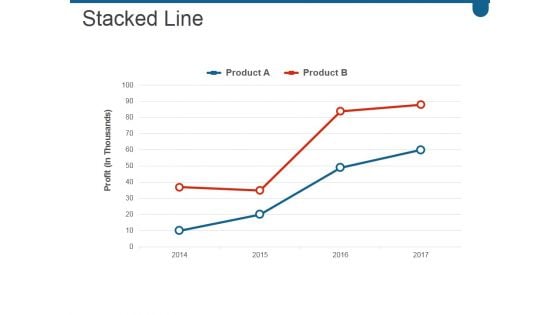
Stacked Line Ppt PowerPoint Presentation Infographics
This is a stacked line ppt powerpoint presentation infographics. This is a two stage process. The stages in this process are business, marketing, growth, success, line.
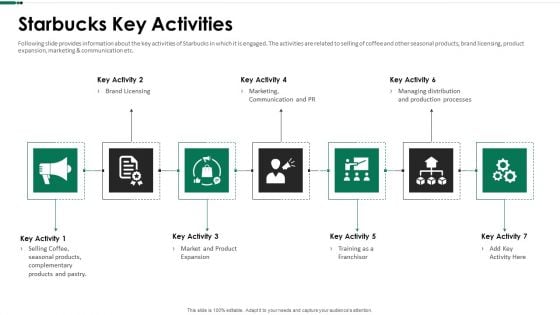
Starbucks Key Activities Ppt Infographics Guide PDF
Following slide provides information about the key activities of Starbucks in which it is engaged. The activities are related to selling of coffee and other seasonal products, brand licensing, product expansion, marketing and communication etc. Presenting starbucks key activities ppt infographics guide pdf to provide visual cues and insights. Share and navigate important information on seven stages that need your due attention. This template can be used to pitch topics like communication, marketing, processes, training. In addtion, this PPT design contains high resolution images, graphics, etc, that are easily editable and available for immediate download.
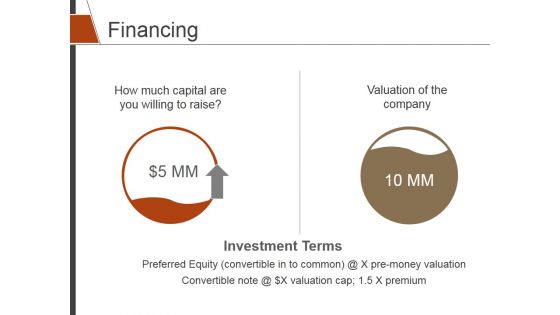
Financing Ppt PowerPoint Presentation Summary Infographics
This is a financing ppt powerpoint presentation summary infographics. This is a two stage process. The stages in this process are investment terms, finance, analysis, investment, business.
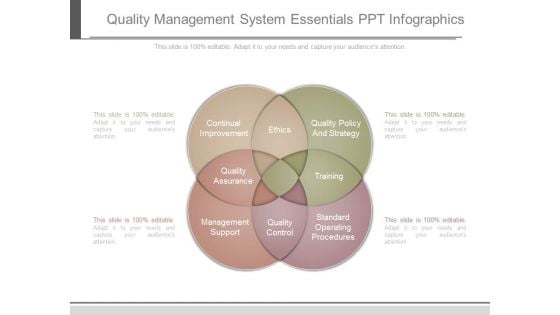
Quality Management System Essentials Ppt Infographics
This is a quality management system essentials ppt infographics. This is a four stage process. The stages in this process are continual improvement, ethics, quality policy and strategy, quality assurance, training, management support, quality control, standard operating procedures.
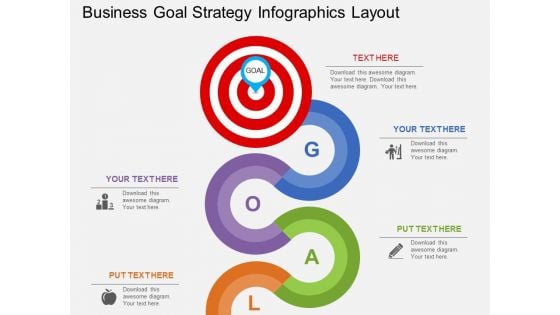
Business Goal Strategy Infographics Layout Powerpoint Template
Visually support your presentation with our above template containing graphic of zigzag path towards goal. This diagram slide helps to portray goal achievement process. Etch your views in the brains of your audience with this diagram slide.
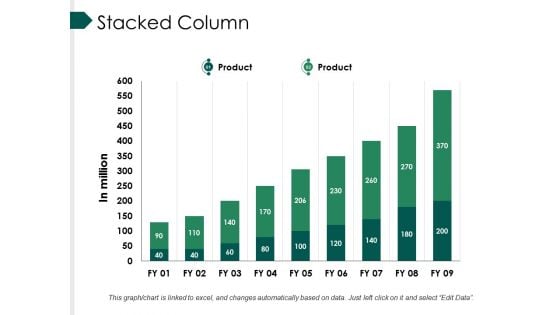
Stacked Column Ppt PowerPoint Presentation Professional Infographics
This is a stacked column ppt powerpoint presentation professional infographics. This is a nine stage process. The stages in this process are bar, marketing, strategy, finance, teamwork.
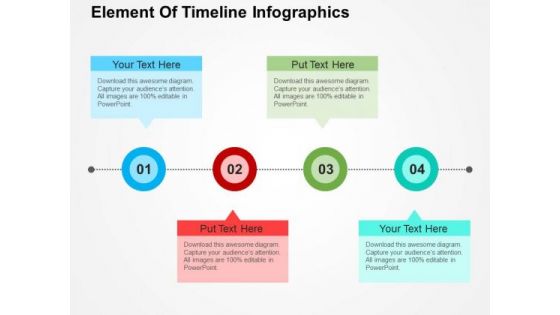
Element Of Timeline Infographics PowerPoint Templates
This pre-designed and appealing graphics offer an optimized possibility to illustrate your business strategy. This slide displays steps of business timeline. You can present your opinions using this impressive slide related to solution, strategy etc.

Our Mission Ppt PowerPoint Presentation Layouts Infographics
This is a our mission ppt powerpoint presentation layouts infographics. This is a three stage process. The stages in this process are our mission, vision, icons, strategy, business.
My Mission Ppt PowerPoint Presentation Infographics
This is a my mission ppt powerpoint presentation infographics. This is a two stage process. The stages in this process are business, strategy, analysis, marketing.

Iso Certificate Ppt PowerPoint Presentation Portfolio Infographics
This is a iso certificate ppt powerpoint presentation portfolio infographics. This is a five stage process. The stages in this process are certification, business, management, marketing, strategy.
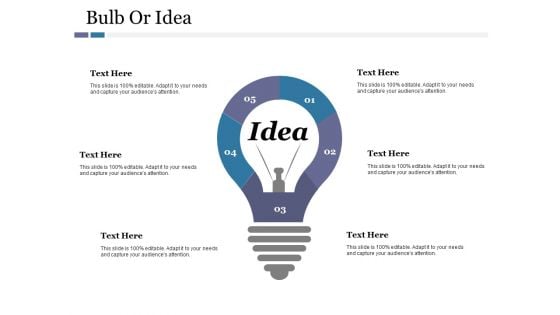
Bulb Or Idea Ppt PowerPoint Presentation Infographics
This is a bulb or idea ppt powerpoint presentation infographics. This is a five stage process. The stages in this process are bulb, technology, marketing, strategy, idea, business.
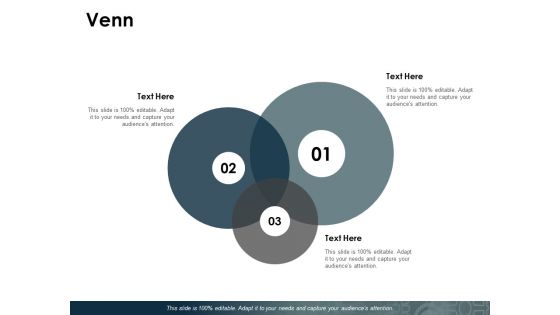
Venn Ppt PowerPoint Presentation Pictures Infographics
This is a venn ppt powerpoint presentation pictures infographics. This is a three stage process. The stages in this process are marketing, strategy, business.
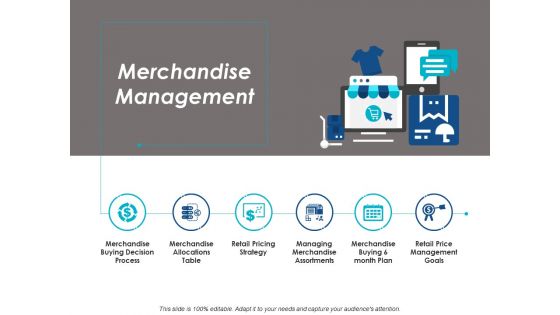
Merchandise Management Ppt PowerPoint Presentation Styles Infographics
This is a merchandise management ppt powerpoint presentation styles infographics. This is a six stage process. The stages in this process are strategy, marketing, business, management, icons.
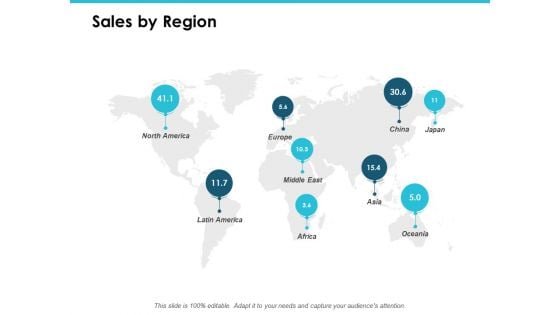
Sales By Region Ppt PowerPoint Presentation Infographics
This is a sales by region ppt powerpoint presentation infographics. This is a nine stage process. The stages in this process are location, information, geography, management, strategy.
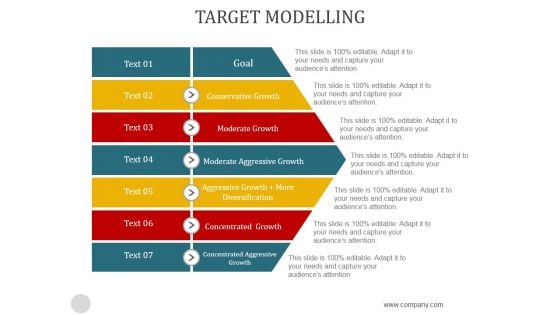
Target Modelling Ppt PowerPoint Presentation Infographics
This is a target modelling ppt powerpoint presentation infographics. This is a seven stage process. The stages in this process are conservative growth, moderate growth, moderate aggressive growth, aggressive growth more diversification, concentrated growth, concentrated aggressive, growth, goal.
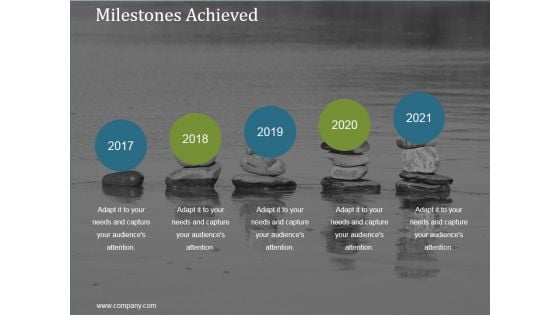
Milestones Achieved Ppt PowerPoint Presentation Infographics
This is a milestones achieved ppt powerpoint presentation infographics. This is a five stage process. The stages in this process are business, strategy, marketing, analysis, success, time line.
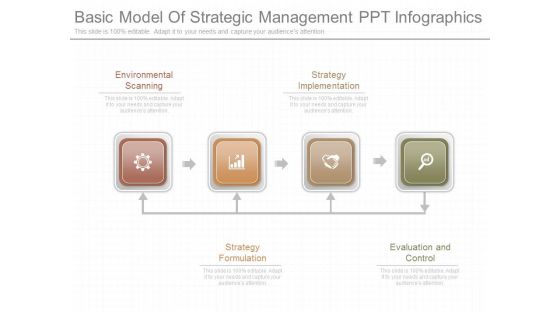
Basic Model Of Strategic Management Ppt Infographics
This is a basic model of strategic management ppt infographics. This is a four stage process. The stages in this process are environmental scanning, strategy implementation, strategy formulation, evaluation and control.

Generate Idea Ppt PowerPoint Presentation Layouts Infographics
This is a generate idea ppt powerpoint presentation layouts infographics. This is a one stage process. The stages in this process are business, marketing, analysis, strategy, idea bulb.


 Continue with Email

 Home
Home


