Activity Icon
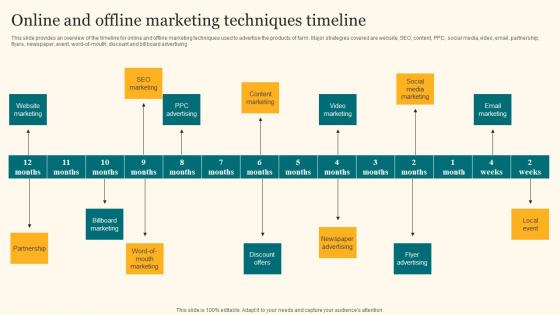
Online And Offline Marketing Techniques Timeline Agricultural Product Promotion Structure Pdf
This slide provides an overview of the timeline for online and offline marketing techniques used to advertise the products of farm. Major strategies covered are website, SEO, content, PPC, social media, video, email, partnership, flyers, newspaper, event, word-of-mouth, discount and billboard advertising. Take your projects to the next level with our ultimate collection of Online And Offline Marketing Techniques Timeline Agricultural Product Promotion Structure Pdf. Slidegeeks has designed a range of layouts that are perfect for representing task or activity duration, keeping track of all your deadlines at a glance. Tailor these designs to your exact needs and give them a truly corporate look with your own brand colors they will make your projects stand out from the rest This slide provides an overview of the timeline for online and offline marketing techniques used to advertise the products of farm. Major strategies covered are website, SEO, content, PPC, social media, video, email, partnership, flyers, newspaper, event, word-of-mouth, discount and billboard advertising.
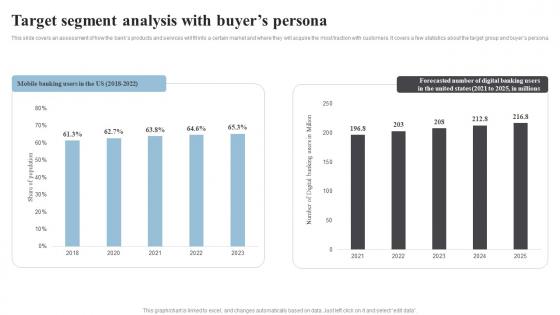
Target Segment Analysis With Buyers Persona Banking Start Up B Plan Go To Market Strategy Background Pdf
This slide covers an assessment of how the banks products and services will fit into a certain market and where they will acquire the most traction with customers. It covers a few statistics about the target group and buyers persona. Take your projects to the next level with our ultimate collection of Target Segment Analysis With Buyers Persona Banking Start Up B Plan Go To Market Strategy Background Pdf. Slidegeeks has designed a range of layouts that are perfect for representing task or activity duration, keeping track of all your deadlines at a glance. Tailor these designs to your exact needs and give them a truly corporate look with your own brand colors they will make your projects stand out from the rest This slide covers an assessment of how the banks products and services will fit into a certain market and where they will acquire the most traction with customers. It covers a few statistics about the target group and buyers persona.
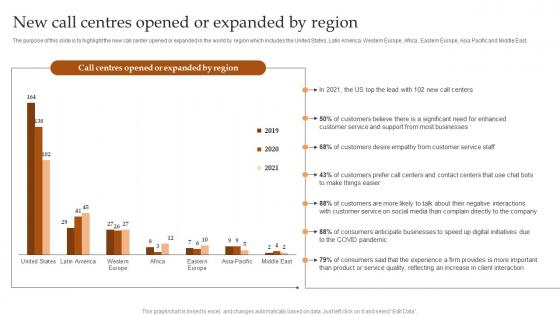
New Call Centres Opened Or Expanded By Region IT And Tech Support Business Portrait Pdf
The purpose of this slide is to highlight the new call center opened or expanded in the world by region which includes the United States, Latin America, Western Europe, Africa, Eastern Europe, Asia Pacific and Middle East. Take your projects to the next level with our ultimate collection of New Call Centres Opened Or Expanded By Region IT And Tech Support Business Portrait Pdf Slidegeeks has designed a range of layouts that are perfect for representing task or activity duration, keeping track of all your deadlines at a glance. Tailor these designs to your exact needs and give them a truly corporate look with your own brand colors they well make your projects stand out from the rest. The purpose of this slide is to highlight the new call center opened or expanded in the world by region which includes the United States, Latin America, Western Europe, Africa, Eastern Europe, Asia Pacific and Middle East.
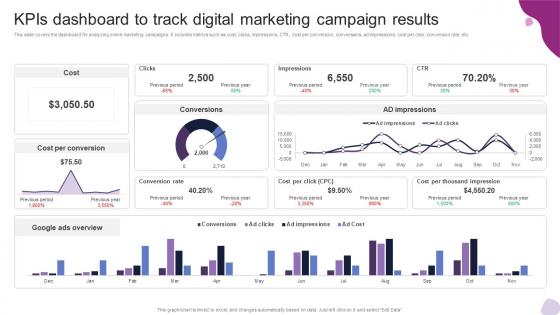
Kpis Dashboard To Track Digital Marketing Campaign Powerful Marketing Techniques Strategy SS V
This slide covers the dashboard for analyzing online marketing campaigns. It includes metrics such as cost, clicks, impressions, CTR, cost per conversion, conversions, ad impressions, cost per click, conversion rate, etc. Take your projects to the next level with our ultimate collection of Kpis Dashboard To Track Digital Marketing Campaign Powerful Marketing Techniques Strategy SS V. Slidegeeks has designed a range of layouts that are perfect for representing task or activity duration, keeping track of all your deadlines at a glance. Tailor these designs to your exact needs and give them a truly corporate look with your own brand colors they will make your projects stand out from the rest This slide covers the dashboard for analyzing online marketing campaigns. It includes metrics such as cost, clicks, impressions, CTR, cost per conversion, conversions, ad impressions, cost per click, conversion rate, etc.
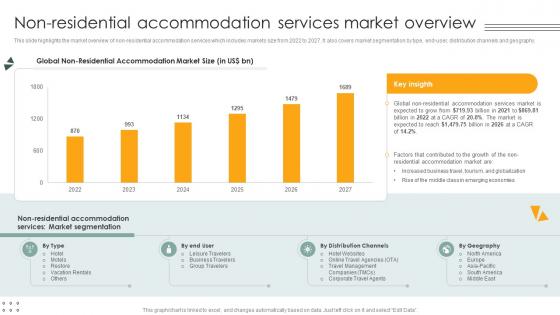
Non Residential Accommodation Services Market Overview Lodging And Accommodation Industry IR SS V
This slide highlights the market overview of non-residential accommodation services which includes markets size from 2022 to 2027. It also covers market segmentation by type, end-user, distribution channels and geography. Take your projects to the next level with our ultimate collection of Non Residential Accommodation Services Market Overview Lodging And Accommodation Industry IR SS V. Slidegeeks has designed a range of layouts that are perfect for representing task or activity duration, keeping track of all your deadlines at a glance. Tailor these designs to your exact needs and give them a truly corporate look with your own brand colors they will make your projects stand out from the rest This slide highlights the market overview of non-residential accommodation services which includes markets size from 2022 to 2027. It also covers market segmentation by type, end-user, distribution channels and geography.
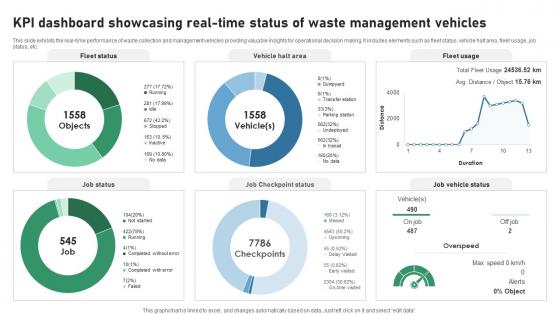
KPI Dashboard Showcasing Real Time Status Of Waste IOT Applications In Smart Waste IoT SS V
This slide exhibits the real-time performance of waste collection and management vehicles providing valuable insights for operational decision making. It includes elements such as fleet status, vehicle halt area, fleet usage, job status, etc. Take your projects to the next level with our ultimate collection of KPI Dashboard Showcasing Real Time Status Of Waste IOT Applications In Smart Waste IoT SS V. Slidegeeks has designed a range of layouts that are perfect for representing task or activity duration, keeping track of all your deadlines at a glance. Tailor these designs to your exact needs and give them a truly corporate look with your own brand colors they will make your projects stand out from the rest This slide exhibits the real-time performance of waste collection and management vehicles providing valuable insights for operational decision making. It includes elements such as fleet status, vehicle halt area, fleet usage, job status, etc.
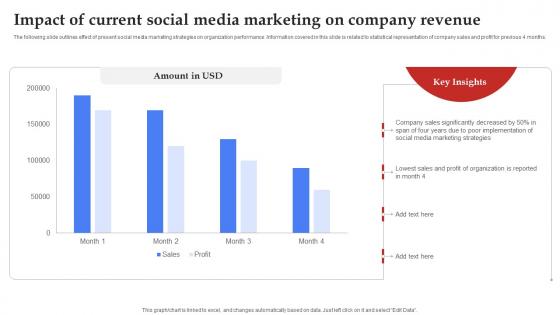
Facebook Marketing Plan Impact Of Current Social Media Marketing Strategy SS V
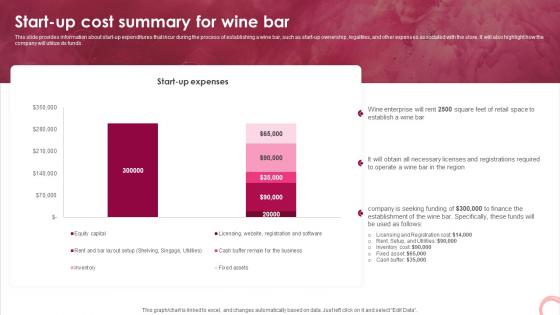
Wine Lounge Business Plan Start Up Cost Summary For Wine Bar BP SS V
This slide provides information about start-up expenditures that incur during the process of establishing a wine bar, such as start-up ownership, legalities, and other expenses associated with the store. It will also highlight how the company will utilize its funds. Take your projects to the next level with our ultimate collection of Wine Lounge Business Plan Start Up Cost Summary For Wine Bar BP SS V. Slidegeeks has designed a range of layouts that are perfect for representing task or activity duration, keeping track of all your deadlines at a glance. Tailor these designs to your exact needs and give them a truly corporate look with your own brand colors they will make your projects stand out from the rest This slide provides information about start-up expenditures that incur during the process of establishing a wine bar, such as start-up ownership, legalities, and other expenses associated with the store. It will also highlight how the company will utilize its funds.

Increasing Business Awareness Introducing Social Media Marketing For Creating Strategy SS V
This slide presents an overview of social media marketing. It also include a graph showcasing the associated benefits of social media for insurers such as marketing, customer service, new sales leads, fraud detection and risk selection. Take your projects to the next level with our ultimate collection of Increasing Business Awareness Introducing Social Media Marketing For Creating Strategy SS V. Slidegeeks has designed a range of layouts that are perfect for representing task or activity duration, keeping track of all your deadlines at a glance. Tailor these designs to your exact needs and give them a truly corporate look with your own brand colors they will make your projects stand out from the rest This slide presents an overview of social media marketing. It also include a graph showcasing the associated benefits of social media for insurers such as marketing, customer service, new sales leads, fraud detection and risk selection
Unlocking Potential Enhancing Team Members Performance Tracking Dashboards
This slide depicts performance tracking dashboard for project manager to analyze work being done by the team. It includes average rating for the week, total work done and weekly change, employee rating and work done. Take your projects to the next level with our ultimate collection of Unlocking Potential Enhancing Team Members Performance Tracking Dashboards. Slidegeeks has designed a range of layouts that are perfect for representing task or activity duration, keeping track of all your deadlines at a glance. Tailor these designs to your exact needs and give them a truly corporate look with your own brand colors they will make your projects stand out from the rest This slide depicts performance tracking dashboard for project manager to analyze work being done by the team. It includes average rating for the week, total work done and weekly change, employee rating and work done.
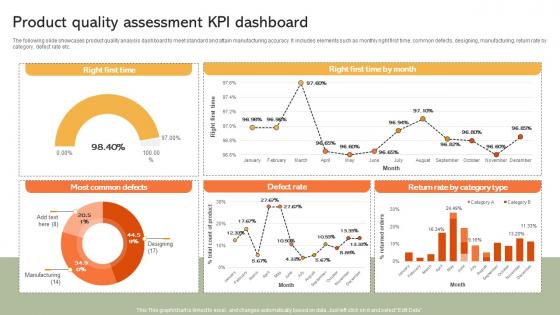
Product Quality Assessment KPI Dashboard Implementing Manufacturing Strategy SS V
The following slide showcases product quality analysis dashboard to meet standard and attain manufacturing accuracy. It includes elements such as monthly right first time, common defects, designing, manufacturing, return rate by category, defect rate etc. Take your projects to the next level with our ultimate collection of Product Quality Assessment KPI Dashboard Implementing Manufacturing Strategy SS V. Slidegeeks has designed a range of layouts that are perfect for representing task or activity duration, keeping track of all your deadlines at a glance. Tailor these designs to your exact needs and give them a truly corporate look with your own brand colors they will make your projects stand out from the rest The following slide showcases product quality analysis dashboard to meet standard and attain manufacturing accuracy. It includes elements such as monthly right first time, common defects, designing, manufacturing, return rate by category, defect rate etc.
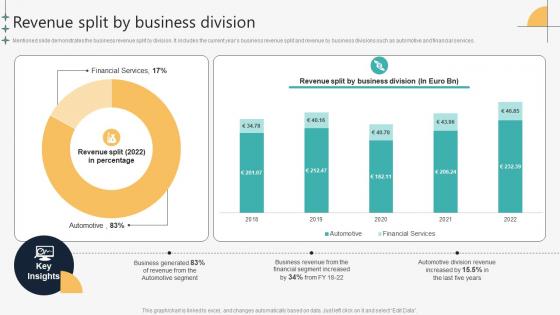
Revenue Split By Business Division Automotive Manufacturing Company Profile CP SS V
Mentioned slide demonstrates the business revenue split by division. It includes the current years business revenue split and revenue by business divisions such as automotive and financial services.Take your projects to the next level with our ultimate collection of Revenue Split By Business Division Automotive Manufacturing Company Profile CP SS V. Slidegeeks has designed a range of layouts that are perfect for representing task or activity duration, keeping track of all your deadlines at a glance. Tailor these designs to your exact needs and give them a truly corporate look with your own brand colors they will make your projects stand out from the rest Mentioned slide demonstrates the business revenue split by division. It includes the current years business revenue split and revenue by business divisions such as automotive and financial services.
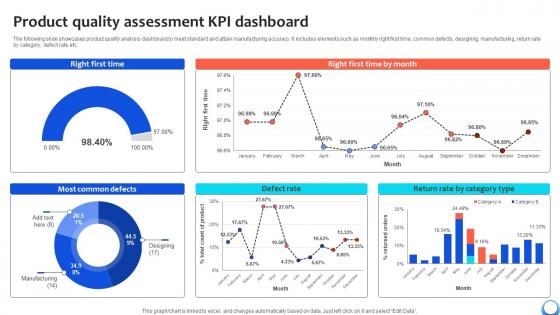
Product Quality Assessment KPI Dashboard Automating Production Process Strategy SS V
The following slide showcases product quality analysis dashboard to meet standard and attain manufacturing accuracy. It includes elements such as monthly right first time, common defects, designing, manufacturing, return rate by category, defect rate etc. Take your projects to the next level with our ultimate collection of Product Quality Assessment KPI Dashboard Automating Production Process Strategy SS V. Slidegeeks has designed a range of layouts that are perfect for representing task or activity duration, keeping track of all your deadlines at a glance. Tailor these designs to your exact needs and give them a truly corporate look with your own brand colors they will make your projects stand out from the rest The following slide showcases product quality analysis dashboard to meet standard and attain manufacturing accuracy. It includes elements such as monthly right first time, common defects, designing, manufacturing, return rate by category, defect rate etc.
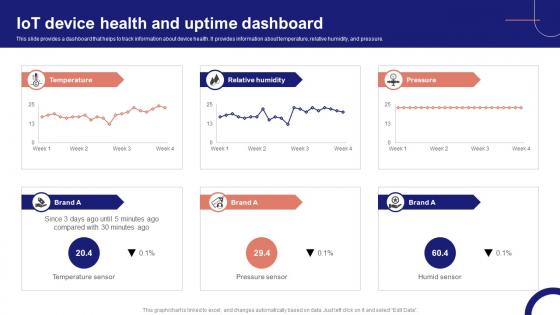
IoT Device Management Fundamentals IoT Device Health And Uptime Dashboard IoT Ss V
This slide provides a dashboard that helps to track information about device health. It provides information about temperature, relative humidity, and pressure. Take your projects to the next level with our ultimate collection of IoT Device Management Fundamentals IoT Device Health And Uptime Dashboard IoT SS V. Slidegeeks has designed a range of layouts that are perfect for representing task or activity duration, keeping track of all your deadlines at a glance. Tailor these designs to your exact needs and give them a truly corporate look with your own brand colors they will make your projects stand out from the rest This slide provides a dashboard that helps to track information about device health. It provides information about temperature, relative humidity, and pressure.
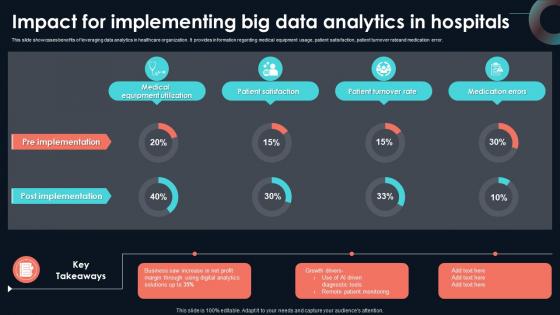
Impact For Implementing Big Data Analytics Developing Strategic Insights Using Big Data Analytics SS V
This slide showcases benefits of leveraging data analytics in healthcare organization. It provides information regarding medical equipment usage, patient satisfaction, patient turnover rateand medication error. Take your projects to the next level with our ultimate collection of Impact For Implementing Big Data Analytics Developing Strategic Insights Using Big Data Analytics SS V. Slidegeeks has designed a range of layouts that are perfect for representing task or activity duration, keeping track of all your deadlines at a glance. Tailor these designs to your exact needs and give them a truly corporate look with your own brand colors they will make your projects stand out from the rest This slide showcases benefits of leveraging data analytics in healthcare organization. It provides information regarding medical equipment usage, patient satisfaction, patient turnover rateand medication error.
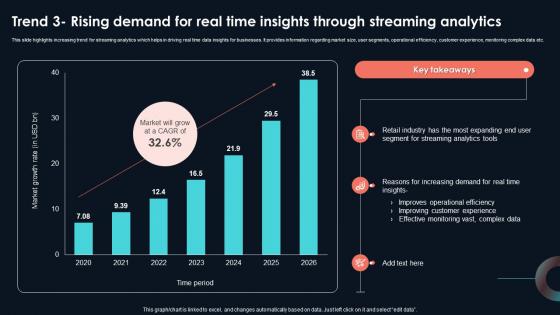
Trend 3 Rising Demand For Real Time Insights Developing Strategic Insights Using Big Data Analytics SS V
This slide highlights increasing trend for streaming analytics which helps in driving real time data insights for businesses. It provides information regarding market size, user segments, operational efficiency, customer experience, monitoring complex data etc. Take your projects to the next level with our ultimate collection of Trend 3 Rising Demand For Real Time Insights Developing Strategic Insights Using Big Data Analytics SS V. Slidegeeks has designed a range of layouts that are perfect for representing task or activity duration, keeping track of all your deadlines at a glance. Tailor these designs to your exact needs and give them a truly corporate look with your own brand colors they will make your projects stand out from the rest This slide highlights increasing trend for streaming analytics which helps in driving real time data insights for businesses. It provides information regarding market size, user segments, operational efficiency, customer experience, monitoring complex data etc.
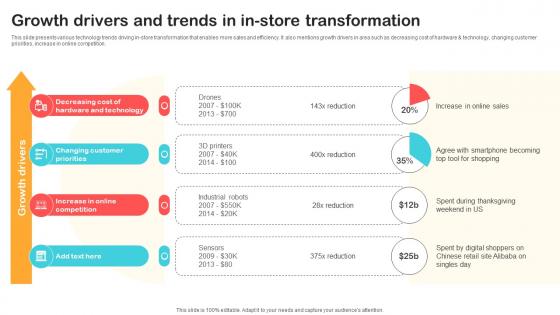
Growth Drivers And Trends In In Store Transformation Optimizing Retail Operations With Digital DT SS V
This slide presents various technology trends driving in-store transformation that enables more sales and efficiency. It also mentions growth drivers in area such as decreasing cost of hardware and technology, changing customer priorities, increase in online competition.Take your projects to the next level with our ultimate collection of Growth Drivers And Trends In In Store Transformation Optimizing Retail Operations With Digital DT SS V. Slidegeeks has designed a range of layouts that are perfect for representing task or activity duration, keeping track of all your deadlines at a glance. Tailor these designs to your exact needs and give them a truly corporate look with your own brand colors they will make your projects stand out from the rest This slide presents various technology trends driving in-store transformation that enables more sales and efficiency. It also mentions growth drivers in area such as decreasing cost of hardware and technology, changing customer priorities, increase in online competition.
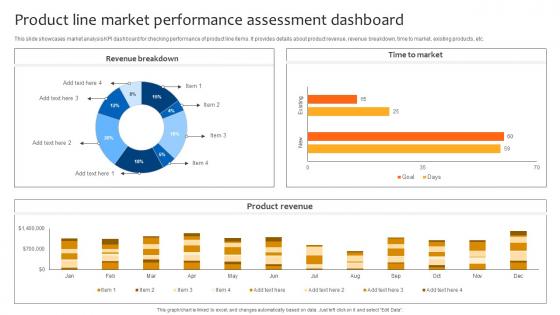
Deploying Strategies For Business Product Line Market Performance Assessment Dashboard Strategy SS V
This slide showcases market analysis KPI dashboard for checking performance of product line items. It provides details about product revenue, revenue breakdown, time to market, existing products, etc. Take your projects to the next level with our ultimate collection of Deploying Strategies For Business Product Line Market Performance Assessment Dashboard Strategy SS V. Slidegeeks has designed a range of layouts that are perfect for representing task or activity duration, keeping track of all your deadlines at a glance. Tailor these designs to your exact needs and give them a truly corporate look with your own brand colors they will make your projects stand out from the rest This slide showcases market analysis KPI dashboard for checking performance of product line items. It provides details about product revenue, revenue breakdown, time to market, existing products, etc.
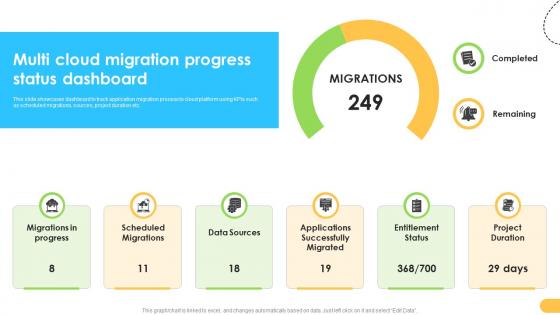
Multi Cloud Migration Progress Status Dashboard Data Migration From On Premises
This slide showcases dashboard to track application migration process to cloud platform using KPIs such as scheduled migrations, sources, project duration etc. Take your projects to the next level with our ultimate collection of Multi Cloud Migration Progress Status Dashboard Data Migration From On Premises. Slidegeeks has designed a range of layouts that are perfect for representing task or activity duration, keeping track of all your deadlines at a glance. Tailor these designs to your exact needs and give them a truly corporate look with your own brand colors they will make your projects stand out from the rest This slide showcases dashboard to track application migration process to cloud platform using KPIs such as scheduled migrations, sources, project duration etc.
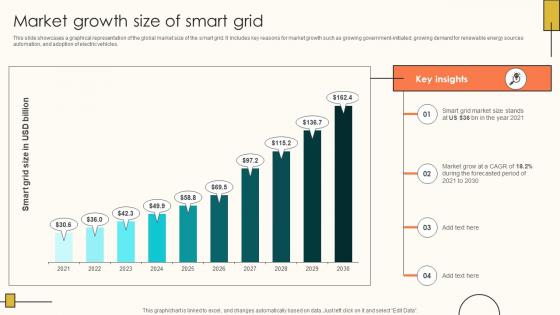
Market Growth Size Of Smart Grid Internet Of Things Solutions To Enhance Energy IoT SS V
This slide showcases a graphical representation of the global market size of the smart grid. It Includes key reasons for market growth such as growing government-initiated, growing demand for renewable energy sources automation, and adoption of electric vehicles. Take your projects to the next level with our ultimate collection of Market Growth Size Of Smart Grid Internet Of Things Solutions To Enhance Energy IoT SS V. Slidegeeks has designed a range of layouts that are perfect for representing task or activity duration, keeping track of all your deadlines at a glance. Tailor these designs to your exact needs and give them a truly corporate look with your own brand colors they will make your projects stand out from the rest This slide showcases a graphical representation of the global market size of the smart grid. It Includes key reasons for market growth such as growing government-initiated, growing demand for renewable energy sources automation, and adoption of electric vehicles.
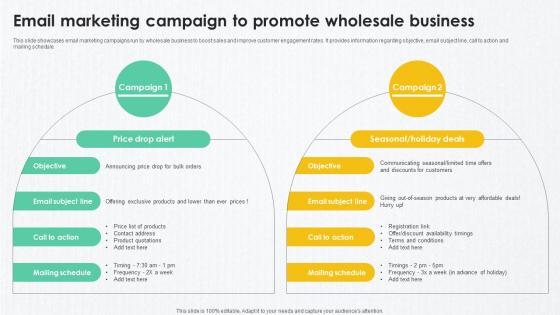
B2B Marketing Techniques To Email Marketing Campaign To Promote Wholesale
This slide showcases email marketing campaigns run by wholesale business to boost sales and improve customer engagement rates. It provides information regarding objective, email subject line, call to action and mailing schedule. Take your projects to the next level with our ultimate collection of B2B Marketing Techniques To Email Marketing Campaign To Promote Wholesale. Slidegeeks has designed a range of layouts that are perfect for representing task or activity duration, keeping track of all your deadlines at a glance. Tailor these designs to your exact needs and give them a truly corporate look with your own brand colors they will make your projects stand out from the rest This slide showcases email marketing campaigns run by wholesale business to boost sales and improve customer engagement rates. It provides information regarding objective, email subject line, call to action and mailing schedule.

IoT Solutions For Oil Oil And Gas Production Monitoring KPI Dashboard IoT SS V
This slide exhibits monthly performance of oil and gas production to track wellhead uptime and overall efficiency. It includes various elements such as production efficiency, well uptime, gas production rate, oil production rate, top performing gas producing wells, etc. Take your projects to the next level with our ultimate collection of IoT Solutions For Oil Oil And Gas Production Monitoring KPI Dashboard IoT SS V. Slidegeeks has designed a range of layouts that are perfect for representing task or activity duration, keeping track of all your deadlines at a glance. Tailor these designs to your exact needs and give them a truly corporate look with your own brand colors they will make your projects stand out from the rest This slide exhibits monthly performance of oil and gas production to track wellhead uptime and overall efficiency. It includes various elements such as production efficiency, well uptime, gas production rate, oil production rate, top performing gas producing wells, etc.
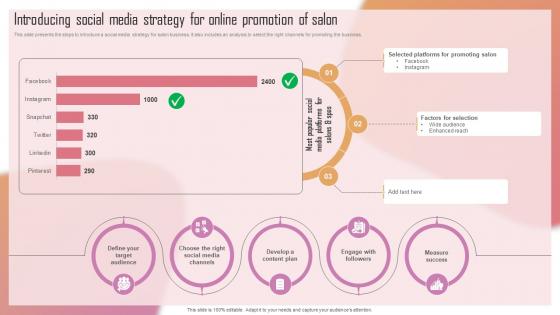
Customizing The Salon Experience Introducing Social Media Strategy For Online Promotion Strategy SS V
This slide presents the steps to introduce a social media strategy for salon business. It also includes an analysis to select the right channels for promoting the business. Take your projects to the next level with our ultimate collection of Customizing The Salon Experience Introducing Social Media Strategy For Online Promotion Strategy SS V. Slidegeeks has designed a range of layouts that are perfect for representing task or activity duration, keeping track of all your deadlines at a glance. Tailor these designs to your exact needs and give them a truly corporate look with your own brand colors they will make your projects stand out from the rest This slide presents the steps to introduce a social media strategy for salon business. It also includes an analysis to select the right channels for promoting the business.
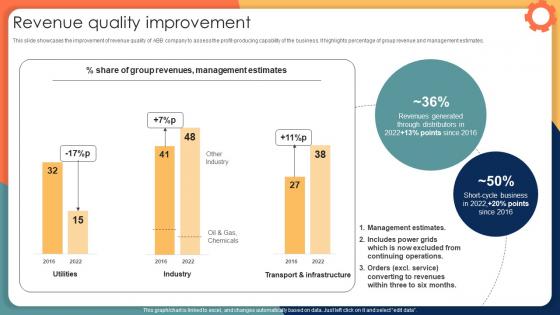
Revenue Quality Improvement Engineering Solution Provider Company Profile CP SS V
This slide showcases the improvement of revenue quality of ABB company to assess the profit-producing capability of the business. It highlights percentage of group revenue and management estimates. Take your projects to the next level with our ultimate collection of Revenue Quality Improvement Engineering Solution Provider Company Profile CP SS V. Slidegeeks has designed a range of layouts that are perfect for representing task or activity duration, keeping track of all your deadlines at a glance. Tailor these designs to your exact needs and give them a truly corporate look with your own brand colors they will make your projects stand out from the rest This slide showcases the improvement of revenue quality of ABB company to assess the profit-producing capability of the business. It highlights percentage of group revenue and management estimates.
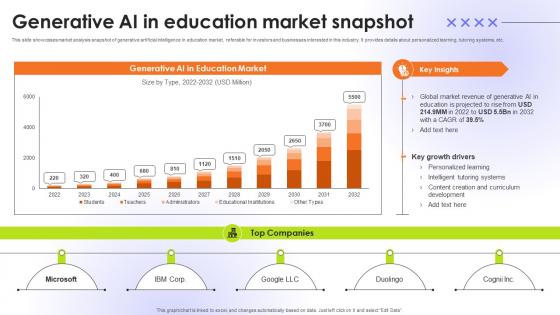
Generative AI In Education Market Snapshot Educational Transformation Through AI SS V
This slide showcases market analysis snapshot of generative artificial intelligence in education market, referable for investors and businesses interested in this industry. It provides details about personalized learning, tutoring systems, etc. Take your projects to the next level with our ultimate collection of Generative AI In Education Market Snapshot Educational Transformation Through AI SS V. Slidegeeks has designed a range of layouts that are perfect for representing task or activity duration, keeping track of all your deadlines at a glance. Tailor these designs to your exact needs and give them a truly corporate look with your own brand colors they will make your projects stand out from the rest This slide showcases market analysis snapshot of generative artificial intelligence in education market, referable for investors and businesses interested in this industry. It provides details about personalized learning, tutoring systems, etc.

Marketing Growth Strategy Performance Dashboard To Measure Marketing Strategy SS V
The following slide outlines key performance indicator KPI dashboard that can assist digital marketers to evaluate marketing campaign performance. The success metrics outlined in slide are total spend on advertisement, cost per thousand CPM, cost per click CPC, click-through rate CTR, etc. Take your projects to the next level with our ultimate collection of Marketing Growth Strategy Performance Dashboard To Measure Marketing Strategy SS V. Slidegeeks has designed a range of layouts that are perfect for representing task or activity duration, keeping track of all your deadlines at a glance. Tailor these designs to your exact needs and give them a truly corporate look with your own brand colors they will make your projects stand out from the rest The following slide outlines key performance indicator KPI dashboard that can assist digital marketers to evaluate marketing campaign performance. The success metrics outlined in slide are total spend on advertisement, cost per thousand CPM, cost per click CPC, click-through rate CTR, etc.
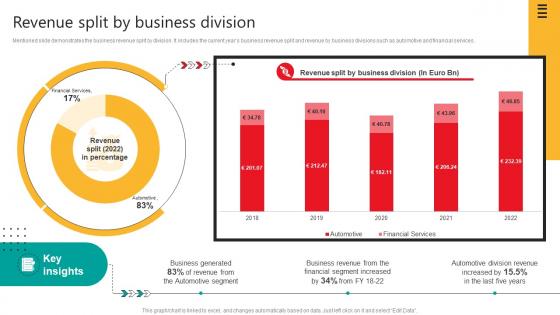
Revenue Split By Business Division Automobile Development Company Profile CP SS V
Mentioned slide demonstrates the business revenue split by division. It includes the current years business revenue split and revenue by business divisions such as automotive and financial services.Take your projects to the next level with our ultimate collection of Revenue Split By Business Division Automobile Development Company Profile CP SS V. Slidegeeks has designed a range of layouts that are perfect for representing task or activity duration, keeping track of all your deadlines at a glance. Tailor these designs to your exact needs and give them a truly corporate look with your own brand colors they will make your projects stand out from the rest Mentioned slide demonstrates the business revenue split by division. It includes the current years business revenue split and revenue by business divisions such as automotive and financial services.
Driving Results Designing A Team Training And Development Program Tracking Dashboard
This slide depicts team development program tracking dashboard to analyze the impact of implementing training plan for the members. It includes training satisfaction rate, engagement score, drop-out rate and top 5 trainees. Take your projects to the next level with our ultimate collection of Driving Results Designing A Team Training And Development Program Tracking Dashboard. Slidegeeks has designed a range of layouts that are perfect for representing task or activity duration, keeping track of all your deadlines at a glance. Tailor these designs to your exact needs and give them a truly corporate look with your own brand colors they will make your projects stand out from the rest This slide depicts team development program tracking dashboard to analyze the impact of implementing training plan for the members. It includes training satisfaction rate, engagement score, drop-out rate and top 5 trainees.
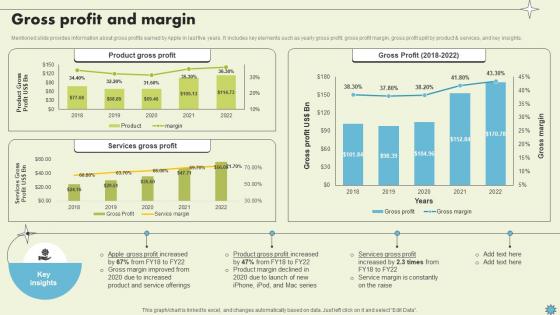
Gross Profit And Margin Consumer Electronics Company Profile CP SS V
Mentioned slide provides information about gross profits earned by Apple in last five years. It includes key elements such as yearly gross profit, gross profit margin, gross profit split by product and services, and key insights.Take your projects to the next level with our ultimate collection of Gross Profit And Margin Consumer Electronics Company Profile CP SS V. Slidegeeks has designed a range of layouts that are perfect for representing task or activity duration, keeping track of all your deadlines at a glance. Tailor these designs to your exact needs and give them a truly corporate look with your own brand colors they will make your projects stand out from the rest Mentioned slide provides information about gross profits earned by Apple in last five years. It includes key elements such as yearly gross profit, gross profit margin, gross profit split by product and services, and key insights.
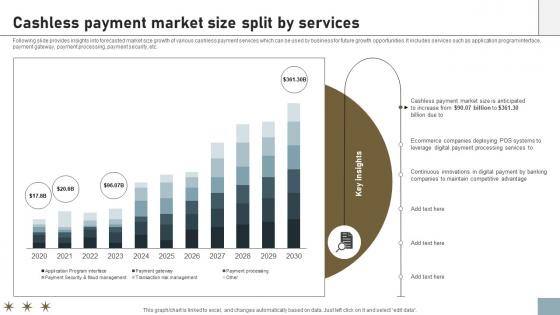
Online Payment Techniques For Providing Cashless Payment Market Size Split
Following slide provides insights into forecasted market size growth of various cashless payment services which can be used by business for future growth opportunities. It includes services such as application program interface, payment gateway, payment processing, payment security, etc. Take your projects to the next level with our ultimate collection of Online Payment Techniques For Providing Cashless Payment Market Size Split. Slidegeeks has designed a range of layouts that are perfect for representing task or activity duration, keeping track of all your deadlines at a glance. Tailor these designs to your exact needs and give them a truly corporate look with your own brand colors they will make your projects stand out from the rest Following slide provides insights into forecasted market size growth of various cashless payment services which can be used by business for future growth opportunities. It includes services such as application program interface, payment gateway, payment processing, payment security, etc.
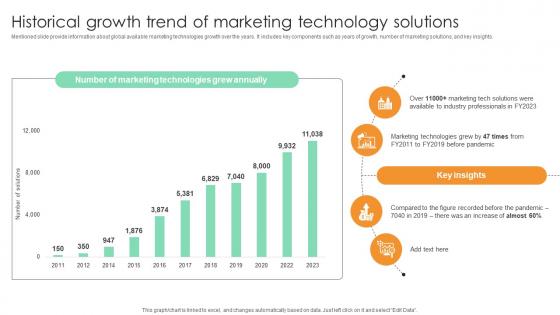
Historical Growth Trend Of Marketing Technology Comprehensive Guide For Marketing Technology
Mentioned slide provide information about global available marketing technologies growth over the years. It includes key components such as years of growth, number of marketing solutions, and key insights. Take your projects to the next level with our ultimate collection of Historical Growth Trend Of Marketing Technology Comprehensive Guide For Marketing Technology. Slidegeeks has designed a range of layouts that are perfect for representing task or activity duration, keeping track of all your deadlines at a glance. Tailor these designs to your exact needs and give them a truly corporate look with your own brand colors they will make your projects stand out from the rest Mentioned slide provide information about global available marketing technologies growth over the years. It includes key components such as years of growth, number of marketing solutions, and key insights.
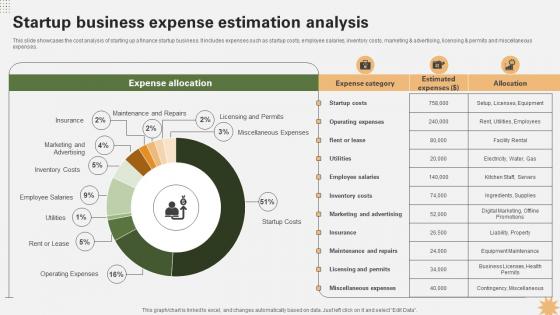
Startup Business Expense Estimation Analysis Strategy For Launching A Financial Strategy SS V
This slide showcases the cost analysis of starting up a finance startup business. It includes expenses such as startup costs, employee salaries, inventory costs, marketing and advertising, licensing and permits and miscellaneous expenses. Take your projects to the next level with our ultimate collection of Startup Business Expense Estimation Analysis Strategy For Launching A Financial Strategy SS V. Slidegeeks has designed a range of layouts that are perfect for representing task or activity duration, keeping track of all your deadlines at a glance. Tailor these designs to your exact needs and give them a truly corporate look with your own brand colors they will make your projects stand out from the rest This slide showcases the cost analysis of starting up a finance startup business. It includes expenses such as startup costs, employee salaries, inventory costs, marketing and advertising, licensing and permits and miscellaneous expenses.
Dashboard Analysis For Tracking Agricultural Tasks Adopting Sustainable Farming Techniques
This slide showcases the KPIs that would help to track the improvements with adoption of new sustainable agriculture practices. It includes current tasks, crops, harvest, todays weather, summary, etc. Take your projects to the next level with our ultimate collection of Dashboard Analysis For Tracking Agricultural Tasks Adopting Sustainable Farming Techniques. Slidegeeks has designed a range of layouts that are perfect for representing task or activity duration, keeping track of all your deadlines at a glance. Tailor these designs to your exact needs and give them a truly corporate look with your own brand colors they will make your projects stand out from the rest This slide showcases the KPIs that would help to track the improvements with adoption of new sustainable agriculture practices. It includes current tasks, crops, harvest, todays weather, summary, etc.

Perform Comprehensive Keyword Research Top Of The Funnel Digital Content Strategy SS V
The following slide represents key outcomes of detailed keyword research to direct efforts to fulfill customer demand. It includes elements such as volume, intent, results, keyword variation, keyword difficulty, cost per click CPC etc. Take your projects to the next level with our ultimate collection of Perform Comprehensive Keyword Research Top Of The Funnel Digital Content Strategy SS V. Slidegeeks has designed a range of layouts that are perfect for representing task or activity duration, keeping track of all your deadlines at a glance. Tailor these designs to your exact needs and give them a truly corporate look with your own brand colors they will make your projects stand out from the rest The following slide represents key outcomes of detailed keyword research to direct efforts to fulfill customer demand. It includes elements such as volume, intent, results, keyword variation, keyword difficulty, cost per click CPC etc.

Telemedicine Industry Analysis Across Latin America Remote Healthcare Services IR SS V
This slide showcases the Telemedicine industry analysis of Latin America region which includes factors that contribute this regions growth such as increasing aging population. It also includes market players operating in this region. Take your projects to the next level with our ultimate collection of Telemedicine Industry Analysis Across Latin America Remote Healthcare Services IR SS V. Slidegeeks has designed a range of layouts that are perfect for representing task or activity duration, keeping track of all your deadlines at a glance. Tailor these designs to your exact needs and give them a truly corporate look with your own brand colors they will make your projects stand out from the rest This slide showcases the Telemedicine industry analysis of Latin America region which includes factors that contribute this regions growth such as increasing aging population. It also includes market players operating in this region.

Graph Illustrating Impact Of Prescriptive Analytics Data Analytics SS V
This slide showcases graph highlighting impact analysis of prescriptive analytics on businesses via use of major performance indicators. It provides information total revenue, inventory levels and labour costs with key insights.Take your projects to the next level with our ultimate collection of Graph Illustrating Impact Of Prescriptive Analytics Data Analytics SS V. Slidegeeks has designed a range of layouts that are perfect for representing task or activity duration, keeping track of all your deadlines at a glance. Tailor these designs to your exact needs and give them a truly corporate look with your own brand colors they will make your projects stand out from the rest This slide showcases graph highlighting impact analysis of prescriptive analytics on businesses via use of major performance indicators. It provides information total revenue, inventory levels and labour costs with key insights.

Segmentation Of Global Prescriptive Analytics Market Data Analytics SS V
This slide provides an overview of market segmentation of prescriptive analytics at a global level. It covers segmentation analysis based on region, data type, component and deployment with key takeaways.Take your projects to the next level with our ultimate collection of Segmentation Of Global Prescriptive Analytics Market Data Analytics SS V. Slidegeeks has designed a range of layouts that are perfect for representing task or activity duration, keeping track of all your deadlines at a glance. Tailor these designs to your exact needs and give them a truly corporate look with your own brand colors they will make your projects stand out from the rest This slide provides an overview of market segmentation of prescriptive analytics at a global level. It covers segmentation analysis based on region, data type, component and deployment with key takeaways.
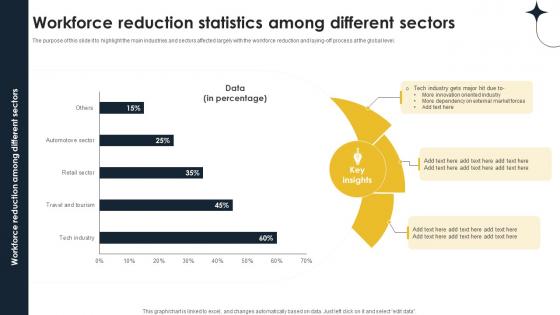
Workforce Reduction Statistics Among Different Implementing Personnel Downsizing Initiative
The purpose of this slide it to highlight the main industries and sectors affected largely with the workforce reduction and laying-off process at the global level. Take your projects to the next level with our ultimate collection of Workforce Reduction Statistics Among Different Implementing Personnel Downsizing Initiative. Slidegeeks has designed a range of layouts that are perfect for representing task or activity duration, keeping track of all your deadlines at a glance. Tailor these designs to your exact needs and give them a truly corporate look with your own brand colors they will make your projects stand out from the rest The purpose of this slide it to highlight the main industries and sectors affected largely with the workforce reduction and laying-off process at the global level.

Training Budget For Seamless Acceptance Testing PPT Template
This slide showcases the breakdown cost for the acceptance testing training for the testers which includes instructors cost, training materials cost and so on. Take your projects to the next level with our ultimate collection of Training Budget For Seamless Acceptance Testing PPT Template. Slidegeeks has designed a range of layouts that are perfect for representing task or activity duration, keeping track of all your deadlines at a glance. Tailor these designs to your exact needs and give them a truly corporate look with your own brand colors they will make your projects stand out from the rest This slide showcases the breakdown cost for the acceptance testing training for the testers which includes instructors cost, training materials cost and so on.

Portfolio Allocation Evaluation Based On Annual Return Investment Fund PPT PowerPoint
Mentioned slide provides information about evaluation of returns from various portfolio investment combination options.It includes returns KPIs such as average annual return, lowest returns, highest returns, past 20 years returns best and worst. Take your projects to the next level with our ultimate collection of Portfolio Allocation Evaluation Based On Annual Return Investment Fund PPT PowerPoint. Slidegeeks has designed a range of layouts that are perfect for representing task or activity duration, keeping track of all your deadlines at a glance. Tailor these designs to your exact needs and give them a truly corporate look with your own brand colors they will make your projects stand out from the rest Mentioned slide provides information about evaluation of returns from various portfolio investment combination options.It includes returns KPIs such as average annual return, lowest returns, highest returns, past 20 years returns best and worst.
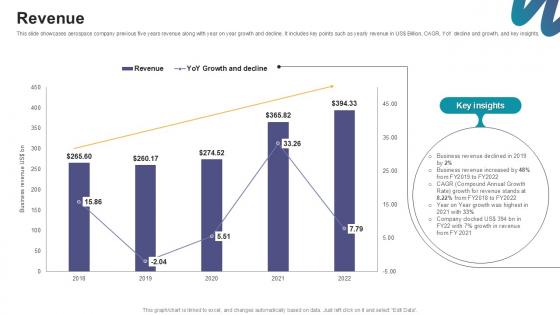
Revenue Digital Marketings Strategies PPT Sample CP SS V
This slide showcases aerospace company previous five years revenue along with year on year growth and decline. It includes key points such as yearly revenue in US Billion, CAGR, YoY decline and growth, and key insights. Take your projects to the next level with our ultimate collection of Revenue Digital Marketings Strategies PPT Sample CP SS V. Slidegeeks has designed a range of layouts that are perfect for representing task or activity duration, keeping track of all your deadlines at a glance. Tailor these designs to your exact needs and give them a truly corporate look with your own brand colors they will make your projects stand out from the rest This slide showcases aerospace company previous five years revenue along with year on year growth and decline. It includes key points such as yearly revenue in US Billion, CAGR, YoY decline and growth, and key insights.
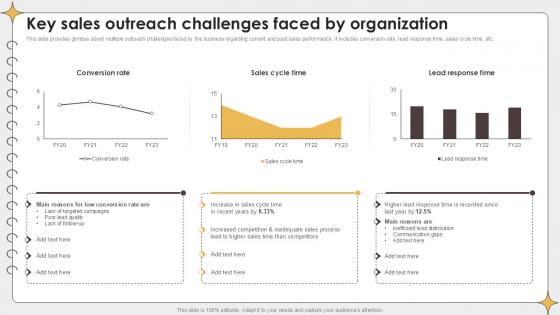
Key Sales Outreach Challenges Planning Outreach Campaigns PPT Example
This slide provides glimpse about multiple outreach challenges faced by the business regarding current and past sales performance. It includes conversion rate, lead response time, sales cycle time, etc. Take your projects to the next level with our ultimate collection of Key Sales Outreach Challenges Planning Outreach Campaigns PPT Example. Slidegeeks has designed a range of layouts that are perfect for representing task or activity duration, keeping track of all your deadlines at a glance. Tailor these designs to your exact needs and give them a truly corporate look with your own brand colors they will make your projects stand out from the rest This slide provides glimpse about multiple outreach challenges faced by the business regarding current and past sales performance. It includes conversion rate, lead response time, sales cycle time, etc.
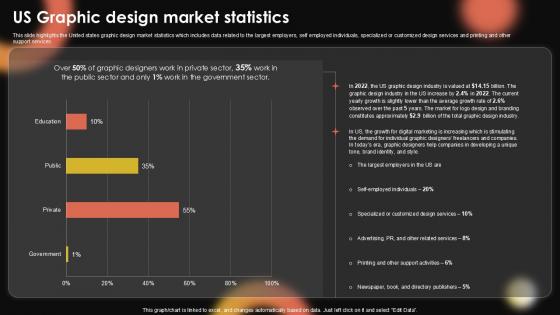
US Graphic Design Market Sample Pentagram Business Plan PPT Template BP SS V
This slide highlights the United states graphic design market statistics which includes data related to the largest employers, self employed individuals, specialized or customized design services and printing and other support services. Take your projects to the next level with our ultimate collection of US Graphic Design Market Sample Pentagram Business Plan PPT Template BP SS V. Slidegeeks has designed a range of layouts that are perfect for representing task or activity duration, keeping track of all your deadlines at a glance. Tailor these designs to your exact needs and give them a truly corporate look with your own brand colors they will make your projects stand out from the rest This slide highlights the United states graphic design market statistics which includes data related to the largest employers, self employed individuals, specialized or customized design services and printing and other support services.
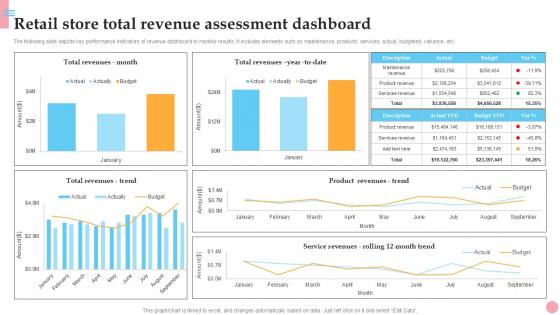
Retail Store Total Revenue Assessment How To Improve Company PPT Presentation Strategy SS V
The following slide depicts key performance indicators of revenue dashboard to monitor results. It includes elements such as maintenance, products, services, actual, budgeted, variance, etc. Take your projects to the next level with our ultimate collection of Retail Store Total Revenue Assessment How To Improve Company PPT Presentation Strategy SS V. Slidegeeks has designed a range of layouts that are perfect for representing task or activity duration, keeping track of all your deadlines at a glance. Tailor these designs to your exact needs and give them a truly corporate look with your own brand colors they will make your projects stand out from the rest The following slide depicts key performance indicators of revenue dashboard to monitor results. It includes elements such as maintenance, products, services, actual, budgeted, variance, etc.

Market Potential Plant Based Eggs Developing Company Investor PPT Example
This slide shows information regarding the market potential or opportunity available for the company in current market. It also includes details regarding compound annual growth rate. Take your projects to the next level with our ultimate collection of Market Potential Plant Based Eggs Developing Company Investor PPT Example. Slidegeeks has designed a range of layouts that are perfect for representing task or activity duration, keeping track of all your deadlines at a glance. Tailor these designs to your exact needs and give them a truly corporate look with your own brand colors they will make your projects stand out from the rest This slide shows information regarding the market potential or opportunity available for the company in current market. It also includes details regarding compound annual growth rate.

Human Resource Sickness And Absenteeism Monthly Report PPT PowerPoint SS
This slide represents the monthly sickness and absenteeism report prepared by the human resource department of the organization. It includes details related to the lost time, days total head count, cost of absences, sickness etc. Take your projects to the next level with our ultimate collection of Human Resource Sickness And Absenteeism Monthly Report PPT PowerPoint SS. Slidegeeks has designed a range of layouts that are perfect for representing task or activity duration, keeping track of all your deadlines at a glance. Tailor these designs to your exact needs and give them a truly corporate look with your own brand colors they will make your projects stand out from the rest This slide represents the monthly sickness and absenteeism report prepared by the human resource department of the organization. It includes details related to the lost time, days total head count, cost of absences, sickness etc.

Workforce Monthly Performance Report Of Human Resource Department PPT Example SS
This slide represents the monthly performance report of the employees prepared by the human resource department of the organization. It includes details related to the average score, best performer, worst performed, best and worst department, department review etc. Take your projects to the next level with our ultimate collection of Workforce Monthly Performance Report Of Human Resource Department PPT Example SS. Slidegeeks has designed a range of layouts that are perfect for representing task or activity duration, keeping track of all your deadlines at a glance. Tailor these designs to your exact needs and give them a truly corporate look with your own brand colors they will make your projects stand out from the rest This slide represents the monthly performance report of the employees prepared by the human resource department of the organization. It includes details related to the average score, best performer, worst performed, best and worst department, department review etc.
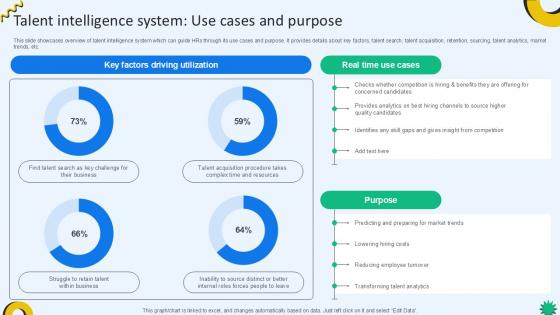
Talent Intelligence System Use Cases Cloud Recruiting Technologies PPT Slide
This slide showcases overview of talent intelligence system which can guide HRs through its use cases and purpose. It provides details about key factors, talent search, talent acquisition, retention, sourcing, talent analytics, market trends, etc. Take your projects to the next level with our ultimate collection of Talent Intelligence System Use Cases Cloud Recruiting Technologies PPT Slide. Slidegeeks has designed a range of layouts that are perfect for representing task or activity duration, keeping track of all your deadlines at a glance. Tailor these designs to your exact needs and give them a truly corporate look with your own brand colors they will make your projects stand out from the rest This slide showcases overview of talent intelligence system which can guide HRs through its use cases and purpose. It provides details about key factors, talent search, talent acquisition, retention, sourcing, talent analytics, market trends, etc.
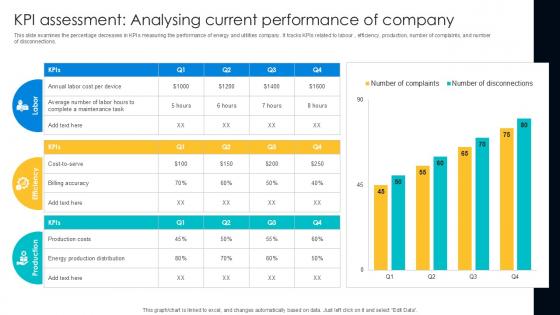
KPI Assessment Analysing Current Digital Transformation Journey PPT Slide DT SS V
This slide examines the percentage decreases in KPIs measuring the performance of energy and utilities company. It tracks KPIs related to labour , efficiency, production, number of complaints, and number of disconnections. Take your projects to the next level with our ultimate collection of KPI Assessment, Analysing Current Performance, Company. Slidegeeks has designed a range of layouts that are perfect for representing task or activity duration, keeping track of all your deadlines at a glance. Tailor these designs to your exact needs and give them a truly corporate look with your own brand colors they will make your projects stand out from the rest This slide examines the percentage decreases in KPIs measuring the performance of energy and utilities company. It tracks KPIs related to labour , efficiency, production, number of complaints, and number of disconnections.
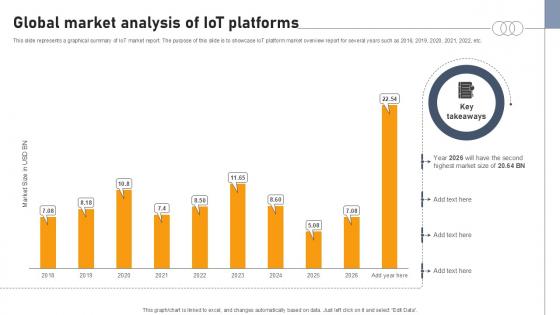
Global Market Analysis Of Iot Platforms Aws IOT Platform Ppt Template
This slide represents a graphical summary of IoT market report. The purpose of this slide is to showcase IoT platform market overview report for several years such as 2018, 2019, 2020, 2021, 2022, etc. Take your projects to the next level with our ultimate collection of Global Market Analysis Of Iot Platforms Aws IOT Platform Ppt Template Slidegeeks has designed a range of layouts that are perfect for representing task or activity duration, keeping track of all your deadlines at a glance. Tailor these designs to your exact needs and give them a truly corporate look with your own brand colors they will make your projects stand out from the rest This slide represents a graphical summary of IoT market report. The purpose of this slide is to showcase IoT platform market overview report for several years such as 2018, 2019, 2020, 2021, 2022, etc.
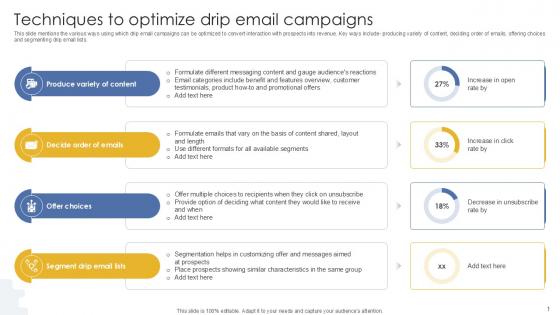
Techniques To Optimize Drip Email Campaigns PPT Sample MKT SS V
This slide mentions the various ways using which drip email campaigns can be optimized to convert interaction with prospects into revenue. Key ways include- producing variety of content, deciding order of emails, offering choices and segmenting drip email lists. Take your projects to the next level with our ultimate collection of Techniques To Optimize Drip Email Campaigns PPT Sample MKT SS V. Slidegeeks has designed a range of layouts that are perfect for representing task or activity duration, keeping track of all your deadlines at a glance. Tailor these designs to your exact needs and give them a truly corporate look with your own brand colors they will make your projects stand out from the rest This slide mentions the various ways using which drip email campaigns can be optimized to convert interaction with prospects into revenue. Key ways include- producing variety of content, deciding order of emails, offering choices and segmenting drip email lists.
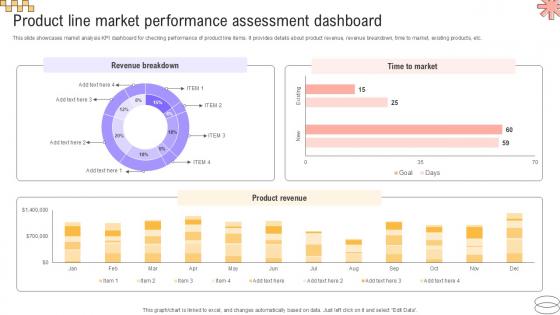
Product Line Market Performance Implementing Geographic Extension PPT Slide Strategy SS V
This slide showcases market analysis KPI dashboard for checking performance of product line items. It provides details about product revenue, revenue breakdown, time to market, existing products, etc. Take your projects to the next level with our ultimate collection of Product Line Market Performance Implementing Geographic Extension PPT Slide Strategy SS V. Slidegeeks has designed a range of layouts that are perfect for representing task or activity duration, keeping track of all your deadlines at a glance. Tailor these designs to your exact needs and give them a truly corporate look with your own brand colors they will make your projects stand out from the rest This slide showcases market analysis KPI dashboard for checking performance of product line items. It provides details about product revenue, revenue breakdown, time to market, existing products, etc.

Shareholder Ownership Structure Food Retailer Company Profile Ppt Sample CP SS V
Mentioned slide demonstrates McDonalds ownership distribution by number of shares held. It includes list of top shareholders, percentage of stakes held, and number of shares owned. Take your projects to the next level with our ultimate collection of Shareholder Ownership Structure Food Retailer Company Profile Ppt Sample CP SS V Slidegeeks has designed a range of layouts that are perfect for representing task or activity duration, keeping track of all your deadlines at a glance. Tailor these designs to your exact needs and give them a truly corporate look with your own brand colors they will make your projects stand out from the rest Mentioned slide demonstrates McDonalds ownership distribution by number of shares held. It includes list of top shareholders, percentage of stakes held, and number of shares owned.
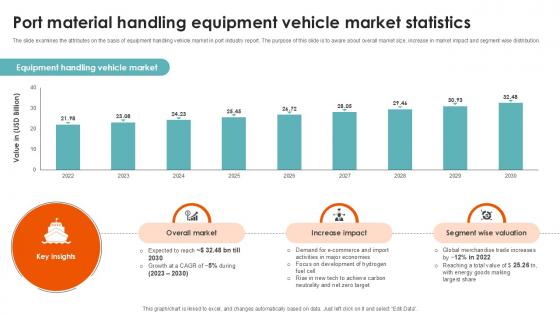
Port Material Handling Equipment Port Terminal Industry Ppt Example
The slide examines the attributes on the basis of equipment handling vehicle market in port industry report. The purpose of this slide is to aware about overall market size, increase in market impact and segment wise distribution.Take your projects to the next level with our ultimate collection of Port Material Handling Equipment Port Terminal Industry Ppt Example. Slidegeeks has designed a range of layouts that are perfect for representing task or activity duration, keeping track of all your deadlines at a glance. Tailor these designs to your exact needs and give them a truly corporate look with your own brand colors they will make your projects stand out from the rest The slide examines the attributes on the basis of equipment handling vehicle market in port industry report. The purpose of this slide is to aware about overall market size, increase in market impact and segment wise distribution.

Statistics Highlighting Food Packaging Effective Strategies For Strengthening Food Ppt Slide
The slide showcases statistics that represent positive impact of food packaging initiated on purchasing decisions made by consumers in marketplace. The slide contains points related to packaging design, labelling etc.Take your projects to the next level with our ultimate collection of Statistics Highlighting Food Packaging Effective Strategies For Strengthening Food Ppt Slide. Slidegeeks has designed a range of layouts that are perfect for representing task or activity duration, keeping track of all your deadlines at a glance. Tailor these designs to your exact needs and give them a truly corporate look with your own brand colors they will make your projects stand out from the rest The slide showcases statistics that represent positive impact of food packaging initiated on purchasing decisions made by consumers in marketplace. The slide contains points related to packaging design, labelling etc.
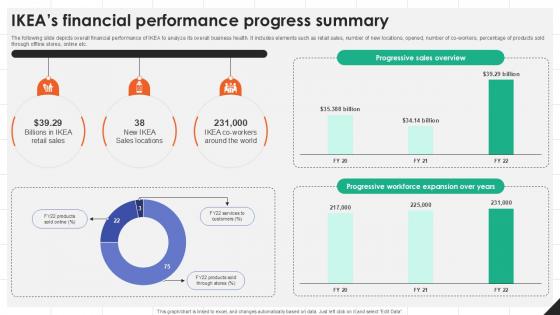
IKEAs Financial Performance Progress IKEAs Successful Market Expansion PPT Sample Strategy SS V
The following slide depicts overall financial performance of IKEA to analyze its overall business health. It includes elements such as retail sales, number of new locations, opened, number of co-workers, percentage of products sold through offline stores, online etc. Take your projects to the next level with our ultimate collection of IKEAs Financial Performance Progress IKEAs Successful Market Expansion PPT Sample Strategy SS V. Slidegeeks has designed a range of layouts that are perfect for representing task or activity duration, keeping track of all your deadlines at a glance. Tailor these designs to your exact needs and give them a truly corporate look with your own brand colors they will make your projects stand out from the rest The following slide depicts overall financial performance of IKEA to analyze its overall business health. It includes elements such as retail sales, number of new locations, opened, number of co-workers, percentage of products sold through offline stores, online etc.
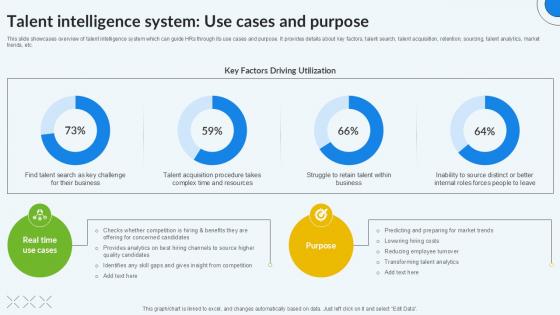
Talent Intelligence System Use Enhancing Recruitment Process PPT Presentation
This slide showcases overview of talent intelligence system which can guide HRs through its use cases and purpose. It provides details about key factors, talent search, talent acquisition, retention, sourcing, talent analytics, market trends, etc. Take your projects to the next level with our ultimate collection of Talent Intelligence System Use Enhancing Recruitment Process PPT Presentation. Slidegeeks has designed a range of layouts that are perfect for representing task or activity duration, keeping track of all your deadlines at a glance. Tailor these designs to your exact needs and give them a truly corporate look with your own brand colors they will make your projects stand out from the rest This slide showcases overview of talent intelligence system which can guide HRs through its use cases and purpose. It provides details about key factors, talent search, talent acquisition, retention, sourcing, talent analytics, market trends, etc.
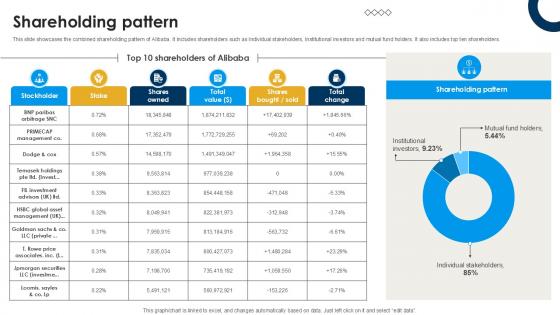
Shareholding Pattern International Trade Of Products And Services PPT PowerPoint CP SS V
This slide showcases the combined shareholding pattern of Alibaba. It includes shareholders such as Individual stakeholders, Institutional investors and mutual fund holders. It also includes top ten shareholders. Take your projects to the next level with our ultimate collection of Shareholding Pattern International Trade Of Products And Services PPT PowerPoint CP SS V. Slidegeeks has designed a range of layouts that are perfect for representing task or activity duration, keeping track of all your deadlines at a glance. Tailor these designs to your exact needs and give them a truly corporate look with your own brand colors they will make your projects stand out from the rest This slide showcases the combined shareholding pattern of Alibaba. It includes shareholders such as Individual stakeholders, Institutional investors and mutual fund holders. It also includes top ten shareholders.
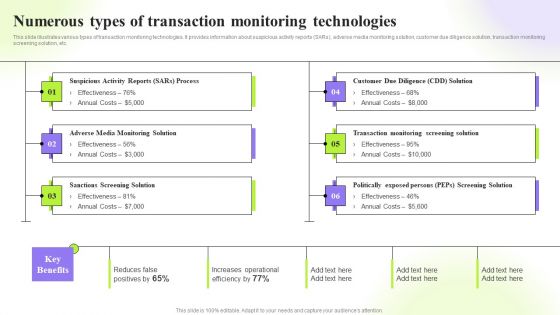
Techniques To Monitor Transactions Numerous Types Of Transaction Monitoring Technologies Diagrams PDF
This slide illustrates various types of transaction monitoring technologies. It provides information about suspicious activity reports SARs, adverse media monitoring solution, customer due diligence solution, transaction monitoring screening solution, etc. Here you can discover an assortment of the finest PowerPoint and Google Slides templates. With these templates, you can create presentations for a variety of purposes while simultaneously providing your audience with an eye-catching visual experience. Download Techniques To Monitor Transactions Numerous Types Of Transaction Monitoring Technologies Diagrams PDF to deliver an impeccable presentation. These templates will make your job of preparing presentations much quicker, yet still, maintain a high level of quality. Slidegeeks has experienced researchers who prepare these templates and write high-quality content for you. Later on, you can personalize the content by editing the Techniques To Monitor Transactions Numerous Types Of Transaction Monitoring Technologies Diagrams PDF.
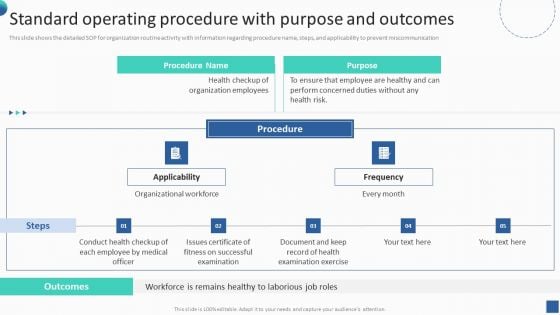
Bundle Of SOP Templates Standard Operating Procedure With Purpose And Outcomes Diagrams PDF
This slide shows the detailed SOP for organization routine activity with information regarding procedure name, steps, and applicability to prevent miscommunication. Get a simple yet stunning designed Bundle Of SOP Templates Standard Operating Procedure With Purpose And Outcomes Diagrams PDF. It is the best one to establish the tone in your meetings. It is an excellent way to make your presentations highly effective. So, download this PPT today from Slidegeeks and see the positive impacts. Our easy to edit Bundle Of SOP Templates Standard Operating Procedure With Purpose And Outcomes Diagrams PDF can be your go to option for all upcoming conferences and meetings. So, what are you waiting for Grab this template today.


 Continue with Email

 Home
Home


