Agenda Images
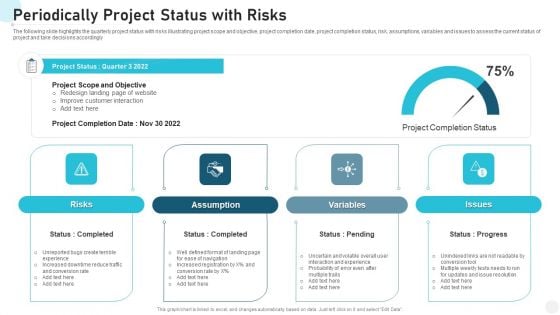
Periodically Project Status With Risks Designs PDF
The following slide highlights the quarterly project status with risks illustrating project scope and objective, project completion date, project completion status, risk, assumptions, variables and issues to assess the current status of project and take decisions accordingly Pitch your topic with ease and precision using this periodically project status with risks designs pdf. This layout presents information on risks, assumption, variables, issues. It is also available for immediate download and adjustment. So, changes can be made in the color, design, graphics or any other component to create a unique layout.
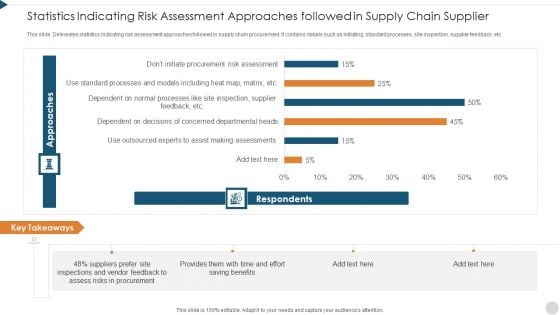
Statistics Indicating Risk Assessment Approaches Followed In Supply Chain Supplier Designs PDF
This slide. Delineates statistics indicating risk assessment approaches followed in supply chain procurement. It contains details such as initiating, standard processes, site inspection, supplier feedback, etc. Pitch your topic with ease and precision using this statistics indicating risk assessment approaches followed in supply chain supplier designs pdf. This layout presents information on key takeaways, approaches, respondents. It is also available for immediate download and adjustment. So, changes can be made in the color, design, graphics or any other component to create a unique layout.
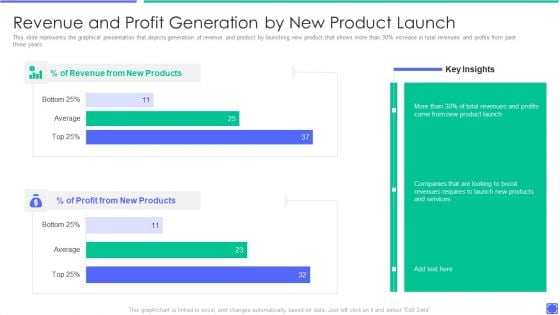
Best Techniques To Enhance New Product Management Efficiency Revenue And Profit Generation Demonstration PDF
This slide represents the graphical presentation that depicts generation of revenue and product by launching new product that shows more than 30 parcent increase in total revenues and profits from past three years. Deliver an awe inspiring pitch with this creative best techniques to enhance new product management efficiency product development tools clipart pdf bundle. Topics like revenue and profit generation by new product launch can be discussed with this completely editable template. It is available for immediate download depending on the needs and requirements of the user.
Supplier Compensation Due Tracking Dashboard With Paid Invoices Topics PDF
This slide showcases dashboard that can help organization to track the outstanding payment of different vendors and take timely action in case of delay. Its key elements are due by age summary, top 5 vendor by purchases, top 5 vendors by amount due and total invoice vs paid invoices. Pitch your topic with ease and precision using this supplier compensation due tracking dashboard with paid invoices topics pdf. This layout presents information on supplier compensation due tracking dashboard with paid invoices. It is also available for immediate download and adjustment. So, changes can be made in the color, design, graphics or any other component to create a unique layout.

Supplier Performance Dashboard With Compensation Status Themes PDF
This slide showcases payment performance dashboard that can help organization to analyze the outstanding amount by different vendors and impose necessary restrictions in case of any delay. Its key components are amount paid early, total money paid, paid on time and paid late. Pitch your topic with ease and precision using this supplier performance dashboard with compensation status themes pdf. This layout presents information on supplier performance dashboard with compensation status. It is also available for immediate download and adjustment. So, changes can be made in the color, design, graphics or any other component to create a unique layout.
Application Sources For Recruitment On Social Media Tracking Dashboard Microsoft PDF
This slide covers the dashboard for tracking the count of applicants profiles from various sources. It includes the open positions, new roles, total roles, candidates placed , application sources, client decline rates and commission received. Pitch your topic with ease and precision using this application sources for recruitment on social media tracking dashboard microsoft pdf. This layout presents information on application sources for recruitment on social media tracking dashboard. It is also available for immediate download and adjustment. So, changes can be made in the color, design, graphics or any other component to create a unique layout.

Social Media Platforms Used By Recruitment Managers For Hiring Summary PDF
This slide depicts the various social networking sites for both jobs and job candidates. It includes Facebook, LinkedIn, Instagram , twitter and Google plus. Pitch your topic with ease and precision using this social media platforms used by recruitment managers for hiring summary pdf. This layout presents information on social media platforms used by recruitment managers for hiring. It is also available for immediate download and adjustment. So, changes can be made in the color, design, graphics or any other component to create a unique layout.
Dashboard For Tracking Logistics Management Strategy Results Ideas PDF
This slide covers a dashboard for tracking the logistics operations KPIs. It includes metrics such as warehousing operating cost, perfect order rate, total shipments by areas, on time shipments, etc. Pitch your topic with ease and precision using this dashboard for tracking logistics management strategy results ideas pdf. This layout presents information on cost, warehouse, rate. It is also available for immediate download and adjustment. So, changes can be made in the color, design, graphics or any other component to create a unique layout.
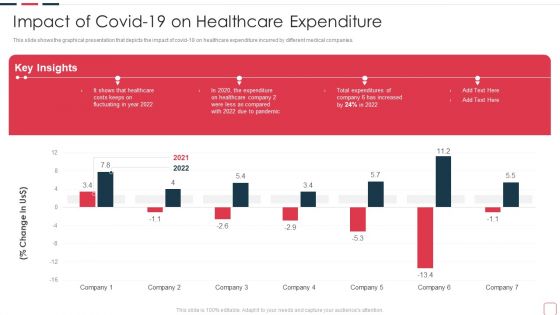
Price Benefit Internet Things Digital Twins Execution After Covid Impact Of Covid 19 On Healthcare Template PDF
This slide shows the graphical presentation that depicts the impact of covid 19 on healthcare expenditure incurred by different medical companies. Deliver and pitch your topic in the best possible manner with this price benefit internet things digital twins execution after covid impact of covid 19 on healthcare template pdf . Use them to share invaluable insights on impact of covid 19 on healthcare expenditure and impress your audience. This template can be altered and modified as per your expectations. So, grab it now.
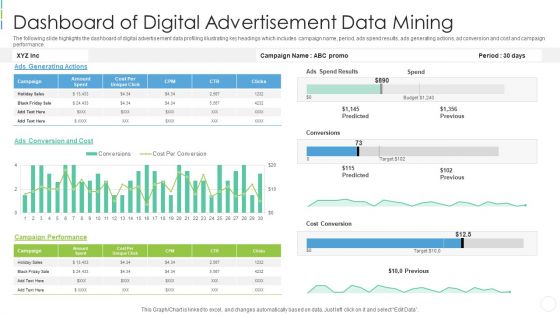
Dashboard Of Digital Advertisement Data Mining Professional PDF
The following slide highlights the dashboard of digital advertisement data profiling illustrating key headings which includes campaign name, period, ads spend results, ads generating actions, ad conversion and cost and campaign performance. Pitch your topic with ease and precision using this dashboard of digital advertisement data mining professional pdf . This layout presents information on dashboard of digital advertisement data mining . It is also available for immediate download and adjustment. So, changes can be made in the color, design, graphics or any other component to create a unique layout.
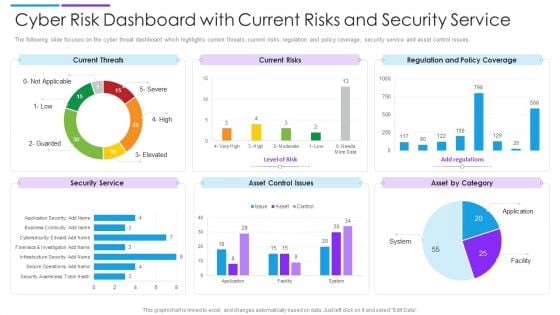
Cyber Risk Dashboard With Current Risks And Security Service Formats PDF
The following slide focuses on the cyber threat dashboard which highlights current threats, current risks, regulation and policy coverage, security service and asset control issues. Pitch your topic with ease and precision using this cyber risk dashboard with current risks and security service formats pdf. This layout presents information on current threats, current risks, regulation and policy coverage. It is also available for immediate download and adjustment. So, changes can be made in the color, design, graphics or any other component to create a unique layout.
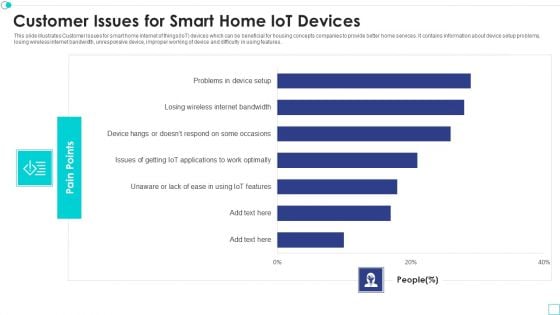
Customer Issues For Smart Home Iot Devices Designs PDF
This slide illustrates Customer Issues for smart home internet of things IoT devices which can be beneficial for housing concepts companies to provide better home services. It contains information about device setup problems, losing wireless internet bandwidth, unresponsive device, improper working of device and difficulty in using features. Pitch your topic with ease and precision using this stomer issues for smart home iot devices designs pdf. This layout presents information on customer issues for smart home iot devices. It is also available for immediate download and adjustment. So, changes can be made in the color, design, graphics or any other component to create a unique layout.
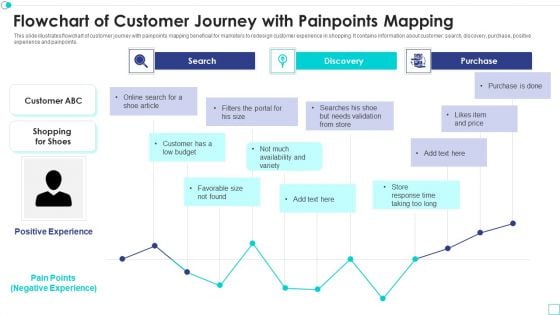
Flowchart Of Customer Journey With Painpoints Mapping Download PDF
This slide illustrates flowchart of customer journey with painpoints mapping beneficial for marketers to redesign customer experience in shopping. It contains information about customer, search, discovery, purchase, positive experience and painpoints. Pitch your topic with ease and precision using this flowchart of customer journey with painpoints mapping download pdf. This layout presents information on flowchart of customer journey with painpoints mapping. It is also available for immediate download and adjustment. So, changes can be made in the color, design, graphics or any other component to create a unique layout.
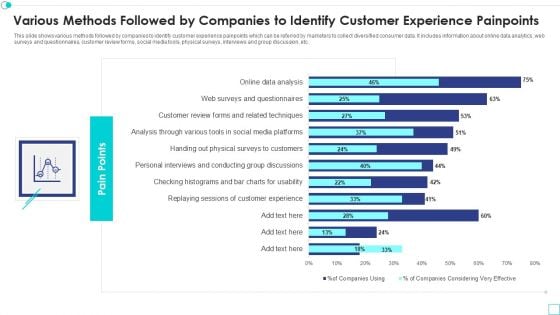
Various Methods Followed By Companies To Identify Customer Experience Painpoints Designs PDF
This slide shows various methods followed by companies to identify customer experience painpoints which can be referred by marketers to collect diversified consumer data. It includes information about online data analytics, web surveys and questionnaires, customer review forms, social media tools, physical surveys, interviews and group discussion, etc. Pitch your topic with ease and precision using this various methods followed by companies to identify customer experience painpoints designs pdf. This layout presents information on various methods followed by companies to identify customer experience painpoints. It is also available for immediate download and adjustment. So, changes can be made in the color, design, graphics or any other component to create a unique layout.
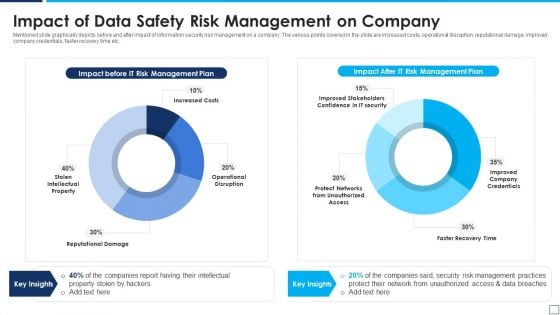
Impact Of Data Safety Risk Management On Company Guidelines PDF
Mentioned slide graphically depicts before and after impact of information security risk management on a company. The various points covered in the slide are increased costs, operational disruption, reputational damage, improved company credentials, faster recovery time etc. Showcasing this set of slides titled impact of data safety risk management on company guidelines pdf. The topics addressed in these templates are impact of data safety risk management on company. All the content presented in this PPT design is completely editable. Download it and make adjustments in color, background, font etc. as per your unique business setting.
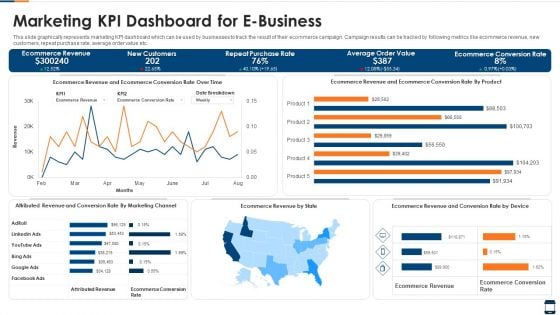
Marketing KPI Dashboard For E Business Brochure PDF
This slide graphically represents marketing KPI dashboard which can be used by businesses to track the result of their ecommerce campaign. Campaign results can be tracked by following metrics like ecommerce revenue, new customers, repeat purchase rate, average order value etc. Showcasing this set of slides titled marketing kpi dashboard for e business brochure pdf. The topics addressed in these templates are marketing kpi dashboard for e business. All the content presented in this PPT design is completely editable. Download it and make adjustments in color, background, font etc. as per your unique business setting.
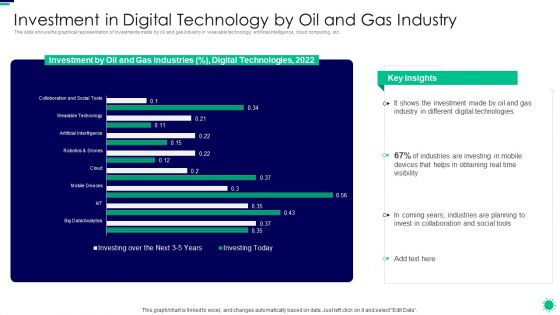
Purpose Digital Twin Internet Things Reducing Costs After COVID Era Investment In Digital Technology Information PDF
This slide shows the graphical representation of investments made by oil and gas industry in wearable technology, artificial intelligence, cloud computing, etc.Deliver and pitch your topic in the best possible manner with this purpose digital twin internet things reducing costs after covid era investment in digital technology information pdf. Use them to share invaluable insights on investment in digital technology by oil and gas industry and impress your audience. This template can be altered and modified as per your expectations. So, grab it now.
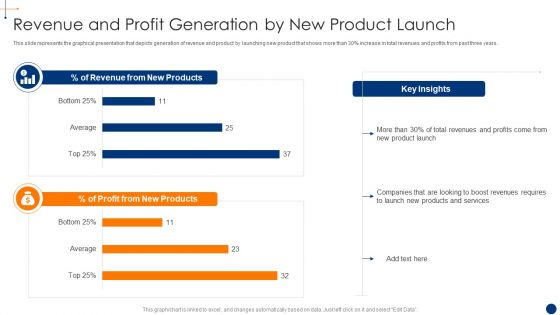
New Product Development Process Optimization Revenue And Profit Generation Introduction PDF
This slide represents the graphical presentation that depicts generation of revenue and product by launching new product that shows more than 30 per cent increase in total revenues and profits from past three years. Deliver and pitch your topic in the best possible manner with this new product development process optimization revenue and profit generation introduction pdf . Use them to share invaluable insights on product development budget and spending and impress your audience. This template can be altered and modified as per your expectations. So, grab it now.
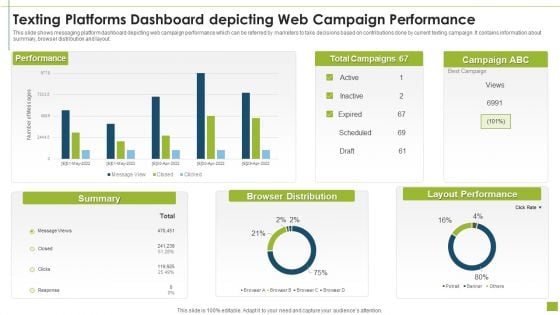
Texting Platforms Dashboard Depicting Web Campaign Performance Pictures PDF
This slide shows messaging platform dashboard depicting web campaign performance which can be referred by marketers to take decisions based on contributions done by current texting campaign. It contains information about summary, browser distribution and layout.Pitch your topic with ease and precision using this texting platforms dashboard depicting web campaign performance pictures pdf This layout presents information on browser distribution, layout performance, summary It is also available for immediate download and adjustment. So, changes can be made in the color, design, graphics or any other component to create a unique layout.
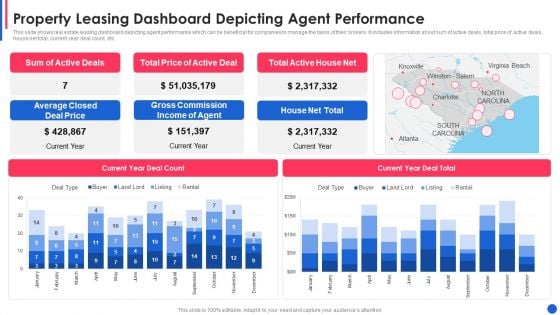
Property Leasing Dashboard Depicting Agent Performance Guidelines PDF
This slide shows real estate leasing dashboard depicting agent performance which can be beneficial for companies to manage the tasks of their brokers. It includes information about sum of active deals, total price of active deals, house net total, current year deal count, etc.Pitch your topic with ease and precision using this property leasing dashboard depicting agent performance guidelines pdf This layout presents information on average closed deal price, gross commission income, total active house net It is also available for immediate download and adjustment. So, changes can be made in the color, design, graphics or any other component to create a unique layout.
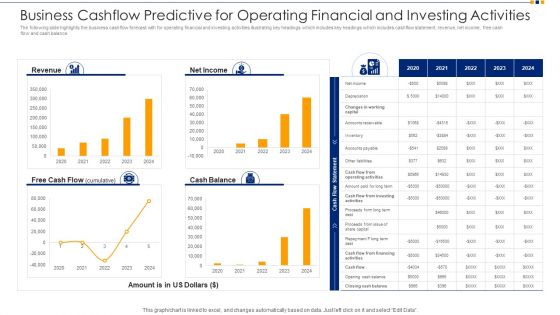
Business Cashflow Predictive For Operating Financial And Investing Activities Ppt Inspiration Infographic Template PDF
The following slide highlights the business cashflow forecast with for operating financial and investing activities illustrating key headings which includes key headings which includes cashflow statement, revenue, net income, free cash flow and cash balance. Pitch your topic with ease and precision using this business cashflow predictive for operating financial and investing activities ppt inspiration infographic template pdf. This layout presents information on revenue, net income, free cash flow, cash balance, 2020 to 2024. It is also available for immediate download and adjustment. So, changes can be made in the color, design, graphics or any other component to create a unique layout.
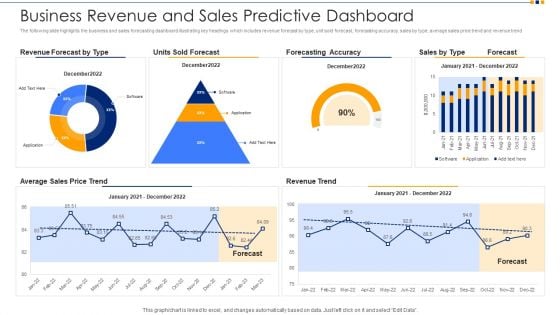
Business Revenue And Sales Predictive Dashboard Ppt Inspiration Background Designs PDF
The following slide highlights the business and sales forecasting dashboard illustrating key headings which includes revenue forecast by type, unit sold forecast, forecasting accuracy, sales by type, average sales price trend and revenue trend. Pitch your topic with ease and precision using this business revenue and sales predictive dashboard ppt inspiration background designs pdf. This layout presents information on revenue forecast by type, units sold forecast, forecasting accuracy, average sales price trend, revenue trend. It is also available for immediate download and adjustment. So, changes can be made in the color, design, graphics or any other component to create a unique layout.
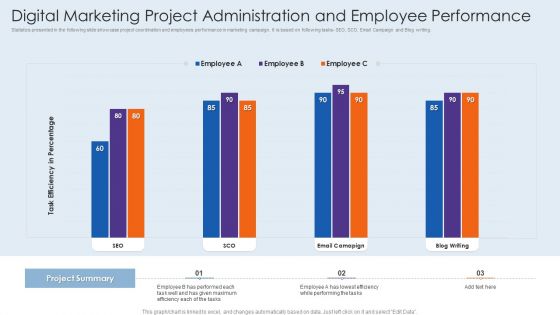
Digital Marketing Project Administration And Employee Performance Guidelines PDF
Statistics presented in the following slide showcase project coordination and employees performance in marketing campaign. It is based on following tasks SEO, SCO, Email Campaign and Blog writing. Pitch your topic with ease and precision using this digital marketing project administration and employee performance guidelines pdf. This layout presents information on digital marketing project administration and employee performance. It is also available for immediate download and adjustment. So, changes can be made in the color, design, graphics or any other component to create a unique layout.
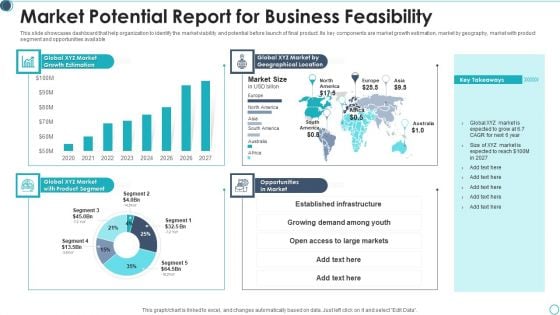
Market Potential Report For Business Feasibility Pictures PDF
This slide showcases dashboard that help organization to identify the market viability and potential before launch of final product. Its key components are market growth estimation, market by geography, market with product segment and opportunities available Pitch your topic with ease and precision using this market potential report for business feasibility pictures pdf This layout presents information on geographical location, opportunities in market, growth estimation It is also available for immediate download and adjustment. So, changes can be made in the color, design, graphics or any other component to create a unique layout.
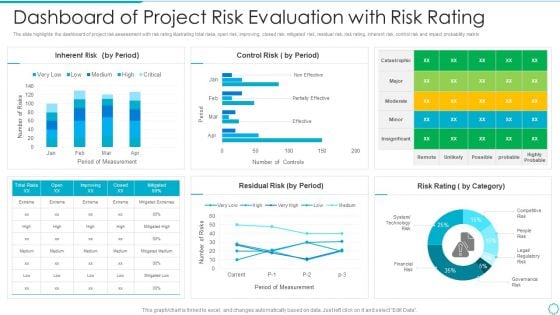
Dashboard Of Project Risk Evaluation With Risk Rating Pictures PDF
The slide highlights the dashboard of project risk assessment with risk rating illustrating total risks, open risk, improving, closed risk, mitigated risk, residual risk, risk rating, inherent risk, control risk and impact probability matrixPitch your topic with ease and precision using this dashboard of project risk evaluation with risk rating pictures pdf This layout presents information on dashboard of project risk evaluation with risk rating It is also available for immediate download and adjustment. So, changes can be made in the color, design, graphics or any other component to create a unique layout.
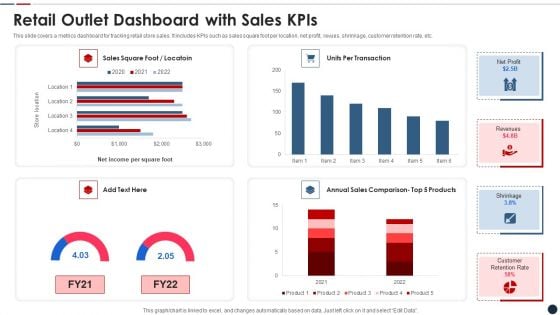
Retail Outlet Dashboard With Sales Kpis Clipart PDF
This slide covers a metrics dashboard for tracking retail store sales. It includes KPIs such as sales square foot per location, net profit, revues, shrinkage, customer retention rate, etc. Pitch your topic with ease and precision using this retail outlet dashboard with sales kpis clipart pdf This layout presents information on Retail outlet dashboard with sales kpis It is also available for immediate download and adjustment. So, changes can be made in the color, design, graphics or any other component to create a unique layout.
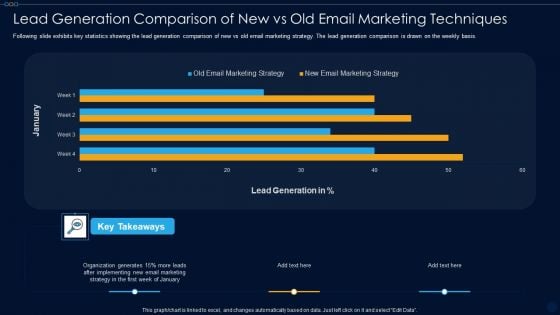
Lead Generation Comparison Of New Vs Old Email Marketing Techniques Ppt PowerPoint Presentation File Slides PDF
Following slide exhibits key statistics showing the lead generation comparison of new vs old email marketing strategy. The lead generation comparison is drawn on the weekly basis. Pitch your topic with ease and precision using this lead generation comparison of new vs old email marketing techniques ppt powerpoint presentation file slides pdf. This layout presents information on lead generation, organization generates, new email marketing strategy, old email marketing strategy. It is also available for immediate download and adjustment. So, changes can be made in the color, design, graphics or any other component to create a unique layout.
OEM Spare Parts Sales Tracking Dashboard Ppt PowerPoint Presentation Gallery Inspiration PDF
This slide showcases dashboard that can help organization to keep track of aftermarket components sales. Its key elements are sold quantity per spare part and deviation of sold units. Pitch your topic with ease and precision using this oem spare parts sales tracking dashboard ppt powerpoint presentation gallery inspiration pdf. This layout presents information on sold quantity, budgeted quantity, quantity ytd ly. It is also available for immediate download and adjustment. So, changes can be made in the color, design, graphics or any other component to create a unique layout.
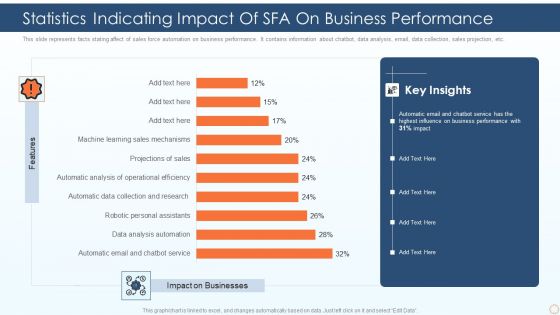
Statistics Indicating Impact Of SFA On Business Performance Ppt PowerPoint Presentation Gallery Outfit PDF
This slide represents facts stating affect of sales force automation on business performance. It contains information about chatbot, data analysis, email, data collection, sales projection, etc. Pitch your topic with ease and precision using this statistics indicating impact of sfa on business performance ppt powerpoint presentation gallery outfit pdf. This layout presents information on automatic email and chatbot service, data analysis automation, robotic personal assistants. It is also available for immediate download and adjustment. So, changes can be made in the color, design, graphics or any other component to create a unique layout.
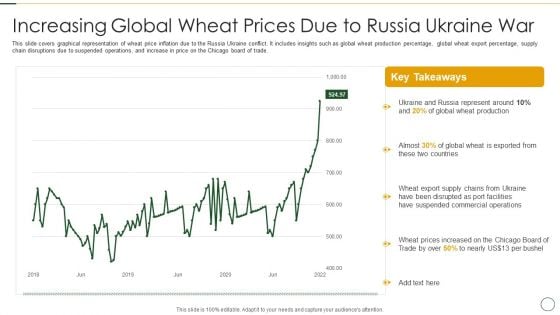
Analyzing The Impact Of Russia Ukraine Conflict On Agriculture Sector Increasing Global Wheat Professional PDF
This slide covers graphical representation of wheat price inflation due to the Russia Ukraine conflict. It includes insights such as global wheat production percentage, global wheat export percentage, supply chain disruptions due to suspended operations, and increase in price on the Chicago board of trade. Deliver an awe inspiring pitch with this creative analyzing the impact of russia ukraine conflict on agriculture sector increasing global wheat professional pdf bundle. Topics like russia represent around, global wheat production, suspended commercial operations can be discussed with this completely editable template. It is available for immediate download depending on the needs and requirements of the user.
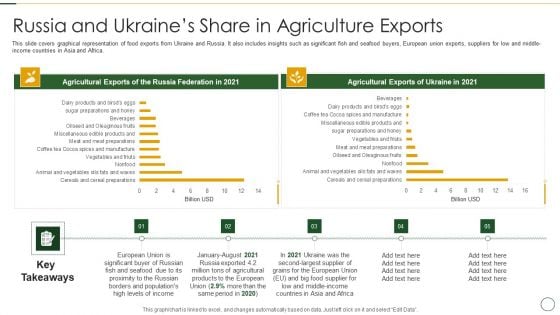
Analyzing The Impact Of Russia Ukraine Conflict On Agriculture Sector Russia And Ukraines Formats PDF
This slide covers graphical representation of food exports from Ukraine and Russia. It also includes insights such as significant fish and seafood buyers, European union exports, suppliers for low and middle income countries in Asia and Africa. Deliver and pitch your topic in the best possible manner with this analyzing the impact of russia ukraine conflict on agriculture sector russia and ukraines formats pdf Use them to share invaluable insights on agricultural exports, russia federation, significant buyer of russian and impress your audience. This template can be altered and modified as per your expectations. So, grab it now.
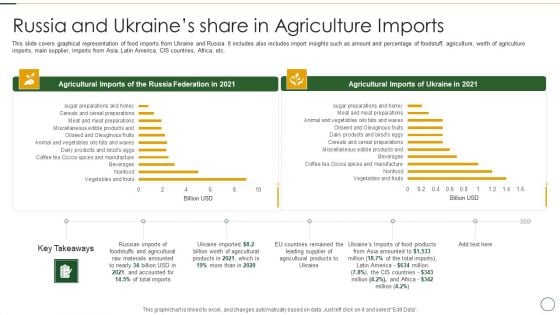
Analyzing The Impact Of Russia Ukraine Conflict On Agriculture Sector Russia Rules PDF
This slide covers graphical representation of food imports from Ukraine and Russia. It includes also includes import insights such as amount and percentage of foodstuff, agriculture, worth of agriculture imports, main supplier, imports from Asia, Latin America, CIS countries, Africa, etc.Deliver and pitch your topic in the best possible manner with this analyzing the impact of russia ukraine conflict on agriculture sector russia rules pdf Use them to share invaluable insights on russia and ukraines share in agriculture imports and impress your audience. This template can be altered and modified as per your expectations. So, grab it now.
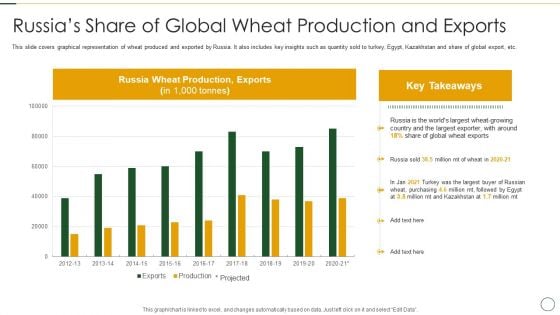
Analyzing The Impact Of Russia Ukraine Conflict On Agriculture Sector Russias Share Information PDF
This slide covers graphical representation of wheat produced and exported by Russia. It also includes key insights such as quantity sold to turkey, Egypt, Kazakhstan and share of global export, etc.Deliver an awe inspiring pitch with this creative analyzing the impact of russia ukraine conflict on agriculture sector russias share information pdf bundle. Topics like russias share of global wheat production and exports can be discussed with this completely editable template. It is available for immediate download depending on the needs and requirements of the user.
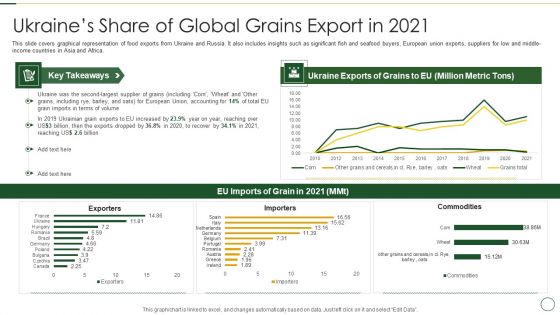
Analyzing The Impact Of Russia Ukraine Conflict On Agriculture Sector Ukraines Share Of Global Background PDF
This slide covers graphical representation of food exports from Ukraine and Russia. It also includes insights such as significant fish and seafood buyers, European union exports, suppliers for low and middle income countries in Asia and Africa. Deliver an awe inspiring pitch with this creative analyzing the impact of russia ukraine conflict on agriculture sector ukraines share of global background pdf bundle. Topics like exports of sunflower oil, importers of sunflower, demand for sunflower can be discussed with this completely editable template. It is available for immediate download depending on the needs and requirements of the user.
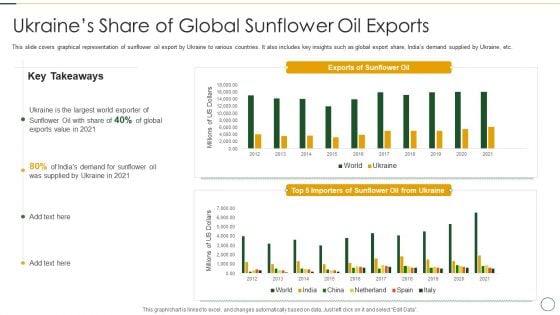
Analyzing The Impact Of Russia Ukraine Conflict On Agriculture Sector Ukraines Share Brochure PDF
This slide covers graphical representation of sunflower oil export by Ukraine to various countries. It also includes key insights such as global export share, Indias demand supplied by Ukraine, etc. Deliver an awe inspiring pitch with this creative analyzing the impact of russia ukraine conflict on agriculture sector ukraines share brochure pdf bundle. Topics like ukraines share of global grains export in 2021 can be discussed with this completely editable template. It is available for immediate download depending on the needs and requirements of the user.
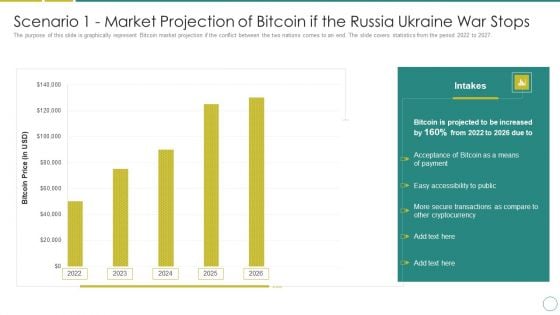
Russia Ukraine Scenario 1 Market Projection Of Bitcoin If The Russia Ukraine War Stops Infographics PDF
The purpose of this slide is graphically represent Bitcoin market projection if the conflict between the two nations comes to an end. The slide covers statistics from the period 2022 to 2027. Deliver and pitch your topic in the best possible manner with this russia ukraine scenario 1 market projection of bitcoin if the russia ukraine war stops infographics pdf. Use them to share invaluable insights on bitcoin price, 2022 to 2024 and impress your audience. This template can be altered and modified as per your expectations. So, grab it now.

Cyber Phishing Scams And Attacks Dashboard With Improvement Curve Sample PDF
Mentioned slide showcases a comprehensive dashboard used to measure the cyber phishing attacks. Information covered in this slide is related to organization health risk, attack vendors, most vulnerable employees to attacks, improvement curve. Pitch your topic with ease and precision using this cyber phishing scams and attacks dashboard with improvement curve sample pdf. This layout presents information on cyber phishing scams and attacks dashboard with improvement curve. It is also available for immediate download and adjustment. So, changes can be made in the color, design, graphics or any other component to create a unique layout.
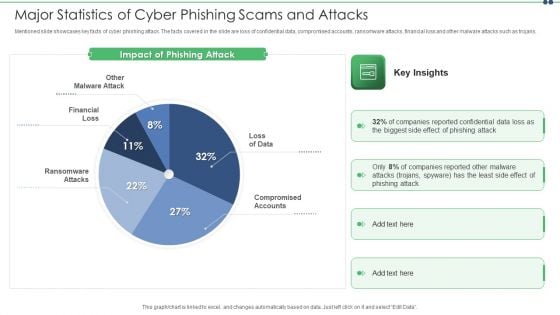
Major Statistics Of Cyber Phishing Scams And Attacks Designs PDF
Mentioned slide showcases key facts of cyber phishing attack. The facts covered in the slide are loss of confidential data, compromised accounts, ransomware attacks, financial loss and other malware attacks such as trojans. Pitch your topic with ease and precision using this major statistics of cyber phishing scams and attacks designs pdf. This layout presents information on major statistics of cyber phishing scams and attacks. It is also available for immediate download and adjustment. So, changes can be made in the color, design, graphics or any other component to create a unique layout.
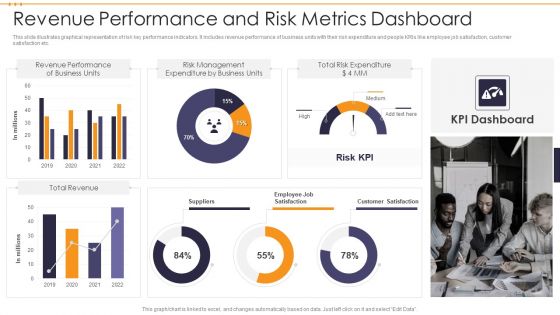
Revenue Performance And Risk Metrics Dashboard Demonstration PDF
This slide illustrates graphical representation of risk key performance indicators. It includes revenue performance of business units with their risk expenditure and people KRIs like employee job satisfaction, customer satisfaction etc. Showcasing this set of slides titled Revenue Performance And Risk Metrics Dashboard Demonstration PDF. The topics addressed in these templates are Total Risk Expenditure, Risk Management, Revenue Performance . All the content presented in this PPT design is completely editable. Download it and make adjustments in color, background, font etc. as per your unique business setting.
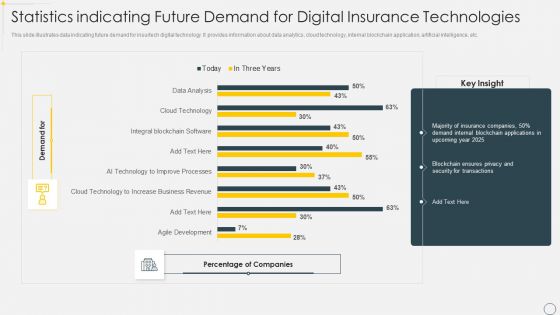
Statistics Indicating Future Demand For Digital Insurance Technologies Brochure PDF
This slide illustrates data indicating future demand for insurtech digital technology. It provides information about data analytics, cloud technology, internal blockchain application, artificial intelligence, etc. Pitch your topic with ease and precision using this Statistics Indicating Future Demand For Digital Insurance Technologies Brochure PDF. This layout presents information on Data Analytics, Cloud Technology, Internal Blockchain Application. It is also available for immediate download and adjustment. So, changes can be made in the color, design, graphics or any other component to create a unique layout.
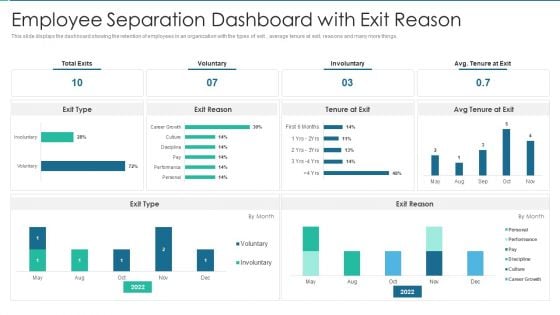
Employee Separation Dashboard With Exit Reason Rules PDF
This slide displays the dashboard showing the retention of employees in an organization with the types of exit , average tenure at exit, reasons and many more things. Pitch your topic with ease and precision using this Employee Separation Dashboard With Exit Reason Rules PDF This layout presents information on Employee Separation Dashboard With Exit Reason It is also available for immediate download and adjustment. So, changes can be made in the color, design, graphics or any other component to create a unique layout.
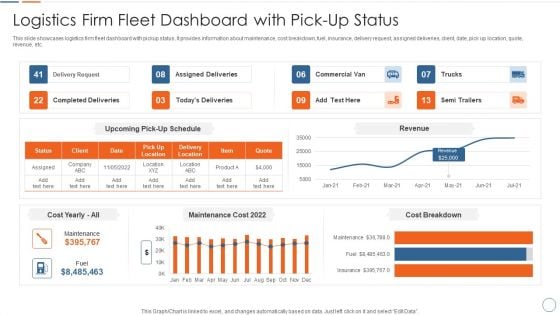
Logistics Firm Fleet Dashboard With Pick Up Status Introduction PDF
This slide showcases logistics firm fleet dashboard with pickup status. It provides information about maintenance, cost breakdown, fuel, insurance, delivery request, assigned deliveries, client, date, pick up location, quote, revenue, etc. Pitch your topic with ease and precision using this Logistics Firm Fleet Dashboard With Pick Up Status Introduction PDF. This layout presents information on Logistics Firm Fleet Dashboard With Pick Up Status. It is also available for immediate download and adjustment. So, changes can be made in the color, design, graphics or any other component to create a unique layout.
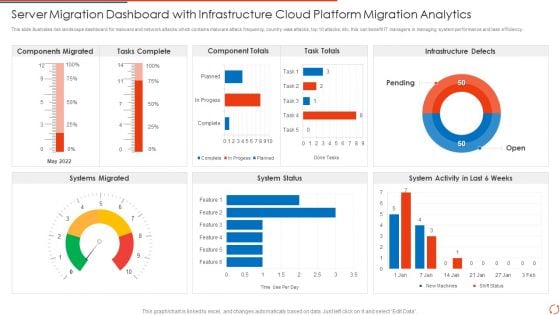
Server Migration Dashboard With Infrastructure Cloud Platform Migration Analytics Elements PDF Portrait PDF
This slide illustrates risk landscape dashboard for malware and network attacks which contains malware attack frequency, country wise attacks, top 10 attacks, etc. this can benefit IT managers in managing system performance and task efficiency Pitch your topic with ease and precision using this Server Migration Dashboard With Infrastructure Cloud Platform Migration Analytics Elements PDF Portrait PDF. This layout presents information on Tasks Complete, Component Totals, Task Totals. It is also available for immediate download and adjustment. So, changes can be made in the color, design, graphics or any other component to create a unique layout.
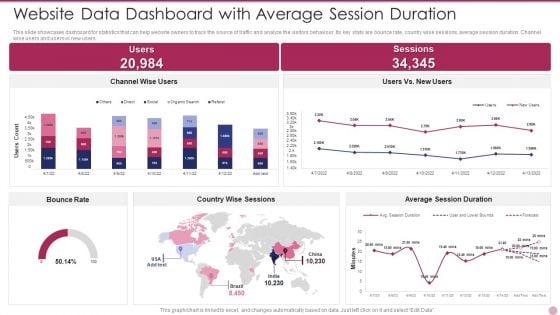
Website Data Dashboard With Average Session Duration Ideas PDF
This slide showcases dashboard for statistics that can help website owners to track the source of traffic and analyze the visitors behaviour. Its key stats are bounce rate, country wise sessions, average session duration. Channel wise users and users vs new users. Pitch your topic with ease and precision using this Website Data Dashboard With Average Session Duration Ideas PDF. This layout presents information on Website Data Dashboard With Average Session Duration. It is also available for immediate download and adjustment. So, changes can be made in the color, design, graphics or any other component to create a unique layout.
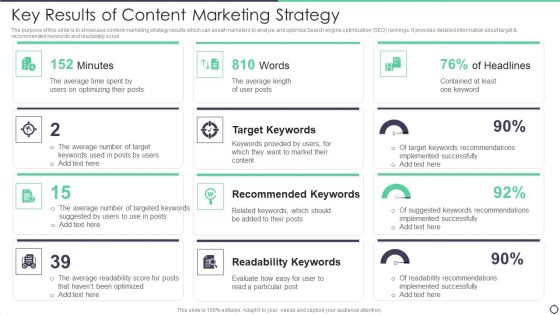
Key Results Of Content Marketing Strategy Background PDF
The purpose of this slide is to showcase content marketing strategy results which can assist marketers to analyze and optimize Search engine optimization SEO rankings. It provides detailed information about target and recommended keywords and readability score. Pitch your topic with ease and precision using this Key Results Of Content Marketing Strategy Background PDF. This layout presents information on Average, Target Keywords, Readability Keywords. It is also available for immediate download and adjustment. So, changes can be made in the color, design, graphics or any other component to create a unique layout.
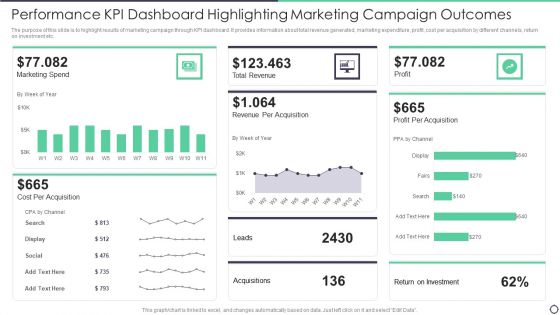
Performance Kpi Dashboard Highlighting Marketing Campaign Outcomes Topics PDF
The purpose of this slide is to highlight results of marketing campaign through KPI dashboard. It provides information about total revenue generated, marketing expenditure, profit, cost per acquisition by different channels, return on investment etc. Pitch your topic with ease and precision using this Performance Kpi Dashboard Highlighting Marketing Campaign Outcomes Topics PDF. This layout presents information on Cost, Marketing, Revenue. It is also available for immediate download and adjustment. So, changes can be made in the color, design, graphics or any other component to create a unique layout.
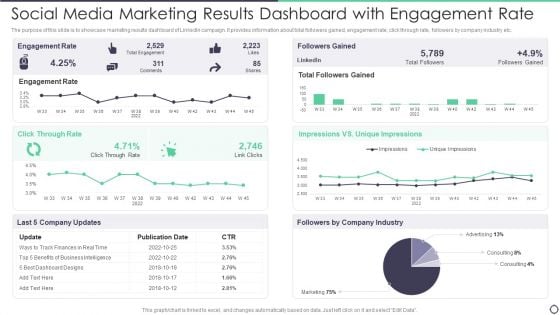
Social Media Marketing Results Dashboard With Engagement Rate Brochure PDF
The purpose of this slide is to showcase marketing results dashboard of LinkedIn campaign. It provides information about total followers gained, engagement rate, click through rate, followers by company industry etc. Pitch your topic with ease and precision using this Social Media Marketing Results Dashboard With Engagement Rate Brochure PDF. This layout presents information on Social Media Marketing Results Dashboard With Engagement Rate. It is also available for immediate download and adjustment. So, changes can be made in the color, design, graphics or any other component to create a unique layout.
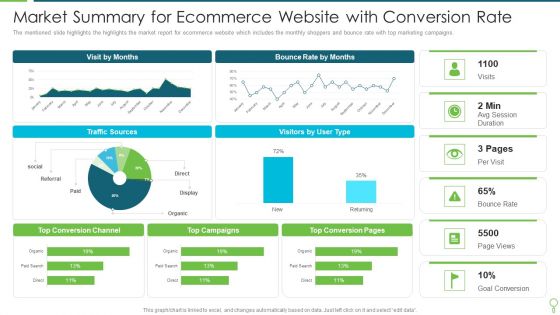
Market Summary For Ecommerce Website With Conversion Rate Diagrams PDF
The mentioned slide highlights the highlights the market report for ecommerce website which includes the monthly shoppers and bounce rate with top marketing campaigns. Pitch your topic with ease and precision using this Market Summary For Ecommerce Website With Conversion Rate Diagrams PDF. This layout presents information on Market Summary For Ecommerce Website With Conversion Rate. It is also available for immediate download and adjustment. So, changes can be made in the color, design, graphics or any other component to create a unique layout.
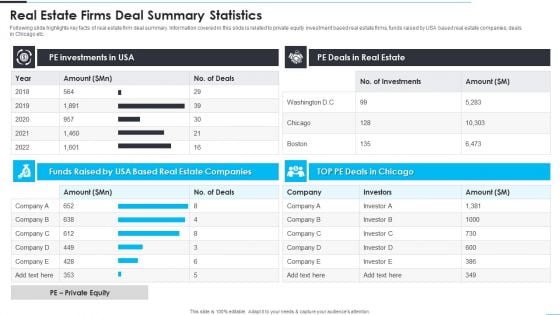
Real Estate Firms Deal Summary Statistics Demonstration PDF
Following slide highlights key facts of real estate firm deal summary. Information covered in this slide is related to private equity investment based real estate firms, funds raised by USA based real estate companies, deals in Chicago etc. Pitch your topic with ease and precision using this Real Estate Firms Deal Summary Statistics Demonstration PDF. This layout presents information on Real Estate Firms Deal Summary Statistics. It is also available for immediate download and adjustment. So, changes can be made in the color, design, graphics or any other component to create a unique layout.
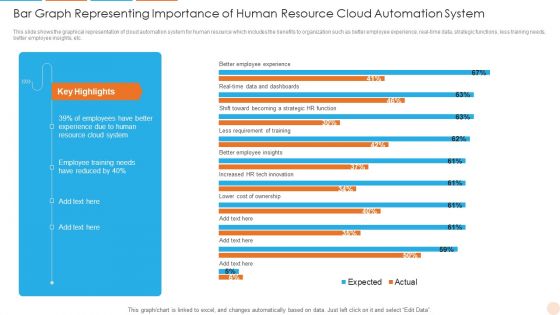
Bar Graph Representing Importance Of Human Resource Cloud Automation System Background PDF
This slide shows the graphical representation of cloud automation system for human resource which includes the benefits to organization such as better employee experience, real time data, strategic functions, less training needs, better employee insights, etc. Showcasing this set of slides titled Bar Graph Representing Importance Of Human Resource Cloud Automation System Background PDF. The topics addressed in these templates are System, Resource, Reduced. All the content presented in this PPT design is completely editable. Download it and make adjustments in color, background, font etc. as per your unique business setting.
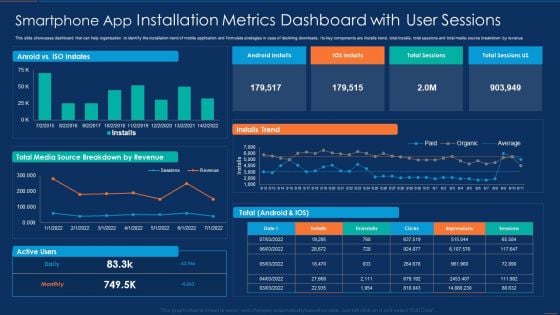
Smartphone App Installation Metrics Dashboard With User Sessions Microsoft PDF
This slide showcases dashboard that can help organization to identify the installation trend of mobile application and formulate strategies in case of declining downloads. Its key components are installs trend, total installs, total sessions and total media source breakdown by revenue. Pitch your topic with ease and precision using this Smartphone App Installation Metrics Dashboard With User Sessions Microsoft PDF. This layout presents information on Smartphone App Installation Metrics Dashboard With User Sessions. It is also available for immediate download and adjustment. So, changes can be made in the color, design, graphics or any other component to create a unique layout.
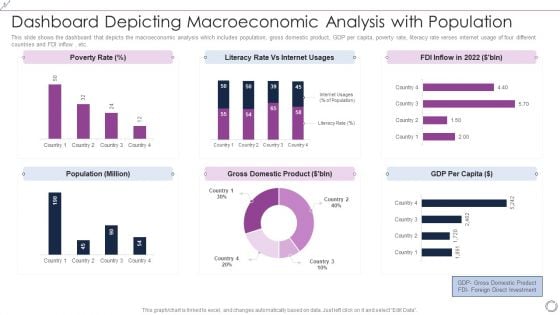
Dashboard Depicting Macroeconomic Analysis With Population Inspiration PDF
This slide shows the dashboard that depicts the macroeconomic analysis which includes population, gross domestic product, GDP per capita, poverty rate, literacy rate verses internet usage of four different countries and FDI inflow, etc. Pitch your topic with ease and precision using this Dashboard Depicting Macroeconomic Analysis With Population Inspiration PDF. This layout presents information on Poverty Rate, Literacy Rate Vs Internet Usages, FDI Inflow In 2022. It is also available for immediate download and adjustment. So, changes can be made in the color, design, graphics or any other component to create a unique layout.
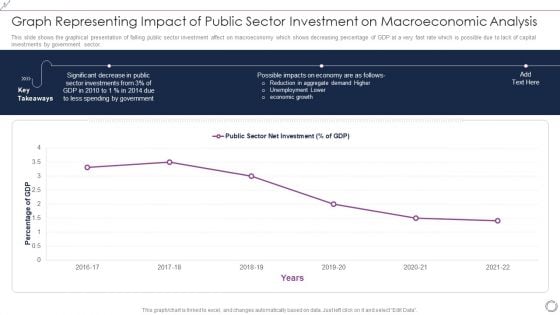
Graph Representing Impact Of Public Sector Investment On Macroeconomic Analysis Themes PDF
This slide shows the graphical presentation of falling public sector investment affect on macroeconomy which shows decreasing percentage of GDP at a very fast rate which is possible due to lack of capital investments by government sector. Showcasing this set of slides titled Graph Representing Impact Of Public Sector Investment On Macroeconomic Analysis Themes PDF. The topics addressed in these templates are Percentage GDP, 2016 to 2022, Public Sector Net Investment. All the content presented in this PPT design is completely editable. Download it and make adjustments in color, background, font etc. as per your unique business setting.
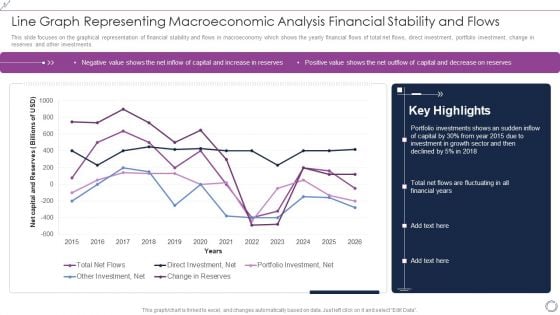
Line Graph Representing Macroeconomic Analysis Financial Stability And Flows Rules PDF
This slide focuses on the graphical representation of financial stability and flows in macroeconomy which shows the yearly financial flows of total net flows, direct investment, portfolio investment, change in reserves and other investments. Showcasing this set of slides titled Line Graph Representing Macroeconomic Analysis Financial Stability And Flows Rules PDF. The topics addressed in these templates are Total Net Flows, Direct Investment, Net, Portfolio Investment, Net. All the content presented in this PPT design is completely editable. Download it and make adjustments in color, background, font etc. as per your unique business setting.
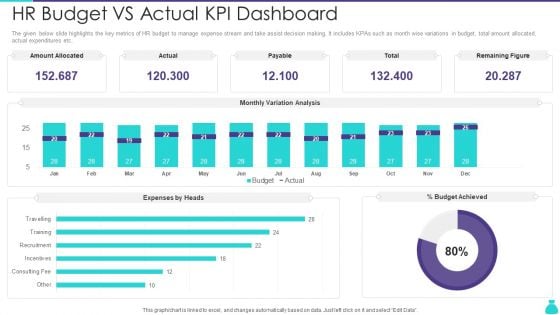
HR Budget Vs Actual KPI Dashboard Ppt PowerPoint Presentation File Structure PDF
The given below slide highlights the key metrics of HR budget to manage expense stream and take assist decision making. It includes KPAs such as month wise variations in budget, total amount allocated, actual expenditures etc. Pitch your topic with ease and precision using this HR Budget Vs Actual KPI Dashboard Ppt PowerPoint Presentation File Structure PDF. This layout presents information on Amount Allocated, Expenses by Heads, Budget Achieved. It is also available for immediate download and adjustment. So, changes can be made in the color, design, graphics or any other component to create a unique layout.
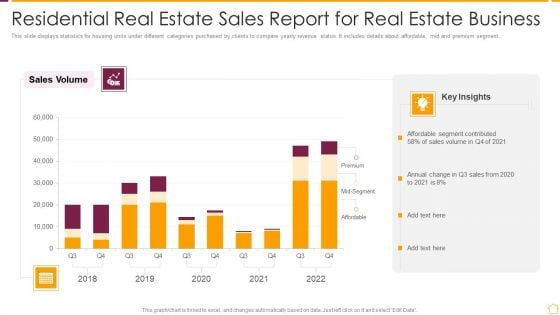
Residential Real Estate Sales Report For Real Estate Business Ppt PowerPoint Presentation File Master Slide PDF
This slide displays statistics for housing units under different categories purchased by clients to compare yearly revenue status. It includes details about affordable, mid and premium segment. Pitch your topic with ease and precision using this Residential Real Estate Sales Report For Real Estate Business Ppt PowerPoint Presentation File Master Slide PDF. This layout presents information on Affordable Segment Contributed, Sales Volume, 2018 To 2022. It is also available for immediate download and adjustment. So, changes can be made in the color, design, graphics or any other component to create a unique layout.
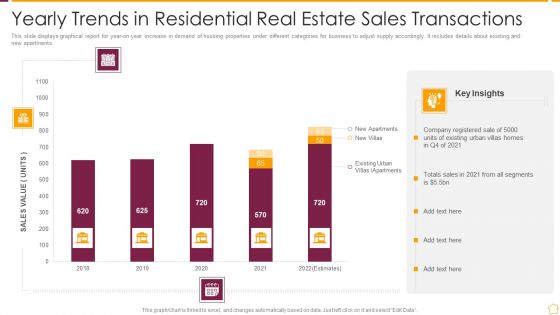
Yearly Trends In Residential Real Estate Sales Transactions Ppt PowerPoint Presentation Gallery Example PDF
This slide displays graphical report for year-on-year increase in demand of housing properties under different categories for business to adjust supply accordingly. It includes details about existing and new apartments. Showcasing this set of slides titled Yearly Trends In Residential Real Estate Sales Transactions Ppt PowerPoint Presentation Gallery Example PDF. The topics addressed in these templates are Company Registered Sale, Sales Value, 2018 To 2022. All the content presented in this PPT design is completely editable. Download it and make adjustments in color, background, font etc. as per your unique business setting.
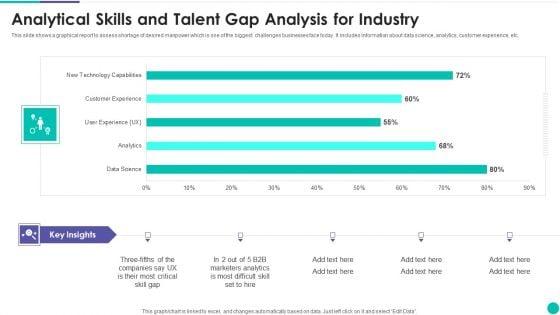
Analytical Skills And Talent Gap Analysis For Industry Template PDF
This slide shows a graphical report to assess shortage of desired manpower which is one of the biggest challenges businesses face today. It includes information about data science, analytics, customer experience, etc. Showcasing this set of slides titled Analytical Skills And Talent Gap Analysis For Industry Template PDF. The topics addressed in these templates are Marketers, Analytics, Data Science. All the content presented in this PPT design is completely editable. Download it and make adjustments in color, background, font etc. as per your unique business setting.
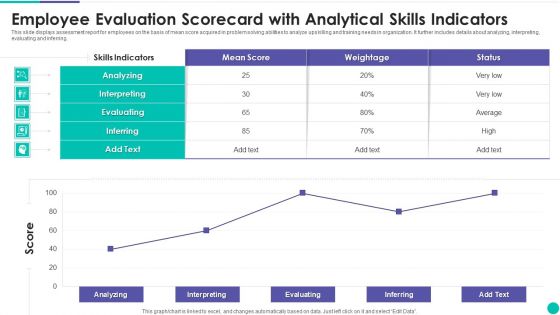
Employee Evaluation Scorecard With Analytical Skills Indicators Clipart PDF
This slide displays assessment report for employees on the basis of mean score acquired in problem solving abilities to analyze upskilling and training needs in organization. It further includes details about analyzing, interpreting, evaluating and inferring. Pitch your topic with ease and precision using this Employee Evaluation Scorecard With Analytical Skills Indicators Clipart PDF. This layout presents information on Analyzing, Interpreting, Evaluating. It is also available for immediate download and adjustment. So, changes can be made in the color, design, graphics or any other component to create a unique layout.
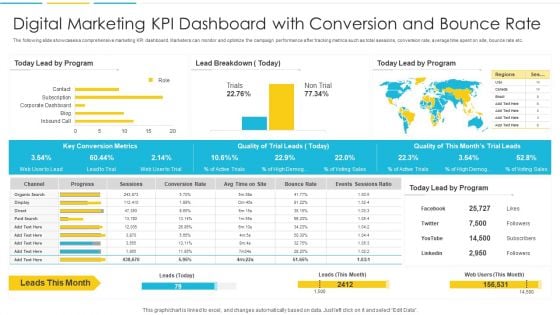
Digital Marketing KPI Dashboard With Conversion And Bounce Rate Introduction PDF
The following slide showcases a comprehensive marketing KPI dashboard. Marketers can monitor and optimize the campaign performance after tracking metrics such as total sessions, conversion rate, average time spent on site, bounce rate etc. Pitch your topic with ease and precision using this Digital Marketing KPI Dashboard With Conversion And Bounce Rate Introduction PDF. This layout presents information on Organic, Progress, Conversion Rate. It is also available for immediate download and adjustment. So, changes can be made in the color, design, graphics or any other component to create a unique layout


 Continue with Email

 Home
Home


