Agenda Images
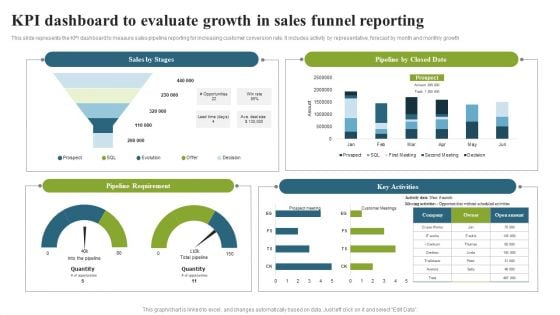
KPI Dashboard To Evaluate Growth In Sales Funnel Reporting Topics PDF
This slide represents the KPI dashboard to measure sales pipeline reporting for increasing customer conversion rate. It includes activity by representative, forecast by month and monthly growth. Pitch your topic with ease and precision using this KPI Dashboard To Evaluate Growth In Sales Funnel Reporting Topics PDF. This layout presents information on Pipeline Requirement, Key Activities, Pipeline Closed Date. It is also available for immediate download and adjustment. So, changes can be made in the color, design, graphics or any other component to create a unique layout.
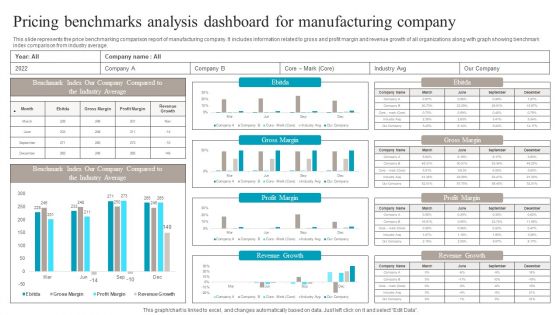
Pricing Benchmarks Analysis Dashboard For Manufacturing Company Structure PDF
This slide represents the price benchmarking comparison report of manufacturing company. It includes information related to gross and profit margin and revenue growth of all organizations along with graph showing benchmark index comparison from industry average. Pitch your topic with ease and precision using this Pricing Benchmarks Analysis Dashboard For Manufacturing Company Structure PDF. This layout presents information on Pricing Benchmarks Analysis, Dashboard For Manufacturing Company. It is also available for immediate download and adjustment. So, changes can be made in the color, design, graphics or any other component to create a unique layout.
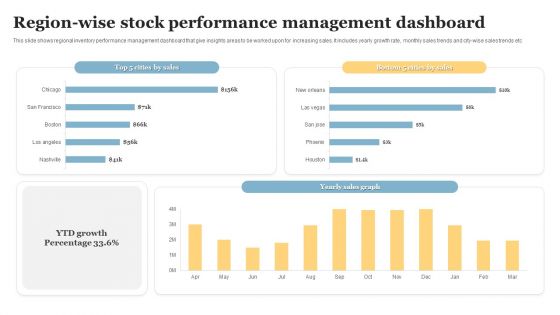
Region Wise Stock Performance Management Dashboard Introduction PDF
This slide shows regional inventory performance management dashboard that give insights areas to be worked upon for increasing sales. It includes yearly growth rate, monthly sales trends and city wise sales trends etc. Pitch your topic with ease and precision using this Region Wise Stock Performance Management Dashboard Introduction PDF. This layout presents information on Stock Performance, Management Dashboard. It is also available for immediate download and adjustment. So, changes can be made in the color, design, graphics or any other component to create a unique layout.
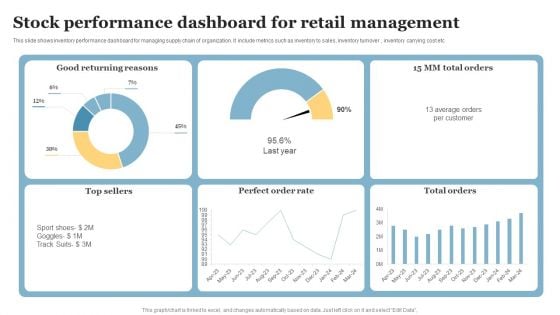
Stock Performance Dashboard For Retail Management Pictures PDF
This slide shows inventory performance dashboard for managing supply chain of organization. It include metrics such as inventory to sales, inventory turnover , inventory carrying cost etc. Pitch your topic with ease and precision using this Stock Performance Dashboard For Retail Management Pictures PDF. This layout presents information on Good Returning Reasons, Perfect Order Rate, Top Sellers. It is also available for immediate download and adjustment. So, changes can be made in the color, design, graphics or any other component to create a unique layout.
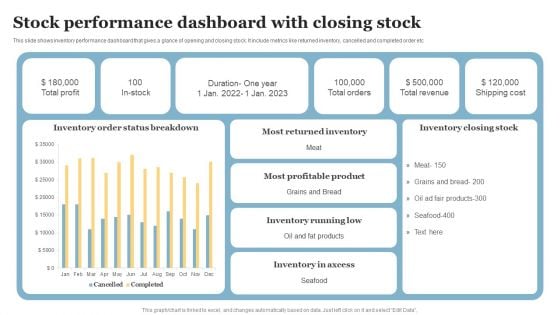
Stock Performance Dashboard With Closing Stock Diagrams PDF
This slide shows inventory performance dashboard that gives a glance of opening and closing stock. It include metrics like returned inventory, cancelled and completed order etc. Pitch your topic with ease and precision using this Stock Performance Dashboard With Closing Stock Diagrams PDF. This layout presents information on Most Returned Inventory, Most Profitable Product, Inventory Running Low. It is also available for immediate download and adjustment. So, changes can be made in the color, design, graphics or any other component to create a unique layout.
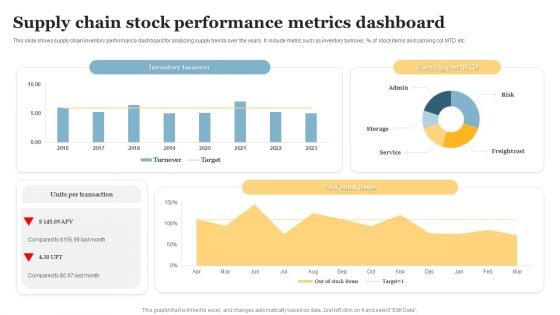
Supply Chain Stock Performance Metrics Dashboard Mockup PDF
This slide shows supply chain inventory performance dashboard for analyzing supply trends over the years. It include metric such as inventory turnover, Percent of stock items and carrying cot MTD etc . Pitch your topic with ease and precision using this Supply Chain Stock Performance Metrics Dashboard Mockup PDF. This layout presents information on Supply Chain Stock, Performance Metrics Dashboard. It is also available for immediate download and adjustment. So, changes can be made in the color, design, graphics or any other component to create a unique layout.
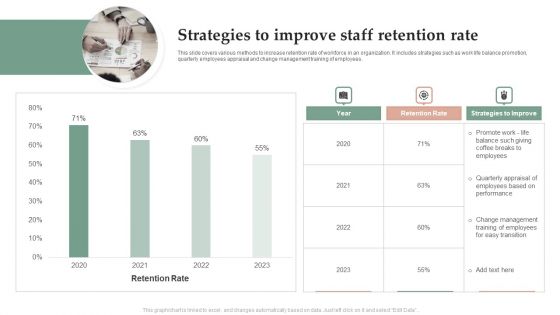
Strategies To Improve Staff Retention Rate Brochure PDF
This slide covers various methods to increase retention rate of workforce in an organization. It includes strategies such as work life balance promotion, quarterly employees appraisal and change management training of employees. Pitch your topic with ease and precision using this Strategies To Improve Staff Retention Rate Brochure PDF. This layout presents information on Strategies Improve, Staff Retention Rate. It is also available for immediate download and adjustment. So, changes can be made in the color, design, graphics or any other component to create a unique layout.
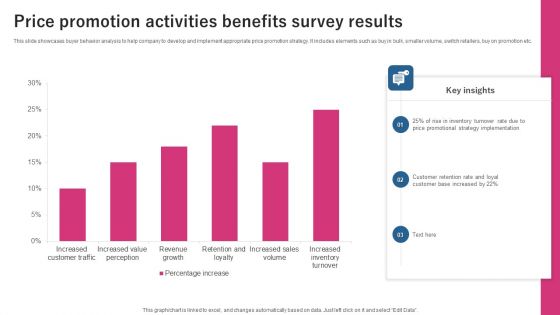
Price Promotion Activities Benefits Survey Results Ppt Inspiration Templates PDF
This slide showcases buyer behavior analysis to help company to develop and implement appropriate price promotion strategy. It includes elements such as buy in bulk, smaller volume, switch retailers, buy on promotion etc. Pitch your topic with ease and precision using this Price Promotion Activities Benefits Survey Results Ppt Inspiration Templates PDF. This layout presents information on Key Price, Promotional Strategy, Implementation. It is also available for immediate download and adjustment. So, changes can be made in the color, design, graphics or any other component to create a unique layout.
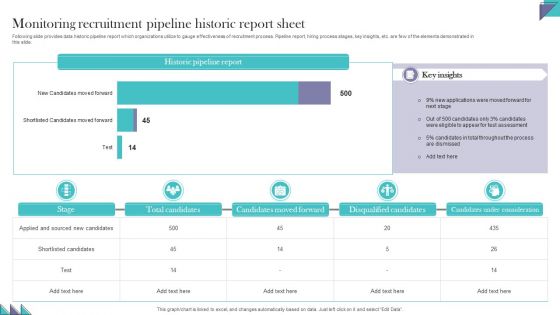
Monitoring Recruitment Pipeline Historic Report Sheet Pictures PDF
Following slide provides data historic pipeline report which organizations utilize to gauge effectiveness of recruitment process. Pipeline report, hiring process stages, key insights, etc. are few of the elements demonstrated in this slide. Pitch your topic with ease and precision using this Monitoring Recruitment Pipeline Historic Report Sheet Pictures PDF. This layout presents information on Candidates Moved Forward, Disqualified Candidates, Candidates Under Consideration. It is also available for immediate download and adjustment. So, changes can be made in the color, design, graphics or any other component to create a unique layout
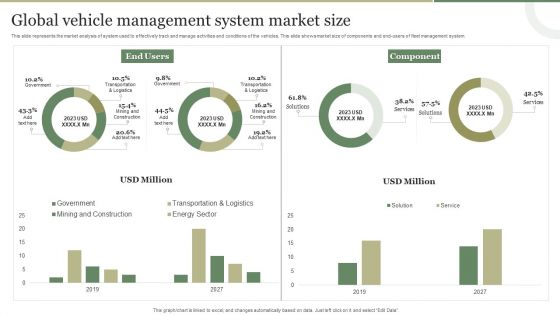
Global Vehicle Management System Market Size Guidelines PDF
This slide represents the market analysis of system used to effectively track and manage activities and conditions of the vehicles. This slide shows market size of components and end-users of fleet management system. Pitch your topic with ease and precision using this Global Vehicle Management System Market Size Guidelines PDF. This layout presents information on Global Vehicle, Management System, Market Size. It is also available for immediate download and adjustment. So, changes can be made in the color, design, graphics or any other component to create a unique layout.
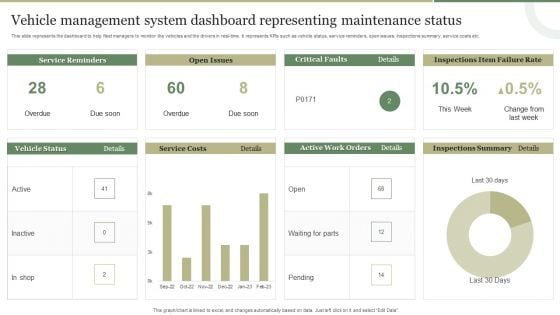
Vehicle Management System Dashboard Representing Maintenance Status Template PDF
This slide represents the dashboard representing the key metrics of the vehicle management system to monitor the vehicles and drivers in real-time. It includes key metrics such as service reminders, fuel costs, open issues, recent comments etc. Pitch your topic with ease and precision using this Vehicle Management System Dashboard Representing Maintenance Status Template PDF This layout presents information on Fuel Costs, Total Cost, Service Reminder, Recent Comments. It is also available for immediate download and adjustment. So, changes can be made in the color, design, graphics or any other component to create a unique layout.
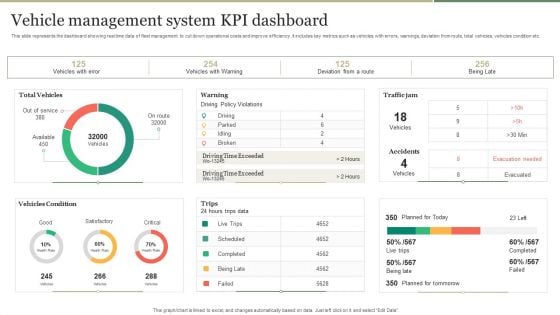
Vehicle Management System KPI Dashboard Introduction PDF
This slide represents the dashboard showing real time data of fleet management to cut down operational costs and improve efficiency. It includes key metrics such as vehicles with errors, warnings, deviation from route, total vehicles, vehicles condition etc. Pitch your topic with ease and precision using this Vehicle Management System KPI Dashboard Introduction PDF. This layout presents information on Vehicle Management System, KPI Dashboard. It is also available for immediate download and adjustment. So, changes can be made in the color, design, graphics or any other component to create a unique layout.
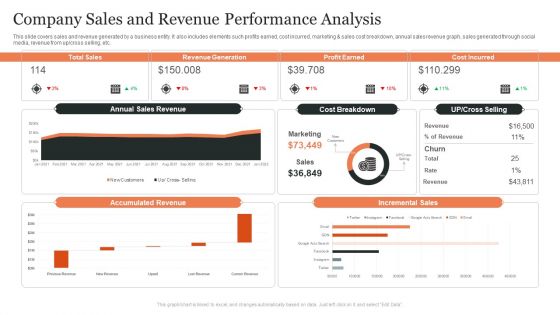
Company Sales And Revenue Performance Analysis Ppt Ideas Format PDF
This slide covers sales and revenue generated by a business entity. It also includes elements such profits earned, cost incurred, marketing and sales cost breakdown, annual sales revenue graph, sales generated through social media, revenue from up OR cross selling, etc. Pitch your topic with ease and precision using this Company Sales And Revenue Performance Analysis Ppt Ideas Format PDF. This layout presents information on Total Sales, Revenue Generation, Profit Earned, Cost Incurred. It is also available for immediate download and adjustment. So, changes can be made in the color, design, graphics or any other component to create a unique layout.
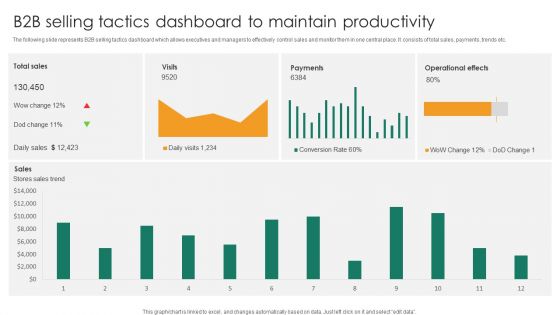
B2b Selling Tactics Dashboard To Maintain Productivity Introduction PDF
The following slide represents B2B selling tactics dashboard which allows executives and managers to effectively control sales and monitor them in one central place. It consists of total sales, payments, trends etc.Pitch your topic with ease and precision using this B2b Selling Tactics Dashboard To Maintain Productivity Introduction PDF. This layout presents information on Operational Effects, Stores Sales Trend, Conversion Rate. It is also available for immediate download and adjustment. So, changes can be made in the color, design, graphics or any other component to create a unique layout.
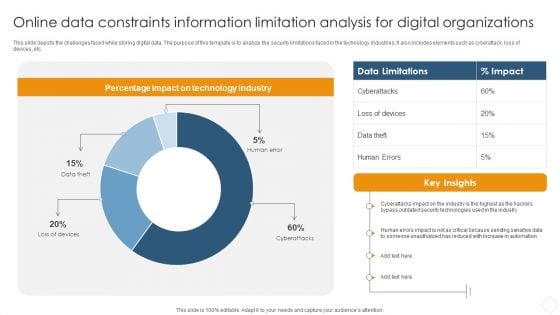
Online Data Constraints Information Limitation Analysis For Digital Organizations Information PDF
This slide depicts the challenges faced while storing digital data. The purpose of this template is to analyze the security limitations faced in the technology industries. It also includes elements such as cyberattack, loss of devices, etc.Pitch your topic with ease and precision using this Online Data Constraints Information Limitation Analysis For Digital Organizations Information PDF. This layout presents information on Percentage Impact, Technology Industry, Security Technologies. It is also available for immediate download and adjustment. So, changes can be made in the color, design, graphics or any other component to create a unique layout.
Multiple Projects Progress Tracking Report Management Dashboard With Duration Summary PDF
This slide shows the dashboard representing status of various projects which would be helpful in project management. It shows information related to project status, tasks status, milestones completed, upcoming milestones, critical tasks, projects names along with their start and end date, duration etc.Pitch your topic with ease and precision using this Multiple Projects Progress Tracking Report Management Dashboard With Duration Summary PDF. This layout presents information on Start Date, Finish Date, Percent Complete. It is also available for immediate download and adjustment. So, changes can be made in the color, design, graphics or any other component to create a unique layout.
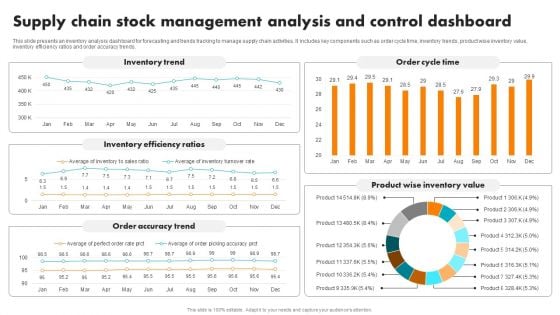
Supply Chain Stock Management Analysis And Control Dashboard Brochure PDF
This slide presents an inventory analysis dashboard for forecasting and trends tracking to manage supply chain activities. It includes key components such as order cycle time, inventory trends, product wise inventory value, inventory efficiency ratios and order accuracy trends. Pitch your topic with ease and precision using this Supply Chain Stock Management Analysis And Control Dashboard Brochure PDF. This layout presents information on Inventory Trend, Inventory Efficiency Ratios, Order Accuracy Trend, Order Cycle Time, Product Wise Inventory Value. It is also available for immediate download and adjustment. So, changes can be made in the color, design, graphics or any other component to create a unique layout.
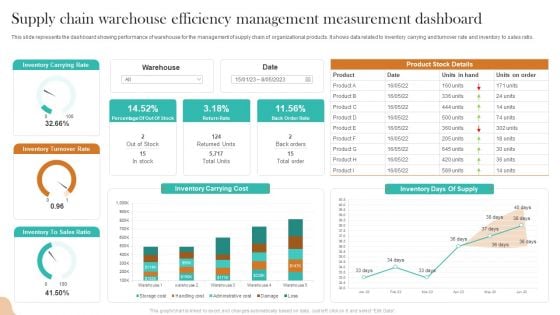
Supply Chain Warehouse Efficiency Management Measurement Dashboard Inspiration PDF
This slide represents the dashboard showing performance of warehouse for the management of supply chain of organizational products. It shows data related to inventory carrying and turnover rate and inventory to sales ratio. Pitch your topic with ease and precision using this Supply Chain Warehouse Efficiency Management Measurement Dashboard Inspiration PDF. This layout presents information on Inventory Carrying Rate, Inventory Turnover Rate, Inventory Carrying Cost. It is also available for immediate download and adjustment. So, changes can be made in the color, design, graphics or any other component to create a unique layout.
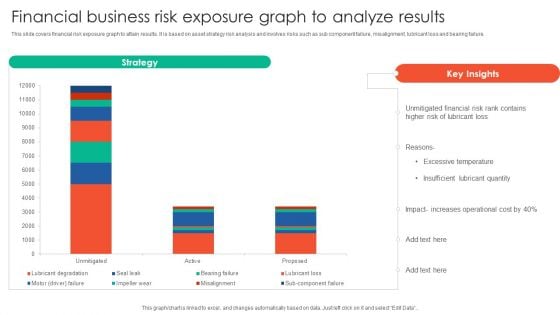
Financial Business Risk Exposure Graph To Analyze Results Elements PDF
This slide covers financial risk exposure graph to attain results. It is based on asset strategy risk analysis and involves risks such as sub component failure, misalignment, lubricant loss and bearing failure. Pitch your topic with ease and precision using this Financial Business Risk Exposure Graph To Analyze Results Elements PDF. This layout presents information on Strategy, Unmitigated Financial, Risk Rank Contains. It is also available for immediate download and adjustment. So, changes can be made in the color, design, graphics or any other component to create a unique layout.
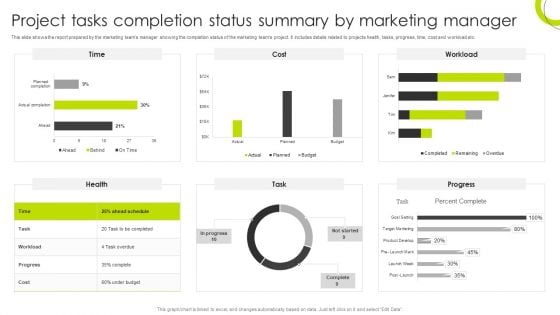
Project Tasks Completion Status Summary By Marketing Manager Mockup PDF
This slide shows the report prepared by the marketing teams manager showing the completion status of the marketing teams project. It includes details related to projects health, tasks, progress, time, cost and workload etc. Pitch your topic with ease and precision using thisProject Tasks Completion Status Summary By Marketing Manager Mockup PDF. This layout presents information on Project Tasks, Completion Status, Summary Marketing Manager. It is also available for immediate download and adjustment. So, changes can be made in the color, design, graphics or any other component to create a unique layout.
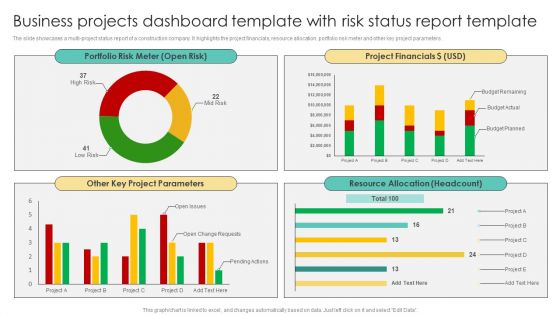
Business Projects Dashboard Template With Risk Status Report Template Topics PDF
The slide showcases a multi-project status report of a construction company. It highlights the project financials, resource allocation, portfolio risk meter and other key project parameters. Pitch your topic with ease and precision using this Business Projects Dashboard Template With Risk Status Report Template Topics PDF. This layout presents information on Portfolio Risk Meter, Project Financials, Project Parameters, Resource Allocation. It is also available for immediate download and adjustment. So, changes can be made in the color, design, graphics or any other component to create a unique layout.
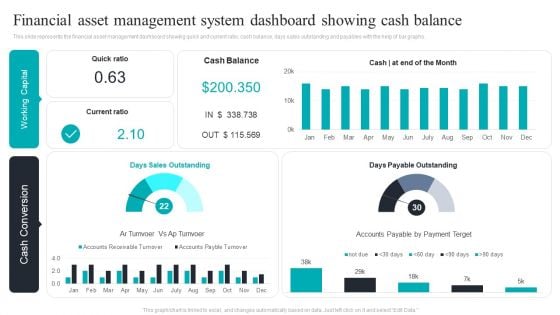
Financial Asset Management System Dashboard Showing Cash Balance Download PDF
This slide represents the financial asset management dashboard showing quick and current ratio, cash balance, days sales outstanding and payables with the help of bar graphs. Pitch your topic with ease and precision using this Financial Asset Management System Dashboard Showing Cash Balance Download PDF. This layout presents information on Financial Asset, Management System, Dashboard Showing, Cash Balance. It is also available for immediate download and adjustment. So, changes can be made in the color, design, graphics or any other component to create a unique layout.
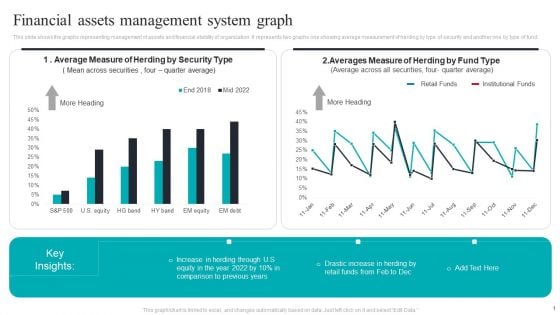
Financial Assets Management System Graph Structure PDF
This slide shows the graphs representing management of assets and financial stability of organization. It represents two graphs one showing average measurement of herding by type of security and another one by type of fund. Pitch your topic with ease and precision using this Financial Assets Management System Graph Structure PDF. This layout presents information on Financial Assets, Management System Graph. It is also available for immediate download and adjustment. So, changes can be made in the color, design, graphics or any other component to create a unique layout.

Consumer Risk Assessment Dashboard Reporting Ppt Layouts Ideas PDF
This slide showcases the customer risk assessment dashboard with major kpis. It includes reporting risks summary, risk mitigation, risk profile, and detail. It also reflects the risk score and score distribution across different areas and activities. Pitch your topic with ease and precision using this Consumer Risk Assessment Dashboard Reporting Ppt Layouts Ideas PDF. This layout presents information on Risk Summary, Customer Risk Dashboard, Risk Profile. It is also available for immediate download and adjustment. So, changes can be made in the color, design, graphics or any other component to create a unique layout.
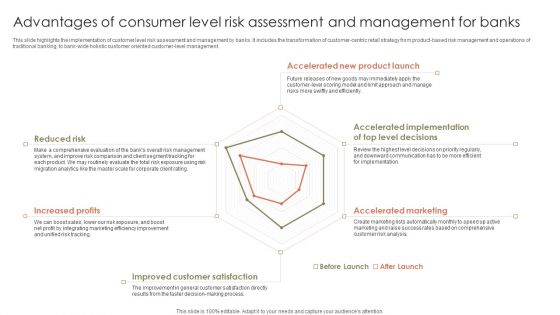
Advantages Of Consumer Level Risk Assessment And Management For Banks Infographics PDF
This slide highlights the implemention of customer level risk assessment and management by banks. it includes the transformation of customer centric retail strategy from product based risk management and operations of traditional banking to bank wide holistic customer oriented customer level management. Pitch your topic with ease and precision using this Advantages Of Consumer Level Risk Assessment And Management For Banks Infographics PDF. This layout presents information on Reduced Risk, Increased Profits, Accelerated Marketing. It is also available for immediate download and adjustment. So, changes can be made in the color, design, graphics or any other component to create a unique layout.

Business Ecological Footprints Consumption And Biocapacity Analysis Designs PDF
This slide depicts the ecological footprint and biocapacity past trends along with its future predictions. The purpose of this template is to analyze ecological footprint level in present, past and future. It includes information related to the ecological debt, productivity level and usage on yearly basis. Pitch your topic with ease and precision using this Business Ecological Footprints Consumption And Biocapacity Analysis Designs PDF. This layout presents information on Business Ecological Footprints, Consumption Biocapacity Analysis. It is also available for immediate download and adjustment. So, changes can be made in the color, design, graphics or any other component to create a unique layout.
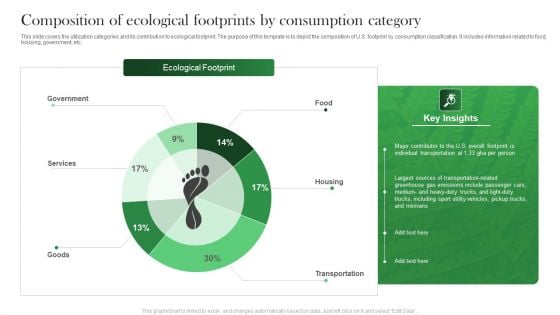
Composition Of Ecological Footprints By Consumption Category Mockup PDF
This slide covers the utilization categories and its contribution to ecological footprint. The purpose of this template is to depict the composition of U.S. footprint by consumption classification. It includes information related to food, housing, government, etc. Pitch your topic with ease and precision using this Composition Of Ecological Footprints By Consumption Category Mockup PDF. This layout presents information on Government, Services, Transportation. It is also available for immediate download and adjustment. So, changes can be made in the color, design, graphics or any other component to create a unique layout.

Ecological Footprints Consumption Categorization For Different Countries Download PDF
This slide depicts the ecological footprint a method promoted by the global footprint network to measure human demand on natural capital. The purpose of this template is to analyze ecological footprints of different countries. It includes information related to carbon, fishing, etc. Pitch your topic with ease and precision using this Ecological Footprints Consumption Categorization For Different Countries Download PDF. This layout presents information on Ecological Footprints Consumption, Categorization Different Countries. It is also available for immediate download and adjustment. So, changes can be made in the color, design, graphics or any other component to create a unique layout.
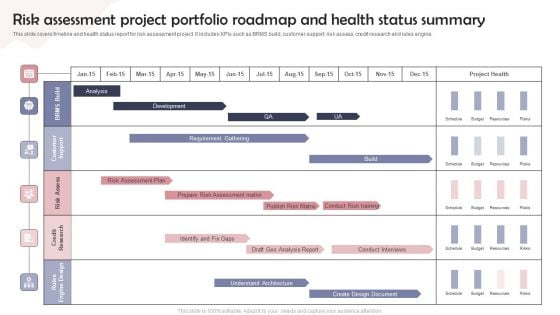
Risk Assessment Project Portfolio Roadmap And Health Status Summary Mockup PDF
This slide covers timeline and health status report for risk assessment project. It includes KPIs such as BRMS build, customer support, risk assess, credit research and rules engine. Pitch your topic with ease and precision using this Risk Assessment Project Portfolio Roadmap And Health Status Summary Mockup PDF. This layout presents information on Risk Assessment Project, Portfolio Roadmap, Health Status Summary. It is also available for immediate download and adjustment. So, changes can be made in the color, design, graphics or any other component to create a unique layout.

Email Marketing Campaign Outcomes And Social Media Marketing Result Analysis Dashboard Mockup PDF
This slide depicts the dashboard for analyzing the results of email campaign and social media marketing. It includes information related to the comparison, statistics, usage, etc. Pitch your topic with ease and precision using this Email Marketing Campaign Outcomes And Social Media Marketing Result Analysis Dashboard Mockup PDF. This layout presents information on Email Marketing Campaign, Outcomes And Social Media, Marketing Result, Analysis Dashboard. It is also available for immediate download and adjustment. So, changes can be made in the color, design, graphics or any other component to create a unique layout.
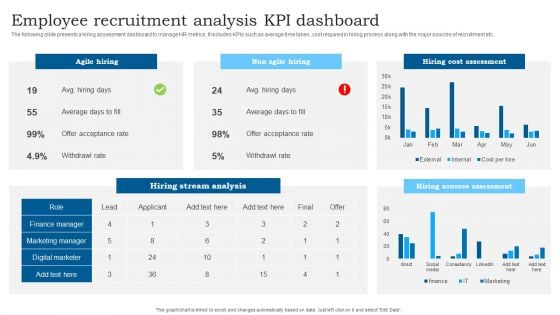
Employee Recruitment Analysis KPI Dashboard Slides PDF
The following slide presents a hiring assessment dashboard to manage HR metrics. It includes KPIs such as average time taken, cost required in hiring process along with the major sources of recruitment etc. Pitch your topic with ease and precision using this Employee Recruitment Analysis KPI Dashboard Slides PDF. This layout presents information on Agile Hiring, Non Agile Hiring, Hiring Cost Assessment. It is also available for immediate download and adjustment. So, changes can be made in the color, design, graphics or any other component to create a unique layout.
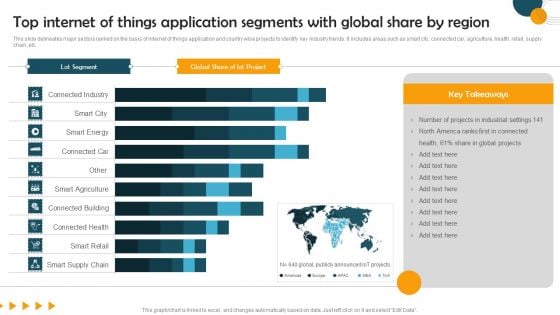
Top Internet Of Things Application Segments With Global Share By Region Formats PDF
This slide delineates major sectors ranked on the basis of internet of things application and country wise projects to identify key industry trends. It includes areas such as smart city, connected car, agriculture, health, retail, supply chain, etc. Pitch your topic with ease and precision using this Top Internet Of Things Application Segments With Global Share By Region Formats PDF. This layout presents information on Lot Segment, Global Share, lot Project. It is also available for immediate download and adjustment. So, changes can be made in the color, design, graphics or any other component to create a unique layout.
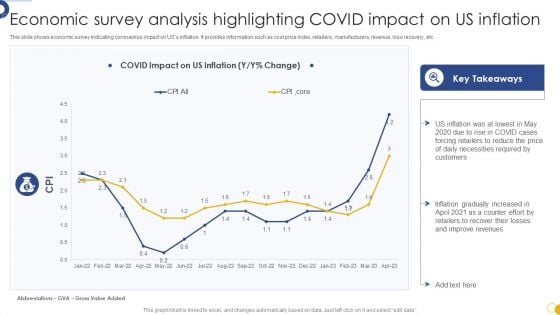
Economic Survey Analysis Highlighting COVID Impact On US Inflation Information PDF
This slide shows economic survey indicating coronavirus impact on USs inflation. It provides information such as cost price index, retailers, manufacturers, revenue, loss recovery, etc. Pitch your topic with ease and precision using this Economic Survey Analysis Highlighting COVID Impact On US Inflation Information PDF. This layout presents information on Economic Survey Analysis, Highlighting COVID, Impact On US Inflation. It is also available for immediate download and adjustment. So, changes can be made in the color, design, graphics or any other component to create a unique layout.
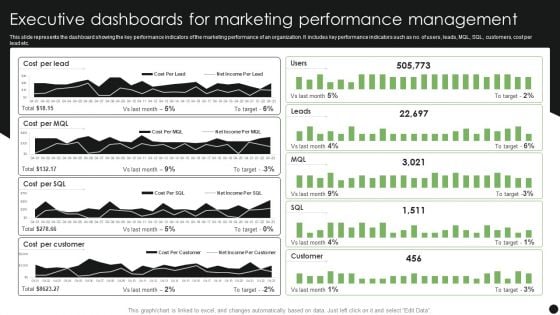
Executive Dashboards For Marketing Performance Management Slides PDF
This slide represents the dashboard showing the key performance indicators of the marketing performance of an organization. It includes key performance indicators such as no. of users, leads, MQL, SQL, customers, cost per lead etc. Pitch your topic with ease and precision using this Executive Dashboards For Marketing Performance Management Slides PDF. This layout presents information on Cost Per Lead, Cost Per Customer. It is also available for immediate download and adjustment. So, changes can be made in the color, design, graphics or any other component to create a unique layout.
Executive Dashboards For Tracking Financial Health Of Enterprise Diagrams PDF
This slide represents the CEO dashboard to track the financial health of an organization. It includes key performance indicators such as revenue, expenses, activity ratio, gross profit margin, EBIT etc. Pitch your topic with ease and precision using this Executive Dashboards For Tracking Financial Health Of Enterprise Diagrams PDF. This layout presents information on Revenue, Expense, Activity Ratio. It is also available for immediate download and adjustment. So, changes can be made in the color, design, graphics or any other component to create a unique layout.
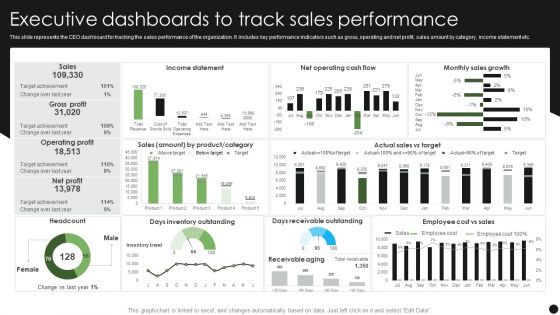
Executive Dashboards To Track Sales Performance Guidelines PDF
This slide represents the CEO dashboard for tracking the sales performance of the organization. It includes key performance indicators such as gross, operating and net profit, sales amount by category, income statement etc. Pitch your topic with ease and precision using this Executive Dashboards To Track Sales Performance Guidelines PDF. This layout presents information on Income Statement, Monthly Sales Growth, Days Receivable Outstanding. It is also available for immediate download and adjustment. So, changes can be made in the color, design, graphics or any other component to create a unique layout.
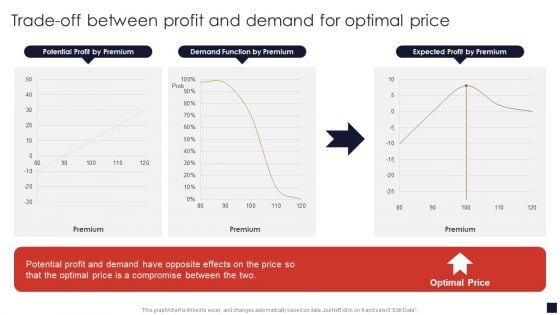
Trade Off Between Profit And Demand For Optimal Price Product Pricing Strategic Guide Rules PDF
This Trade Off Between Profit And Demand For Optimal Price Product Pricing Strategic Guide Rules PDF from Slidegeeks makes it easy to present information on your topic with precision. It provides customization options, so you can make changes to the colors, design, graphics, or any other component to create a unique layout. It is also available for immediate download, so you can begin using it right away. Slidegeeks has done good research to ensure that you have everything you need to make your presentation stand out. Make a name out there for a brilliant performance.

Implementing Experimental Marketing Organizing Trade Shows For Audience Attraction And Engagement Clipart PDF
This Implementing Experimental Marketing Organizing Trade Shows For Audience Attraction And Engagement Clipart PDF from Slidegeeks makes it easy to present information on your topic with precision. It provides customization options, so you can make changes to the colors, design, graphics, or any other component to create a unique layout. It is also available for immediate download, so you can begin using it right away. Slidegeeks has done good research to ensure that you have everything you need to make your presentation stand out. Make a name out there for a brilliant performance.
Customer Engagement Methods For Online Platforms Analyzing Companys Average Consumer Icons PDF
The following slide provides graphical depiction of customer churn rate and their average lifetime value with the company. It provides information about new innovation, geographical reach, and others factors affecting customer purchasing decisions. From laying roadmaps to briefing everything in detail, our templates are perfect for you. You can set the stage with your presentation slides. All you have to do is download these easy to edit and customizable templates. Customer Engagement Methods For Online Platforms Analyzing Companys Average Consumer Icons PDF will help you deliver an outstanding performance that everyone would remember and praise you for. Do download this presentation today.
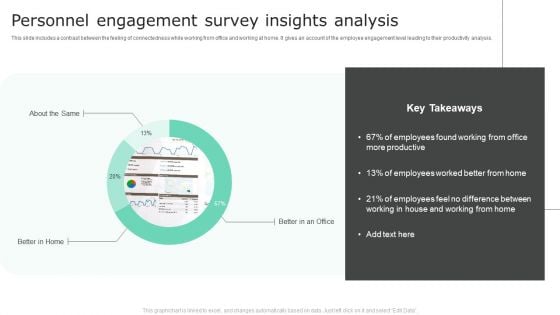
Personnel Engagement Survey Insights Analysis Mockup PDF
This slide includes a contrast between the feeling of connectedness while working from office and working at home. It gives an account of the employee engagement level leading to their productivity analysis. Pitch your topic with ease and precision using this Personnel Engagement Survey Insights Analysis Mockup PDF. This layout presents information on About The Same, Better In Home. It is also available for immediate download and adjustment. So, changes can be made in the color, design, graphics or any other component to create a unique layout.
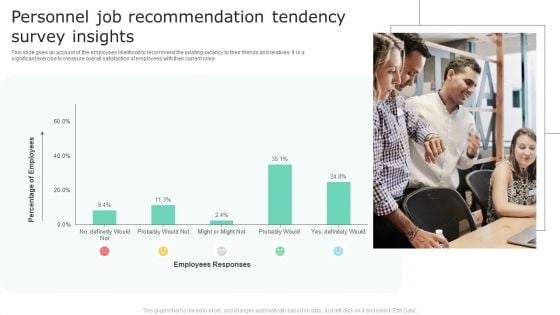
Personnel Job Recommendation Tendency Survey Insights Topics PDF
This slide gives an account of the employees likelihood to recommend the existing vacancy to their friends and relatives. It is a significant exercise to measure overall satisfaction of employees with their current roles. Pitch your topic with ease and precision using this Personnel Job Recommendation Tendency Survey Insights Topics PDF. This layout presents information on Percentage Of Employees, Employees Responses. It is also available for immediate download and adjustment. So, changes can be made in the color, design, graphics or any other component to create a unique layout.
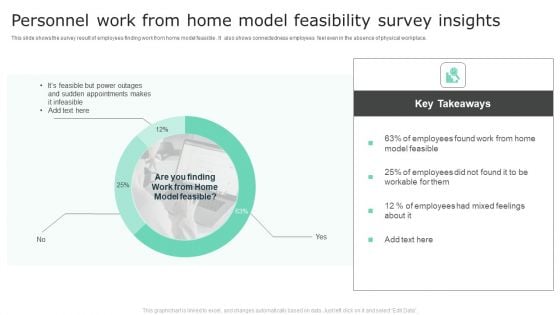
Personnel Work From Home Model Feasibility Survey Insights Portrait PDF
This slide shows the survey result of employees finding work from home model feasible . It also shows connectedness employees feel even in the absence of physical workplace. Pitch your topic with ease and precision using this Personnel Work From Home Model Feasibility Survey Insights Portrait PDF. This layout presents information on Work From Home, Model Feasible, Mixed Feelings. It is also available for immediate download and adjustment. So, changes can be made in the color, design, graphics or any other component to create a unique layout.
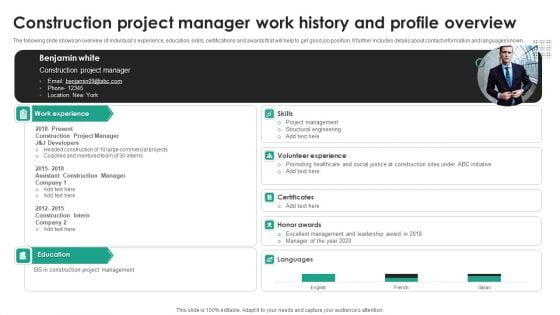
Construction Project Manager Work History And Profile Overview Information PDF
The following slide shows an overview of individuals experience, education, skills, certifications and awards that will help to get good job position. It further includes details about contact information and languages known. Pitch your topic with ease and precision using this Construction Project Manager Work History And Profile Overview Information PDF. This layout presents information on Work Experience, Education, Project Management. It is also available for immediate download and adjustment. So, changes can be made in the color, design, graphics or any other component to create a unique layout.
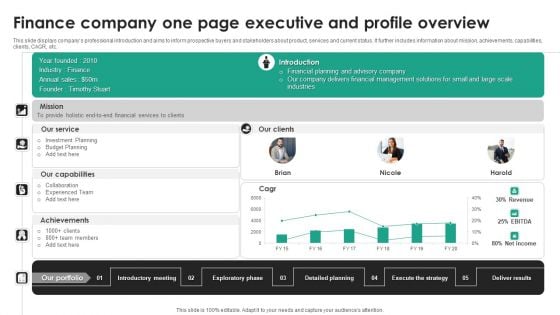
Finance Company One Page Executive And Profile Overview Inspiration PDF
This slide displays companys professional introduction and aims to inform prospective buyers and stakeholders about product, services and current status. It further includes information about mission, achievements, capabilities, clients, CAGR, etc. Pitch your topic with ease and precision using this Finance Company One Page Executive And Profile Overview Inspiration PDF. This layout presents information on Our Service, Our Capabilities, Achievements. It is also available for immediate download and adjustment. So, changes can be made in the color, design, graphics or any other component to create a unique layout.
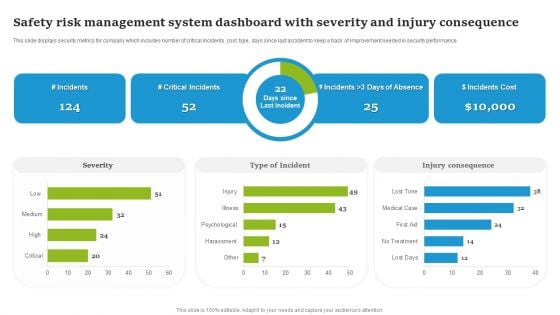
Safety Risk Management System Dashboard With Severity And Injury Consequence Clipart PDF
This slide displays security metrics for company which includes number of critical incidents, cost, type, days since last accident to keep a track of Improvement needed in security performance. Pitch your topic with ease and precision using this Safety Risk Management System Dashboard With Severity And Injury Consequence Clipart PDF. This layout presents information on Severity, Type Of Incident, Injury Consequence . It is also available for immediate download and adjustment. So, changes can be made in the color, design, graphics or any other component to create a unique layout.
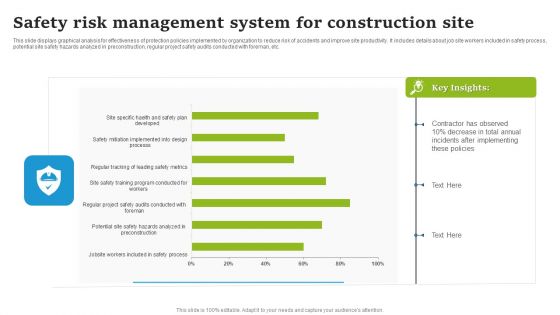
Safety Risk Management System For Construction Site Elements PDF
This slide displays graphical analysis for effectiveness of protection policies implemented by organization to reduce risk of accidents and improve site productivity. It includes details about job site workers included in safety process, potential site safety hazards analyzed in preconstruction, regular project safety audits conducted with foreman, etc. Showcasing this set of slides titled Safety Risk Management System For Construction Site Elements PDF. The topics addressed in these templates are Contractor Has Observed, Total Annual, Incidents After Implementing. All the content presented in this PPT design is completely editable. Download it and make adjustments in color, background, font etc. as per your unique business setting.
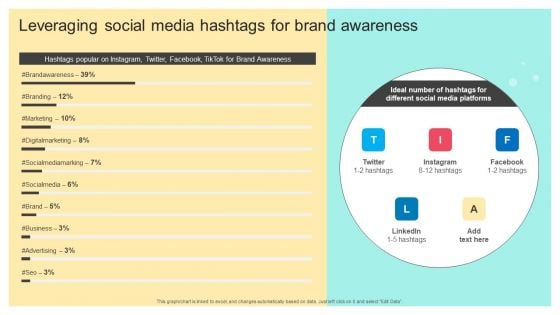
Leveraging Social Media Hashtags For Brand Awareness Online And Offline Brand Designs PDF
This Leveraging Social Media Hashtags For Brand Awareness Online And Offline Brand Designs PDF from Slidegeeks makes it easy to present information on your topic with precision. It provides customization options, so you can make changes to the colors, design, graphics, or any other component to create a unique layout. It is also available for immediate download, so you can begin using it right away. Slidegeeks has done good research to ensure that you have everything you need to make your presentation stand out. Make a name out there for a brilliant performance.
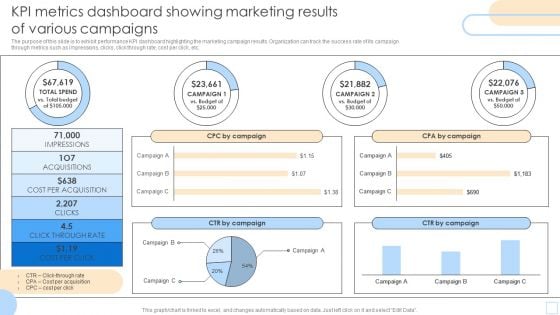
KPI Metrics Dashboard Showing Marketing Results Of Various Campaigns Pictures PDF
The purpose of this slide is to exhibit performance KPI dashboard highlighting the marketing campaign results. Organization can track the success rate of its campaign through metrics such as impressions, clicks, click through rate, cost per click, etc. Pitch your topic with ease and precision using this KPI Metrics Dashboard Showing Marketing Results Of Various Campaigns Pictures PDF. This layout presents information on Impressions, Acquisitions, CPA By Campaign. It is also available for immediate download and adjustment. So, changes can be made in the color, design, graphics or any other component to create a unique layout.
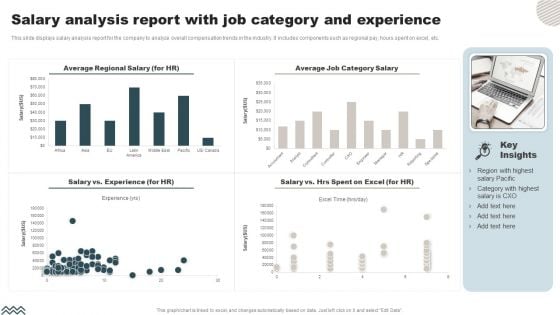
Salary Analysis Report With Job Category And Experience Microsoft PDF
This slide displays salary analysis report for the company to analyze overall compensation trends in the industry. It includes components such as regional pay, hours spent on excel, etc. Pitch your topic with ease and precision using this Salary Analysis Report With Job Category And Experience Microsoft PDF. This layout presents information on Average Regional Salary, Average Job Category Salary . It is also available for immediate download and adjustment. So, changes can be made in the color, design, graphics or any other component to create a unique layout.
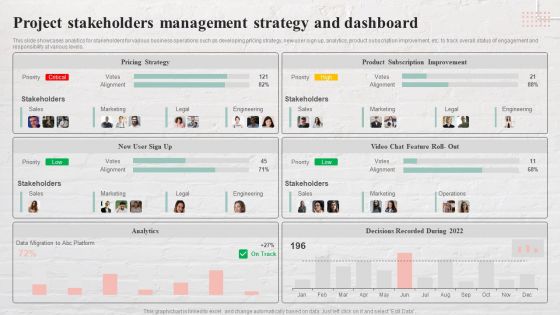
Project Stakeholders Management Strategy And Dashboard Sample PDF
This slide showcases analytics for stakeholders for various business operations such as developing pricing strategy, new user sign up, analytics, product subscription improvement, etc. to track overall status of engagement and responsibility at various levels. Pitch your topic with ease and precision using this Project Stakeholders Management Strategy And Dashboard Sample PDF. This layout presents information on Pricing Strategy, Product Subscription Improvement. It is also available for immediate download and adjustment. So, changes can be made in the color, design, graphics or any other component to create a unique layout.

Stakeholders Management Strategy With Engagement Dashboard Infographics PDF
The following slide displays key parameters to map involvement of stakeholders in the business by analyzing them on the basis of influence, interest and impact to monitor and improve overall communication strategies of organization. Pitch your topic with ease and precision using this Stakeholders Management Strategy With Engagement Dashboard Infographics PDF. This layout presents information on Influence, Interest, Impact. It is also available for immediate download and adjustment. So, changes can be made in the color, design, graphics or any other component to create a unique layout.
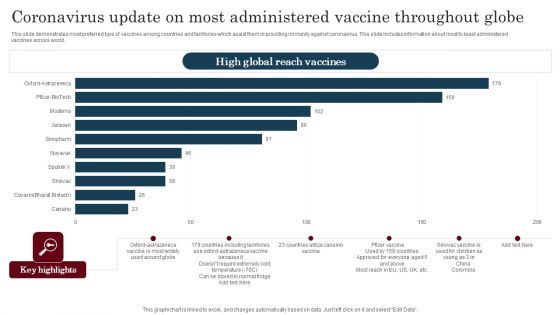
Coronavirus Update On Most Administered Vaccine Throughout Globe Mockup PDF
This slide demonstrates most preferred type of vaccines among countries and territories which assist them in providing immunity against coronavirus. This slide includes information about most to least administered vaccines across world. Pitch your topic with ease and precision using this Coronavirus Update On Most Administered Vaccine Throughout Globe Mockup PDF. This layout presents information on Coronavirus Update, Most Administered Vaccine. It is also available for immediate download and adjustment. So, changes can be made in the color, design, graphics or any other component to create a unique layout.
Enhancing CX Strategy Customer Service Kpi Tracking Dashboard Themes PDF
This Enhancing CX Strategy Customer Service Kpi Tracking Dashboard Themes PDF from Slidegeeks makes it easy to present information on your topic with precision. It provides customization options, so you can make changes to the colors, design, graphics, or any other component to create a unique layout. It is also available for immediate download, so you can begin using it right away. Slidegeeks has done good research to ensure that you have everything you need to make your presentation stand out. Make a name out there for a brilliant performance.
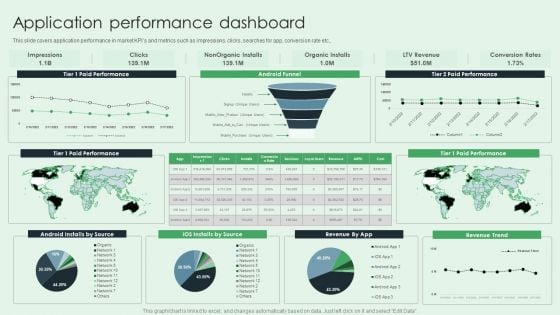
Selling App Development Launch And Marketing Application Performance Dashboard Inspiration PDF
This slide covers application performance in market KPIs and metrics such as impressions, clicks, searches for app, conversion rate etc. This Selling App Development Launch And Marketing Application Performance Dashboard Inspiration PDF from Slidegeeks makes it easy to present information on your topic with precision. It provides customization options, so you can make changes to the colors, design, graphics, or any other component to create a unique layout. It is also available for immediate download, so you can begin using it right away. Slidegeeks has done good research to ensure that you have everything you need to make your presentation stand out. Make a name out there for a brilliant performance.
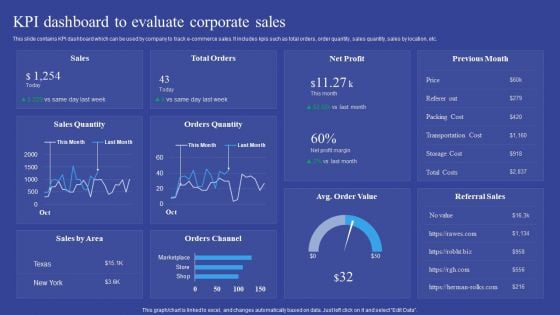
KPI Dashboard To Evaluate Corporate Sales Introduction PDF
This slide contains KPI dashboard which can be used by company to track e-commerce sales. It includes kpis such as total orders, order quantity, sales quantity, sales by location, etc. Pitch your topic with ease and precision using this KPI Dashboard To Evaluate Corporate Sales Introduction PDF. This layout presents information on KPI Dashboard, Evaluate Corporate Sales. It is also available for immediate download and adjustment. So, changes can be made in the color, design, graphics or any other component to create a unique layout.
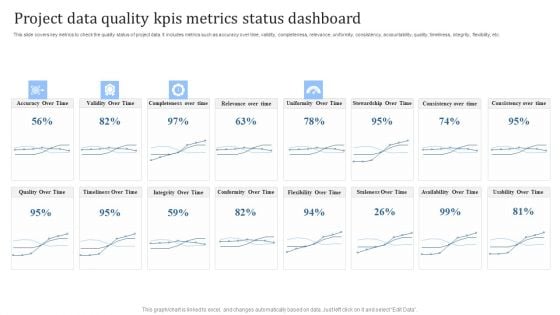
Project Data Quality Kpis Metrics Status Dashboard Designs PDF
This slide covers key metrics to check the quality status of project data. It includes metrics such as accuracy over time, validity, completeness, relevance, uniformity, consistency, accountability, quality, timeliness, integrity, flexibility, etc. Pitch your topic with ease and precision using this Project Data Quality Kpis Metrics Status Dashboard Designs PDF. This layout presents information on Accuracy Over Time, Validity Over Time. It is also available for immediate download and adjustment. So, changes can be made in the color, design, graphics or any other component to create a unique layout.
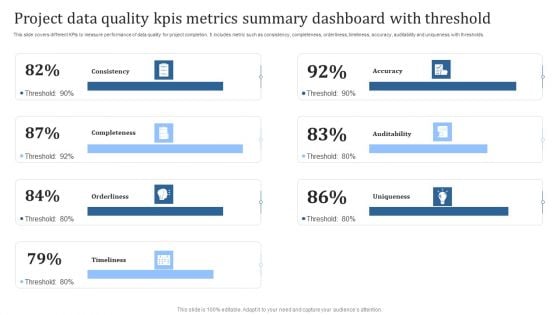
Project Data Quality Kpis Metrics Summary Dashboard With Threshold Guidelines PDF
This slide covers different KPIs to measure performance of data quality for project completion. It includes metric such as consistency, completeness, orderliness, timeliness, accuracy, auditability and uniqueness with thresholds. Pitch your topic with ease and precision using this Project Data Quality Kpis Metrics Summary Dashboard With Threshold Guidelines PDF. This layout presents information on Consistency, Completeness, Orderliness. It is also available for immediate download and adjustment. So, changes can be made in the color, design, graphics or any other component to create a unique layout.
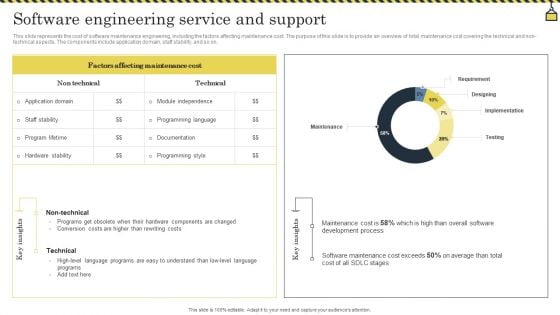
Software Engineering Service And Support Information PDF
This slide represents the cost of software maintenance engineering, including the factors affecting maintenance cost. The purpose of this slide is to provide an overview of total maintenance cost covering the technical and non technical aspects. The components include application domain, staff stability, and so on. Pitch your topic with ease and precision using this Software Engineering Service And Support Information PDF. This layout presents information on Rewriting Costs, Conversion Costs, Development Process. It is also available for immediate download and adjustment. So, changes can be made in the color, design, graphics or any other component to create a unique layout.
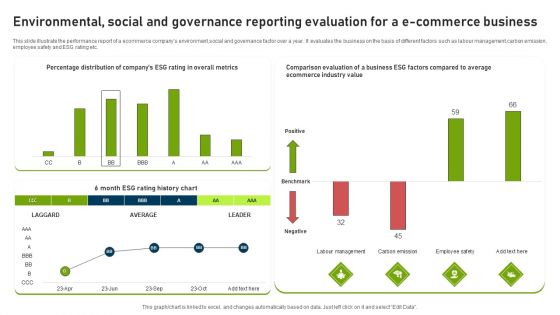
Environmental Social And Governance Reporting Evaluation For A E Commerce Business Template PDF
This slide illustrate the performance report of a ecommerce companys environment,social and governance factor over a year. It evaluates the business on the basis of different factors such as labour management,carbon emission, employee safety and ESG rating etc. Pitch your topic with ease and precision using this Environmental Social And Governance Reporting Evaluation For A E Commerce Business Template PDF. This layout presents information on Comparison Evaluation, Business, Ecommerce Industry Value. It is also available for immediate download and adjustment. So, changes can be made in the color, design, graphics or any other component to create a unique layout.
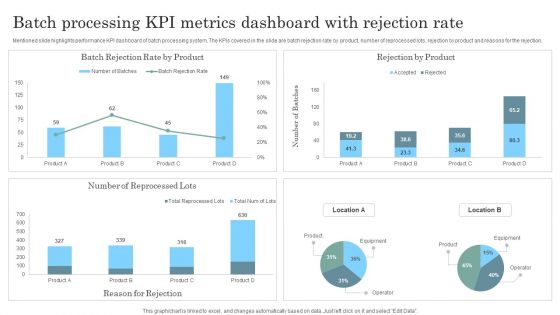
Batch Processing KPI Metrics Dashboard With Rejection Rate Topics PDF
Mentioned slide highlights performance KPI dashboard of batch processing system. The KPIs covered in the slide are batch rejection rate by product, number of reprocessed lots, rejection by product and reasons for the rejection. Pitch your topic with ease and precision using this Batch Processing KPI Metrics Dashboard With Rejection Rate Topics PDF. This layout presents information on Batch Processing KPI Metrics, Dashboard Rejection Rate. It is also available for immediate download and adjustment. So, changes can be made in the color, design, graphics or any other component to create a unique layout.


 Continue with Email

 Home
Home


