Agenda Infographic
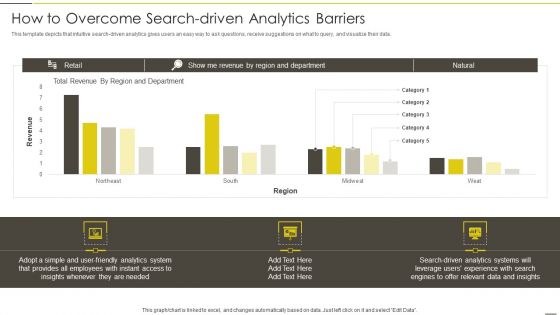
Administered Data And Analytic Quality Playbook How To Overcome Search Driven Analytics Barriers Infographics PDF
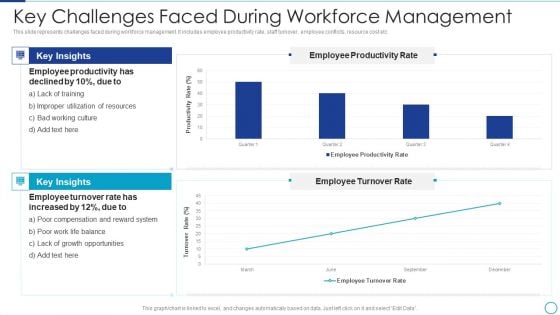
Workforce Management Strategies For Effective Hiring Process Key Challenges Faced During Infographics Microsoft PDF
This slide represents challenges faced during workforce management. It includes employee productivity rate, staff turnover, employee conflicts, resource cost etc. Deliver and pitch your topic in the best possible manner with this Workforce Management Strategies For Effective Hiring Process Key Challenges Faced During Infographics Microsoft PDF. Use them to share invaluable insights on Workforce Management, Employee Productivity, Employee Turnover and impress your audience. This template can be altered and modified as per your expectations. So, grab it now.
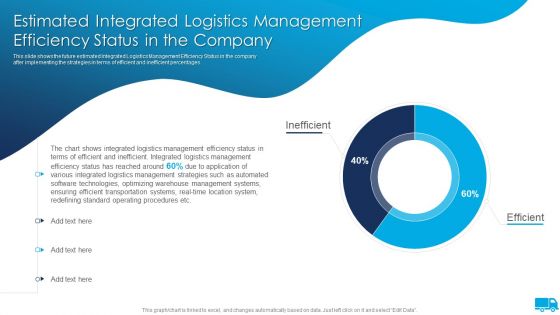
Strategies For Integrated Logistics Management Enhancing Order Efficiency Estimated Integrated Logistics Infographics PDF
This slide shows the future estimated Integrated Logistics Management Efficiency Status in the company after implementing the strategies in terms of efficient and inefficient percentages.Deliver an awe inspiring pitch with this creative Strategies For Integrated Logistics Management Enhancing Order Efficiency Estimated Integrated Logistics Infographics PDF bundle. Topics like Integrated Logistics, Inefficient Integrated, Various Integrated can be discussed with this completely editable template. It is available for immediate download depending on the needs and requirements of the user.
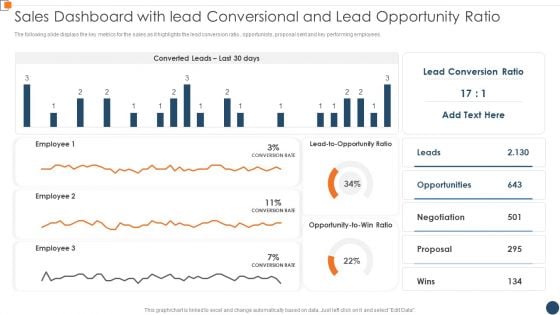
BANT Sales Lead Qualification Model Sales Dashboard With Lead Conversional And Lead Infographics PDF
The following slide displays the key metrics for the sales as it highlights the lead conversion ratio , opportunists, proposal sent and key performing employees. Deliver and pitch your topic in the best possible manner with this BANT Sales Lead Qualification Model Sales Dashboard With Lead Conversional And Lead Infographics PDF. Use them to share invaluable insights on Converted Leads, Lead Conversion, Employee Leads and impress your audience. This template can be altered and modified as per your expectations. So, grab it now.
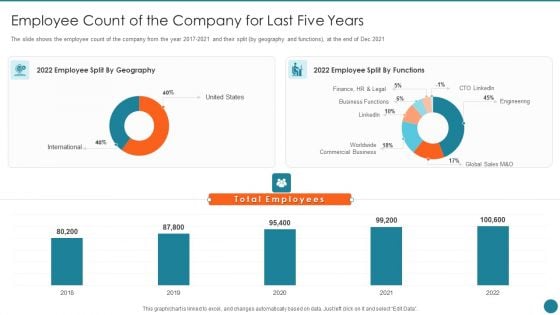
Business Overview Of An Information Technology Company Employee Count Of The Company Infographics PDF
The slide shows the employee count of the company from the year 2017 to 2021 and their split by geography and functions, at the end of Dec 2021 Deliver an awe inspiring pitch with this creative Business Overview Of An Information Technology Company Employee Count Of The Company Infographics PDF bundle. Topics like Employee Geography, Engineering, Business Functions can be discussed with this completely editable template. It is available for immediate download depending on the needs and requirements of the user.
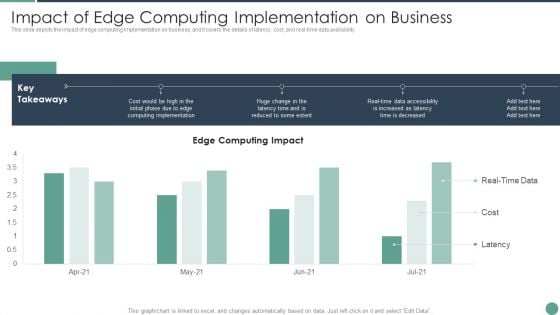
Distributed Computing Impact Of Edge Computing Implementation On Business Infographics PDF
This slide depicts the impact of edge computing implementation on business, and it covers the details of latency, cost, and real-time data availability.Deliver an awe inspiring pitch with this creative Distributed Computing Impact Of Edge Computing Implementation On Business Infographics PDF bundle. Topics like Computing Implementation, Increased Latency, Reduced Extent can be discussed with this completely editable template. It is available for immediate download depending on the needs and requirements of the user.
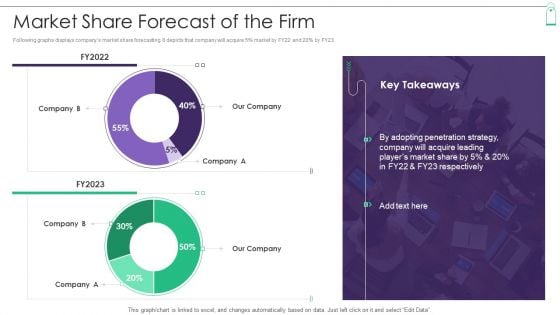
New Product Sales Strategy And Marketing Market Share Forecast Of The Firm Infographics PDF
Following graphs displays companys market share forecasting. It depicts that company will acquire 5 percent market by FY22 and 20 percent by FY23. Deliver and pitch your topic in the best possible manner with this New Product Sales Strategy And Marketing Market Share Forecast Of The Firm Infographics PDF. Use them to share invaluable insights on Market Share Forecast and impress your audience. This template can be altered and modified as per your expectations. So, grab it now.

Cios Methodologies To Improve IT Spending Determine Overall It Cost Breakdown Infographics PDF
This slide provides information regarding overall It cost breakdown and overspend assessment to determine major areas where cost are high, and budget is overspend. Deliver and pitch your topic in the best possible manner with this Cios Methodologies To Improve IT Spending Determine Overall It Cost Breakdown Infographics PDF Use them to share invaluable insights on Technician Utilization, Abandonment, Service Level and impress your audience. This template can be altered and modified as per your expectations. So, grab it now.
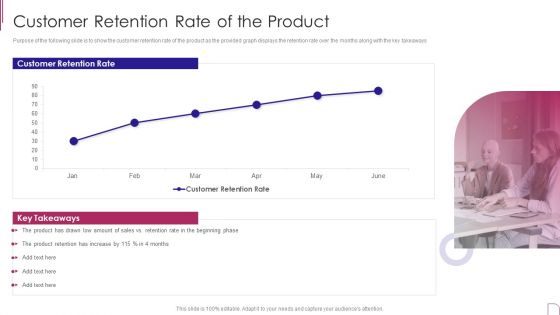
Yearly Product Performance Assessment Repor Customer Retention Rate Of The Product Infographics PDF
Purpose of the following slide is to show the customer retention rate of the product as the provided graph displays the retention rate over the months along with the key takeaways.Deliver an awe inspiring pitch with this creative Yearly Product Performance Assessment Repor Customer Retention Rate Of The Product Infographics PDF bundle. Topics like Customer Retention, Retention Increase, Retention Beginning can be discussed with this completely editable template. It is available for immediate download depending on the needs and requirements of the user.
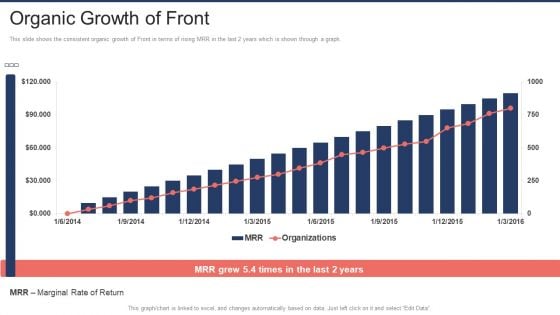
Front Capital Funding Organic Growth Of Front Ppt Inspiration Infographics PDF
This slide shows the consistent organic growth of Front in terms of rising MRR in the last 2 years which is shown through a graph. Deliver an awe inspiring pitch with this creative Front Capital Funding Organic Growth Of Front Ppt Inspiration Infographics PDF bundle. Topics like Marginal Rate Return, Organizations can be discussed with this completely editable template. It is available for immediate download depending on the needs and requirements of the user.
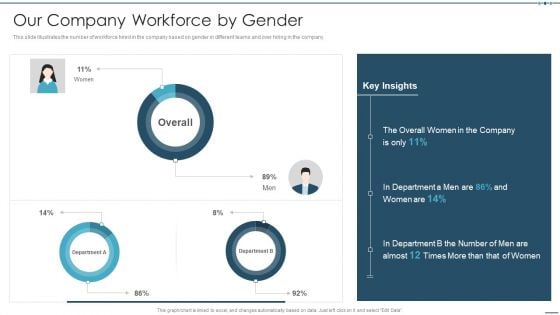
Setting Workplace Diversity And Inclusivity Objectives Our Company Workforce By Gender Infographics PDF
This slide illustrates the number of workforce hired in the company based on gender in different teams and over hiring in the company.Deliver an awe inspiring pitch with this creative Setting Workplace Diversity And Inclusivity Objectives Our Company Workforce By Gender Infographics PDF bundle. Topics like Overall Women, Department A Men, Overall can be discussed with this completely editable template. It is available for immediate download depending on the needs and requirements of the user.
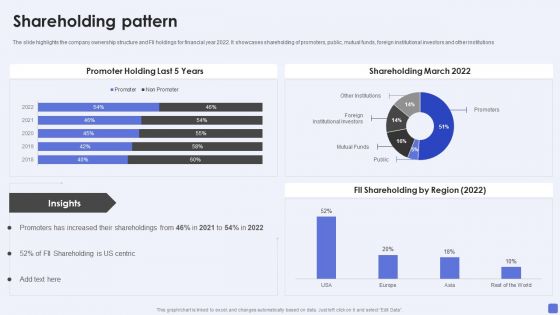
Software Services Business Profile Shareholding Pattern Ppt PowerPoint Presentation File Infographics PDF
The slide highlights the company ownership structure and FII holdings for financial year 2022. It showcases shareholding of promoters, public, mutual funds, foreign institutional investors and other institutions. Deliver an awe inspiring pitch with this creative Software Services Business Profile Shareholding Pattern Ppt PowerPoint Presentation File Infographics PDF bundle. Topics like Promoter Holding, Shareholding March 2022, Foreign Institutional Investors can be discussed with this completely editable template. It is available for immediate download depending on the needs and requirements of the user.
Remarketing Techniques Dashboard For Tracking Twitter Retargeting Campaign Tracking Infographics PDF
This slide covers metrics for analysing the results of Twitter retargeting campaigns. It includes KPIs such as click-through rate, impressions, conversion rate, cost, cost per click, etc. Deliver an awe inspiring pitch with this creative Remarketing Techniques Dashboard For Tracking Twitter Retargeting Campaign Tracking Infographics PDF bundle. Topics like Conversion Rate Cost, Cost Per Click, Platform Breakdown, Top Campaign can be discussed with this completely editable template. It is available for immediate download depending on the needs and requirements of the user.
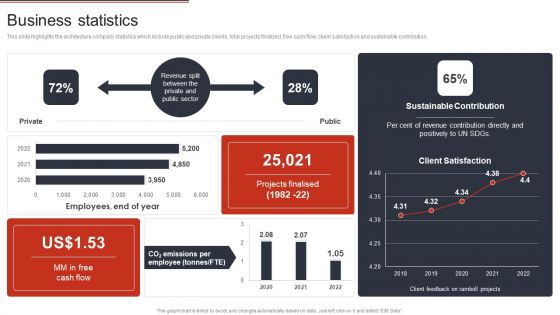
Building Design Firm Details Business Statistics Ppt Infographics Design Templates PDF
This slide highlights the architecture company statistics which include public and private clients, total projects finalized, free cash flow, client satisfaction and sustainable contribution. Deliver an awe inspiring pitch with this creative Building Design Firm Details Business Statistics Ppt Infographics Design Templates PDF bundle. Topics like Private, Sustainable Contribution, Employees can be discussed with this completely editable template. It is available for immediate download depending on the needs and requirements of the user.
VID Dashboard For Tracking Downloads In End User Computing Environment Infographics PDF
This slide represents the dashboard for tracking downloads of apps in end user computing environment by covering details of average patch time, quality updates and so on.Deliver an awe inspiring pitch with this creative VID Dashboard For Tracking Downloads In End User Computing Environment Infographics PDF bundle. Topics like Distribution Pilot, Average, Windows Devices can be discussed with this completely editable template. It is available for immediate download depending on the needs and requirements of the user.
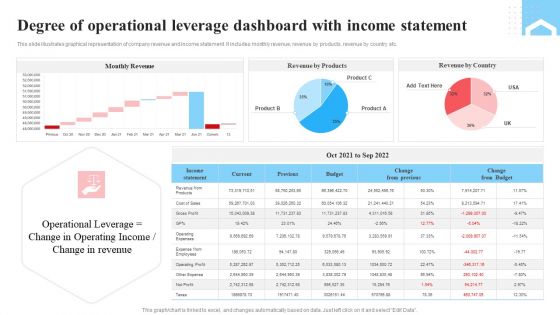
Degree Of Operational Leverage Dashboard With Income Statement Ppt Infographics Layout PDF
This slide illustrates graphical representation of company revenue and income statement. It includes monthly revenue, revenue by products, revenue by country etc. Pitch your topic with ease and precision using this Degree Of Operational Leverage Dashboard With Income Statement Ppt Infographics Layout PDF. This layout presents information on Monthly Revenue, Income Statement, Product. It is also available for immediate download and adjustment. So, changes can be made in the color, design, graphics or any other component to create a unique layout.
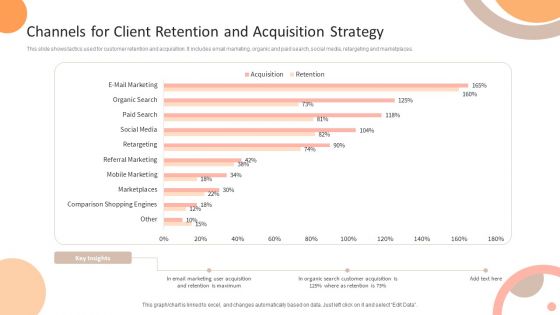
Channels For Client Retention And Acquisition Strategy Ppt Infographics Gridlines PDF
This slide shows tactics used for customer retention and acquisition. It includes email marketing, organic and paid search, social media, retargeting and marketplaces. Showcasing this set of slides titled Channels For Client Retention And Acquisition Strategy Ppt Infographics Gridlines PDF. The topics addressed in these templates are Marketplaces, Mobile Marketing, E Mail Marketing. All the content presented in this PPT design is completely editable. Download it and make adjustments in color, background, font etc. as per your unique business setting.
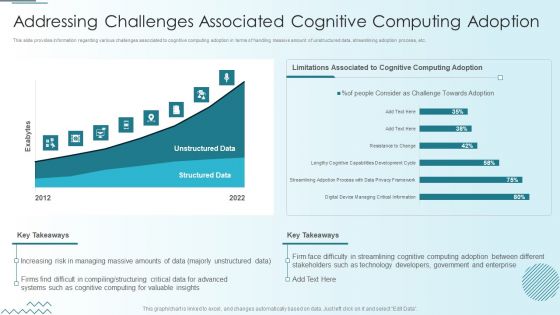
Computer Simulation Human Thinking Addressing Challenges Associated Cognitive Computing Infographics PDF
This slide provides information regarding various challenges associated to cognitive computing adoption in terms of handling massive amount of unstructured data, streamlining adoption process, etc. Deliver and pitch your topic in the best possible manner with this Computer Simulation Human Thinking Addressing Challenges Associated Cognitive Computing Infographics PDF. Use them to share invaluable insights on Limitations Associated, Cognitive Computing Adoption, Unstructured Data and impress your audience. This template can be altered and modified as per your expectations. So, grab it now.

How AI And Machine Learning Can Revolutionize Sales And Marketing Infographics PDF
This template covers the benefits of AI for the Sales and Marketing team. AI and Machine Learning benefits in the area of lead quality, engagement, and better understanding of buyer intent.Deliver an awe inspiring pitch with this creative How AI And Machine Learning Can Revolutionize Sales And Marketing Infographics PDF bundle. Topics like Anticipated Emotions, Strategies To Enhance, Index Recommend can be discussed with this completely editable template. It is available for immediate download depending on the needs and requirements of the user.
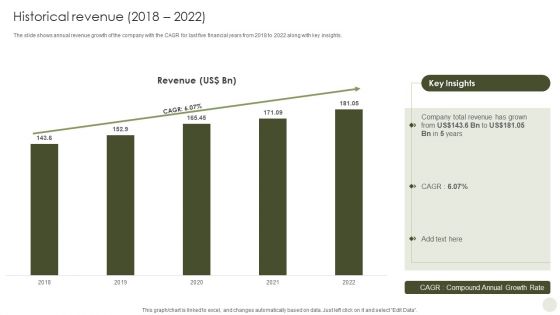
Commercial Bank Financial Services Company Profile Historical Revenue 2018 To 2022 Infographics PDF
The slide shows annual revenue growth of the company with the CAGR for last five financial years from 2018 to 2022 along with key insights. Deliver and pitch your topic in the best possible manner with this Commercial Bank Financial Services Company Profile Historical Revenue 2018 To 2022 Infographics PDF. Use them to share invaluable insights on Historical Revenue and impress your audience. This template can be altered and modified as per your expectations. So, grab it now.
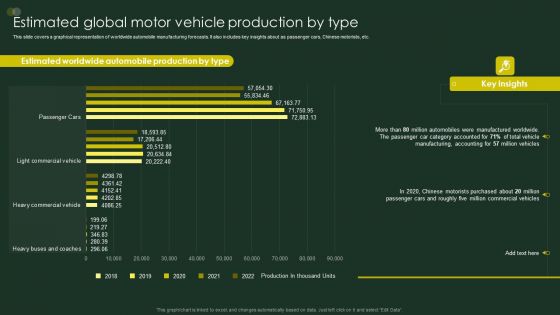
Global Automobile Sector Overview Estimated Global Motor Vehicle Production By Type Infographics PDF
This slide covers a graphical representation of worldwide automobile manufacturing forecasts. It also includes key insights about as passenger cars, Chinese motorists, etc. Deliver an awe inspiring pitch with this creative Global Automobile Sector Overview Estimated Global Motor Vehicle Production By Type Infographics PDF bundle. Topics like Estimated Worldwide, Automobile Production, Manufacturing Accounting can be discussed with this completely editable template. It is available for immediate download depending on the needs and requirements of the user.
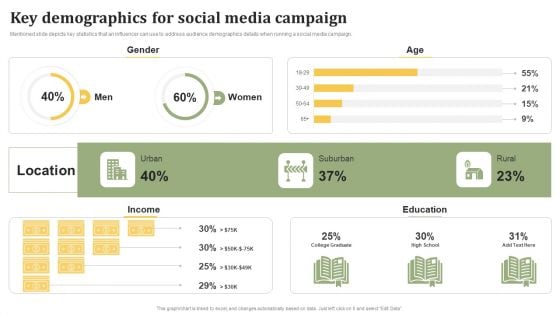
Influencer Advertising Toolkit Key Demographics For Social Media Campaign Infographics PDF
Mentioned slide depicts key statistics that an influencer can use to address audience demographics details when running a social media campaign. Deliver and pitch your topic in the best possible manner with this Influencer Advertising Toolkit Key Demographics For Social Media Campaign Infographics PDF. Use them to share invaluable insights on Key Demographics, Social Media, Campaign and impress your audience. This template can be altered and modified as per your expectations. So, grab it now.
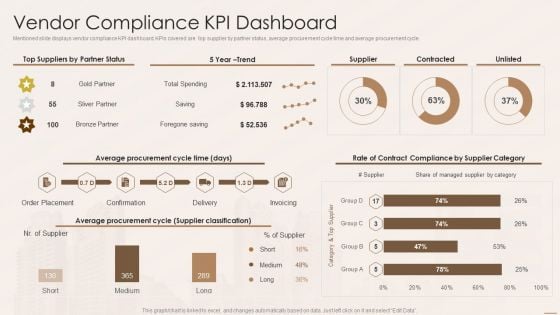
Real Estate Developers Funding Alternatives Vendor Compliance Kpi Dashboard Infographics PDF
Mentioned slide displays vendor compliance KPI dashboard. KPIs covered are top supplier by partner status, average procurement cycle time and average procurement cycle. Deliver and pitch your topic in the best possible manner with this Real Estate Developers Funding Alternatives Vendor Compliance Kpi Dashboard Infographics PDF. Use them to share invaluable insights on Average Procurement Cycle, Supplier Classification and impress your audience. This template can be altered and modified as per your expectations. So, grab it now.
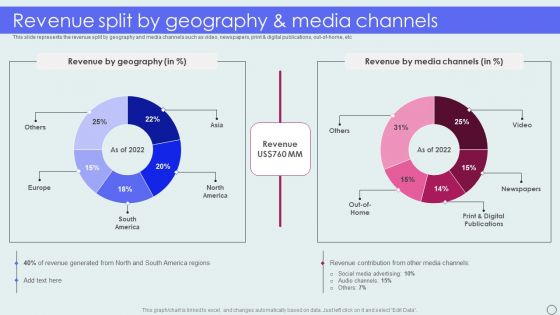
Advertising Solutions Company Details Revenue Split By Geography And Media Channels Infographics PDF
This slide represents the revenue split by geography and media channels such as video, newspapers, printand digital publications, out-of-home, etc. Deliver an awe inspiring pitch with this creative Advertising Solutions Company Details Revenue Split By Geography And Media Channels Infographics PDF bundle. Topics like Revenue Geography, Revenue Media Channels can be discussed with this completely editable template. It is available for immediate download depending on the needs and requirements of the user.
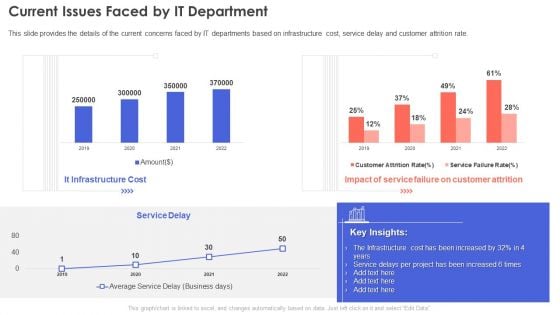
IT Infrastructure Management Current Issues Faced By IT Department Infographics PDF
This slide provides the details of the current concerns faced by IT departments based on infrastructure cost, service delay and customer attrition rate.Deliver and pitch your topic in the best possible manner with this IT Infrastructure Management Current Issues Faced By IT Department Infographics PDF. Use them to share invaluable insights on Infrastructure Cost, Service Failure, Customer Attrition and impress your audience. This template can be altered and modified as per your expectations. So, grab it now.
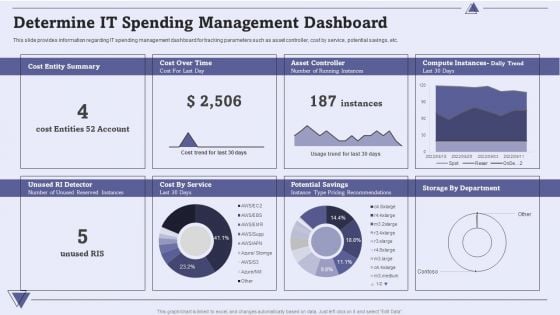
CIO For IT Cost Optimization Techniques Determine IT Spending Management Dashboard Infographics PDF
This slide provides information regarding IT spending management dashboard for tracking parameters such as asset controller, cost by service, potential savings, etc. Deliver and pitch your topic in the best possible manner with this CIO For IT Cost Optimization Techniques Determine IT Spending Management Dashboard Infographics PDF. Use them to share invaluable insights on Cost Entity Summary, Potential Savings, Cost By Service and impress your audience. This template can be altered and modified as per your expectations. So, grab it now.
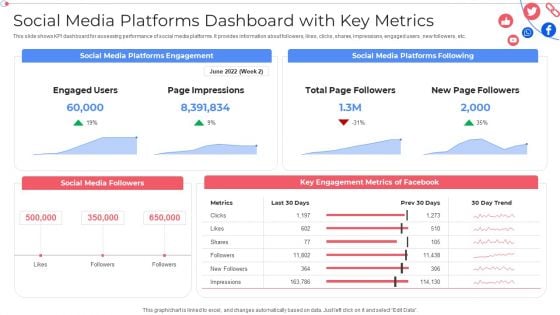
Social Media Platforms Dashboard With Key Metrics Customer Group Engagement Through Social Media Channels Infographics PDF
This slide shows KPI dashboard for assessing performance of social media platforms. It provides information about followers, likes, clicks, shares, impressions, engaged users , new followers, etc. Deliver an awe inspiring pitch with this creative Social Media Platforms Dashboard With Key Metrics Customer Group Engagement Through Social Media Channels Infographics PDF bundle. Topics like Social Media Followers, Key Engagement Metrics can be discussed with this completely editable template. It is available for immediate download depending on the needs and requirements of the user.
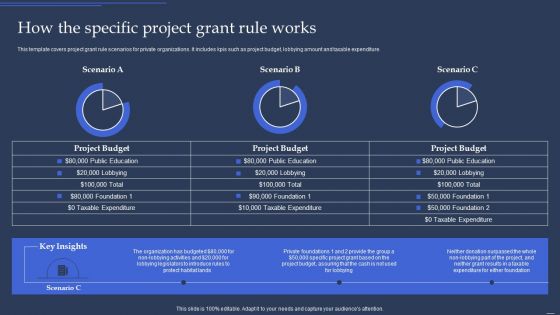
Community Policy Resources How The Specific Project Grant Rule Works Infographics PDF
This template covers project grant rule scenarios for private organizations. It includes kpis such as project budget, lobbying amount and taxable expenditure.Deliver and pitch your topic in the best possible manner with this Community Policy Resources How The Specific Project Grant Rule Works Infographics PDF. Use them to share invaluable insights on Lobbying Legislators, Organization Budgeted, Budget Assuring and impress your audience. This template can be altered and modified as per your expectations. So, grab it now.
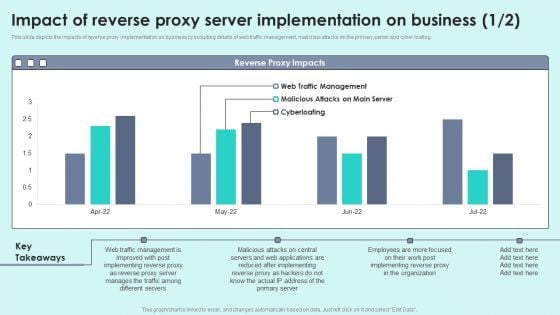
Impact Of Reverse Proxy Server Implementation On Business Reverse Proxy For Load Balancing Infographics PDF
This slide depicts the impacts of reverse proxy implementation on business by including details of web traffic management, malicious attacks on the primary server and cyber loafing.Deliver an awe inspiring pitch with this creative Impact Of Reverse Proxy Server Implementation On Business Reverse Proxy For Load Balancing Infographics PDF bundle. Topics like After Implementing, Manages Traffic, Different Servers can be discussed with this completely editable template. It is available for immediate download depending on the needs and requirements of the user.
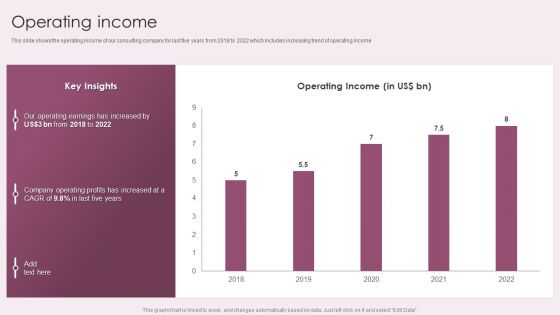
Business Advisory Solutions Company Profile Operating Income Ppt Infographics Slideshow PDF
This slide shows the operating income of our consulting company for last five years from 2018 to 2022 which includes increasing trend of operating income. Deliver an awe inspiring pitch with this creative Business Advisory Solutions Company Profile Operating Income Ppt Infographics Slideshow PDF bundle. Topics like Operating Income, Key Insights, Our Operating Earnings can be discussed with this completely editable template. It is available for immediate download depending on the needs and requirements of the user.
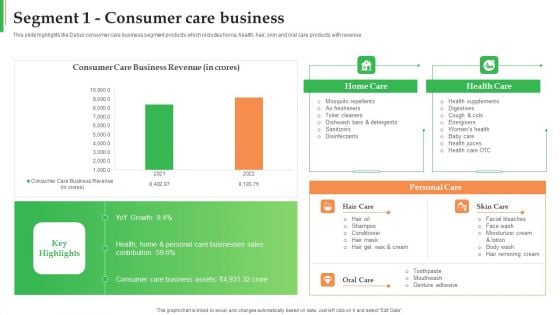
Dabur Business Profile Segment 1 Consumer Care Business Ppt Infographics Portfolio PDF
This slide highlights the Dabur consumer care business segment products which includes home, health, hair, skin and oral care products with revenue. Deliver an awe inspiring pitch with this creative Dabur Business Profile Segment 1 Consumer Care Business Ppt Infographics Portfolio PDF bundle. Topics like Consumer Care, Business Revenue, Home Care, Health Care can be discussed with this completely editable template. It is available for immediate download depending on the needs and requirements of the user.
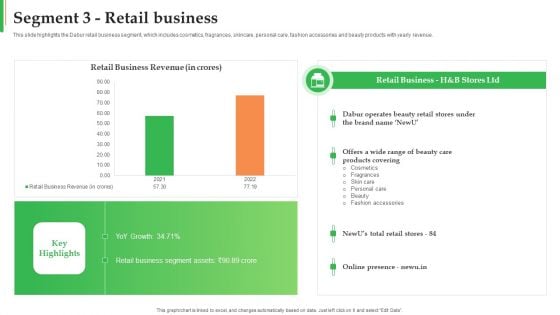
Dabur Business Profile Segment 3 Retail Business Ppt Infographics Summary PDF
This slide highlights the Dabur retail business segment, which includes cosmetics, fragrances, skincare, personal care, fashion accessories and beauty products with yearly revenue. Deliver an awe inspiring pitch with this creative Dabur Business Profile Segment 3 Retail Business Ppt Infographics Summary PDF bundle. Topics like Retail Business, Products Covering, Brand can be discussed with this completely editable template. It is available for immediate download depending on the needs and requirements of the user.
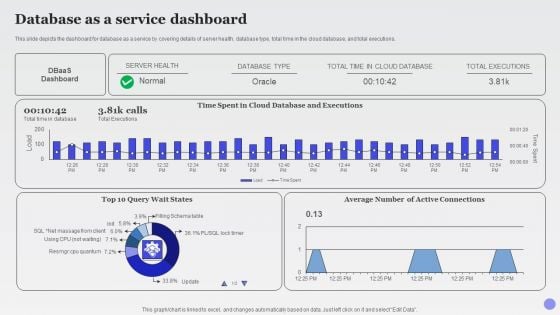
Database As A Service Dashboard Xaas Cloud Computing Models Ppt PowerPoint Presentation Infographics Graphics Design PDF
This slide depicts the dashboard for database as a service by covering details of server health, database type, total time in the cloud database, and total executions.Deliver an awe inspiring pitch with this creative Database As A Service Dashboard Xaas Cloud Computing Models Ppt PowerPoint Presentation Infographics Graphics Design PDF bundle. Topics like Database Executions, Active Connections, Total Executions can be discussed with this completely editable template. It is available for immediate download depending on the needs and requirements of the user.
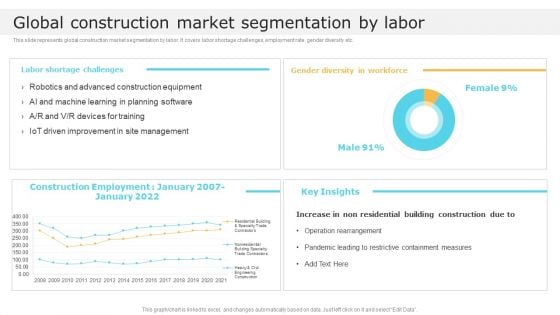
Global Construction Market Segmentation By Labor Global Construction Market Overview Infographics PDF
This slide represents global construction market segmentation by labor. It covers labor shortage challenges, employment rate, gender diversity etc. Deliver and pitch your topic in the best possible manner with this Global Construction Market Segmentation By Labor Global Construction Market Overview Infographics PDF. Use them to share invaluable insights on Management, Construction Equipment, Containment Measures and impress your audience. This template can be altered and modified as per your expectations. So, grab it now.
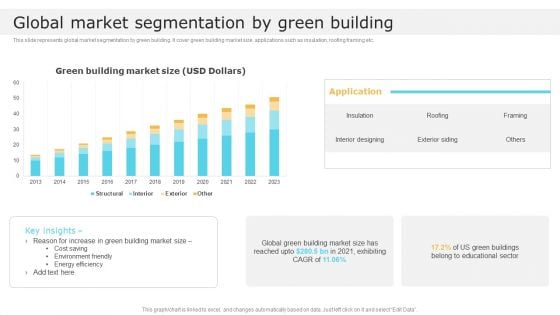
Global Market Segmentation By Green Building Global Construction Market Overview Infographics PDF
This slide represents global market segmentation by green building. It cover green building market size, applications such as insulation, roofing framing etc. Deliver an awe inspiring pitch with this creative Global Market Segmentation By Green Building Global Construction Market Overview Infographics PDF bundle. Topics like Environment Friendly, Cost Saving, Global can be discussed with this completely editable template. It is available for immediate download depending on the needs and requirements of the user.
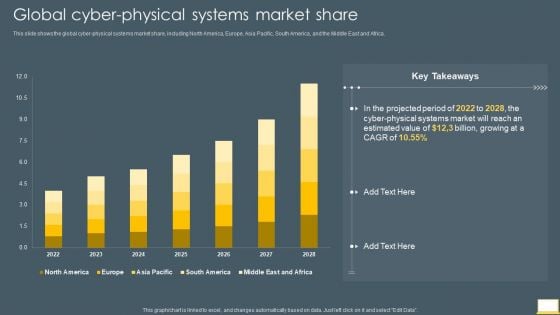
Cyber Intelligent Computing System Global Cyber Physical Systems Market Share Infographics PDF
This slide shows the global cyber physical systems market share, including North America, Europe, Asia Pacific, South America, and the Middle East and Africa. Deliver and pitch your topic in the best possible manner with this Cyber Intelligent Computing System Global Cyber Physical Systems Market Share Infographics PDF. Use them to share invaluable insights on Estimated Value, Cyber Physical Systems Market and impress your audience. This template can be altered and modified as per your expectations. So, grab it now.
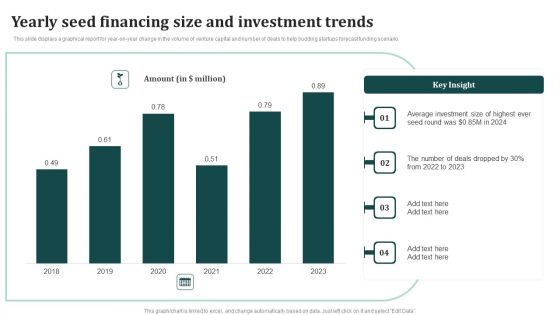
Yearly Seed Financing Size And Investment Trends Ppt Infographics Influencers PDF
This slide displays a graphical report for year-on-year change in the volume of venture capital and number of deals to help budding startups forecast funding scenario. Showcasing this set of slides titled Yearly Seed Financing Size And Investment Trends Ppt Infographics Influencers PDF. The topics addressed in these templates areAverage Investment, Highest Seed, 2022 To 2023. All the content presented in this PPT design is completely editable. Download it and make adjustments in color, background, font etc. as per your unique business setting.
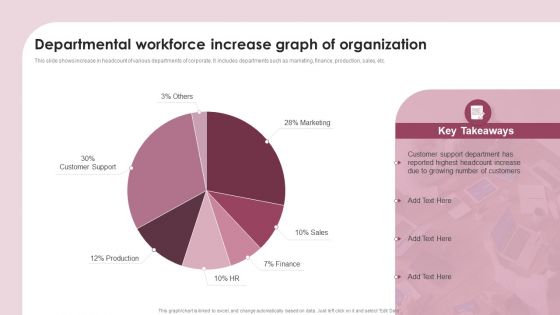
Departmental Workforce Increase Graph Of Organization Ppt Infographics Graphics Pictures PDF
This slide shows increase in headcount of various departments of corporate. It includes departments such as marketing, finance, production, sales, etc. Showcasing this set of slides titled Departmental Workforce Increase Graph Of Organization Ppt Infographics Graphics Pictures PDF. The topics addressed in these templates are Customer Support Department, Number Customers, Highest Headcount. All the content presented in this PPT design is completely editable. Download it and make adjustments in color, background, font etc. as per your unique business setting.
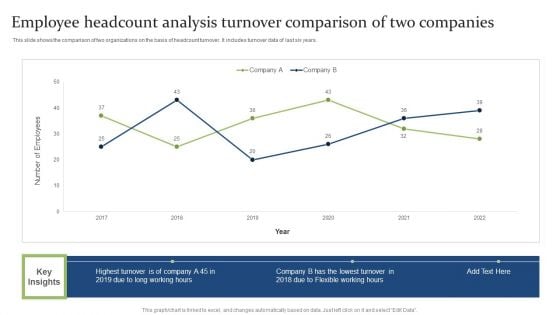
Employee Headcount Analysis Turnover Comparison Of Two Companies Ppt PowerPoint Presentation Infographics Smartart PDF
This slide shows the comparison of two organizations on the basis of headcount turnover. It includes turnover data of last six years. Showcasing this set of slides titled Employee Headcount Analysis Turnover Comparison Of Two Companies Ppt PowerPoint Presentation Infographics Smartart PDF. The topics addressed in these templates are Highest Turnover, Flexible Working, Lowest. All the content presented in this PPT design is completely editable. Download it and make adjustments in color, background, font etc. as per your unique business setting.
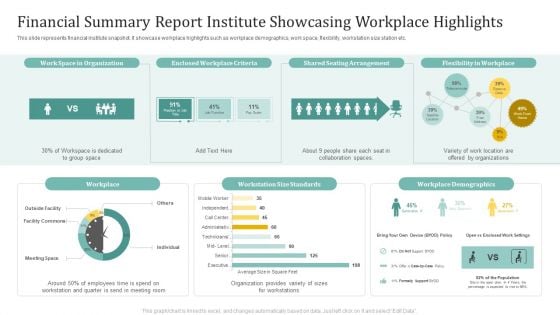
Financial Summary Report Institute Showcasing Workplace Highlights Ppt Infographics Inspiration PDF
This slide represents financial institute snapshot. It showcase workplace highlights such as workplace demographics, work space, flexibility, workstation size station etc. Pitch your topic with ease and precision using this Financial Summary Report Institute Showcasing Workplace Highlights Ppt Infographics Inspiration PDF. This layout presents information on Shared Seating Arrangement, Flexibility Workplace, Workplace. It is also available for immediate download and adjustment. So, changes can be made in the color, design, graphics or any other component to create a unique layout.
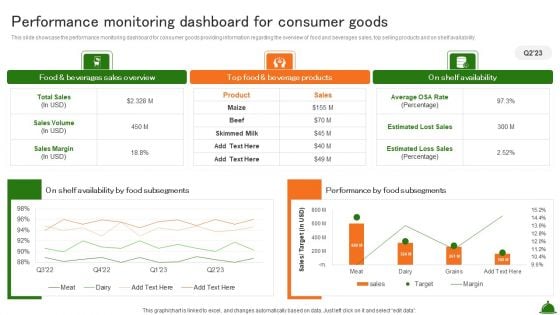
Performance Monitoring Dashboard For Consumer Goods Industry Analysis Of Food Infographics PDF
This slide showcase the performance monitoring dashboard for consumer goods providing information regarding the overview of food and beverages sales, top selling products and on shelf availability.There are so many reasons you need a Performance Monitoring Dashboard For Consumer Goods Industry Analysis Of Food Infographics PDF. The first reason is you can not spend time making everything from scratch, Thus, Slidegeeks has made presentation templates for you too. You can easily download these templates from our website easily.
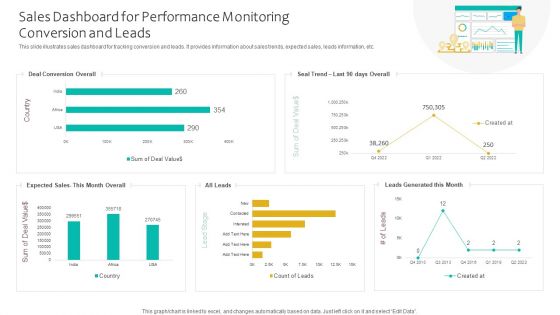
Sales Dashboard For Performance Monitoring Conversion And Leads Ppt Infographics Smartart PDF
This slide illustrates sales dashboard for tracking conversion and leads. It provides information about sales trends, expected sales, leads information, etc. Showcasing this set of slides titled Sales Dashboard For Performance Monitoring Conversion And Leads Ppt Infographics Smartart PDF. The topics addressed in these templates are Deal Conversion Overall, Expected Sales, Leads Generated. All the content presented in this PPT design is completely editable. Download it and make adjustments in color, background, font etc. as per your unique business setting.

Emotional Marketing Strategy To Nurture Clustered Column Ppt Infographics Slide PDF
Present like a pro with Emotional Marketing Strategy To Nurture Clustered Column Ppt Infographics Slide PDF Create beautiful presentations together with your team, using our easy-to-use presentation slides. Share your ideas in real-time and make changes on the fly by downloading our templates. So whether youre in the office, on the go, or in a remote location, you can stay in sync with your team and present your ideas with confidence. With Slidegeeks presentation got a whole lot easier. Grab these presentations today.
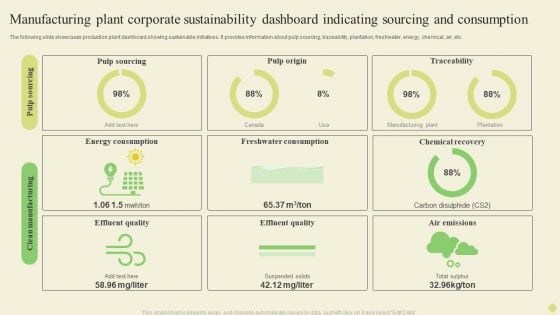
Manufacturing Plant Corporate Sustainability Dashboard Indicating Sourcing And Consumption Infographics PDF
The following slide showcases business sustainability dashboard highlighting multiple sources of technology. It provides information about renewable energy, plant age, solar, wind, biomass, regionality, etc.Pitch your topic with ease and precision using this Manufacturing Plant Corporate Sustainability Dashboard Indicating Sourcing And Consumption Infographics PDF. This layout presents information on Energy Consumption, Freshwater Consumption, Chemical Recovery. It is also available for immediate download and adjustment. So, changes can be made in the color, design, graphics or any other component to create a unique layout.

Quarterly Comparison Of Security For Cloud Based Systems Threats Infographics PDF
This slide shows the various types of cloud security threats occurred during four quarters. It includes phishing, malware, IoT and password attacks. Pitch your topic with ease and precision using this Quarterly Comparison Of Security For Cloud Based Systems Threats Infographics PDF. This layout presents information on Quarterly Comparison Of Security, Cloud Based Systems Threats. It is also available for immediate download and adjustment. So, changes can be made in the color, design, graphics or any other component to create a unique layout.
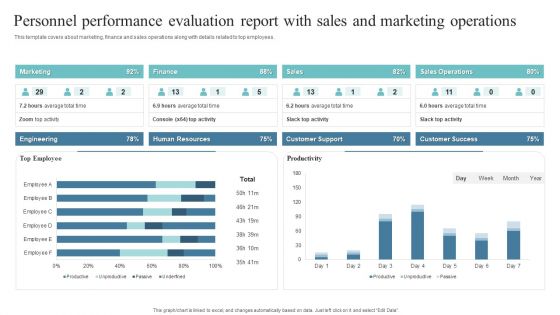
Personnel Performance Evaluation Report With Sales And Marketing Operations Infographics PDF
This template covers about marketing, finance and sales operations along with details related to top employees.Showcasing this set of slides titled Personnel Performance Evaluation Report With Sales And Marketing Operations Infographics PDF. The topics addressed in these templates are Human Resources, Customer Support, Sales Operations. All the content presented in this PPT design is completely editable. Download it and make adjustments in color, background, font etc. as per your unique business setting.
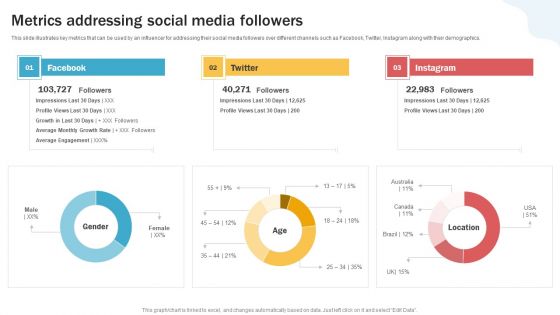
Developing Personal Brand On Social Media Channels Metrics Addressing Social Media Followers Infographics PDF
This slide illustrates key metrics that can be used by an influencer for addressing their social media followers over different channels such as Facebook, Twitter, Instagram along with their demographics.There are so many reasons you need a Developing Personal Brand On Social Media Channels Metrics Addressing Social Media Followers Infographics PDF. The first reason is you can not spend time making everything from scratch, Thus, Slidegeeks has made presentation templates for you too. You can easily download these templates from our website easily.
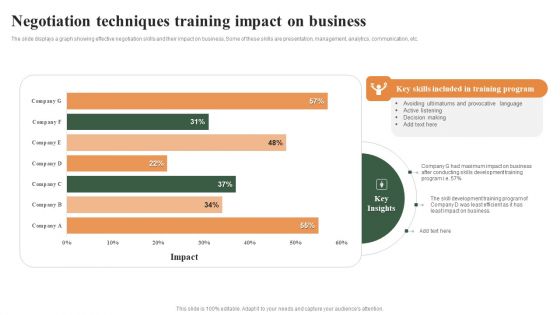
Negotiation Techniques Training Impact On Business Ppt Infographics Visual Aids PDF
The slide displays a graph showing effective negotiation skills and their impact on business, Some of these skills are presentation, management, analytics, communication, etc. Showcasing this set of slides titled Negotiation Techniques Training Impact On Business Ppt Infographics Visual Aids PDF. The topics addressed in these templates are Avoiding Ultimatums, Provocative Language, Active Listening, Decision Making. All the content presented in this PPT design is completely editable. Download it and make adjustments in color, background, font etc. as per your unique business setting.
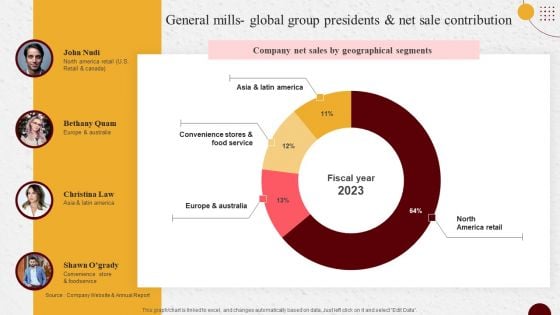
Industry Report Of Packaged Food Products Part 2 General Mills Global Group Infographics PDF
From laying roadmaps to briefing everything in detail, our templates are perfect for you. You can set the stage with your presentation slides. All you have to do is download these easy to edit and customizable templates. Industry Report Of Packaged Food Products Part 2 General Mills Global Group Infographics PDF will help you deliver an outstanding performance that everyone would remember and praise you for. Do download this presentation today.
Product Branding To Enhance Product Sales Performance Tracking Dashboard Infographics PDF
This slide provides information regarding product branding performance tracking dashboard in terms of revenues, new customers, customer satisfaction rate. Make sure to capture your audiences attention in your business displays with our gratis customizable Product Branding To Enhance Product Sales Performance Tracking Dashboard Infographics PDF. These are great for business strategies, office conferences, capital raising or task suggestions. If you desire to acquire more customers for your tech business and ensure they stay satisfied, create your own sales presentation with these plain slides.
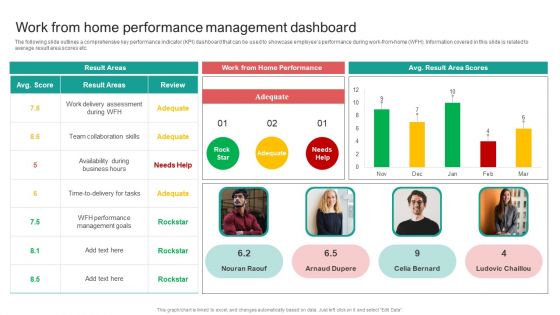
Organising Staff Flexible Job Arrangements Work From Home Performance Management Dashboard Infographics PDF
Take your projects to the next level with our ultimate collection of Organising Staff Flexible Job Arrangements Work From Home Performance Management Dashboard Infographics PDF. Slidegeeks has designed a range of layouts that are perfect for representing task or activity duration, keeping track of all your deadlines at a glance. Tailor these designs to your exact needs and give them a truly corporate look with your own brand colors they will make your projects stand out from the rest.
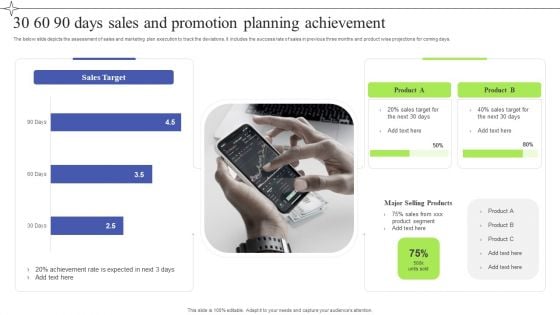
30 60 90 Days Sales And Promotion Planning Achievement Infographics PDF
The below slide depicts the assessment of sales and marketing plan execution to track the deviations. It includes the success rate of sales in previous three months and product wise projections for coming days. Showcasing this set of slides titled 30 60 90 Days Sales And Promotion Planning Achievement Infographics PDF. The topics addressed in these templates are 30 60 90 Days, Sales Promotion Planning, Achievement. All the content presented in this PPT design is completely editable. Download it and make adjustments in color, background, font etc. as per your unique business setting.
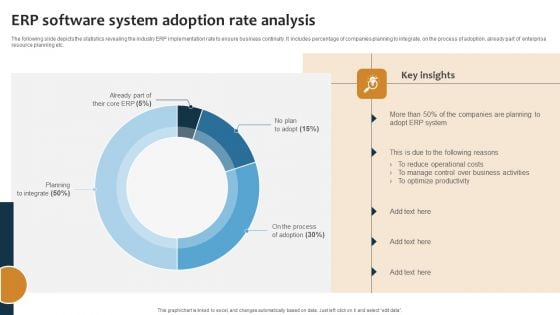
Improving Business Procedures Enterprise Resource Planning System ERP Software System Adoption Rate Infographics PDF
The following slide depicts the statistics revealing the industry ERP implementation rate to ensure business continuity. It includes percentage of companies planning to integrate, on the process of adoption, already part of enterprise resource planning etc. Make sure to capture your audiences attention in your business displays with our gratis customizable Improving Business Procedures Enterprise Resource Planning System ERP Software System Adoption Rate Infographics PDF. These are great for business strategies, office conferences, capital raising or task suggestions. If you desire to acquire more customers for your tech business and ensure they stay satisfied, create your own sales presentation with these plain slides.
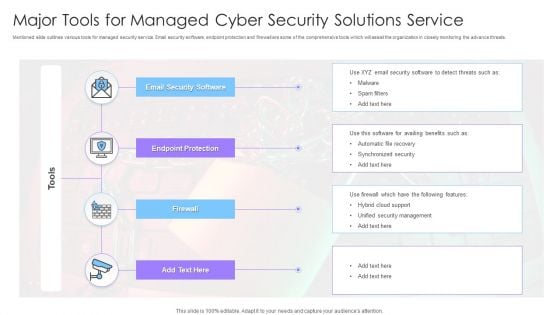
Major Tools For Managed Cyber Security Solutions Service Ppt Infographics Graphics Tutorials PDF
Mentioned slide outlines various tools for managed security service. Email security software, endpoint protection and firewall are some of the comprehensive tools which will assist the organization in closely monitoring the advance threats. Showcasing this set of slides titled Major Tools For Managed Cyber Security Solutions Service Ppt Infographics Graphics Tutorials PDF. The topics addressed in these templates are Endpoint Protection, Firewall, Email Security. All the content presented in this PPT design is completely editable. Download it and make adjustments in color, background, font etc. as per your unique business setting.
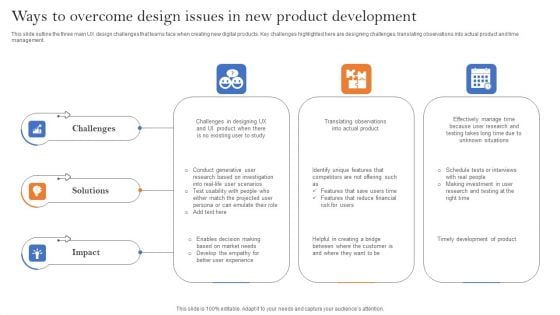
Ways To Overcome Design Issues In New Product Development Infographics PDF
This slide outline the three main UX design challenges that teams face when creating new digital products. Key challenges highlighted here are designing challenges, translating observations into actual product and time management. Showcasing this set of slides titled Ways To Overcome Design Issues In New Product Development Infographics PDF. The topics addressed in these templates are Challenges, Solutions, Impact. All the content presented in this PPT design is completely editable. Download it and make adjustments in color, background, font etc. as per your unique business setting.

Process Of Transfer Digital Assets Between Sidechain And Its Mainnet Infographics PDF
This slide outlines the procedure to transfer digital assets between the sidechain and its mainnet. The purpose of this slide is to showcase the working process of a sidechain blockchain to transfer digital assets. The components include the mainchain, sidechain, smart contracts, and so on. If your project calls for a presentation, then Slidegeeks is your go-to partner because we have professionally designed, easy-to-edit templates that are perfect for any presentation. After downloading, you can easily edit Process Of Transfer Digital Assets Between Sidechain And Its Mainnet Infographics PDF and make the changes accordingly. You can rearrange slides or fill them with different images. Check out all the handy templates
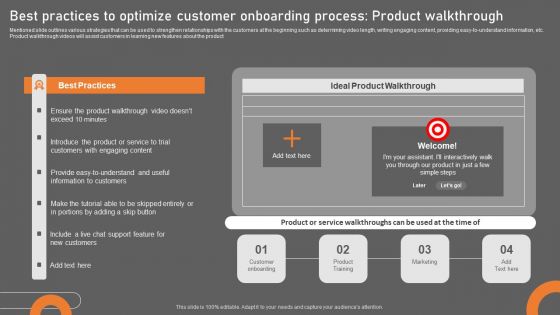
Best Practices To Optimize Customer Onboarding Process Product Walkthrough Infographics PDF

12 Principles Of Agile Manifesto Manifesto For Agile Application Development Infographics PDF
This is a 12 Principles Of Agile Manifesto Manifesto For Agile Application Development Infographics PDF template with various stages. Focus and dispense information on nine stages using this creative set, that comes with editable features. It contains large content boxes to add your information on topics like Welcome Changing Requirement, Collaborate Daily, Motivated, Individuals, Self Organization Teams. You can also showcase facts, figures, and other relevant content using this PPT layout. Grab it now.
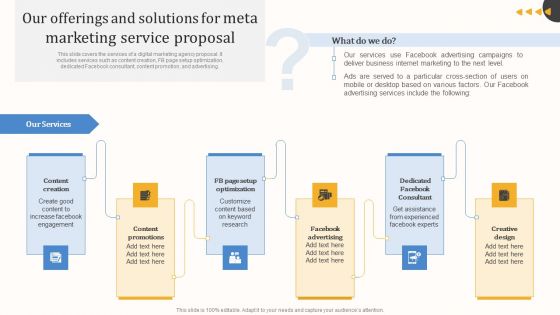
Our Offerings And Solutions For Meta Marketing Service Proposal Infographics PDF
This slide covers the services of a digital marketing agency proposal. It includes services such as content creation, FB page setup optimization, dedicated Facebook consultant, content promotion, and advertising. Take your presentations to the next level with our Our Offerings And Solutions For Meta Marketing Service Proposal Infographics PDF template. With its sleek design and seamless editing features, this single-slide PPT template is a game-changer for professionals who want to make an impact. Impress your audience with stunning visuals and engaging content that will capture their attention from start to finish. Get your hands on our template and elevate your presentations to new heights.
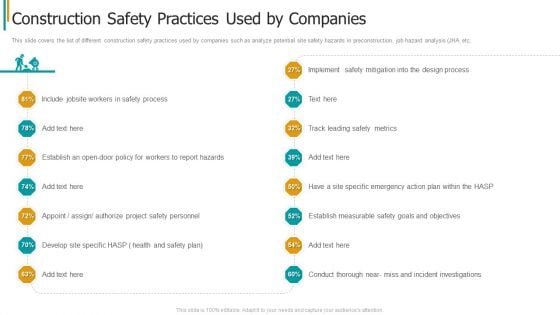
Construction Sector Project Risk Management Construction Safety Practices Used By Companies Infographics PDF
This slide covers the list of different construction safety practices used by companies such as analyze potential site safety hazards in preconstruction, job hazard analysis JHA etc. This is a construction sector project risk management construction safety practices used by companies infographics pdf template with various stages. Focus and dispense information on fifteen stages using this creative set, that comes with editable features. It contains large content boxes to add your information on topics like develop, goals, process, action plan, measurable. You can also showcase facts, figures, and other relevant content using this PPT layout. Grab it now.


 Continue with Email

 Home
Home


