Agenda Infographic

Nike Brand Strategy Swot Analysis Infographics PDF
This slide presents SWOT analysis of Nikes business strategy helpful in evaluating its performance and strategic position. It includes strengths, weaknesses, opportunities and threats that help to know how existing resources can counteract potential damages. Presenting Nike Brand Strategy Swot Analysis Infographics PDF to dispense important information. This template comprises four stages. It also presents valuable insights into the topics including Weaknesses, Threats, Opportunities, Strengths. This is a completely customizable PowerPoint theme that can be put to use immediately. So, download it and address the topic impactfully.
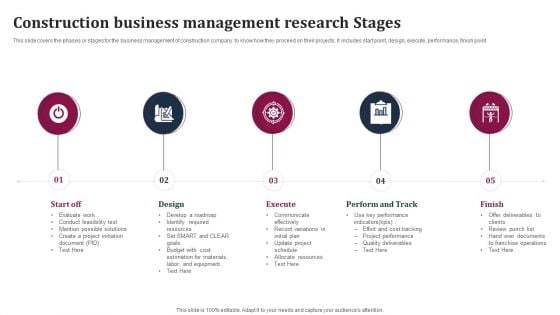
Construction Business Management Research Stages Infographics PDF
This slide covers the phases or stages for the business management of construction company to know how they proceed on their projects. It includes start point, design, execute, performance, finish point.Presenting Construction Business Management Research Stages Infographics PDF to dispense important information. This template comprises five stages. It also presents valuable insights into the topics including Communicate Effectively, Record Variations, Allocate Resources. This is a completely customizable PowerPoint theme that can be put to use immediately. So, download it and address the topic impactfully.
Project Problem Administration Tracking Dashboard Infographics PDF
This slide covers dashboard which helps the project managers to keep the track of all issues in detail. It also includes project name, department, project owner, detail of the issue, priority and status. Showcasing this set of slides titled project problem administration tracking dashboard infographics pdf. The topics addressed in these templates are project problem administration tracking dashboard. All the content presented in this PPT design is completely editable. Download it and make adjustments in color, background, font etc. as per your unique business setting.
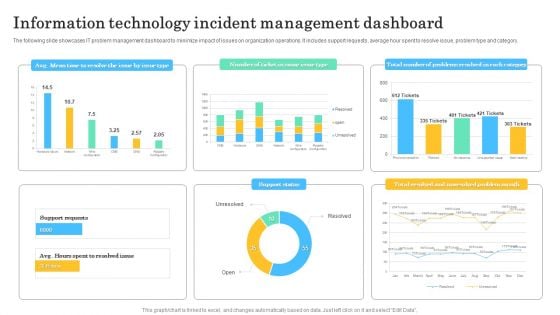
Information Technology Incident Management Dashboard Infographics PDF
The following slide showcases IT problem management dashboard to minimize impact of issues on organization operations. It includes support requests, average hour spent to resolve issue, problem type and category. Showcasing this set of slides titled Information Technology Incident Management Dashboard Infographics PDF. The topics addressed in these templates are Avg Mean Time, Resolve The Issue, Issue Type. All the content presented in this PPT design is completely editable. Download it and make adjustments in color, background, font etc. as per your unique business setting.
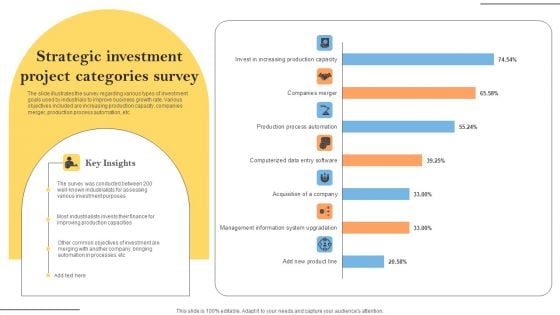
Strategic Investment Project Categories Survey Infographics PDF
The slide illustrates the survey regarding various types of investment goals used by industrials to improve business growth rate. Various objectives included are increasing production capacity, companies merger, production process automation, etc . Showcasing this set of slides titled Strategic Investment Project Categories Survey Infographics PDF. The topics addressed in these templates are Investment, Automation In Processes, Key Insights. All the content presented in this PPT design is completely editable. Download it and make adjustments in color, background, font etc. as per your unique business setting.

Monthly Product Sales Analysis Dashboard Infographics PDF
This slide illustrates a dashboard for product sales review to measure to help business monitor and improve productivity, employee engagement and meet revenue targets. It covers product names with sales reps, lead conversion, response time and outbound calls. Showcasing this set of slides titled Monthly Product Sales Analysis Dashboard Infographics PDF. The topics addressed in these templates are Lead Conversion Rate, Outbound Calls, Sales Analysis Dashboard. All the content presented in this PPT design is completely editable. Download it and make adjustments in color, background, font etc. as per your unique business setting.
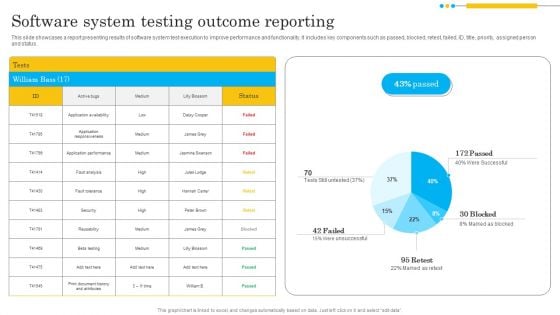
Software System Testing Outcome Reporting Infographics PDF
This slide showcases a report presenting results of software system test execution to improve performance and functionality. It includes key components such as passed, blocked, retest, failed, ID, title, priority, assigned person and status. Showcasing this set of slides titled Software System Testing Outcome Reporting Infographics PDF. The topics addressed in these templates are Application Responsiveness, Application Performance, Security. All the content presented in this PPT design is completely editable. Download it and make adjustments in color, background, font etc. as per your unique business setting.
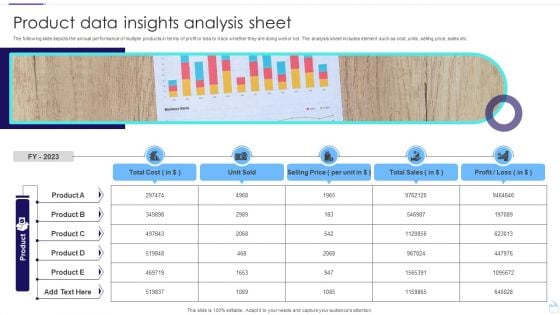
Product Data Insights Analysis Sheet Infographics PDF
The following slide depicts the annual performance of multiple products in terms of profit or loss to track whether they are doing well or not. The analysis sheet includes element such as cost, units, selling price, sales etc. Pitch your topic with ease and precision using this Product Data Insights Analysis Sheet Infographics PDF. This layout presents information on Unit Sold, Selling Price, Total Sales. It is also available for immediate download and adjustment. So, changes can be made in the color, design, graphics or any other component to create a unique layout.
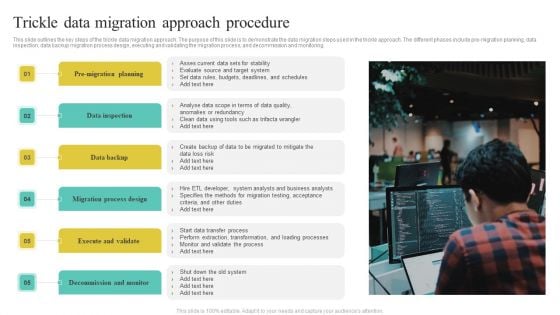
Trickle Data Migration Approach Procedure Infographics PDF
This slide outlines the key steps of the trickle data migration approach. The purpose of this slide is to demonstrate the data migration steps used in the trickle approach. The different phases include pre-migration planning, data inspection, data backup migration process design, executing and validating the migration process, and decommission and monitoring.Presenting Trickle Data Migration Approach Procedure Infographics PDF to dispense important information. This template comprises Five stages. It also presents valuable insights into the topics including Data Inspection, Data Backup, Execute And Validate . This is a completely customizable PowerPoint theme that can be put to use immediately. So, download it and address the topic impactfully.
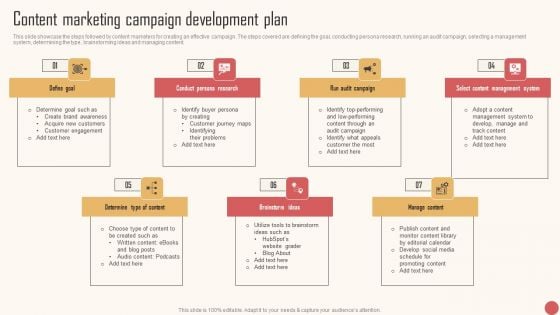
Content Marketing Campaign Development Plan Infographics PDF
This slide showcase the steps followed by content marketers for creating an effective campaign. The steps covered are defining the goal, conducting persona research, running an audit campaign, selecting a management system, determining the type, brainstorming ideas and managing content. Retrieve professionally designed Content Marketing Campaign Development Plan Infographics PDF to effectively convey your message and captivate your listeners. Save time by selecting pre-made slideshows that are appropriate for various topics, from business to educational purposes. These themes come in many different styles, from creative to corporate, and all of them are easily adjustable and can be edited quickly. Access them as PowerPoint templates or as Google Slides themes. You do not have to go on a hunt for the perfect presentation because Slidegeeks got you covered from everywhere.
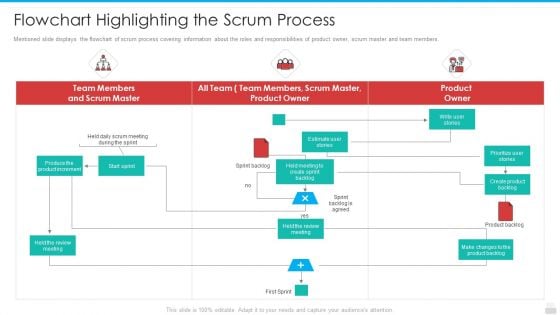
Flowchart Highlighting The Scrum Process Infographics PDF
Mentioned slide displays the flowchart of scrum process covering information about the roles and responsibilities of product owner, scrum master and team members.Presenting flowchart highlighting the scrum process infographics pdf to provide visual cues and insights. Share and navigate important information on three stages that need your due attention. This template can be used to pitch topics like estimate user stories, write user stories, prioritize user stories. In addtion, this PPT design contains high resolution images, graphics, etc, that are easily editable and available for immediate download.
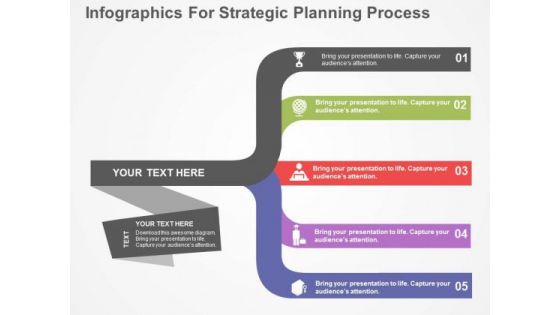
Infographics For Strategic Planning Process PowerPoint Template
Our professionally designed business diagram is as an effective tool for communicating ideas and planning. It contains banner infographic. Convey your strategic planning process with this diagram slide. It will amplify the strength of your logic.
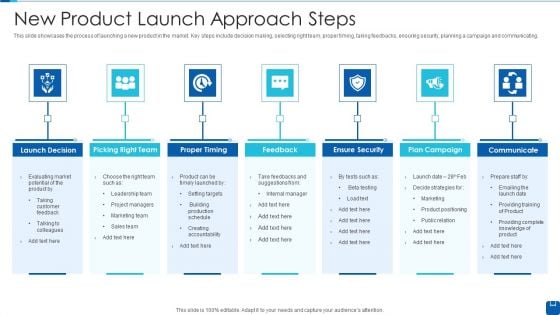
New Product Launch Approach Steps Infographics PDF
This slide showcases the process of launching a new product in the market. Key steps include decision making, selecting right team, proper timing, taking feedbacks, ensuring security, planning a campaign and communicating.Persuade your audience using this New Product Launch Approach Steps Infographics PDF This PPT design covers seven stages, thus making it a great tool to use. It also caters to a variety of topics including Launch Decision, Picking Right Team, Ensure Security Download this PPT design now to present a convincing pitch that not only emphasizes the topic but also showcases your presentation skills.
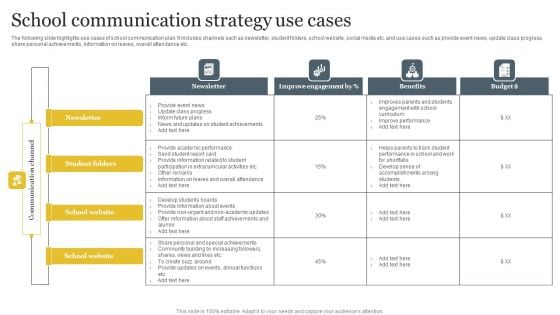
School Communication Strategy Use Cases Infographics PDF
The following slide highlights use cases of school communication plan. It includes channels such as newsletter, student folders, school website, social media etc. and use cases such as provide event news, update class progress, share personal achievements, information on leaves, overall attendance etc. Pitch your topic with ease and precision using this School Communication Strategy Use Cases Infographics PDF. This layout presents information on Newsletter, Student Folders, School Website. It is also available for immediate download and adjustment. So, changes can be made in the color, design, graphics or any other component to create a unique layout.
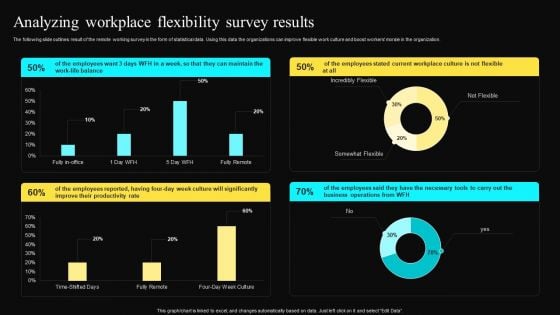
Analyzing Workplace Flexibility Survey Results Infographics PDF
The following slide outlines result of the remote working survey in the form of statistical data. Using this data the organizations can improve flexible work culture and boost workers morale in the organization. Slidegeeks is here to make your presentations a breeze with Analyzing Workplace Flexibility Survey Results Infographics PDF With our easy to use and customizable templates, you can focus on delivering your ideas rather than worrying about formatting. With a variety of designs to choose from, you are sure to find one that suits your needs. And with animations and unique photos, illustrations, and fonts, you can make your presentation pop. So whether you are giving a sales pitch or presenting to the board, make sure to check out Slidegeeks first.
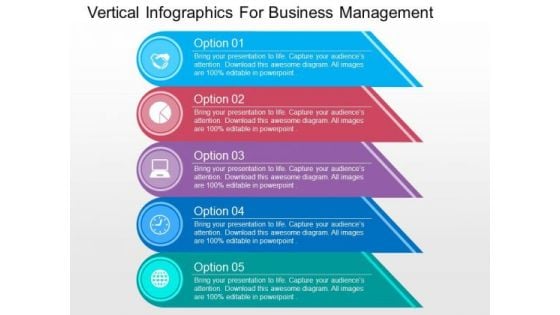
Vertical Infographics For Business Management PowerPoint Templates
Our above PPT slide displays vertical infographic. This diagram slide may use to represent concepts related to business management. Download this template to leave permanent impression on your audience.
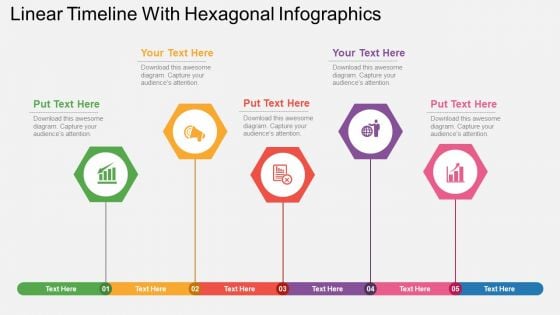
Linear Timeline With Hexagonal Infographics Powerpoint Template
Adjust the above diagram into your presentations to visually support your content. This PPT slide has been professionally designed with linear timeline with hexagonal infographic. This template offers an excellent background to display timeline and planning.
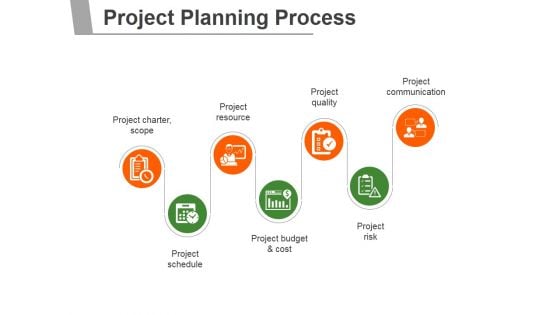
Project Planning Process Ppt PowerPoint Presentation Infographics
This is a project planning process ppt powerpoint presentation infographics. This is a seven stage process. The stages in this process are project charter scope, project resource, project quality, project communication, project schedule, project budget and cost, project risk.
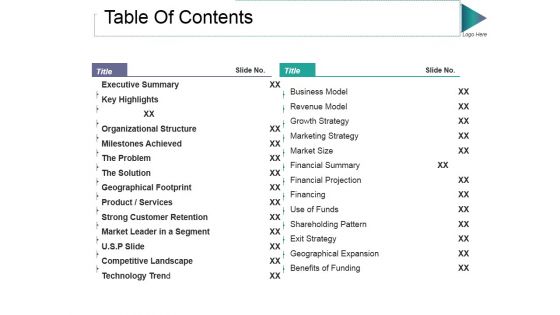
Table Of Contents Ppt PowerPoint Presentation Infographics Layouts
This is a table of contents ppt powerpoint presentation infographics layouts. This is a two stage process. The stages in this process are business model, revenue model, the problem, the solution, exit strategy.
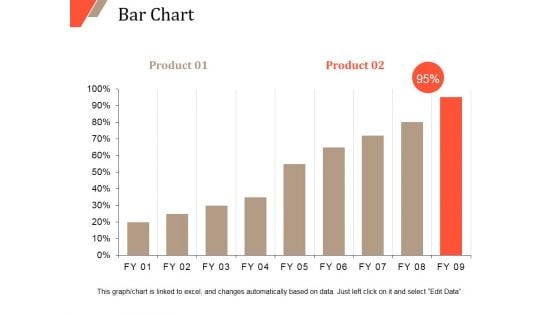
Bar Chart Ppt PowerPoint Presentation Outline Infographics
This is a bar chart ppt powerpoint presentation outline infographics. This is a two stage process. The stages in this process are bar chart, finance, marketing, strategy, analysis, business.
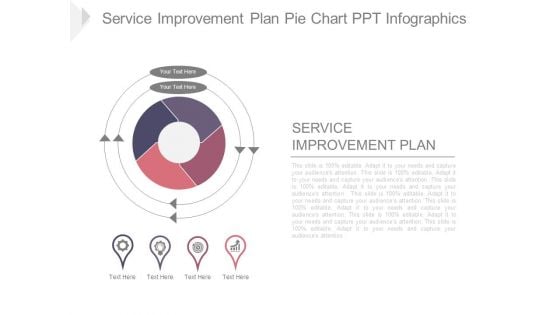
Service Improvement Plan Pie Chart Ppt Infographics
This is a service improvement plan pie chart ppt infographics. This is a four stage process. The stages in this process are service improvement plan, business, strategy, marketing, management.
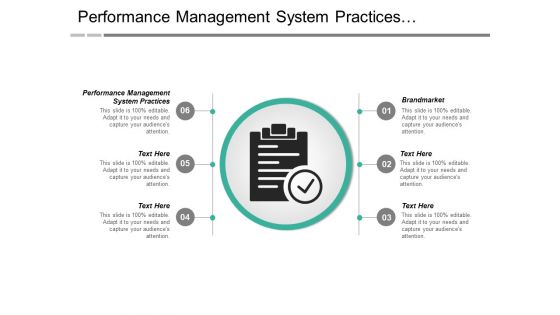
Performance Management System Practices Brandmarket Ppt PowerPoint Presentation Infographics Guidelines
This is a performance management system practices brandmarket ppt powerpoint presentation infographics guidelines. This is a six stage process. The stages in this process are performance management system practices, brandmarket.
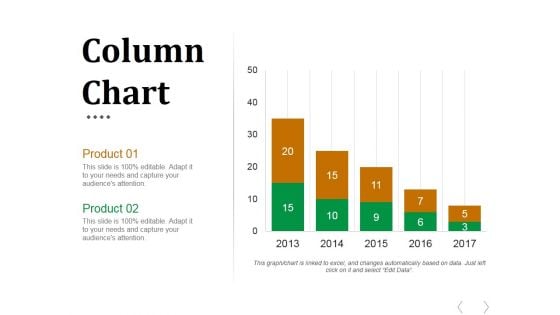
Column Chart Ppt PowerPoint Presentation Slides Infographics
This is a column chart ppt powerpoint presentation slides infographics. This is a five stage process. The stages in this process are business, marketing, management, column chart, timeline.
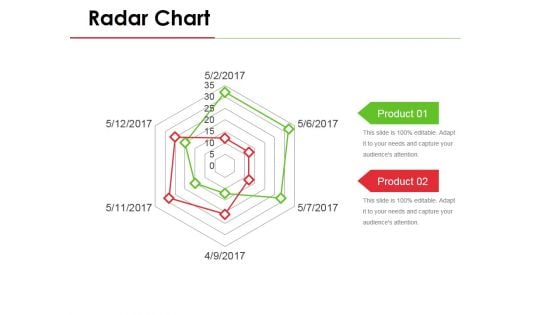
Radar Chart Ppt PowerPoint Presentation Styles Infographics
This is a radar chart ppt powerpoint presentation styles infographics. This is a six stage process. The stages in this process are business, marketing, product, radar chart, strategy.
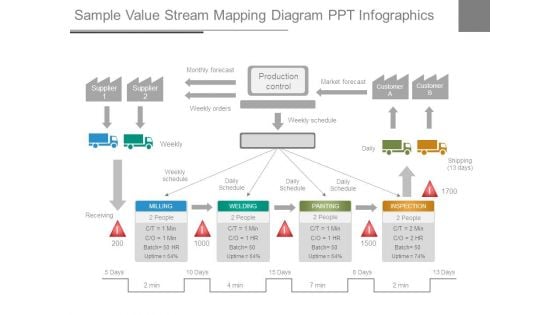
Sample Value Stream Mapping Diagram Ppt Infographics
This is a sample value stream mapping diagram ppt infographics. This is a four stage process. The stages in this process are supplier, monthly forecast, production control, market forecast, customer, weekly orders, weekly schedule, weekly, daily schedule, daily, shipping, receiving, milling, welding, painting, inspection, people, batch, uptime.
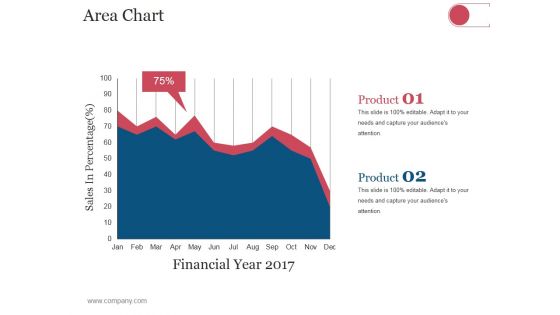
Area Chart Ppt PowerPoint Presentation Professional Infographics
This is a area chart ppt powerpoint presentation professional infographics. This is a two stage process. The stages in this process are business, strategy, analysis, planning, area chart.
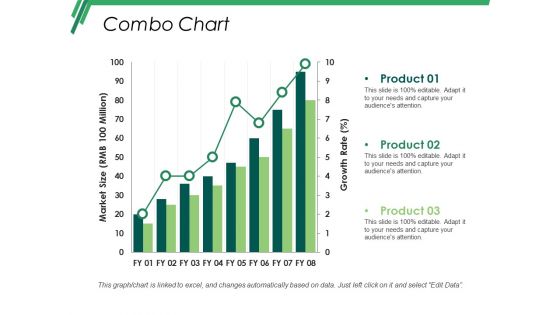
Combo Chart Ppt PowerPoint Presentation Layouts Infographics
This is a combo chart ppt powerpoint presentation layouts infographics. This is a three stage process. The stages in this process are business, marketing, strategy, planning, finance.
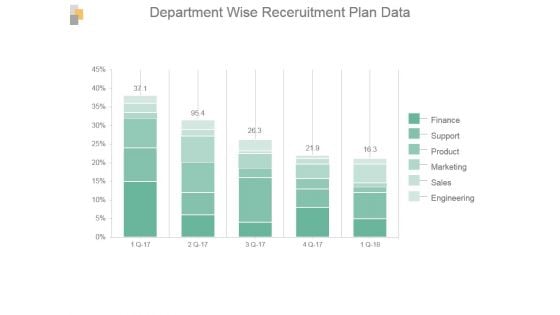
Department Wise Recruitment Plan Data Ppt Infographics
This is a department wise recruitment plan data ppt infographics. This is a five stage process. The stages in this process are finance, support, product, marketing, sales, engineering.
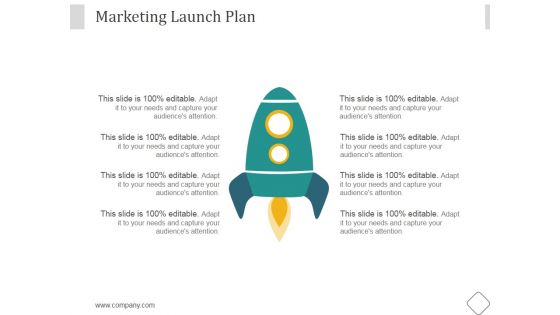
Marketing Launch Plan Ppt PowerPoint Presentation Infographics
This is a marketing launch plan ppt powerpoint presentation infographics. This is a one stage process. The stages in this process are business, marketing, management, launching, planning.
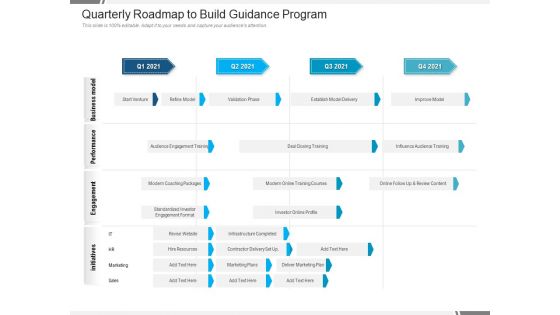
Quarterly Roadmap To Build Guidance Program Infographics
Presenting our jaw-dropping quarterly roadmap to build guidance program infographics. You can alternate the color, font size, font type, and shapes of this PPT layout according to your strategic process. This PPT presentation is compatible with Google Slides and is available in both standard screen and widescreen aspect ratios. You can also download this well-researched PowerPoint template design in different formats like PDF, JPG, and PNG. So utilize this visually-appealing design by clicking the download button given below.
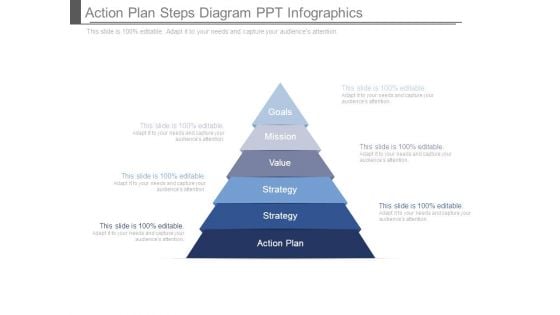
Action Plan Steps Diagram Ppt Infographics
This is a action plan steps diagram ppt infographics. This is a five stage process. The stages in this process are goals, mission, value, strategy, strategy, action plan.
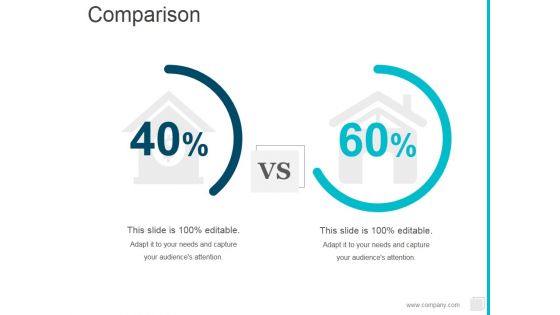
Comparison Ppt PowerPoint Presentation Outline Infographics
This is a comparison ppt powerpoint presentation outline infographics. This is a two stage process. The stages in this process are business, marketing, compare, percentage.
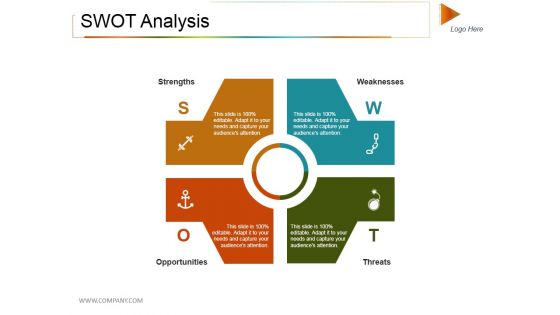
Swot Analysis Ppt PowerPoint Presentation Outline Infographics
This is a swot analysis ppt powerpoint presentation outline infographics. This is a four stage process. The stages in this process are strengths, weaknesses, opportunities, threats.
Post It Ppt PowerPoint Presentation Outline Infographics
This is a post it ppt powerpoint presentation outline infographics. This is a three stage process. The stages in this process are post it, marketing, education, business.
Lego Ppt PowerPoint Presentation Outline Infographics
This is a lego ppt powerpoint presentation outline infographics. This is a four stage process. The stages in this process are lego, sports, management, business, success.

Our Mission Ppt PowerPoint Presentation Outline Infographics
This is a our mission ppt powerpoint presentation outline infographics. This is a three stage process. The stages in this process are satisfaction, values, communication.
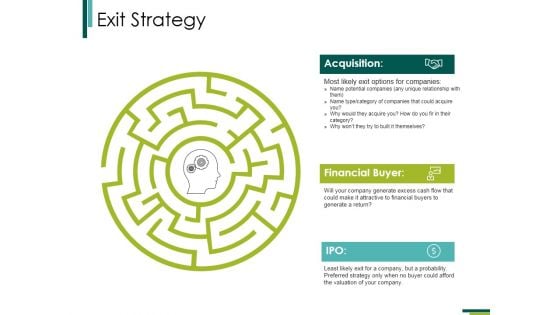
Exit Strategy Ppt PowerPoint Presentation Outline Infographics
This is a exit strategy ppt powerpoint presentation outline infographics. This is a one stage process. The stages in this process are acquisition, financial buyer, ipo.
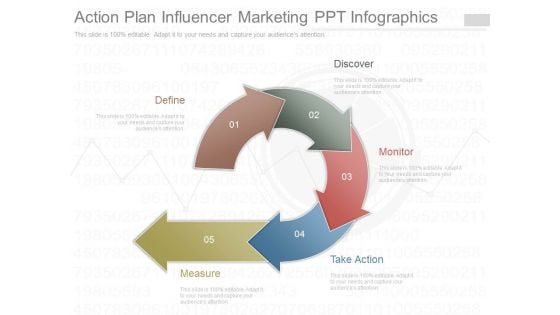
Action Plan Influencer Marketing Ppt Infographics
This is a action plan influencer marketing ppt infographics. This is a five stage process. The stages in this process are define, discover, monitor, take action, measure.
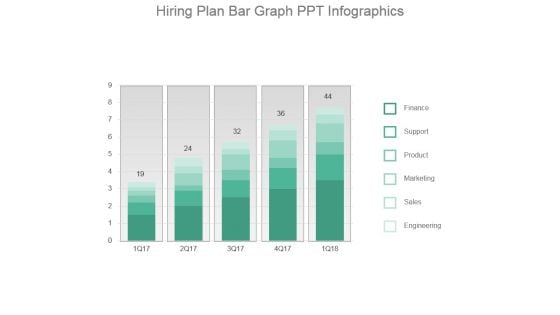
Hiring Plan Bar Graph Ppt Infographics
This is a hiring plan bar graph ppt infographics. This is a five stage process. The stages in this process are finance, support, product, marketing, sales, engineering.
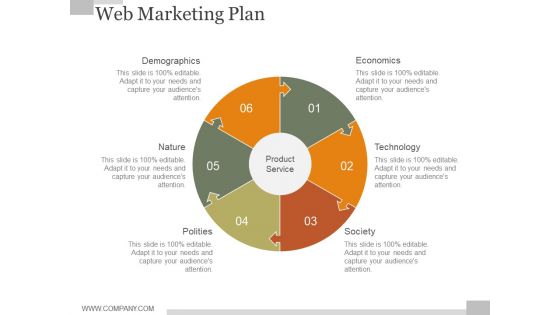
Web Marketing Plan Ppt PowerPoint Presentation Infographics
This is a web marketing plan ppt powerpoint presentation infographics. This is a six stage process. The stages in this process are demographics, nature, polities, economics, technology, society.
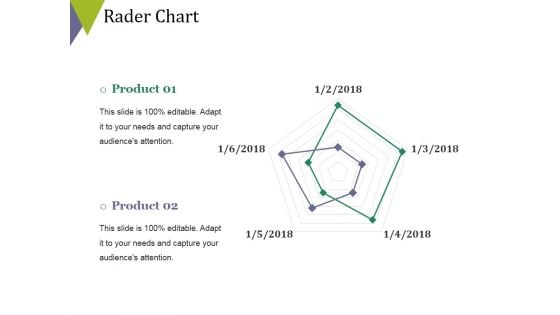
Rader Chart Ppt PowerPoint Presentation Portfolio Infographics
This is a rader chart ppt powerpoint presentation portfolio infographics. This is a two stage process. The stages in this process are rader chart, finance, analysis, business, marketing.
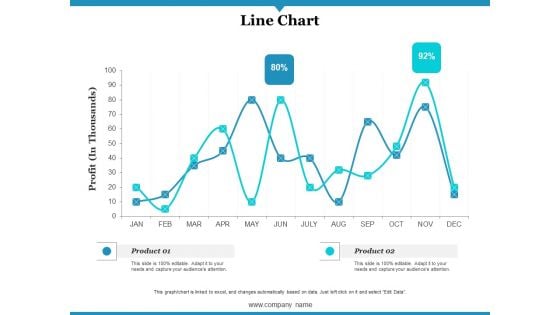
Line Chart Ppt PowerPoint Presentation Gallery Infographics
This is a line chart ppt powerpoint presentation gallery infographics. This is a two stage process. The stages in this process are profit, product, line chart.
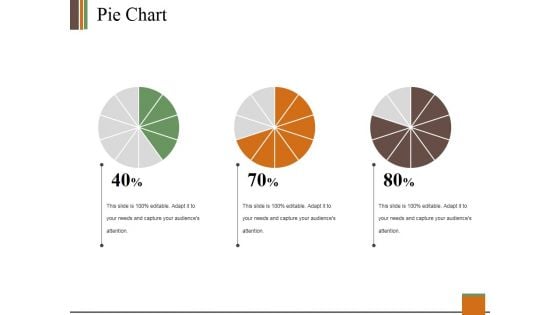
Pie Chart Ppt PowerPoint Presentation Summary Infographics
This is a pie chart ppt powerpoint presentation summary infographics. This is a three stage process. The stages in this process are pie, process, percentage, finance, business.
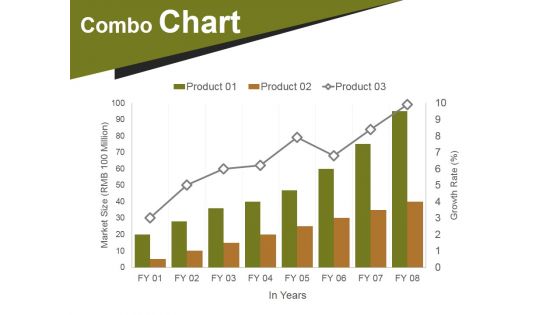
Combo Chart Ppt PowerPoint Presentation Portfolio Infographics
This is a combo chart ppt powerpoint presentation portfolio infographics. This is a eight stage process. The stages in this process are market size, growth, years, finance, business.
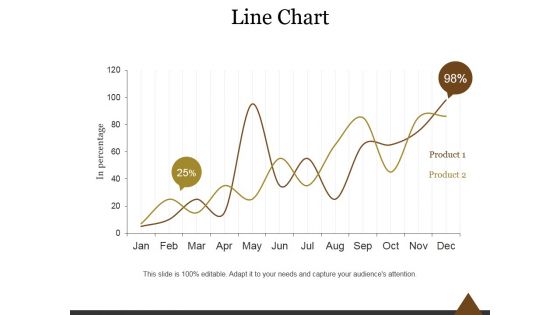
Line Chart Ppt PowerPoint Presentation Infographics
This is a line chart ppt powerpoint presentation infographics. This is a two stage process. The stages in this process are line chart, product, business, marketing, management.

Combo Chart Ppt PowerPoint Presentation Professional Infographics
This is a combo chart ppt powerpoint presentation professional infographics. This is a three stage process. The stages in this process are combo chart, market size, product.
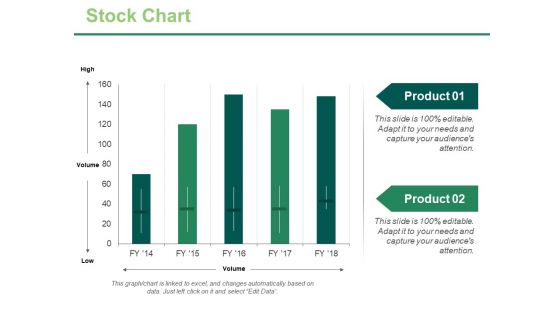
Stock Chart Ppt PowerPoint Presentation Ideas Infographics
This is a stock chart ppt powerpoint presentation ideas infographics. This is a two stage process. The stages in this process are high, volume, low, product, stock chart.
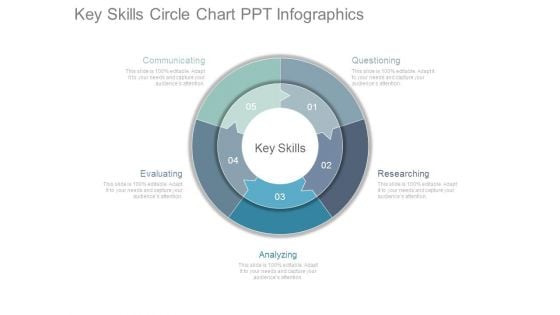
Key Skills Circle Chart Ppt Infographics
This is a key skills circle chart ppt infographics. This is a five stage process. The stages in this process are questioning, researching, analyzing, evaluating, communicating, key skills.
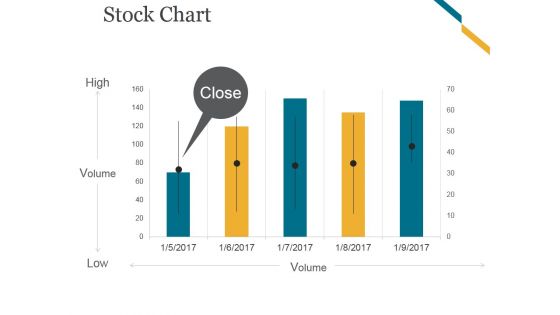
Stock Chart Ppt PowerPoint Presentation Infographics
This is a stock chart ppt powerpoint presentation infographics. This is a five stage process. The stages in this process are high, volume, low.
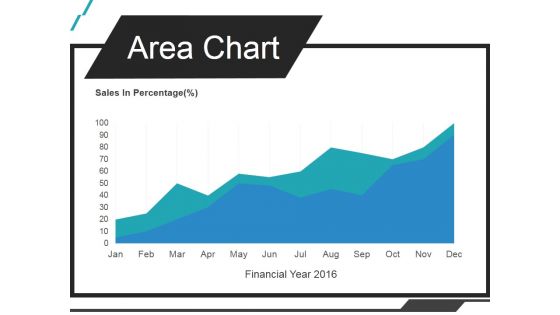
Area Chart Ppt PowerPoint Presentation Infographics
This is a area chart ppt powerpoint presentation infographics. This is a one stage process. The stages in this process are sales in percentage, jan, feb, mar, apr.
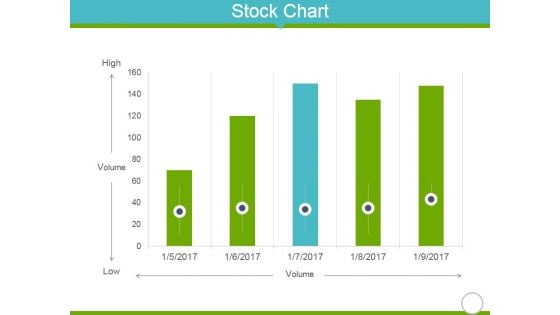
Stock Chart Ppt PowerPoint Presentation Portfolio Infographics
This is a stock chart ppt powerpoint presentation portfolio infographics. This is a five stage process. The stages in this process are high, volume, low, finance, business.
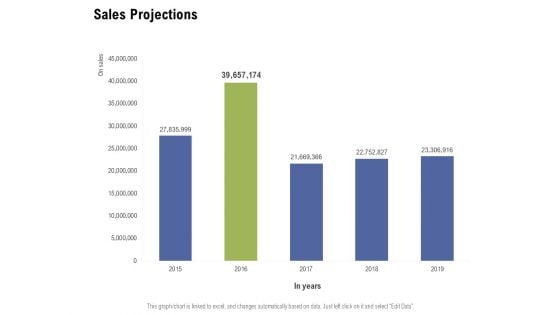
Sales Projections Ppt PowerPoint Presentation Outline Infographics
Presenting this set of slides with name sales projections ppt powerpoint presentation outline infographics. The topics discussed in these slide is sales projections. This is a completely editable PowerPoint presentation and is available for immediate download. Download now and impress your audience.
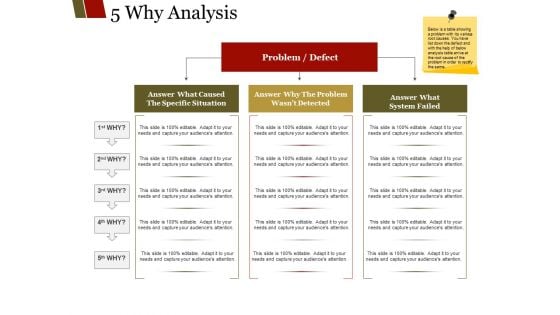
Why Analysis Ppt PowerPoint Presentation Outline Infographics
This is a why analysis ppt powerpoint presentation outline infographics. This is a three stage process. The stages in this process are answer what caused the specific situation, answer why the problem wasn t detected, answer what, system failed, problem defect.
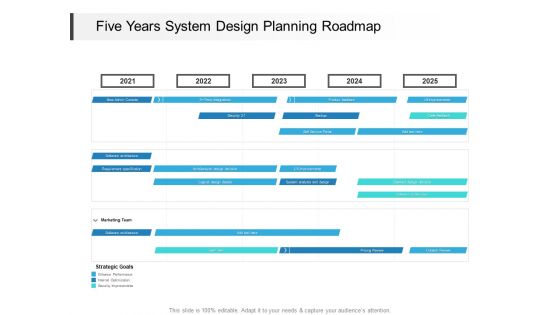
Five Years System Design Planning Roadmap Infographics
Presenting our jaw dropping five years system design planning roadmap infographics. You can alternate the color, font size, font type, and shapes of this PPT layout according to your strategic process. This PPT presentation is compatible with Google Slides and is available in both standard screen and widescreen aspect ratios. You can also download this well researched PowerPoint template design in different formats like PDF, JPG, and PNG. So utilize this visually appealing design by clicking the download button given below.
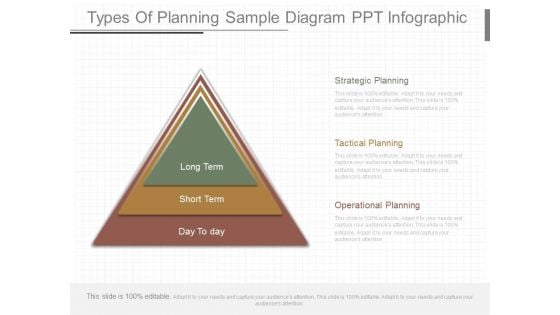
Types Of Planning Sample Diagram Ppt Infographics
This is a types of planning sample diagram ppt infographics. This is a three stage process. The stages in this process are long term, short term, day to day, strategic planning, tactical planning, operational planning.
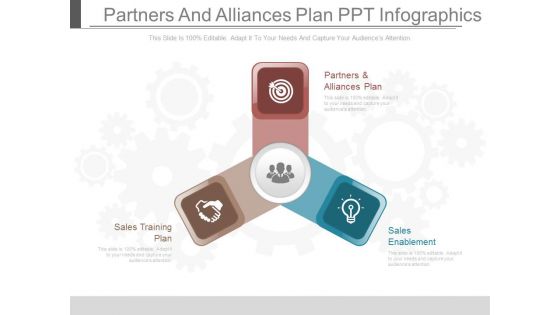
Partners And Alliances Plan Ppt Infographics
This is a partners and alliances plan ppt infographics. This is a three stage process. The stages in this process are partners and alliances plan, sales training plan, sales enablement.
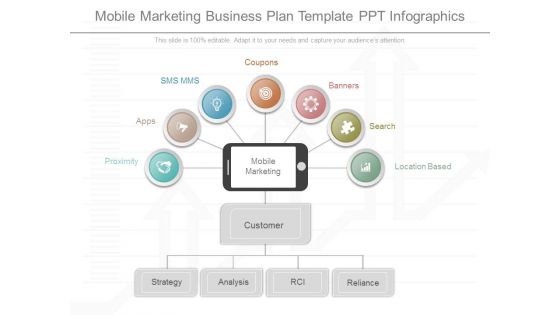
Mobile Marketing Business Plan Template Ppt Infographics
This is a mobile marketing business plan template ppt infographics. This is a one stage process. The stages in this process are coupons, banners, search, location based, proximity, apps, sms mms, mobile marketing, customer, strategy, analysis, rci, reliance.
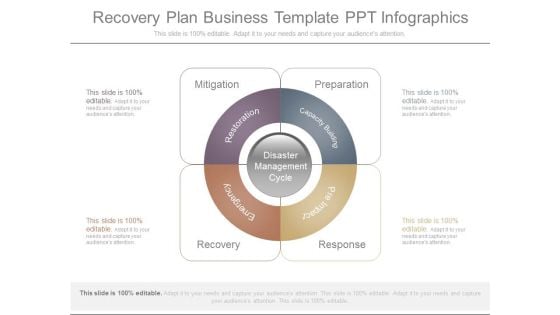
Recovery Plan Business Template Ppt Infographics
This is a recovery plan business template ppt infographics. This is a four stage process. The stages in this process are mitigation, recovery, response, preparation, restoration, emergency, pre impact, capacity building, disaster management cycle.
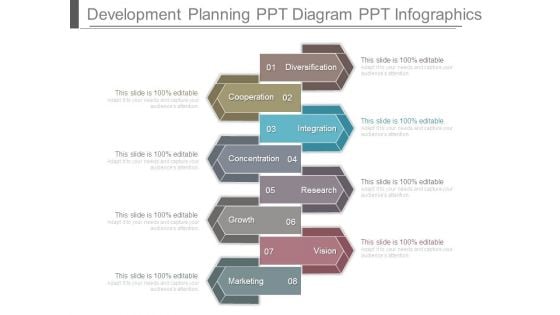
Development Planning Ppt Diagram Ppt Infographics
This is a development planning ppt diagram ppt infographics. This is a eight stage process. The stages in this process are diversification, cooperation, integration, concentration, research, growth, vision, marketing.
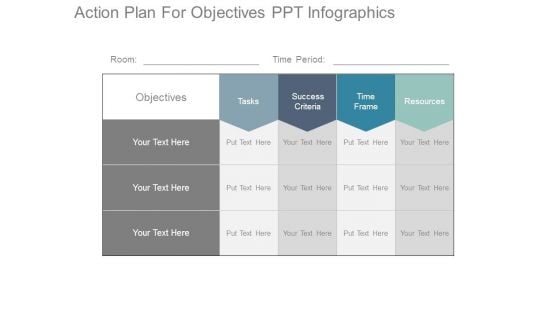
Action Plan For Objectives Ppt Infographics
This is a action plan for objectives ppt infographics. This is a four stage process. The stages in this process are objectives, tasks, success criteria, time frame, resources, room, time period.


 Continue with Email

 Home
Home


