Agenda Infographic
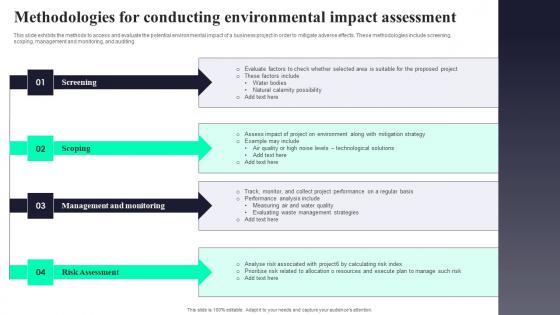
Methodologies For Conducting Environmental Impact Assessment Infographics Pdf
This slide exhibits the methods to access and evaluate the potential environmental impact of a business project in order to mitigate adverse effects. These methodologies include screening, scoping, management and monitoring, and auditing. Showcasing this set of slides titled Methodologies For Conducting Environmental Impact Assessment Infographics Pdf. The topics addressed in these templates are Screening, Scoping, Management And Monitoring. All the content presented in this PPT design is completely editable. Download it and make adjustments in color, background, font etc. as per your unique business setting. This slide exhibits the methods to access and evaluate the potential environmental impact of a business project in order to mitigate adverse effects. These methodologies include screening, scoping, management and monitoring, and auditing.
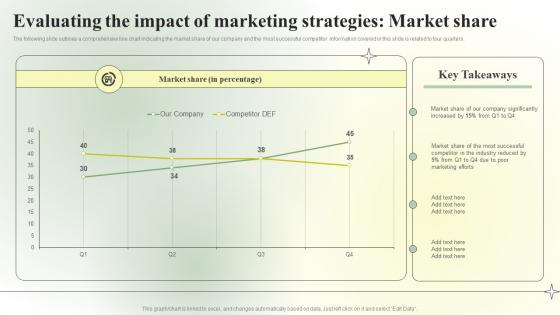
Competitive Branding Strategic Evaluating The Impact Of Marketing Infographics PDF
The following slide outlines a comprehensive line chart indicating the market share of our company and the most successful competitor. Information covered in this slide is related to four quarters. From laying roadmaps to briefing everything in detail, our templates are perfect for you. You can set the stage with your presentation slides. All you have to do is download these easy-to-edit and customizable templates. Competitive Branding Strategic Evaluating The Impact Of Marketing Infographics PDF will help you deliver an outstanding performance that everyone would remember and praise you for. Do download this presentation today. The following slide outlines a comprehensive line chart indicating the market share of our company and the most successful competitor. Information covered in this slide is related to four quarters.
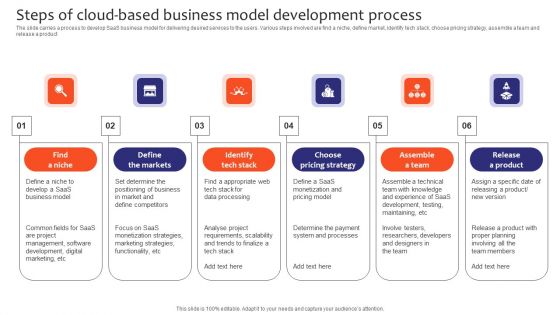
Steps Of Cloud Based Business Model Development Process Infographics PDF
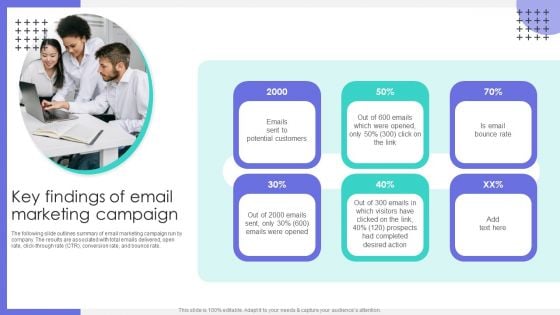
Key Findings Of Email Marketing Campaign Ppt Infographics Designs PDF
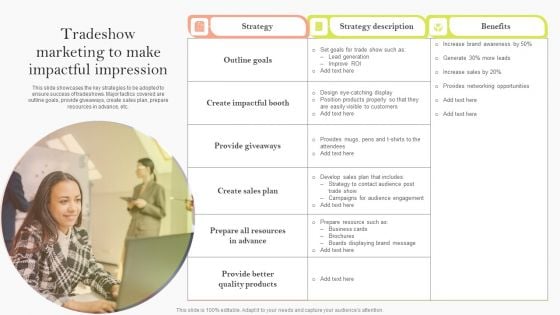
Tradeshow Marketing To Make Impactful Impression Ppt Infographics Introduction PDF
This slide showcases the key strategies to be adopted to ensure success of tradeshows. Major tactics covered are outline goals, provide giveaways, create sales plan, prepare resources in advance, etc. Present like a pro with Tradeshow Marketing To Make Impactful Impression Ppt Infographics Introduction PDF Create beautiful presentations together with your team, using our easy to use presentation slides. Share your ideas in real time and make changes on the fly by downloading our templates. So whether you are in the office, on the go, or in a remote location, you can stay in sync with your team and present your ideas with confidence. With Slidegeeks presentation got a whole lot easier. Grab these presentations today.
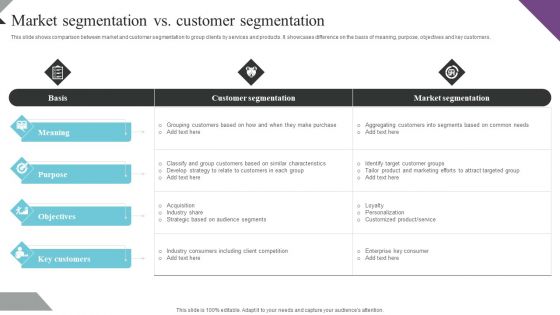
Customer Segmentation And Behavioral Analysis Market Segmentation Customer Infographics PDF
This slide shows comparison between market and customer segmentation to group clients by services and products. It showcases difference on the basis of meaning, purpose, objectives and key customers. Coming up with a presentation necessitates that the majority of the effort goes into the content and the message you intend to convey. The visuals of a PowerPoint presentation can only be effective if it supplements and supports the story that is being told. Keeping this in mind our experts created Customer Segmentation And Behavioral Analysis Market Segmentation Customer Infographics PDF to reduce the time that goes into designing the presentation. This way, you can concentrate on the message while our designers take care of providing you with the right template for the situation.
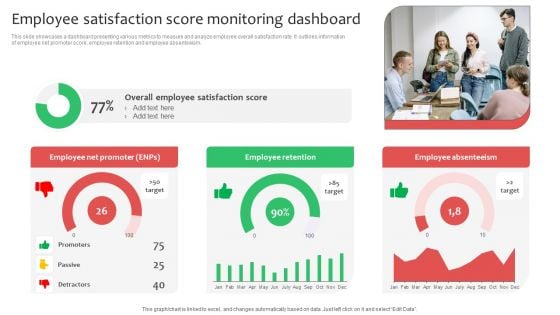
Employee Satisfaction Score Monitoring Dashboard Ppt Infographics Deck PDF
This slide showcases a dashboard presenting various metrics to measure and analyze employee overall satisfaction rate. It outlines information of employee net promoter score, employee retention and employee absenteeism. This Employee Satisfaction Score Monitoring Dashboard Ppt Infographics Deck PDF from Slidegeeks makes it easy to present information on your topic with precision. It provides customization options, so you can make changes to the colors, design, graphics, or any other component to create a unique layout. It is also available for immediate download, so you can begin using it right away. Slidegeeks has done good research to ensure that you have everything you need to make your presentation stand out. Make a name out there for a brilliant performance.
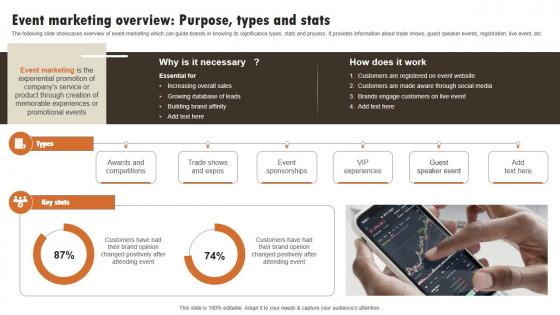
Event Marketing Overview Purpose Types Experiential Marketing Technique Infographics PDF
The following slide showcases overview of event marketing which can guide brands in knowing its significance types, stats and process. It provides information about trade shows, guest speaker events, registration, live event, etc. Make sure to capture your audiences attention in your business displays with our gratis customizable Event Marketing Overview Purpose Types Experiential Marketing Technique Infographics PDF. These are great for business strategies, office conferences, capital raising or task suggestions. If you desire to acquire more customers for your tech business and ensure they stay satisfied, create your own sales presentation with these plain slides. The following slide showcases overview of event marketing which can guide brands in knowing its significance types, stats and process. It provides information about trade shows, guest speaker events, registration, live event, etc.
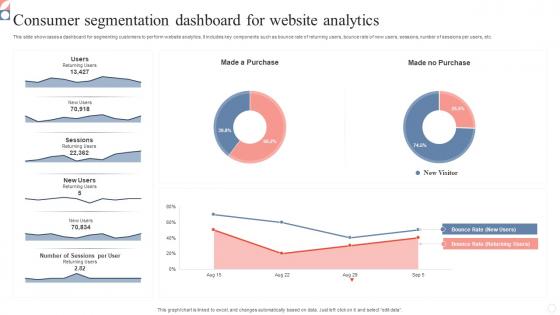
Consumer Segmentation Dashboard For Website Analytics Infographics Pdf
This slide showcases a dashboard for segmenting customers to perform website analytics. It includes key components such as bounce rate of returning users, bounce rate of new users, sessions, number of sessions per users, etc. Pitch your topic with ease and precision using this Consumer Segmentation Dashboard For Website Analytics Infographics Pdf. This layout presents information on Consumer Segmentation Dashboard, Website Analytics, Segmenting Customers. It is also available for immediate download and adjustment. So, changes can be made in the color, design, graphics or any other component to create a unique layout. This slide showcases a dashboard for segmenting customers to perform website analytics. It includes key components such as bounce rate of returning users, bounce rate of new users, sessions, number of sessions per users, etc.
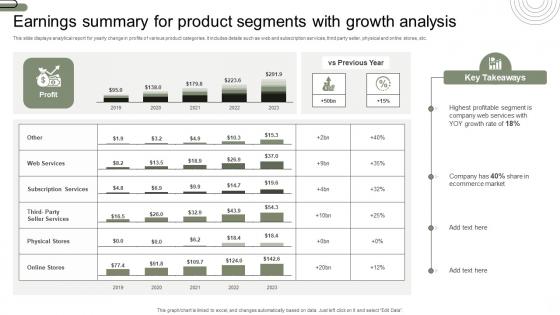
Earnings Summary For Product Segments With Growth Analysis Infographics Pdf
This slide displays analytical report for yearly change in profits of various product categories. It includes details such as web and subscription services, third party seller, physical and online stores, etc. Pitch your topic with ease and precision using this Earnings Summary For Product Segments With Growth Analysis Infographics Pdf. This layout presents information on Earnings Summary, Product Segments, Growth Analysis. It is also available for immediate download and adjustment. So, changes can be made in the color, design, graphics or any other component to create a unique layout. This slide displays analytical report for yearly change in profits of various product categories. It includes details such as web and subscription services, third party seller, physical and online stores, etc.
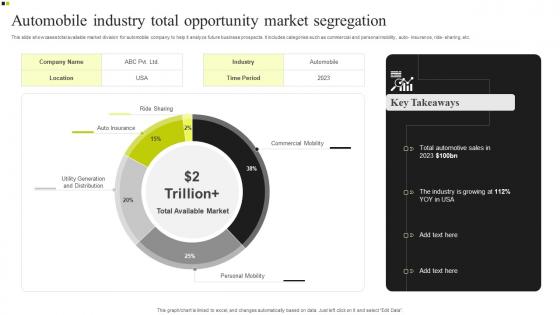
Automobile Industry Total Opportunity Market Segregation Infographics Pdf
This slide showcases total available market division for automobile company to help it analyze future business prospects. It includes categories such as commercial and personal mobility, auto- insurance, ride- sharing, etc. Showcasing this set of slides titled Automobile Industry Total Opportunity Market Segregation Infographics Pdf. The topics addressed in these templates are Automobile Industry, Total Opportunity, Market Segregation. All the content presented in this PPT design is completely editable. Download it and make adjustments in color, background, font etc. as per your unique business setting. This slide showcases total available market division for automobile company to help it analyze future business prospects. It includes categories such as commercial and personal mobility, auto- insurance, ride- sharing, etc.
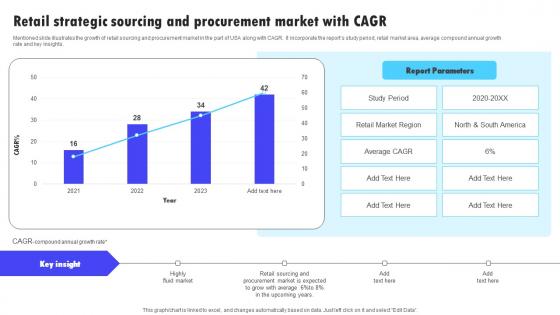
Retail Strategic Sourcing And Procurement Market With Cagr Infographics Pdf
Mentioned slide illustrates the growth of retail sourcing and procurement market in the part of USA along with CAGR. It incorporate the reports study period, retail market area, average compound annual growth rate and key insights. Showcasing this set of slides titled Retail Strategic Sourcing And Procurement Market With Cagr Infographics Pdf. The topics addressed in these templates are Reports Study Period, Retail Market Area, Average Compound0. All the content presented in this PPT design is completely editable. Download it and make adjustments in color, background, font etc. as per your unique business setting. Mentioned slide illustrates the growth of retail sourcing and procurement market in the part of USA along with CAGR. It incorporate the reports study period, retail market area, average compound annual growth rate and key insights.
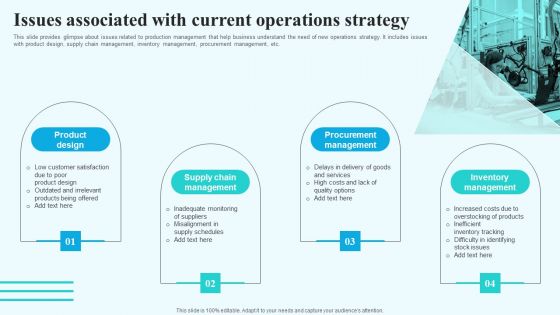
Issues Associated With Current Operations Strategy Infographics PDF
This slide provides glimpse about issues related to production management that help business understand the need of new operations strategy. It includes issues with product design, supply chain management, inventory management, procurement management, etc. Welcome to our selection of the Issues Associated With Current Operations Strategy Infographics PDF. These are designed to help you showcase your creativity and bring your sphere to life. Planning and Innovation are essential for any business that is just starting out. This collection contains the designs that you need for your everyday presentations. All of our PowerPoints are 100 percent editable, so you can customize them to suit your needs. This multi purpose template can be used in various situations. Grab these presentation templates today.
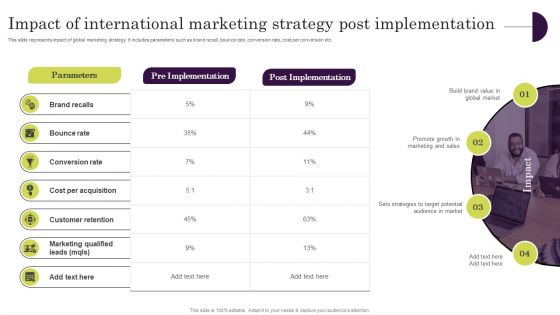
Impact Of International Marketing Strategy Post Implementation Infographics PDF
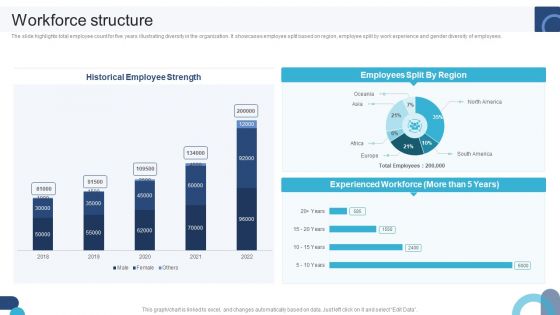
Digital Application Software Development Business Profile Workforce Structure Infographics PDF
The slide highlights total employee count for five years illustrating diversity in the organization. It showcases employee split based on region, employee split by work experience and gender diversity of employees. Do you know about Slidesgeeks Digital Application Software Development Business Profile Workforce Structure Infographics PDF These are perfect for delivering any kind od presentation. Using it, create PowerPoint presentations that communicate your ideas and engage audiences. Save time and effort by using our pre-designed presentation templates that are perfect for a wide range of topic. Our vast selection of designs covers a range of styles, from creative to business, and are all highly customizable and easy to edit. Download as a PowerPoint template or use them as Google Slides themes.
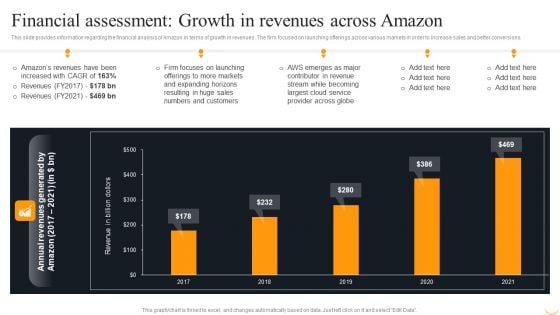
Financial Assessment Growth In Revenues Across Amazon Infographics PDF
This slide provides information regarding the financial analysis of Amazon in terms of growth in revenues. The firm focused on launching offerings across various markets in order to increase sales and better conversions. Slidegeeks is here to make your presentations a breeze with Financial Assessment Growth In Revenues Across Amazon Infographics PDF With our easy to use and customizable templates, you can focus on delivering your ideas rather than worrying about formatting. With a variety of designs to choose from, you are sure to find one that suits your needs. And with animations and unique photos, illustrations, and fonts, you can make your presentation pop. So whether you are giving a sales pitch or presenting to the board, make sure to check out Slidegeeks first.
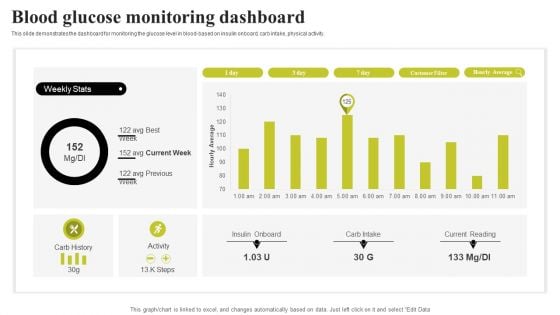
Biochip Technology Blood Glucose Monitoring Dashboard Infographics PDF
This slide demonstrates the dashboard for monitoring the glucose level in blood based on insulin onboard, carb intake, physical activity. Are you in need of a template that can accommodate all of your creative concepts This one is crafted professionally and can be altered to fit any style. Use it with Google Slides or PowerPoint. Include striking photographs, symbols, depictions, and other visuals. Fill, move around, or remove text boxes as desired. Test out color palettes and font mixtures. Edit and save your work, or work with colleagues. Download Biochip Technology Blood Glucose Monitoring Dashboard Infographics PDF and observe how to make your presentation outstanding. Give an impeccable presentation to your group and make your presentation unforgettable.
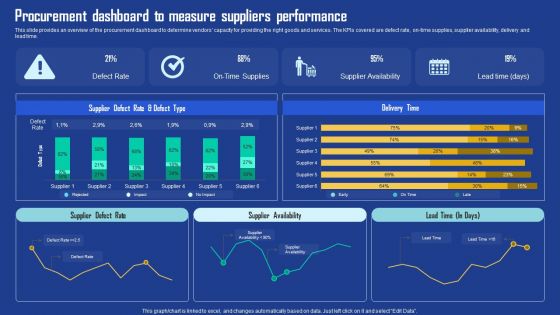
Procurement Dashboard To Measure Suppliers Performance Infographics PDF
This slide provides an overview of the procurement dashboard to determine vendors capacity for providing the right goods and services. The KPIs covered are defect rate, on-time supplies, supplier availability, delivery and lead time. This Procurement Dashboard To Measure Suppliers Performance Infographics PDF from Slidegeeks makes it easy to present information on your topic with precision. It provides customization options, so you can make changes to the colors, design, graphics, or any other component to create a unique layout. It is also available for immediate download, so you can begin using it right away. Slidegeeks has done good research to ensure that you have everything you need to make your presentation stand out. Make a name out there for a brilliant performance.
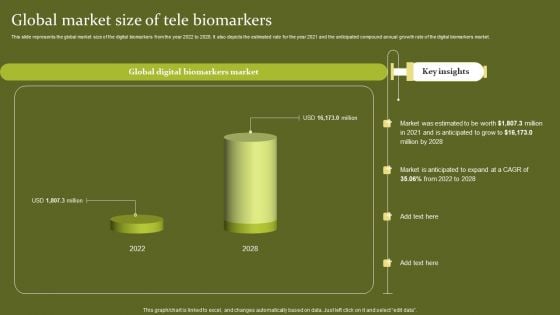
Telehealth Global Market Size Of Tele Biomarkers Infographics PDF
This slide represents the global market size of the digital biomarkers from the year 2022 to 2028. It also depicts the estimated rate for the year 2021 and the anticipated compound annual growth rate of the digital biomarkers market. Slidegeeks has constructed Telehealth Global Market Size Of Tele Biomarkers Infographics PDF after conducting extensive research and examination. These presentation templates are constantly being generated and modified based on user preferences and critiques from editors. Here, you will find the most attractive templates for a range of purposes while taking into account ratings and remarks from users regarding the content. This is an excellent jumping-off point to explore our content and will give new users an insight into our top-notch PowerPoint Templates.
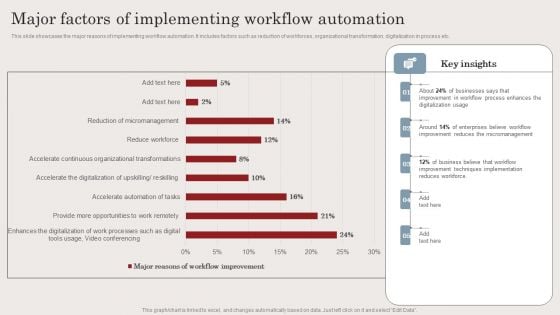
Major Factors Of Implementing Workflow Automation Ppt Infographics Layout PDF
This slide showcases the major reasons of implementing workflow automation. It includes factors such as reduction of workforces, organizational transformation, digitalization in process etc. This Major Factors Of Implementing Workflow Automation Ppt Infographics Layout PDF from Slidegeeks makes it easy to present information on your topic with precision. It provides customization options, so you can make changes to the colors, design, graphics, or any other component to create a unique layout. It is also available for immediate download, so you can begin using it right away. Slidegeeks has done good research to ensure that you have everything you need to make your presentation stand out. Make a name out there for a brilliant performance.
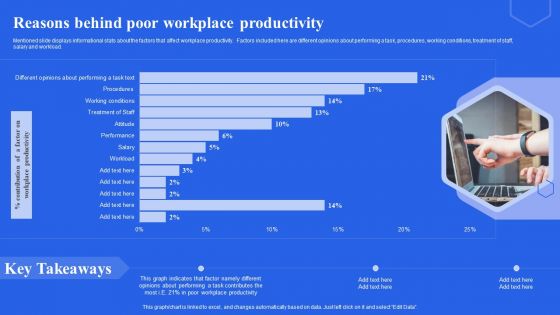
Reasons Behind Poor Workplace Productivity Ppt Infographics Rules PDF
Mentioned slide displays informational stats about the factors that affect workplace productivity. Factors included here are different opinions about performing a task, procedures, working conditions, treatment of staff, salary and workload. Coming up with a presentation necessitates that the majority of the effort goes into the content and the message you intend to convey. The visuals of a PowerPoint presentation can only be effective if it supplements and supports the story that is being told. Keeping this in mind our experts created Reasons Behind Poor Workplace Productivity Ppt Infographics Rules PDF to reduce the time that goes into designing the presentation. This way, you can concentrate on the message while our designers take care of providing you with the right template for the situation.
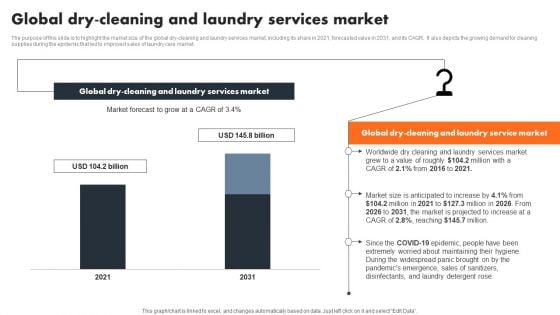
Global Dry Cleaning And Laundry Services Market Infographics PDF
The purpose of this slide is to highlight the market size of the global dry-cleaning and laundry services market, including its share in 2021, forecasted value in 2031, and its CAGR. It also depicts the growing demand for cleaning supplies during the epidemic that led to improved sales of laundry care market.The best PPT templates are a great way to save time, energy, and resources. Slidegeeks have 100 percent editable powerpoint slides making them incredibly versatile. With these quality presentation templates, you can create a captivating and memorable presentation by combining visually appealing slides and effectively communicating your message. Download Global Dry Cleaning And Laundry Services Market Infographics PDF from Slidegeeks and deliver a wonderful presentation.
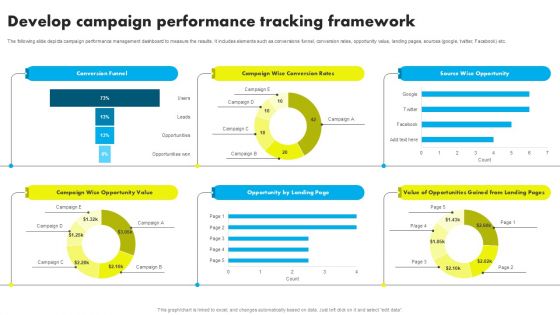
Develop Campaign Performance Tracking Framework Ppt Infographics Information PDF
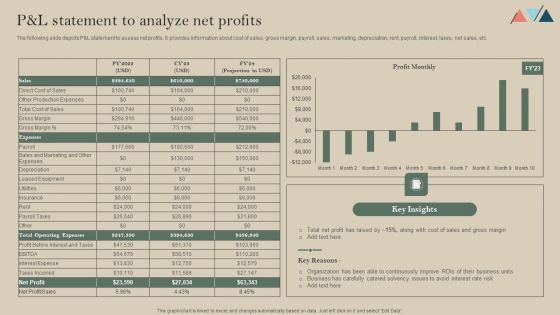
Pand L Statement To Analyze Net Profits Infographics PDF
The following slide depicts P and L statement to assess net profits. It provides information about cost of sales, gross margin, payroll, sales, marketing, depreciation, rent, payroll, interest, taxes, net sales, etc. Slidegeeks has constructed Pand L Statement To Analyze Net Profits Infographics PDF after conducting extensive research and examination. These presentation templates are constantly being generated and modified based on user preferences and critiques from editors. Here, you will find the most attractive templates for a range of purposes while taking into account ratings and remarks from users regarding the content. This is an excellent jumping-off point to explore our content and will give new users an insight into our top-notch PowerPoint Templates.
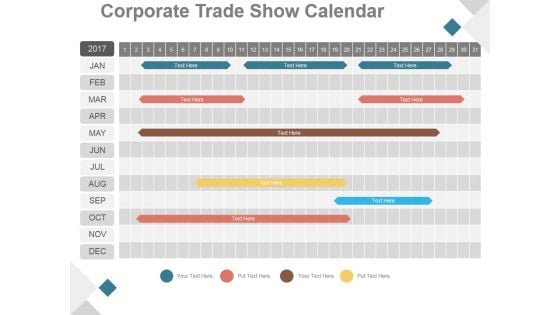
Corporate Trade Show Calendar Ppt PowerPoint Presentation Infographics
This is a corporate trade show calendar ppt powerpoint presentation infographics. This is a twelve stage process. The stages in this process are jan, feb, mar, apr, may, jun, jul, aug, sep, oct, nov, dec.
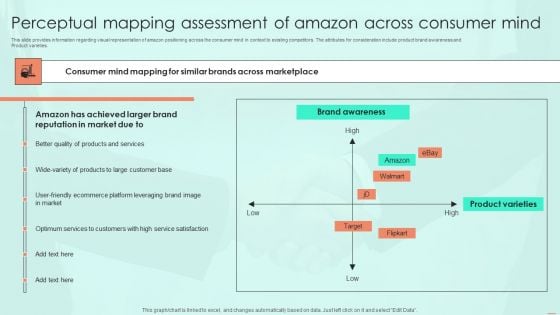
Perceptual Mapping Assessment Of Amazon Across Consumer Mind Infographics PDF
This slide provides information regarding visual representation of amazon positioning across the consumer mind in context to existing competitors. The attributes for consideration include product brand awareness and Product varieties. Slidegeeks is here to make your presentations a breeze with Perceptual Mapping Assessment Of Amazon Across Consumer Mind Infographics PDF With our easy to use and customizable templates, you can focus on delivering your ideas rather than worrying about formatting. With a variety of designs to choose from, you are sure to find one that suits your needs. And with animations and unique photos, illustrations, and fonts, you can make your presentation pop. So whether you are giving a sales pitch or presenting to the board, make sure to check out Slidegeeks first
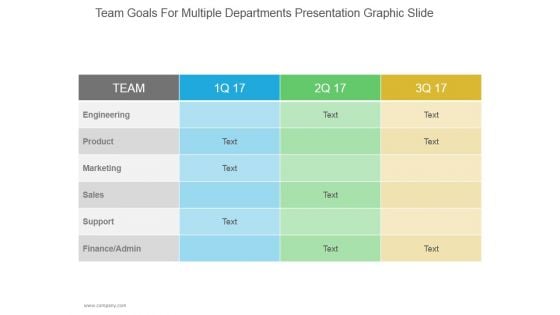
Team Goals For Multiple Departments Ppt PowerPoint Presentation Infographics
This is a team goals for multiple departments ppt powerpoint presentation infographic. This is a three stage process. The stages in this process are engineering, product, marketing, sales, support, finance admin.
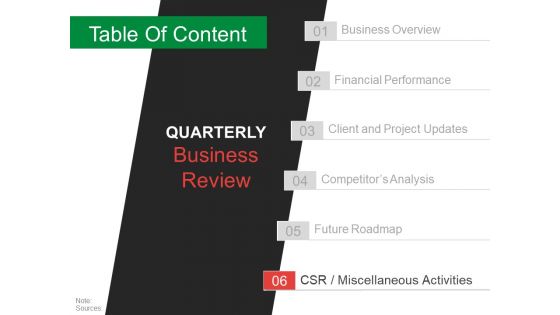
Table Of Content Template 7 Ppt PowerPoint Presentation Professional Infographics
This is a table of content template 7 ppt powerpoint presentation professional infographics. This is a six stage process. The stages in this process are business overview, financial performance, client and project updates, competitor s analysis, future roadmap.
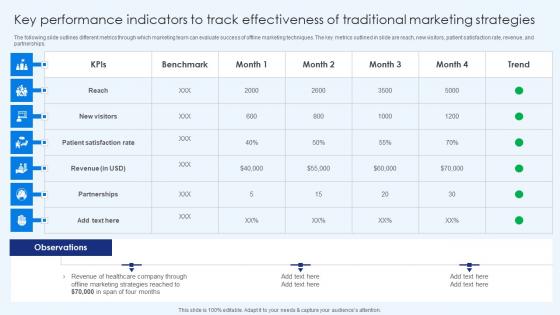
Key Performance Indicators To Track Effectivenes Healthcare Promotion Infographics Pdf
The following slide outlines different metrics through which marketing team can evaluate success of offline marketing techniques. The key metrics outlined in slide are reach, new visitors, patient satisfaction rate, revenue, and partnerships. The Key Performance Indicators To Track Effectivenes Healthcare Promotion Infographics Pdf is a compilation of the most recent design trends as a series of slides. It is suitable for any subject or industry presentation, containing attractive visuals and photo spots for businesses to clearly express their messages. This template contains a variety of slides for the user to input data, such as structures to contrast two elements, bullet points, and slides for written information. Slidegeeks is prepared to create an impression. The following slide outlines different metrics through which marketing team can evaluate success of offline marketing techniques. The key metrics outlined in slide are reach, new visitors, patient satisfaction rate, revenue, and partnerships.
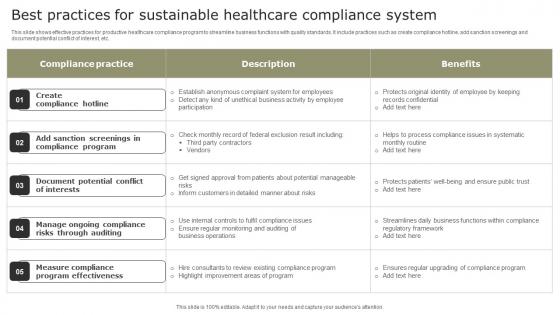
Best Practices For Sustainable Healthcare Compliance System Infographics Pdf
This slide shows effective practices for productive healthcare compliance program to streamline business functions with quality standards. It include practices such as create compliance hotline, add sanction screenings and document potential conflict of interest, etc. Pitch your topic with ease and precision using this Best Practices For Sustainable Healthcare Compliance System Infographics Pdf. This layout presents information on Create Compliance Hotline, Document Potential, Ongoing Compliance. It is also available for immediate download and adjustment. So, changes can be made in the color, design, graphics or any other component to create a unique layout. This slide shows effective practices for productive healthcare compliance program to streamline business functions with quality standards. It include practices such as create compliance hotline, add sanction screenings and document potential conflict of interest, etc.
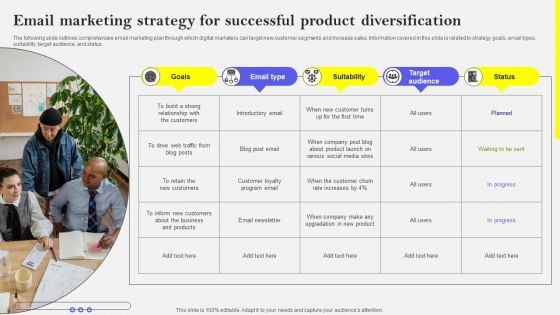
Email Marketing Strategy For Successful Product Diversification Infographics PDF
The following slide outlines comprehensive email marketing plan through which digital marketers can target new customer segments and increase sales. Information covered in this slide is related to strategy goals, email types, suitability, target audience, and status. Slidegeeks is here to make your presentations a breeze with Email Marketing Strategy For Successful Product Diversification Infographics PDF With our easy-to-use and customizable templates, you can focus on delivering your ideas rather than worrying about formatting. With a variety of designs to choose from, you are sure to find one that suits your needs. And with animations and unique photos, illustrations, and fonts, you can make your presentation pop. So whether you are giving a sales pitch or presenting to the board, make sure to check out Slidegeeks first
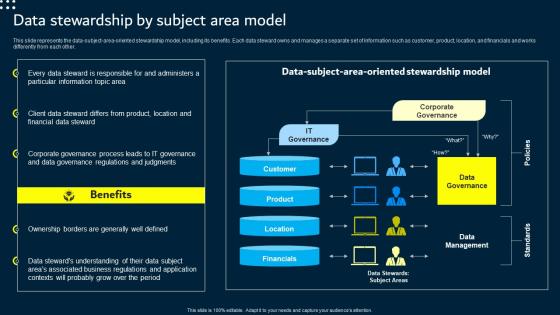
Data Stewardship By Subject Area Model Data Custodianship Infographics Pdf
This slide represents the data subject area oriented stewardship model, including its benefits. Each data steward owns and manages a separate set of information such as customer, product, location, and financials and works differently from each other. Do you know about Slidesgeeks Data Stewardship By Subject Area Model Data Custodianship Infographics Pdf These are perfect for delivering any kind od presentation. Using it, create PowerPoint presentations that communicate your ideas and engage audiences. Save time and effort by using our pre designed presentation templates that are perfect for a wide range of topic. Our vast selection of designs covers a range of styles, from creative to business, and are all highly customizable and easy to edit. Download as a PowerPoint template or use them as Google Slides themes. This slide represents the data subject area oriented stewardship model, including its benefits. Each data steward owns and manages a separate set of information such as customer, product, location, and financials and works differently from each other.
About Competitive Branding Strategy To Gain Competitive Edge Infographics Pdf
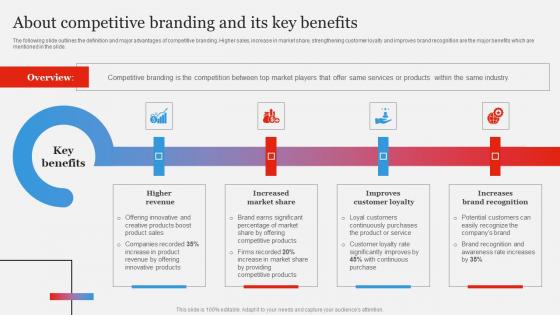
The following slide outlines the definition and major advantages of competitive branding. Higher sales, increase in market share, strengthening customer loyalty and improves brand recognition are the major benefits which are mentioned in the slide. Find a pre designed and impeccable About Competitive Branding Strategy To Gain Competitive Edge Infographics Pdf. The templates can ace your presentation without additional effort. You can download these easy to edit presentation templates to make your presentation stand out from others. So, what are you waiting for Download the template from Slidegeeks today and give a unique touch to your presentation. The following slide outlines the definition and major advantages of competitive branding. Higher sales, increase in market share, strengthening customer loyalty and improves brand recognition are the major benefits which are mentioned in the slide.
Software Testing Evaluation Role And Responsibilities Ppt Infographics Template Pdf
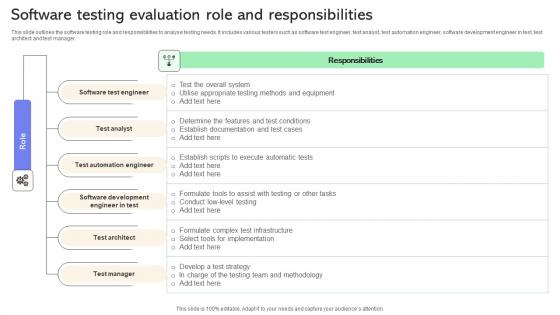
This slide outlines the software testing role and responsibilities to analyse testing needs. It includes various testers such as software test engineer, test analyst, test automation engineer, software development engineer in test, test architect and test manager. Pitch your topic with ease and precision using this Software Testing Evaluation Role And Responsibilities Ppt Infographics Template Pdf. This layout presents information on Test Analyst, Test Automation Engineer, Software Development Engineer. It is also available for immediate download and adjustment. So, changes can be made in the color, design, graphics or any other component to create a unique layout. This slide outlines the software testing role and responsibilities to analyse testing needs. It includes various testers such as software test engineer,test analyst,test automation engineer,software development engineer in test,test architect and test manager.
Creating Business Performance Describing Business Performance Administration Goals Infographics Pdf
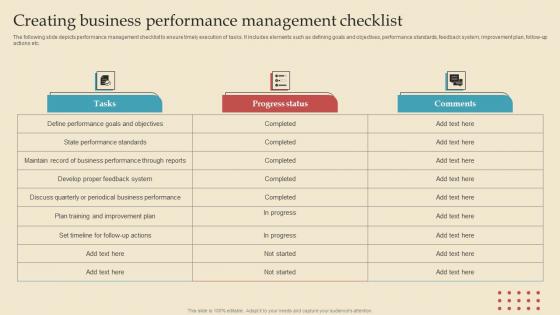
The following slide depicts performance management checklist to ensure timely execution of tasks. It includes elements such as defining goals and objectives, performance standards, feedback system, improvement plan, follow up actions etc. Retrieve professionally designed Creating Business Performance Describing Business Performance Administration Goals Infographics Pdf to effectively convey your message and captivate your listeners. Save time by selecting pre made slideshows that are appropriate for various topics, from business to educational purposes. These themes come in many different styles, from creative to corporate, and all of them are easily adjustable and can be edited quickly. Access them as PowerPoint templates or as Google Slides themes. You do not have to go on a hunt for the perfect presentation because Slidegeeks got you covered from everywhere. The following slide depicts performance management checklist to ensure timely execution of tasks. It includes elements such as defining goals and objectives, performance standards, feedback system, improvement plan, follow up actions etc.
Analyzing Multiple Strategies Operations Strategy Improve Business Productivity Infographics Pdf
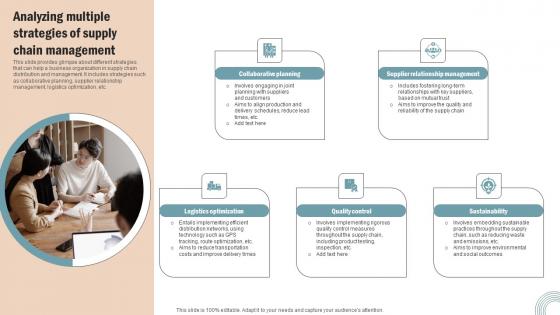
This slide provides glimpse about different strategies that can help a business organization in supply chain distribution and management. It includes strategies such as collaborative planning, supplier relationship management, logistics optimization, etc. Want to ace your presentation in front of a live audience Our Analyzing Multiple Strategies Operations Strategy Improve Business Productivity Infographics Pdf can help you do that by engaging all the users towards you. Slidegeeks experts have put their efforts and expertise into creating these impeccable powerpoint presentations so that you can communicate your ideas clearly. Moreover, all the templates are customizable, and easy to edit and downloadable. Use these for both personal and commercial use. This slide provides glimpse about different strategies that can help a business organization in supply chain distribution and management. It includes strategies such as collaborative planning, supplier relationship management, logistics optimization, etc.
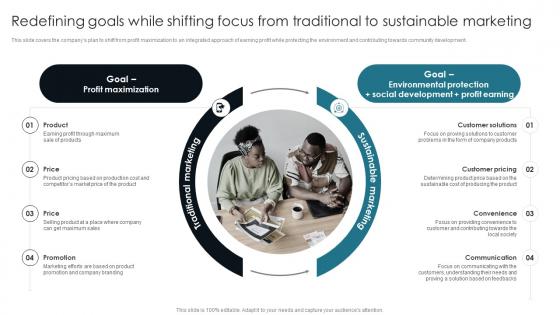
Redefining Goals While Shifting Focus Customer Centric Advertising Infographics PDF
This slide covers the companys plan to shift from profit maximization to an integrated approach of earning profit while protecting the environment and contributing towards community development. Are you in need of a template that can accommodate all of your creative concepts This one is crafted professionally and can be altered to fit any style. Use it with Google Slides or PowerPoint. Include striking photographs, symbols, depictions, and other visuals. Fill, move around, or remove text boxes as desired. Test out color palettes and font mixtures. Edit and save your work, or work with colleagues. Download Redefining Goals While Shifting Focus Customer Centric Advertising Infographics PDF and observe how to make your presentation outstanding. Give an impeccable presentation to your group and make your presentation unforgettable. This slide covers the companys plan to shift from profit maximization to an integrated approach of earning profit while protecting the environment and contributing towards community development.
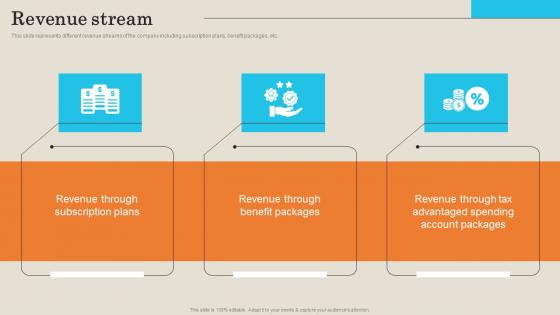
Revenue Stream Employee Management Platform Investor Funding Presentation Infographics Pdf
This slide represents different revenue streams of the company including subscription plans, benefit packages, etc. Coming up with a presentation necessitates that the majority of the effort goes into the content and the message you intend to convey. The visuals of a PowerPoint presentation can only be effective if it supplements and supports the story that is being told. Keeping this in mind our experts created Revenue Stream Employee Management Platform Investor Funding Presentation Infographics Pdf to reduce the time that goes into designing the presentation. This way, you can concentrate on the message while our designers take care of providing you with the right template for the situation. This slide represents different revenue streams of the company including subscription plans, benefit packages, etc.
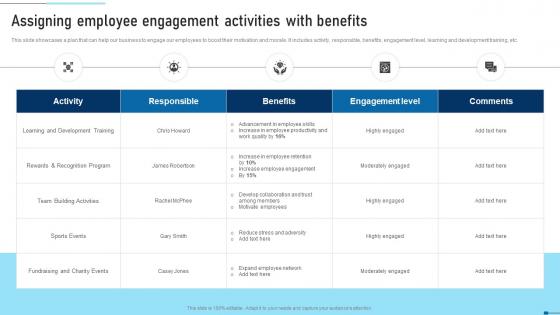
Assigning Employee Engagement Activities With Strategic Talent Recruitment Infographics Pdf
This slide showcases a plan that can help our business to engage our employees to boost their motivation and morale. It includes activity, responsible, benefits, engagement level, learning and development training, etc. There are so many reasons you need a Assigning Employee Engagement Activities With Strategic Talent Recruitment Infographics Pdf. The first reason is you can not spend time making everything from scratch, Thus, Slidegeeks has made presentation templates for you too. You can easily download these templates from our website easily. This slide showcases a plan that can help our business to engage our employees to boost their motivation and morale. It includes activity, responsible, benefits, engagement level, learning and development training, etc.
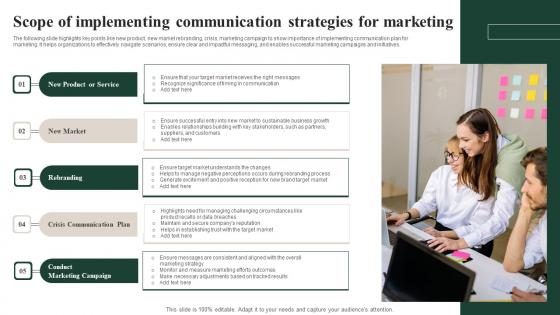
Scope Of Implementing Communication Strategies For Marketing Infographics Pdf
The following slide highlights key points like new product, new market rebranding, crisis, marketing campaign to show importance of implementing communication plan for marketing. It helps organizations to effectively navigate scenarios, ensure clear and impactful messaging, and enables successful marketing campaigns and initiatives. Showcasing this set of slides titled Scope Of Implementing Communication Strategies For Marketing Infographics Pdf The topics addressed in these templates are Product Or Service, New Market, Rebranding All the content presented in this PPT design is completely editable. Download it and make adjustments in color, background, font etc. as per your unique business setting. The following slide highlights key points like new product, new market rebranding, crisis, marketing campaign to show importance of implementing communication plan for marketing. It helps organizations to effectively navigate scenarios, ensure clear and impactful messaging, and enables successful marketing campaigns and initiatives.
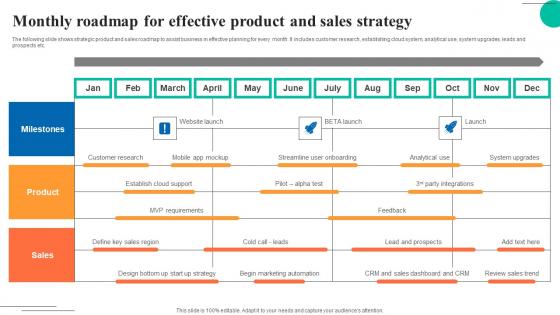
Monthly Roadmap For Effective Product And Sales Strategy Infographics Pdf
The following slide shows strategic product and sales roadmap to assist business in effective planning for every month. It includes customer research, establishing cloud system, analytical use, system upgrades, leads and prospects etc. Showcasing this set of slides titled Monthly Roadmap For Effective Product And Sales Strategy Infographics Pdf. The topics addressed in these templates are Milestones, Product, Sales. All the content presented in this PPT design is completely editable. Download it and make adjustments in color, background, font etc. as per your unique business setting. The following slide shows strategic product and sales roadmap to assist business in effective planning for every month. It includes customer research, establishing cloud system, analytical use, system upgrades, leads and prospects etc.
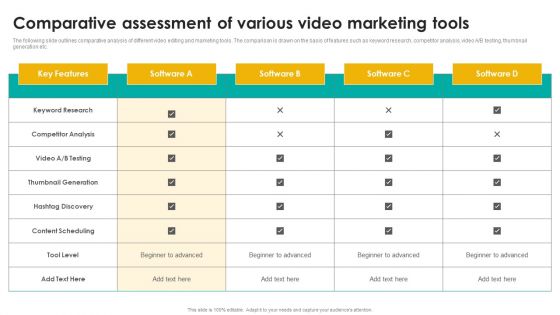
Comparative Assessment Of Various Video Marketing Tools Infographics PDF
The following slide outlines comparative analysis of different video editing and marketing tools. The comparison is drawn on the basis of features such as keyword research, competitor analysis, video A or B testing, thumbnail generation etc. This Comparative Assessment Of Various Video Marketing Tools Infographics PDF from Slidegeeks makes it easy to present information on your topic with precision. It provides customization options, so you can make changes to the colors, design, graphics, or any other component to create a unique layout. It is also available for immediate download, so you can begin using it right away. Slidegeeks has done good research to ensure that you have everything you need to make your presentation stand out. Make a name out there for a brilliant performance.
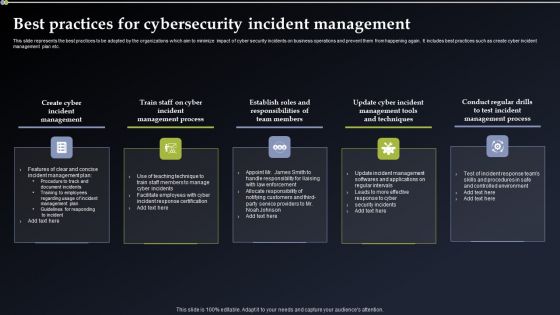
Best Practices For Cybersecurity Incident Management Infographics PDF
This slide represents the best practices to be adopted by the organizations which aim to minimize impact of cyber security incidents on business operations and prevent them from happening again. It includes best practices such as create cyber incident management plan etc. Boost your pitch with our creative Best Practices For Cybersecurity Incident Management Infographics PDF. Deliver an awe inspiring pitch that will mesmerize everyone. Using these presentation templates you will surely catch everyones attention. You can browse the ppts collection on our website. We have researchers who are experts at creating the right content for the templates. So you do not have to invest time in any additional work. Just grab the template now and use them.
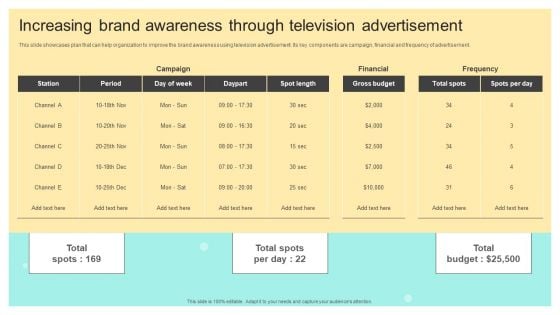
Increasing Brand Awareness Through Television Advertisement Infographics PDF
This slide showcases plan that can help organization to improve the brand awareness using television advertisement. Its key components are campaign, financial and frequency of advertisement.Retrieve professionally designed Increasing Brand Awareness Through Television Advertisement Infographics PDF to effectively convey your message and captivate your listeners. Save time by selecting pre-made slideshows that are appropriate for various topics, from business to educational purposes. These themes come in many different styles, from creative to corporate, and all of them are easily adjustable and can be edited quickly. Access them as PowerPoint templates or as Google Slides themes. You do not have to go on a hunt for the perfect presentation because Slidegeeks got you covered from everywhere.
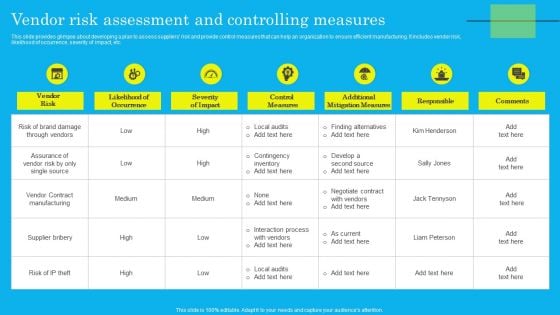
Vendor Risk Assessment And Controlling Measures Infographics PDF
This slide provides glimpse about developing a plan to assess suppliers risk and provide control measures that can help an organization to ensure efficient manufacturing. It includes vendor risk, likelihood of occurrence, severity of impact, etc. The Vendor Risk Assessment And Controlling Measures Infographics PDF is a compilation of the most recent design trends as a series of slides. It is suitable for any subject or industry presentation, containing attractive visuals and photo spots for businesses to clearly express their messages. This template contains a variety of slides for the user to input data, such as structures to contrast two elements, bullet points, and slides for written information. Slidegeeks is prepared to create an impression.
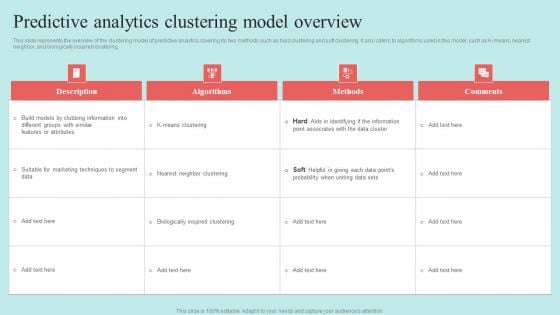
Predictive Data Model Predictive Analytics Clustering Model Overview Infographics PDF
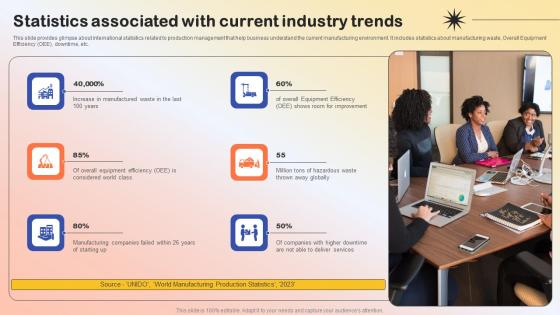
Statistics Associated With Current Industry Production Quality Administration Infographics Pdf
This slide provides glimpse about international statistics related to production management that help business understand the current manufacturing environment. It includes statistics about manufacturing waste, Overall Equipment Efficiency OEE, downtime, etc.Welcome to our selection of the Statistics Associated With Current Industry Production Quality Administration Infographics Pdf. These are designed to help you showcase your creativity and bring your sphere to life. Planning and Innovation are essential for any business that is just starting out. This collection contains the designs that you need for your everyday presentations. All of our PowerPoints are 100Precent editable, so you can customize them to suit your needs. This multi-purpose template can be used in various situations. Grab these presentation templates today. This slide provides glimpse about international statistics related to production management that help business understand the current manufacturing environment. It includes statistics about manufacturing waste, Overall Equipment Efficiency OEE, downtime, etc.
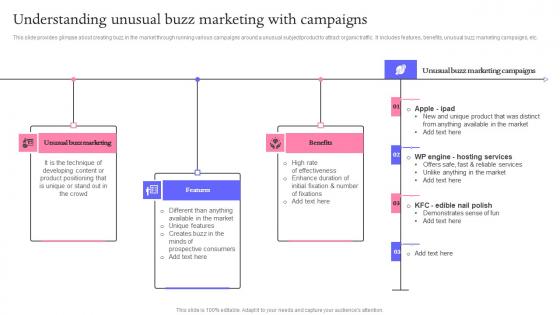
Understanding Unusual Buzz Marketing Techniques For Engaging Infographics Pdf
This slide provides glimpse about creating buzz in the market through running various campaigns around a unusual subject product to attract organic traffic. It includes features, benefits, unusual buzz marketing campaigns, etc. Welcome to our selection of the Understanding Unusual Buzz Marketing Techniques For Engaging Infographics Pdf. These are designed to help you showcase your creativity and bring your sphere to life. Planning and Innovation are essential for any business that is just starting out. This collection contains the designs that you need for your everyday presentations. All of our PowerPoints are 100 percent editable, so you can customize them to suit your needs. This multi purpose template can be used in various situations. Grab these presentation templates today. This slide provides glimpse about creating buzz in the market through running various campaigns around a unusual subject product to attract organic traffic. It includes features, benefits, unusual buzz marketing campaigns, etc.
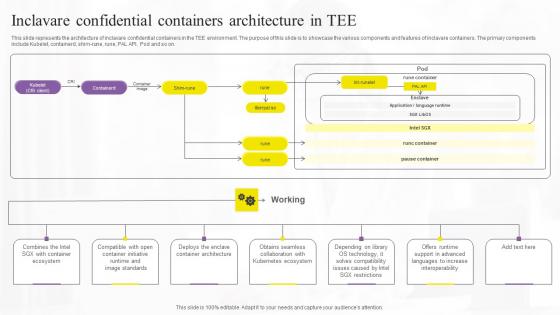
Inclavare Confidential Containers Confidential Computing Technologies Infographics Pdf
This slide represents the architecture of inclavare confidential containers in the TEE environment. The purpose of this slide is to showcase the various components and features of inclavare containers. The primary components include Kubelet, containerd, shim-rune, rune, PAL API, Pod and so on. Retrieve professionally designed Inclavare Confidential Containers Confidential Computing Technologies Infographics Pdf to effectively convey your message and captivate your listeners. Save time by selecting pre-made slideshows that are appropriate for various topics, from business to educational purposes. These themes come in many different styles, from creative to corporate, and all of them are easily adjustable and can be edited quickly. Access them as PowerPoint templates or as Google Slides themes. You do not have to go on a hunt for the perfect presentation because Slidegeeks got you covered from everywhere. This slide represents the architecture of inclavare confidential containers in the TEE environment. The purpose of this slide is to showcase the various components and features of inclavare containers. The primary components include Kubelet, containerd, shim-rune, rune, PAL API, Pod and so on.
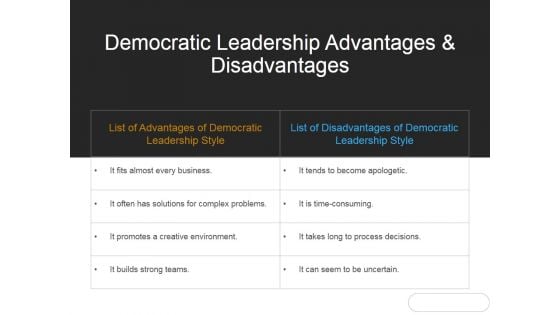
Democratic Leadership Advantages And Disadvantages Ppt PowerPoint Presentation Infographics
This is a democratic leadership advantages and disadvantages ppt powerpoint presentation infographics. This is a two stage process. The stages in this process are list of disadvantages of democratic leadership style, list of advantages of democratic leadership style.
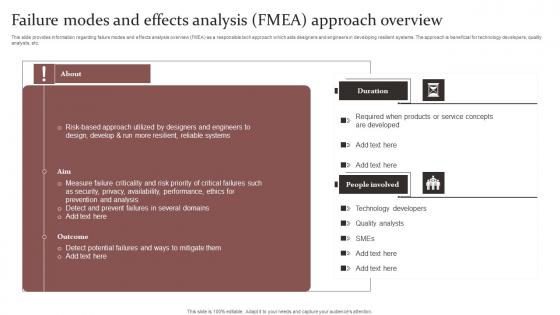
Failure Modes And Effects Responsible Technology Governance Manual Infographics Pdf
This slide provides information regarding failure modes and effects analysis overview FMEA as a responsible tech approach which aids designers and engineers in developing resilient systems. The approach is beneficial for technology developers, quality analysts, etc. Are you in need of a template that can accommodate all of your creative concepts This one is crafted professionally and can be altered to fit any style. Use it with Google Slides or PowerPoint. Include striking photographs, symbols, depictions, and other visuals. Fill, move around, or remove text boxes as desired. Test out color palettes and font mixtures. Edit and save your work, or work with colleagues. Download Failure Modes And Effects Responsible Technology Governance Manual Infographics Pdf and observe how to make your presentation outstanding. Give an impeccable presentation to your group and make your presentation unforgettable. This slide provides information regarding failure modes and effects analysis overview FMEA as a responsible tech approach which aids designers and engineers in developing resilient systems. The approach is beneficial for technology developers, quality analysts, etc.
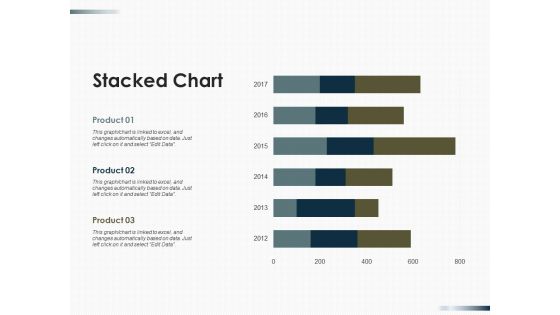
Stacked Chart Finance Ppt PowerPoint Presentation Outline Infographics
This is a stacked chart finance ppt powerpoint presentation outline infographics. This is a three stage process. The stages in this process are finance, marketing, management, investment, analysis.

Multiple Answer Question With Four Options Ppt Powerpoint Presentation Infographics Examples
This is a multiple answer question with four options ppt powerpoint presentation infographics examples. This is a four stage process. The stages in this process are multiple choice questions, optional question answers, objective questions.
Visual Aid Enhancing The Learning Process Ppt PowerPoint Presentation Infographics Vector
This is a visual aid enhancing the learning process ppt powerpoint presentation infographics vector. This is a three stage process. The stages in this process are visual aids, communication, business.

Diary With Paper Clip On Office Desk Ppt Powerpoint Presentation Infographics Portrait
This is a diary with paper clip on office desk ppt powerpoint presentation infographics portrait. This is a stage process. The stages in this process are stationery, paper clip, paper steel wire.
Highlighting Statistics Associated Esponsible Tech Guide To Manage Infographics Pdf
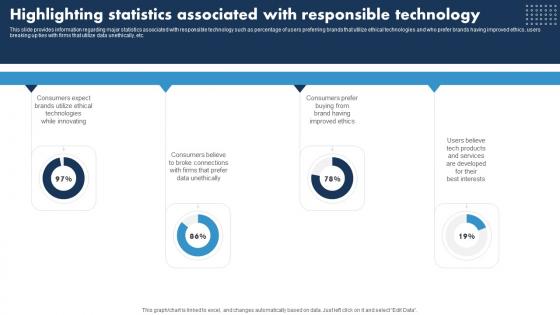
This slide provides information regarding major statistics associated with responsible technology such as percentage of users preferring brands that utilize ethical technologies and who prefer brands having improved ethics, users breaking up ties with firms that utilize data unethically, etc. Coming up with a presentation necessitates that the majority of the effort goes into the content and the message you intend to convey. The visuals of a PowerPoint presentation can only be effective if it supplements and supports the story that is being told. Keeping this in mind our experts created Highlighting Statistics Associated Esponsible Tech Guide To Manage Infographics Pdf to reduce the time that goes into designing the presentation. This way, you can concentrate on the message while our designers take care of providing you with the right template for the situation. This slide provides information regarding major statistics associated with responsible technology such as percentage of users preferring brands that utilize ethical technologies and who prefer brands having improved ethics, users breaking up ties with firms that utilize data unethically, etc.
Challenges Of Online Business Ppt PowerPoint Presentation Show Infographics
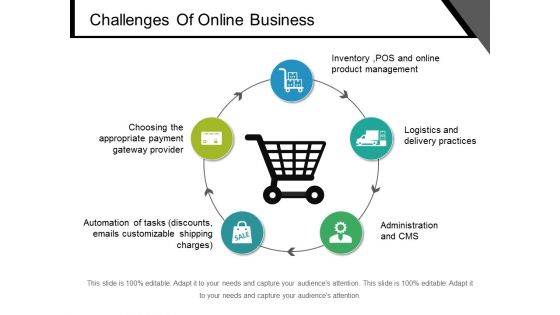
This is a challenges of online business ppt powerpoint presentation show infographics. This is a five stage process. The stages in this process are checklist, list of ideas, pain points.
Digital Marketing Plan Ppt PowerPoint Presentation Outline Infographics
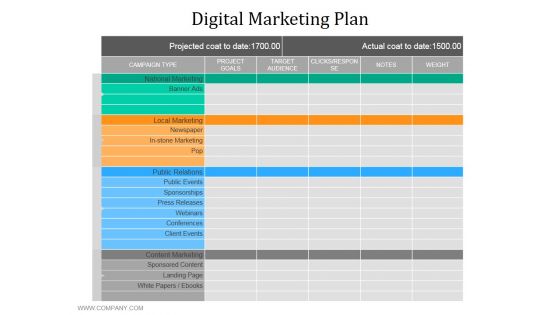
This is a digital marketing plan ppt powerpoint presentation outline infographics. This is a four stage process. The stages in this process are national marketing, local marketing, newspaper, in stone marketing, public relations.
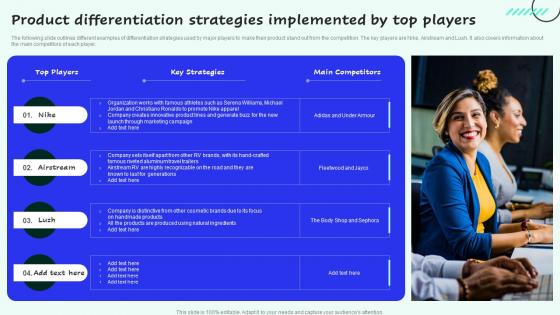
Product Differentiation Strategies Implemented Strategies Sales And Profitability Infographics Pdf
The following slide outlines different examples of differentiation strategies used by major players to make their product stand out from the competition. The key players are Nike, Airstream and Lush. It also covers information about the main competitors of each player.Welcome to our selection of the Product Differentiation Strategies Implemented Strategies Sales And Profitability Infographics Pdf. These are designed to help you showcase your creativity and bring your sphere to life. Planning and Innovation are essential for any business that is just starting out. This collection contains the designs that you need for your everyday presentations. All of our PowerPoints are 100Precent editable, so you can customize them to suit your needs. This multi purpose template can be used in various situations. Grab these presentation templates today. The following slide outlines different examples of differentiation strategies used by major players to make their product stand out from the competition. The key players are Nike, Airstream and Lush. It also covers information about the main competitors of each player.
Women Executive Leadership Program Ppt PowerPoint Presentation Portfolio Infographics
This is a women executive leadership program ppt powerpoint presentation portfolio infographics. This is a four stage process. The stages in this process are women executive leadership program.


 Continue with Email

 Home
Home


