Agenda Infographic

Bar Chart With Magnifying Glass For Financial Analysis Ppt Powerpoint Presentation Infographics Designs Download
This is a bar chart with magnifying glass for financial analysis ppt powerpoint presentation infographics designs download. This is a three stage process. The stages in this process are business metrics, business kpi, business dashboard.

Donut Chart Finance Marketing Ppt Powerpoint Presentation Infographics Skills Ppt Powerpoint Presentation File Skills
This is a donut chart finance marketing ppt powerpoint presentation infographics skills ppt powerpoint presentation file skills. This is a four stage process. The stages in this process are finance, marketing, management, investment, analysis.
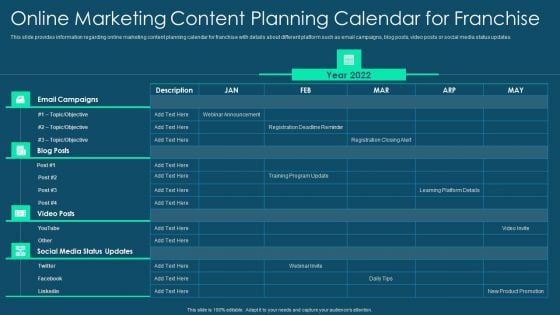
Franchise Promotion And Advertising Playbook Online Marketing Content Planning Calendar For Franchise Infographics PDF
This slide provides information regarding online marketing content planning calendar for franchise with details about different platform such as email campaigns, blog posts, video posts or social media status updates. Deliver an awe inspiring pitch with this creative franchise promotion and advertising playbook online marketing content planning calendar for franchise infographics pdf bundle. Topics like online marketing content planning calendar for franchise can be discussed with this completely editable template. It is available for immediate download depending on the needs and requirements of the user.

Consumer Retargeting Techniques Scheduling Retargeting Ads With The Reach And Frequency Of Buying Type Infographics PDF
This slide covers strategies for scheduling retargeting ads. It includes scheduling ads based on a particular time of the day and specific dates. It also includes scheduling examples such as promoting breakfast foods in the morning, driving awareness of a new brand leading up to its debut, etc. Deliver and pitch your topic in the best possible manner with this Consumer Retargeting Techniques Scheduling Retargeting Ads With The Reach And Frequency Of Buying Type Infographics PDF. Use them to share invaluable insights on Drive Awareness, Upcoming Premiere, Brand Leading and impress your audience. This template can be altered and modified as per your expectations. So, grab it now.

Purchasing And Logistics Management Circular Steps Ppt PowerPoint Presentation Infographics Portrait
This is a purchasing and logistics management circular steps ppt powerpoint presentation infographics portrait. This is a seven stage process. The stages in this process are purchasing, procurement, bidding.
Organizations Development People Inspiration With Icons Ppt PowerPoint Presentation Infographics Tips
This is a organizations development people inspiration with icons ppt powerpoint presentation infographics tips. This is a six stage process. The stages in this process are business development, corporate development.
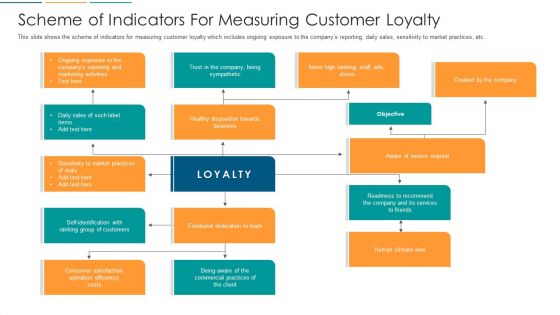
Scheme Of Indicators For Measuring Customer Loyalty Ppt Infographics Graphics Pictures PDF
This slide shows the scheme of indicators for measuring customer loyalty which includes ongoing exposure to the companys reporting, daily sales, sensitivity to market practices, etc. Deliver and pitch your topic in the best possible manner with this scheme of indicators for measuring customer loyalty ppt infographics graphics pictures pdf. Use them to share invaluable insights on scheme of indicators for measuring customer loyalty and impress your audience. This template can be altered and modified as per your expectations. So, grab it now.
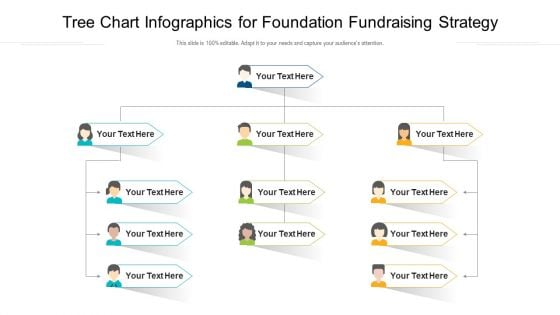
Tree Chart Infographics For Foundation Fundraising Strategy Ppt PowerPoint Presentation Gallery Vector PDF
Persuade your audience using this tree chart infographics for foundation fundraising strategy ppt powerpoint presentation gallery vector pdf. This PPT design covers five stages, thus making it a great tool to use. It also caters to a variety of topics including tree chart infographics for foundation fundraising strategy. Download this PPT design now to present a convincing pitch that not only emphasizes the topic but also showcases your presentation skills.
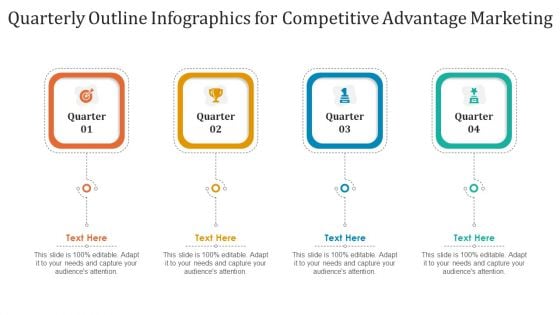
Quarterly Outline Infographics For Competitive Advantage Marketing Ppt PowerPoint Presentation Pictures Shapes PDF
Persuade your audience using this quarterly outline infographics for competitive advantage marketing ppt powerpoint presentation pictures shapes pdf. This PPT design covers four stages, thus making it a great tool to use. It also caters to a variety of topics including quarterly outline infographics for competitive advantage marketing. Download this PPT design now to present a convincing pitch that not only emphasizes the topic but also showcases your presentation skills.
Professional Development And Career Planning Roadmap Icons Slide Ppt Infographics Format PDF
Help your business to create an attention grabbing presentation using our professional development and career planning roadmap icons slide ppt infographics format pdf set of slides. The slide contains innovative icons that can be flexibly edited. Choose this professional development and career planning roadmap icons slide ppt infographics format pdf template to create a satisfactory experience for your customers. Go ahead and click the download button.

3 Year Timeline Infographics For Project Development Plan Ppt PowerPoint Presentation File Good PDF
Persuade your audience using this 3 year timeline infographics for project development plan ppt powerpoint presentation file good pdf. This PPT design covers three stages, thus making it a great tool to use. It also caters to a variety of topics including 3 year timeline infographics for project development plan. Download this PPT design now to present a convincing pitch that not only emphasizes the topic but also showcases your presentation skills.
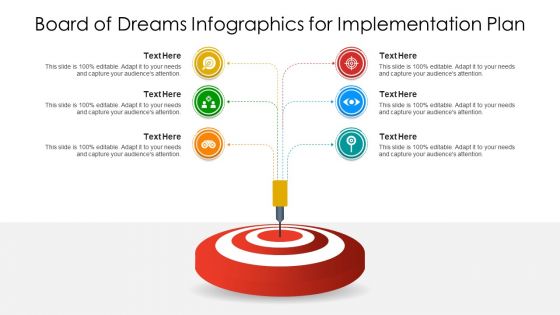
Board Of Dreams Infographics For Implementation Plan Ppt PowerPoint Presentation File Microsoft PDF
Persuade your audience using this board of dreams infographics for implementation plan ppt powerpoint presentation file microsoft pdf. This PPT design covers six stages, thus making it a great tool to use. It also caters to a variety of topics including board of dreams infographics for implementation plan. Download this PPT design now to present a convincing pitch that not only emphasizes the topic but also showcases your presentation skills.
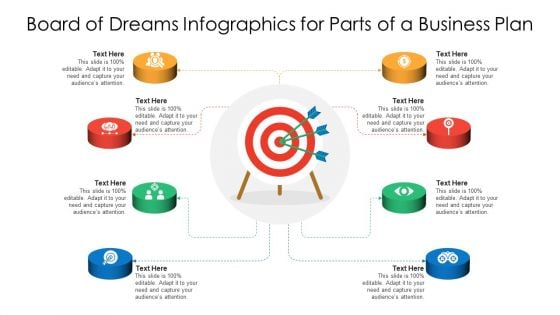
Board Of Dreams Infographics For Parts Of A Business Plan Ppt PowerPoint Presentation File Maker PDF
Presenting board of dreams infographics for parts of a business plan ppt powerpoint presentation file maker pdf to dispense important information. This template comprises eight stages. It also presents valuable insights into the topics including board of dreams infographics for parts of a business plan. This is a completely customizable PowerPoint theme that can be put to use immediately. So, download it and address the topic impactfully.
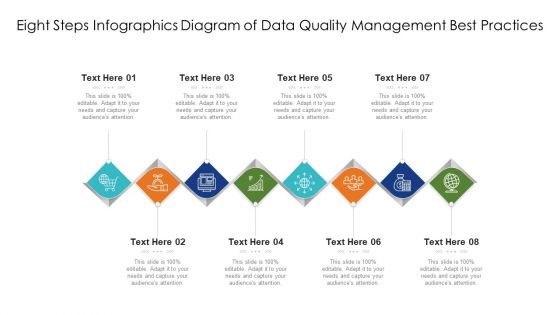
Eight Steps Infographics Diagram Of Data Quality Management Best Practices Ppt PowerPoint Presentation File Outline PDF
Presenting eight steps infographics diagram of data quality management best practices ppt powerpoint presentation file outline pdf to dispense important information. This template comprises eight stages. It also presents valuable insights into the topics including eight steps infographics diagram of data quality management best practices. This is a completely customizable PowerPoint theme that can be put to use immediately. So, download it and address the topic impactfully.
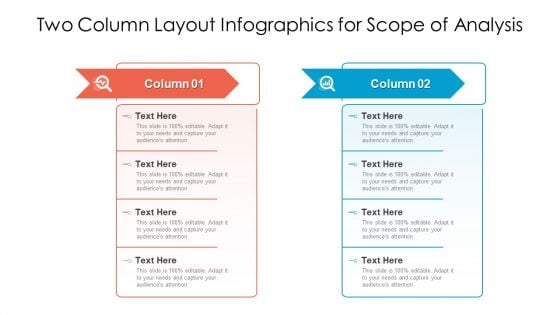
Two Column Layout Infographics For Scope Of Analysis Ppt PowerPoint Presentation Outline Inspiration PDF
Persuade your audience using this two column layout infographics for scope of analysis ppt powerpoint presentation outline inspiration pdf. This PPT design covers two stages, thus making it a great tool to use. It also caters to a variety of topics including two column layout infographics for scope of analysis. Download this PPT design now to present a convincing pitch that not only emphasizes the topic but also showcases your presentation skills.
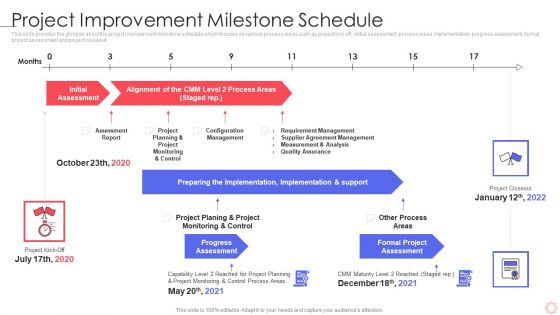
SPI Methodology Project Improvement Milestone Schedule Ppt PowerPoint Presentation File Infographics PDF
This slide provides the glimpse about the project improvement milestone schedule which focuses on various process areas such as project kick off, initial assessment, process areas implementation, progress assessment, formal project assessment and project closeout. Deliver and pitch your topic in the best possible manner with this spi methodology project improvement milestone schedule ppt powerpoint presentation file infographics pdf. Use them to share invaluable insights on process areas, implementation and support, project assessment, progress assessment and impress your audience. This template can be altered and modified as per your expectations. So, grab it now.
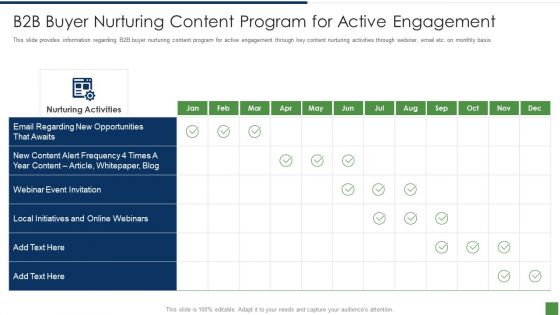
B2B Lead Generation Plan B2b Buyer Nurturing Content Program For Active Engagement Infographics PDF
This slide provides information regarding B2B buyer nurturing content program for active engagement through key content nurturing activities through webinar, email etc. on monthly basis. Deliver an awe inspiring pitch with this creative b2b lead generation plan b2b buyer nurturing content program for active engagement infographics pdf bundle. Topics like b2b buyer nurturing content program for active engagement can be discussed with this completely editable template. It is available for immediate download depending on the needs and requirements of the user.

Eight Steps Infographics Diagram Of IT Modernization Roadmap Ppt PowerPoint Presentation File Slide Portrait PDF
Persuade your audience using this eight steps infographics diagram of it modernization roadmap ppt powerpoint presentation file slide portrait pdf. This PPT design covers eight stages, thus making it a great tool to use. It also caters to a variety of topics including eight steps infographics diagram of it modernization roadmap. Download this PPT design now to present a convincing pitch that not only emphasizes the topic but also showcases your presentation skills.
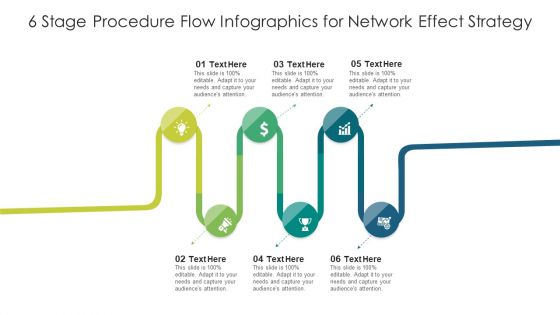
6 Stage Procedure Flow Infographics For Network Effect Strategy Ppt PowerPoint Presentation File Graphics Download PDF
Presenting 6 stage procedure flow infographics for network effect strategy ppt powerpoint presentation file graphics download pdf to dispense important information. This template comprises six stages. It also presents valuable insights into the topics including 6 stage procedure flow infographics for network effect strategy. This is a completely customizable PowerPoint theme that can be put to use immediately. So, download it and address the topic impactfully.
Icons Slide Guide For Guide For Implementing Market Intelligence In Business Infographics PDF
Help your business to create an attention-grabbing presentation using our Icons Slide Guide For Guide For Implementing Market Intelligence In Business Infographics PDF set of slides. The slide contains innovative icons that can be flexibly edited. Choose this Icons Slide Guide For Guide For Implementing Market Intelligence In Business Infographics PDF template to create a satisfactory experience for your customers. Go ahead and click the download button.
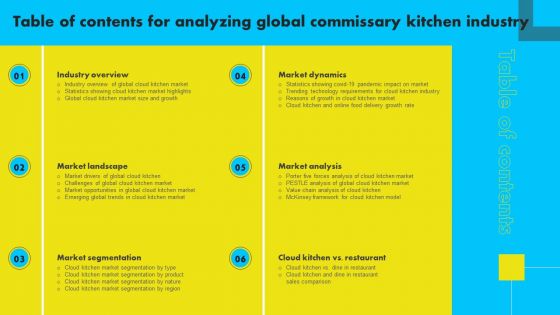
Table Of Contents For Analyzing Global Commissary Kitchen Industry Infographics PDF
Formulating a presentation can take up a lot of effort and time, so the content and message should always be the primary focus. The visuals of the PowerPoint can enhance the presenters message, so our Table Of Contents For Analyzing Global Commissary Kitchen Industry Infographics PDF was created to help save time. Instead of worrying about the design, the presenter can concentrate on the message while our designers work on creating the ideal templates for whatever situation is needed. Slidegeeks has experts for everything from amazing designs to valuable content, we have put everything into Table Of Contents For Analyzing Global Commissary Kitchen Industry Infographics PDF.
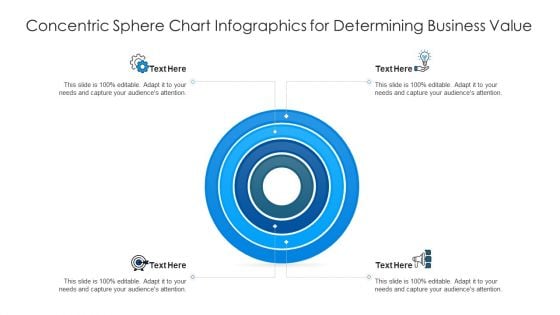
Concentric Sphere Chart Infographics For Determining Business Value Ppt Professional Template PDF
Persuade your audience using this concentric sphere chart infographics for determining business value ppt professional template pdf. This PPT design covers four stages, thus making it a great tool to use. It also caters to a variety of topics including concentric sphere chart infographics for determining business value. Download this PPT design now to present a convincing pitch that not only emphasizes the topic but also showcases your presentation skills.
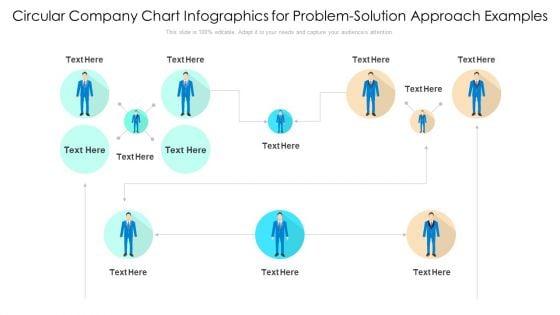
Circular Company Chart Infographics For Problem Solution Approach Examples Ppt PowerPoint Presentation File Visual Aids PDF
Persuade your audience using this circular company chart infographics for problem solution approach examples ppt powerpoint presentation file visual aids pdf. This PPT design covers one stages, thus making it a great tool to use. It also caters to a variety of topics including circular company chart infographics for problem solution approach examples. Download this PPT design now to present a convincing pitch that not only emphasizes the topic but also showcases your presentation skills.
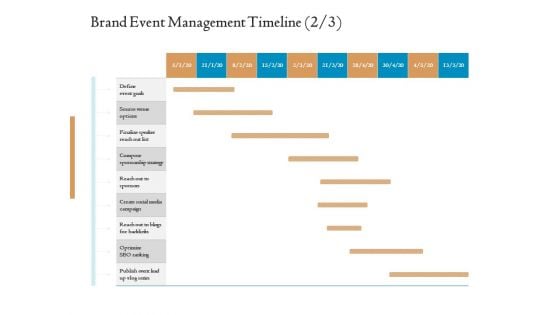
Corporate Event Planning Management Brand Event Management Timeline Goals Ppt Infographics Background PDF
Presenting this set of slides with name corporate event planning management brand event management timeline goals ppt infographics background pdf. The topics discussed in these slides are define event goals, source venue options, compose sponsorship strategy, finalize speaker reach out list, optimize seo ranking. This is a completely editable PowerPoint presentation and is available for immediate download. Download now and impress your audience.
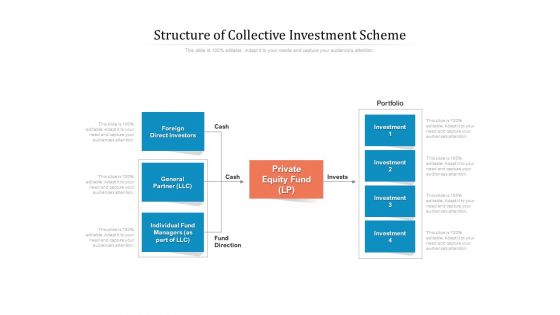
Structure Of Collective Investment Scheme Ppt PowerPoint Presentation Infographics Template PDF
Presenting this set of slides with name structure of collective investment scheme ppt powerpoint presentation infographics template pdf. This is a four stage process. The stages in this process are foreign, direct investors, general partner llc, individual fund managers as part of llc, investment, portfolio, private equity fund lp. This is a completely editable PowerPoint presentation and is available for immediate download. Download now and impress your audience.
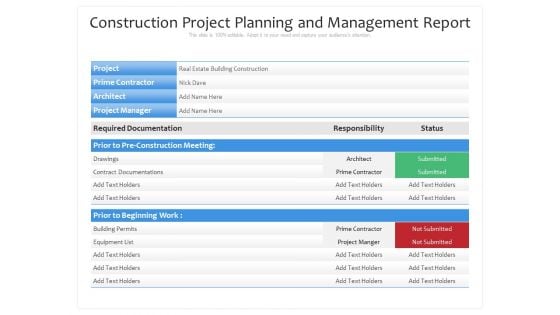
Construction Project Planning And Management Report Ppt PowerPoint Presentation Infographics Topics PDF
Pitch your topic with ease and precision using this construction project planning and management report ppt powerpoint presentation infographics topics pdf. This layout presents information on project, architect, project manager, required documentation, equipment list, building permits. It is also available for immediate download and adjustment. So, changes can be made in the color, design, graphics or any other component to create a unique layout.
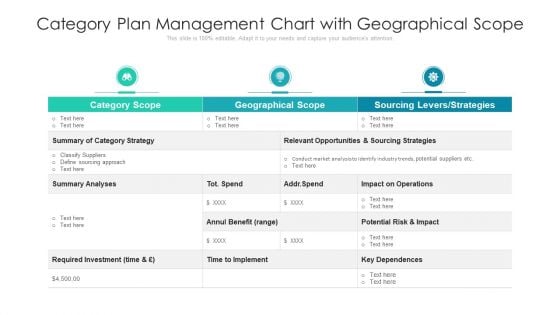
Category Plan Management Chart With Geographical Scope Ppt Infographics Designs Download PDF
Showcasing this set of slides titled category plan management chart with geographical scope ppt infographics designs download pdf. The topics addressed in these templates are opportunities, investment, impact on operations. All the content presented in this PPT design is completely editable. Download it and make adjustments in color, background, font etc. as per your unique business setting.
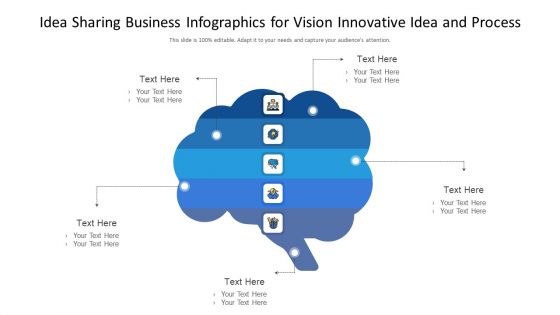
Idea Sharing Business Infographics For Vision Innovative Idea And Process Ppt PowerPoint Presentation Diagram Templates PDF
Presenting idea sharing business infographics for vision innovative idea and process ppt powerpoint presentation diagram templates pdf to dispense important information. This template comprises five stages. It also presents valuable insights into the topics including idea sharing business infographics for vision innovative idea and process. This is a completely customizable PowerPoint theme that can be put to use immediately. So, download it and address the topic impactfully.
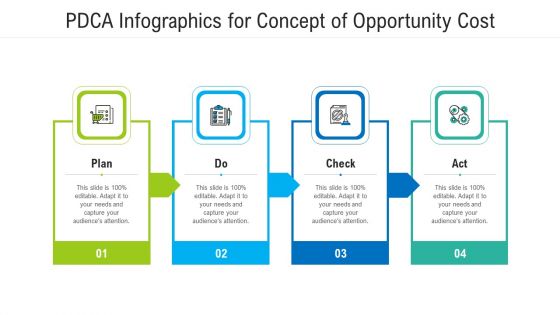
Pdca Infographics For Concept Of Opportunity Cost Ppt PowerPoint Presentation File Background Image PDF
This is a pdca infographics for concept of opportunity cost ppt powerpoint presentation file background image pdf template with various stages. Focus and dispense information on four stages using this creative set, that comes with editable features. It contains large content boxes to add your information on topics like pdca infographics for concept of opportunity cost. You can also showcase facts, figures, and other relevant content using this PPT layout. Grab it now.
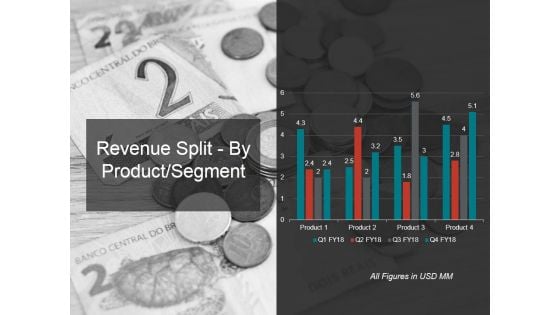
Revenue Split By Product Segment Template 1 Ppt PowerPoint Presentation Infographics Example
This is a revenue split by product segment template 1 ppt powerpoint presentation infographics example. This is a four stage process. The stages in this process are revenue, segment, business, marketing, success.
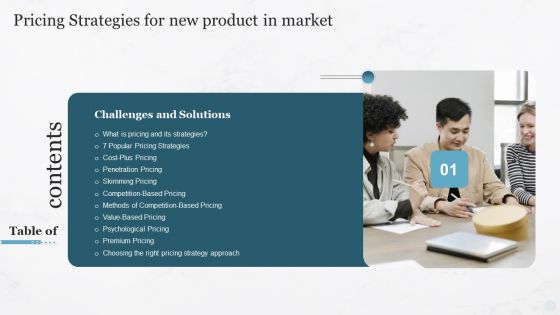
Table Of Contents Pricing Strategies For New Product In Market Slide Infographics PDF
Formulating a presentation can take up a lot of effort and time, so the content and message should always be the primary focus. The visuals of the PowerPoint can enhance the presenters message, so our Table Of Contents Pricing Strategies For New Product In Market Slide Infographics PDF was created to help save time. Instead of worrying about the design, the presenter can concentrate on the message while our designers work on creating the ideal templates for whatever situation is needed. Slidegeeks has experts for everything from amazing designs to valuable content, we have put everything into Table Of Contents Pricing Strategies For New Product In Market Slide Infographics PDF.

Table Of Contents Biochips Use Cases Slide6 Ppt Infographics Examples PDF
Formulating a presentation can take up a lot of effort and time, so the content and message should always be the primary focus. The visuals of the PowerPoint can enhance the presenters message, so our Table Of Contents Biochips Use Cases Slide6 Ppt Infographics Examples PDF was created to help save time. Instead of worrying about the design, the presenter can concentrate on the message while our designers work on creating the ideal templates for whatever situation is needed. Slidegeeks has experts for everything from amazing designs to valuable content, we have put everything into Table Of Contents Biochips Use Cases Slide6 Ppt Infographics Examples PDF.
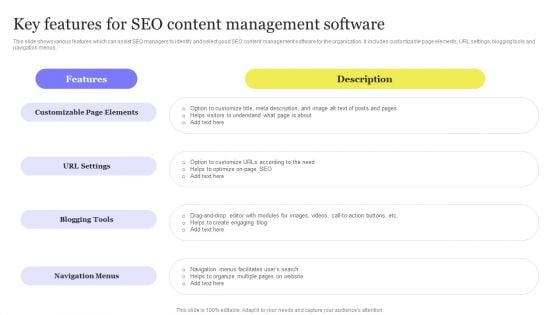
Enhancing Digital Visibility Using SEO Content Strategy Key Features For SEO Content Management Software Infographics PDF
This slide shows various features which can assist SEO managers to identify and select good SEO content management software for the organization. It includes customizable page elements, URL settings, blogging tools and navigation menus. Crafting an eye catching presentation has never been more straightforward. Let your presentation shine with this tasteful yet straightforward Enhancing Digital Visibility Using SEO Content Strategy Key Features For SEO Content Management Software Infographics PDF template. It offers a minimalistic and classy look that is great for making a statement. The colors have been employed intelligently to add a bit of playfulness while still remaining professional. Construct the ideal Enhancing Digital Visibility Using SEO Content Strategy Key Features For SEO Content Management Software Infographics PDF that effortlessly grabs the attention of your audience. Begin now and be certain to wow your customers.
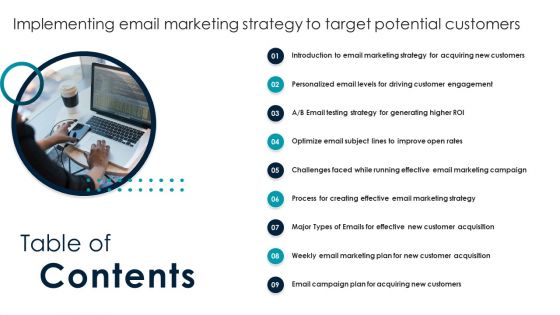
Table Of Contents Implementing Email Marketing Strategy To Target Potential Customers Infographics PDF
Find highly impressive Table Of Contents Implementing Email Marketing Strategy To Target Potential Customers Infographics PDF on Slidegeeks to deliver a meaningful presentation. You can save an ample amount of time using these presentation templates. No need to worry to prepare everything from scratch because Slidegeeks experts have already done a huge research and work for you. You need to download Table Of Contents Implementing Email Marketing Strategy To Target Potential Customers Infographics PDF for your upcoming presentation. All the presentation templates are 100 percent editable and you can change the color and personalize the content accordingly. Download now.
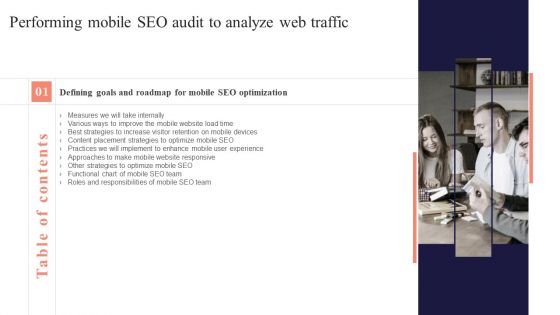
Table Of Contents Performing Mobile SEO Audit To Analyze Web Traffic Slide Infographics PDF
Do you have to make sure that everyone on your team knows about any specific topic I yes, then you should give Table Of Contents Performing Mobile SEO Audit To Analyze Web Traffic Slide Infographics PDF a try. Our experts have put a lot of knowledge and effort into creating this impeccable Table Of Contents Performing Mobile SEO Audit To Analyze Web Traffic Slide Infographics PDF. You can use this template for your upcoming presentations, as the slides are perfect to represent even the tiniest detail. You can download these templates from the Slidegeeks website and these are easy to edit. So grab these today.

Implementing Cloud Project Management Software Solution Enhance Operational Effectiveness Table Of Contents Infographics PDF
Do you have to make sure that everyone on your team knows about any specific topic I yes, then you should give Implementing Cloud Project Management Software Solution Enhance Operational Effectiveness Table Of Contents Infographics PDF a try. Our experts have put a lot of knowledge and effort into creating this impeccable Implementing Cloud Project Management Software Solution Enhance Operational Effectiveness Table Of Contents Infographics PDF. You can use this template for your upcoming presentations, as the slides are perfect to represent even the tiniest detail. You can download these templates from the Slidegeeks website and these are easy to edit. So grab these today.
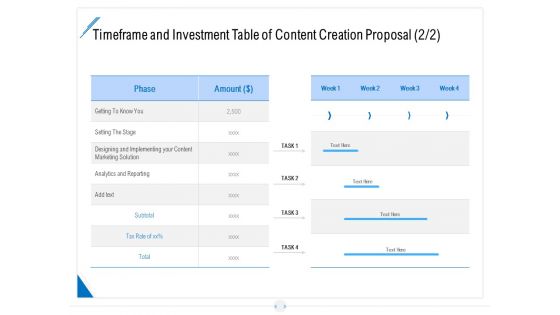
Developing Content Strategy Timeframe And Investment Table Of Content Creation Ppt Infographics Gridlines PDF
Deliver and pitch your topic in the best possible manner with this developing content strategy timeframe and investment table of content creation ppt infographics gridlines pdf. Use them to share invaluable insights on phase, description, time span, amount and impress your audience. This template can be altered and modified as per your expectations. So, grab it now.
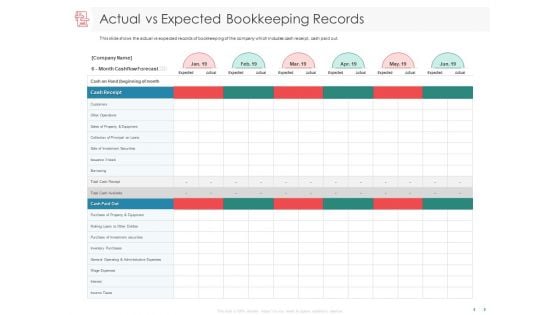
Managing CFO Services Actual Vs Expected Bookkeeping Records Ppt Infographics Example PDF
Presenting this set of slides with name managing cfo services actual vs expected bookkeeping records ppt infographics example pdf. The topics discussed in these slides are cash paid out, cash receipt. This is a completely editable PowerPoint presentation and is available for immediate download. Download now and impress your audience.

Why Do We Need Solar Energy Ppt PowerPoint Presentation Infographics Layout
This is a why do we need solar energy ppt powerpoint presentation infographics layout. This is a one stage process. The stages in this process are solar energy, planning, management, strategy, business.
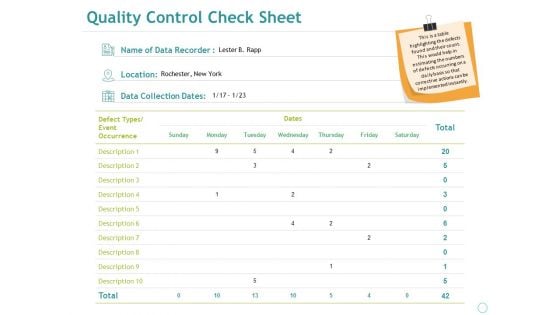
Quality Control Check Sheet Template 1 Ppt PowerPoint Presentation Infographics Slides
This is a quality control check sheet template 1 ppt powerpoint presentation infographics slides. This is a ten stage process. The stages in this process are defect types event occurrence, business, marketing, table, planning.

Illustrative Data Structure Five Years Roadmap For Business Intelligence Programs Infographics
We present our illustrative data structure five years roadmap for business intelligence programs infographics. This PowerPoint layout is easy-to-edit so you can change the font size, font type, color, and shape conveniently. In addition to this, the PowerPoint layout is Google Slides compatible, so you can share it with your audience and give them access to edit it. Therefore, download and save this well-researched illustrative data structure five years roadmap for business intelligence programs infographics in different formats like PDF, PNG, and JPG to smoothly execute your business plan.
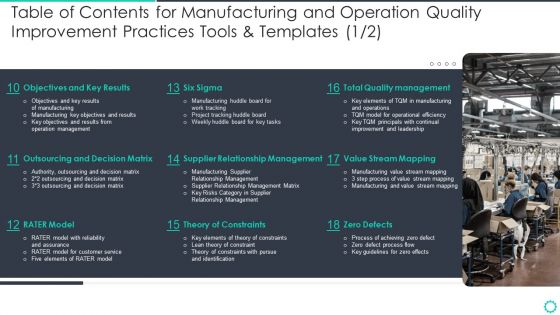
Table Of Contents For Manufacturing And Operation Quality Improvement Practices Tools And Templates Results Infographics PDF
Deliver and pitch your topic in the best possible manner with this table of contents for manufacturing and operation quality improvement practices tools and templates results infographics pdf. Use them to share invaluable insights on objectives and key results, six sigma, theory of constraints, zero defects, value stream mapping and impress your audience. This template can be altered and modified as per your expectations. So, grab it now.
How I Helped My Current Team Ppt PowerPoint Presentation Infographics Topics
This is a how i helped my current team ppt powerpoint presentation infographics topics. This is a four stage process. The stages in this process are business, icons, marketing, success, presentation.
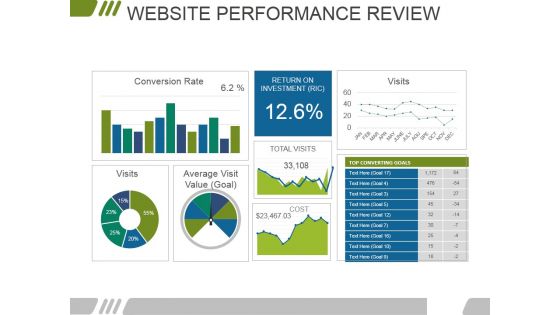
Website Performance Review Template 2 Ppt PowerPoint Presentation Infographics Background Designs
This is a website performance review template 2 ppt powerpoint presentation infographics background designs. This is a three stage process. The stages in this process are conversion rate, visits, return on investment, average visit value.
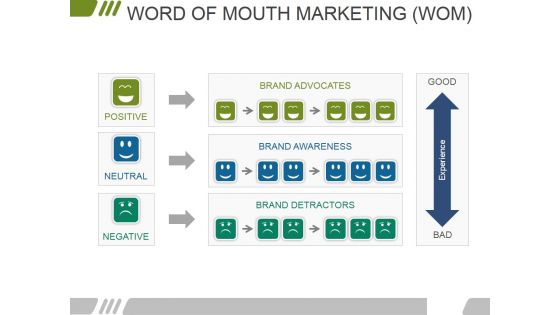
Word Of Mouth Marketing Wom Ppt PowerPoint Presentation Infographics Example File
This is a word of mouth marketing wom ppt powerpoint presentation infographics example file. This is a three stage process. The stages in this process are brand advocates, brand awareness, brand detractors, positive, neutral, negative.
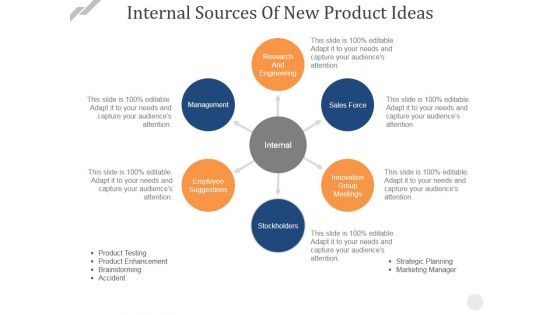
Internal Sources Of New Product Ideas Ppt PowerPoint Presentation Infographics Graphics Design
This is a internal sources of new product ideas ppt powerpoint presentation infographics graphics design. This is a six stage process. The stages in this process are stockholders, employee suggestions, management, research and engineering, sales force.
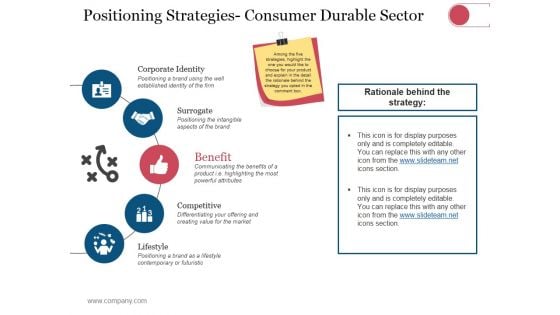
Positioning Strategies Consumer Durable Sector Ppt PowerPoint Presentation Infographics Slide Portrait
This is a positioning strategies consumer durable sector ppt powerpoint presentation infographics slide portrait. This is a five stage process. The stages in this process are corporate identity, surrogate, benefit, competitive, lifestyle.
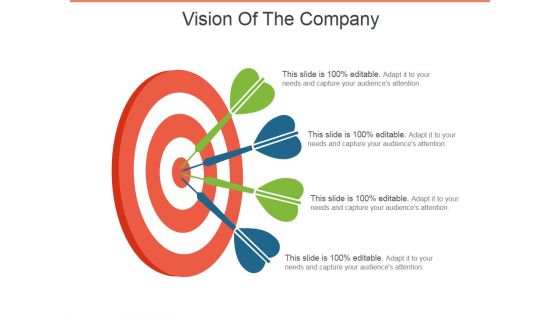
Vision Of The Company Template 1 Ppt PowerPoint Presentation Infographics Files
This is a vision of the company template 1 ppt powerpoint presentation infographics files. This is a four stage process. The stages in this process are our goal, business, marketing, targets, success.
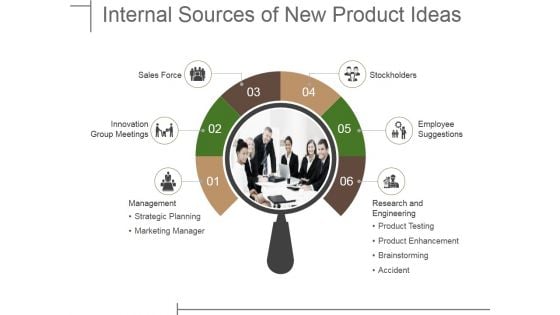
Internal Sources Of New Product Ideas Ppt PowerPoint Presentation Infographics Graphics Download
This is a internal sources of new product ideas ppt powerpoint presentation infographics graphics download. This is a six stage process. The stages in this process are sales force, innovation group meetings, management, stockholders, employee suggestions.
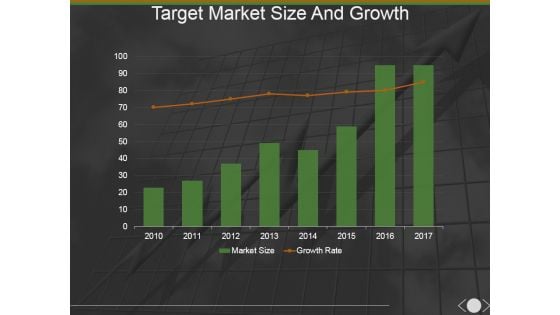
Target Market Size And Growth Template 2 Ppt PowerPoint Presentation Infographics Model
This is a target market size and growth template 2 ppt powerpoint presentation infographics model. This is a four stage process. The stages in this process are total available market, served market, target market, a city.
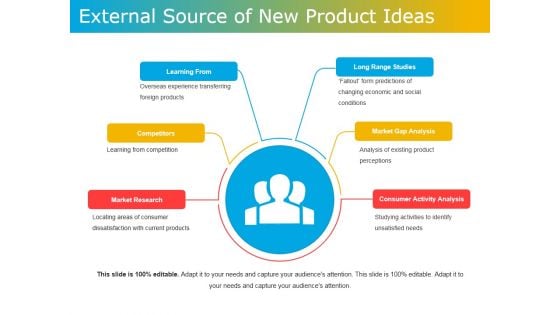
External Source Of New Product Ideas Ppt PowerPoint Presentation Infographics Structure
This is a external source of new product ideas ppt powerpoint presentation infographics structure. This is a six stage process. The stages in this process are learning from, competitors, market research, market gap analysis, long range studies.
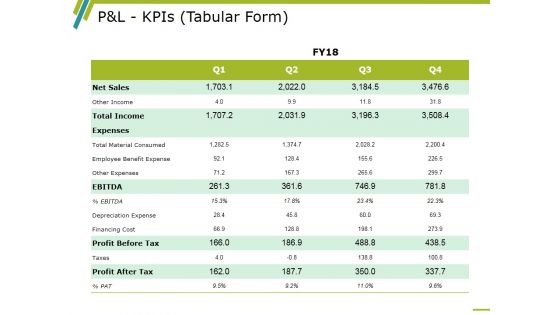
P And L Kpis Template 1 Ppt PowerPoint Presentation Infographics Professional
This is a p and l kpis template 1 ppt powerpoint presentation infographics professional. This is a four stage process. The stages in this process are Other Income, Total Income, Ebitda, Profit Before Tax, Profit After Tax.
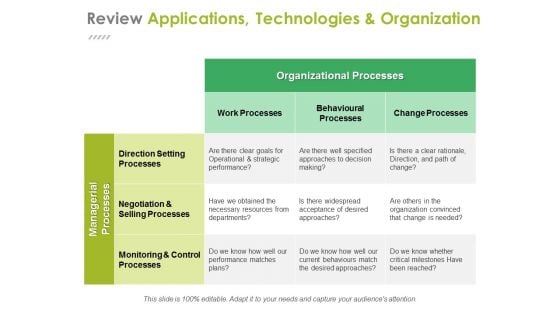
Review Applications Technologies And Organization Template 1 Ppt PowerPoint Presentation Infographics Format Ideas
This is a review applications technologies and organization template 1 ppt powerpoint presentation infographics format ideas. This is a three stage process. The stages in this process are business, work processes, behavioural processes, change processes, direction setting processes.
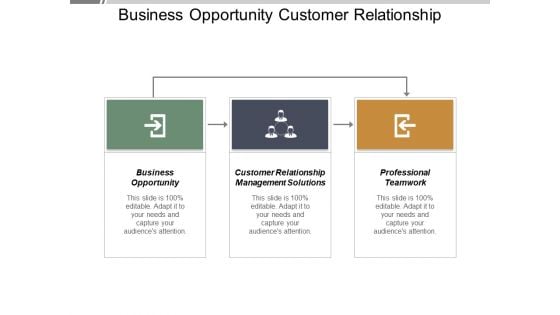
Business Opportunity Customer Relationship Management Solutions Professional Teamwork Ppt PowerPoint Presentation Infographics Graphics
This is a business opportunity customer relationship management solutions professional teamwork ppt powerpoint presentation infographics graphics. This is a three stage process. The stages in this process are business opportunity, customer relationship management solutions, professional teamwork.
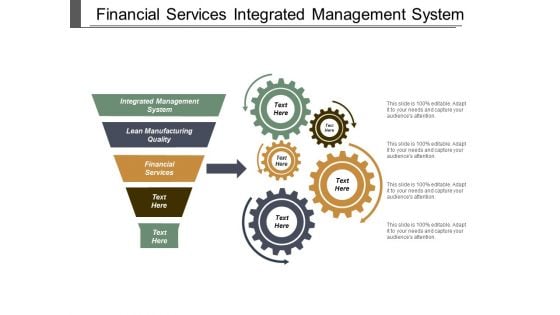
Financial Services Integrated Management System Lean Manufacturing Quality Ppt PowerPoint Presentation Infographics Grid
This is a financial services integrated management system lean manufacturing quality ppt powerpoint presentation infographics grid. This is a five stage process. The stages in this process are financial services, integrated management system, lean manufacturing quality.
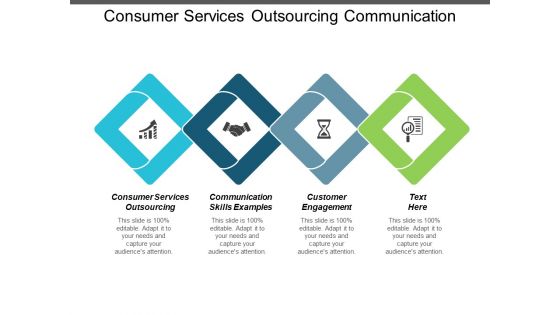
Consumer Services Outsourcing Communication Skills Examples Customer Engagement Ppt PowerPoint Presentation Infographics Portfolio
This is a consumer services outsourcing communication skills examples customer engagement ppt powerpoint presentation infographics portfolio. This is a four stage process. The stages in this process are consumer services outsourcing, communication skills examples, customer engagement.
Financial Graph Economic Growth Vector Icon Ppt PowerPoint Presentation Infographics Graphic Images Cpb
This is a financial graph economic growth vector icon ppt powerpoint presentation infographics graphic images cpb. This is a three stage process. The stages in this process are bar chart icon, bar graph icon, data chart icon.
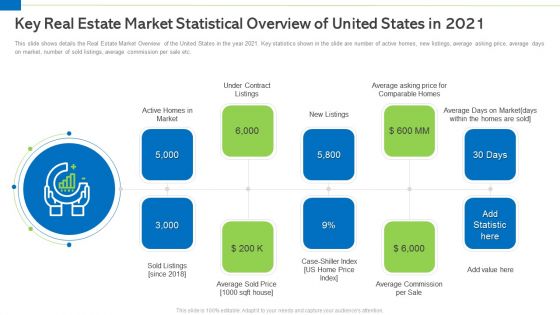
Key Real Estate Market Statistical Overview Of United States In 2021 Infographics PDF
This is a key real estate market statistical overview of united states in 2021 infographics pdf template with various stages. Focus and dispense information on eight stages using this creative set, that comes with editable features. It contains large content boxes to add your information on topics like active homes in market, under contract listings, sold listings, average sold price, average commission per sale. You can also showcase facts, figures, and other relevant content using this PPT layout. Grab it now.
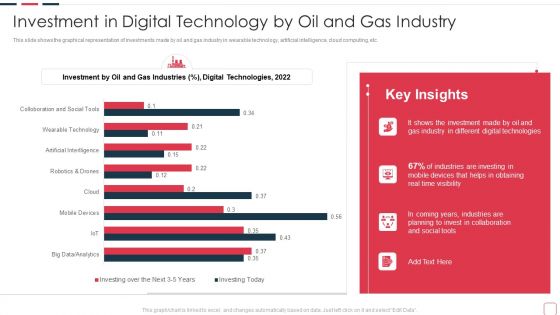
Price Benefit Internet Things Digital Twins Execution After Covid Investment In Digital Technology Infographics PDF
Deliver an awe inspiring pitch with this creative price benefit internet things digital twins execution after covid investment in digital technology infographics pdf bundle. Topics like investment in digital technology by oil and gas industry
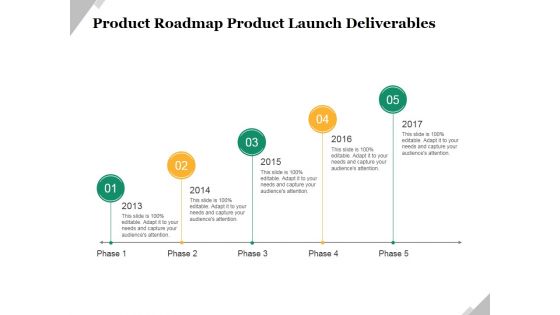
Product Roadmap Product Launch Deliverables Template 2 Ppt PowerPoint Presentation Infographics Pictures
This is a product roadmap product launch deliverables template 2 ppt powerpoint presentation infographics pictures. This is a five stage process. The stages in this process are timeline, business, planning, growth, management.


 Continue with Email

 Home
Home


