Ai Icon
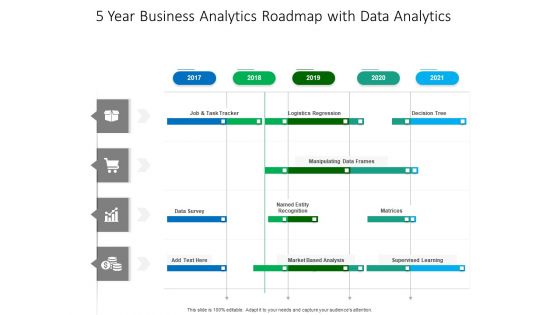
5 Year Business Analytics Roadmap With Data Analytics Sample
We present our 5 year business analytics roadmap with data analytics sample. This PowerPoint layout is easy-to-edit so you can change the font size, font type, color, and shape conveniently. In addition to this, the PowerPoint layout is Google Slides compatible, so you can share it with your audience and give them access to edit it. Therefore, download and save this well-researched 5 year business analytics roadmap with data analytics sample in different formats like PDF, PNG, and JPG to smoothly execute your business plan.
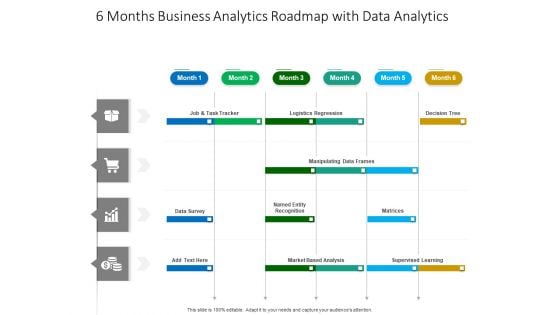
6 Months Business Analytics Roadmap With Data Analytics Brochure
We present our 6 months business analytics roadmap with data analytics brochure. This PowerPoint layout is easy-to-edit so you can change the font size, font type, color, and shape conveniently. In addition to this, the PowerPoint layout is Google Slides compatible, so you can share it with your audience and give them access to edit it. Therefore, download and save this well-researched 6 months business analytics roadmap with data analytics brochure in different formats like PDF, PNG, and JPG to smoothly execute your business plan.
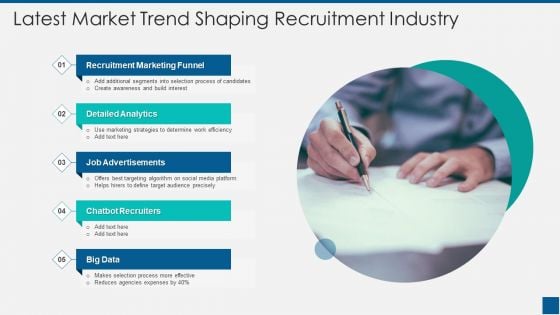
Latest Market Trend Shaping Recruitment Industry Ppt PowerPoint Presentation File Professional PDF
Presenting latest market trend shaping recruitment industry ppt powerpoint presentation file professional pdf to dispense important information. This template comprises five stages. It also presents valuable insights into the topics including recruitment marketing funnel, detailed analytics, job advertisements, chatbot recruiters, big data. This is a completely customizable PowerPoint theme that can be put to use immediately. So, download it and address the topic impactfully.
Forecast Analysis Technique IT Predictive Modeling Model Performance Tracking Dashboard Brochure PDF
This slide represents the predictive analytics model performance tracking dashboard, and it covers the details of total visitors, total buyers, total products added to the cart, filters by date and category, visitors to clients conversion rate, and so on. There are so many reasons you need a Forecast Analysis Technique IT Predictive Modeling Model Performance Tracking Dashboard Brochure PDF. The first reason is you can not spend time making everything from scratch, Thus, Slidegeeks has made presentation templates for you too. You can easily download these templates from our website easily.
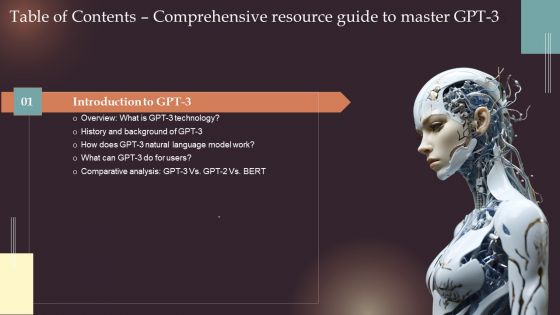
Comprehensive Resource Guide To Master GPT 3 Table Of Contents Professional PDF
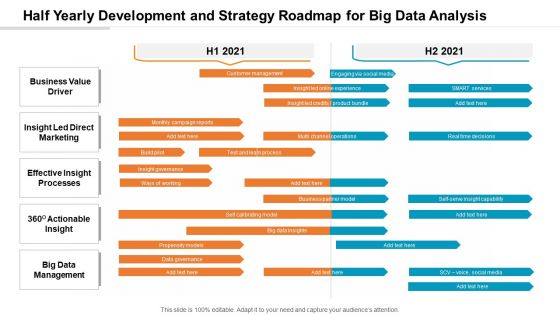
Half Yearly Development And Strategy Roadmap For Big Data Analysis Ideas
Presenting our innovatively-structured half yearly development and strategy roadmap for big data analysis ideas Template. Showcase your roadmap process in different formats like PDF, PNG, and JPG by clicking the download button below. This PPT design is available in both Standard Screen and Widescreen aspect ratios. It can also be easily personalized and presented with modified font size, font type, color, and shapes to measure your progress in a clear way.
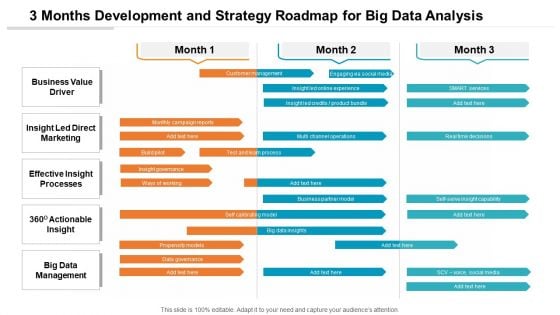
3 Months Development And Strategy Roadmap For Big Data Analysis Background
Presenting our innovatively-structured 3 months development and strategy roadmap for big data analysis background Template. Showcase your roadmap process in different formats like PDF, PNG, and JPG by clicking the download button below. This PPT design is available in both Standard Screen and Widescreen aspect ratios. It can also be easily personalized and presented with modified font size, font type, color, and shapes to measure your progress in a clear way.
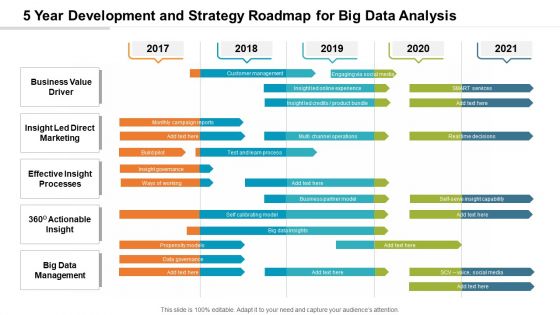
5 Year Development And Strategy Roadmap For Big Data Analysis Elements
Presenting our innovatively-structured 5 year development and strategy roadmap for big data analysis elements Template. Showcase your roadmap process in different formats like PDF, PNG, and JPG by clicking the download button below. This PPT design is available in both Standard Screen and Widescreen aspect ratios. It can also be easily personalized and presented with modified font size, font type, color, and shapes to measure your progress in a clear way.
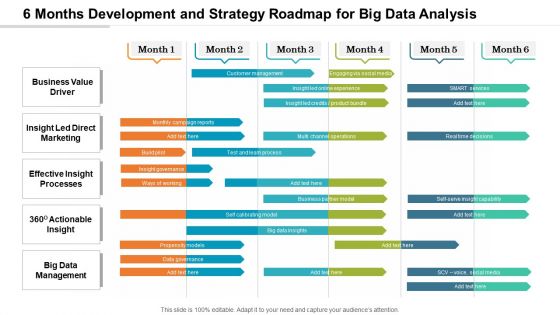
6 Months Development And Strategy Roadmap For Big Data Analysis Graphics
Presenting our innovatively-structured 6 months development and strategy roadmap for big data analysis graphics Template. Showcase your roadmap process in different formats like PDF, PNG, and JPG by clicking the download button below. This PPT design is available in both Standard Screen and Widescreen aspect ratios. It can also be easily personalized and presented with modified font size, font type, color, and shapes to measure your progress in a clear way.
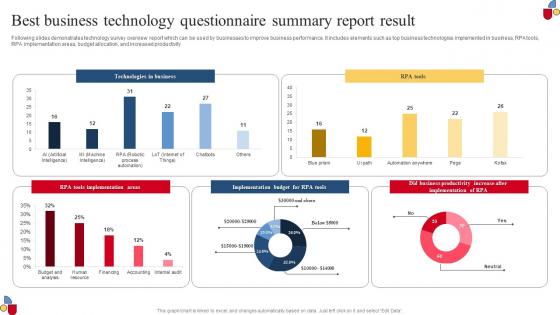
Best Business Technology Questionnaire Summary Report Result Summary Pdf
Following slides demonstrates technology survey overview report which can be used by businesses to improve business performance. It includes elements such as top business technologies implemented in business, RPA tools, RPA implementation areas, budget allocation, and increased productivity Pitch your topic with ease and precision using this Best Business Technology Questionnaire Summary Report Result Summary Pdf This layout presents information on Technologies In Business, Implementation Areas, Business Productivity It is also available for immediate download and adjustment. So, changes can be made in the color, design, graphics or any other component to create a unique layout. Following slides demonstrates technology survey overview report which can be used by businesses to improve business performance. It includes elements such as top business technologies implemented in business, RPA tools, RPA implementation areas, budget allocation, and increased productivity
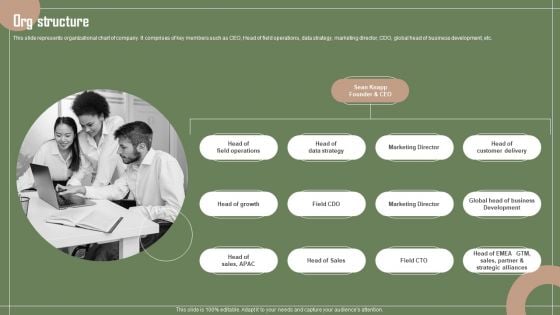
Data Automation Solution Investor Funding Presentation Org Structure Introduction PDF
This slide represents organizational chart of company. It comprises of key members such as CEO, Head of field operations, data strategy, marketing director, CDO, global head of business development, etc. If you are looking for a format to display your unique thoughts, then the professionally designed Data Automation Solution Investor Funding Presentation Org Structure Introduction PDF is the one for you. You can use it as a Google Slides template or a PowerPoint template. Incorporate impressive visuals, symbols, images, and other charts. Modify or reorganize the text boxes as you desire. Experiment with shade schemes and font pairings. Alter, share or cooperate with other people on your work. Download Data Automation Solution Investor Funding Presentation Org Structure Introduction PDF and find out how to give a successful presentation. Present a perfect display to your team and make your presentation unforgettable.
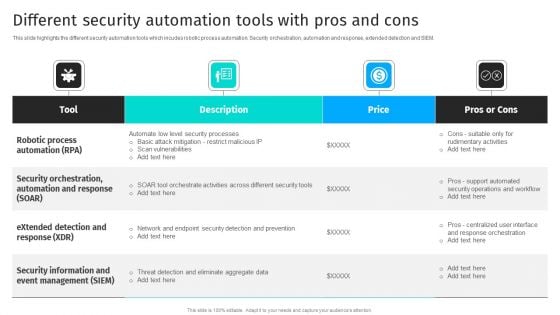
Security Automation To Analyze And Mitigate Cyberthreats Different Security Automation Tools Information PDF
This slide highlights the different security automation tools which incudes robotic process automation. Security orchestration, automation and response, extended detection and SIEM.Whether you have daily or monthly meetings, a brilliant presentation is necessary. Security Automation To Analyze And Mitigate Cyberthreats Different Security Automation Tools Information PDF can be your best option for delivering a presentation. Represent everything in detail using Security Automation To Analyze And Mitigate Cyberthreats Different Security Automation Tools Information PDF and make yourself stand out in meetings. The template is versatile and follows a structure that will cater to your requirements. All the templates prepared by Slidegeeks are easy to download and edit. Our research experts have taken care of the corporate themes as well. So, give it a try and see the results.
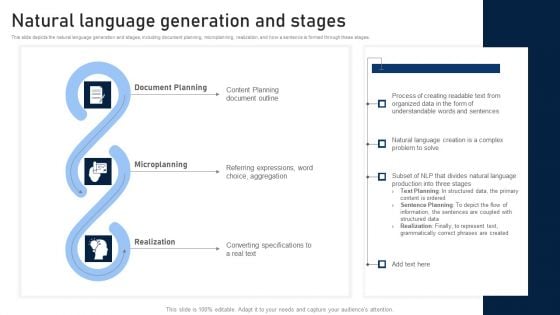
NLP Applications Methodology Natural Language Generation And Stages Sample PDF
This slide depicts the natural language generation and stages, including document planning, microplanning, realization, and how a sentence is formed through these stages. Are you searching for a NLP Applications Methodology Natural Language Generation And Stages Sample PDF that is uncluttered, straightforward, and original Its easy to edit, and you can change the colors to suit your personal or business branding. For a presentation that expresses how much effort you have put in, this template is ideal With all of its features, including tables, diagrams, statistics, and lists, its perfect for a business plan presentation. Make your ideas more appealing with these professional slides. Download NLP Applications Methodology Natural Language Generation And Stages Sample PDF from Slidegeeks today.
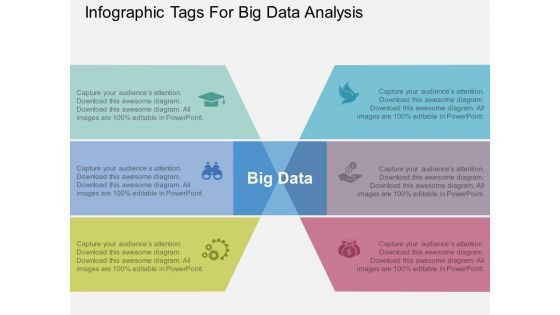
Infographic Tags For Big Data Analysis Powerpoint Template
Infographic tags have been displayed in this business slide. This PowerPoint template helps to exhibit big data analysis. Use this diagram to build an exclusive presentation.
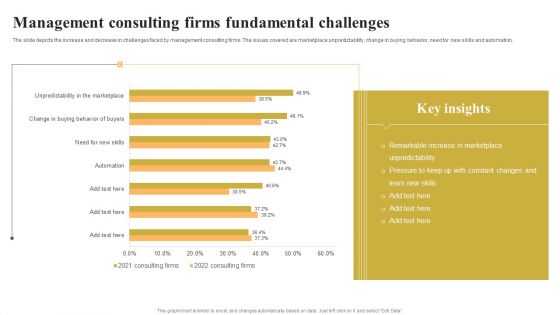
Management Consulting Firms Fundamental Challenges Themes PDF
The slide depicts the increase and decrease in challenges faced by management consulting firms. The issues covered are marketplace unpredictability, change in buying behavior, need for new skills and automation. Showcasing this set of slides titled Management Consulting Firms Fundamental Challenges Themes PDF. The topics addressed in these templates are Management Consulting Firms, Fundamental Challenges. All the content presented in this PPT design is completely editable. Download it and make adjustments in color, background, font etc. as per your unique business setting.
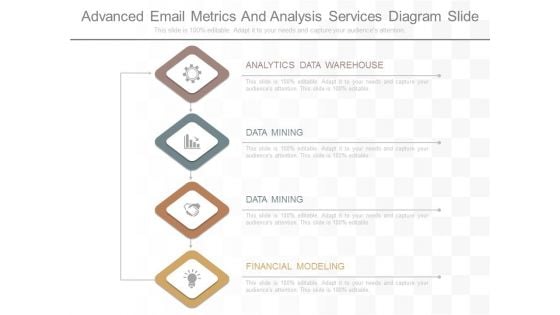
Advanced Email Metrics And Analysis Services Diagram Slide
This is a advanced email metrics and analysis services diagram slide. This is a four stage process. The stages in this process are analytics data warehouse, data mining, financial modeling.
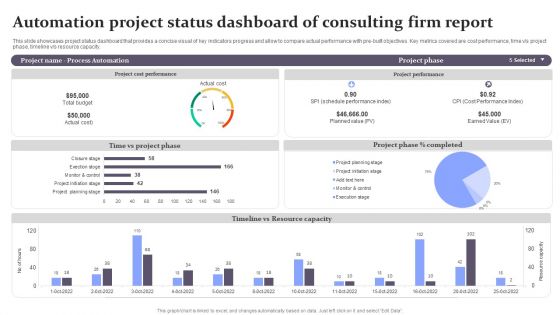
Automation Project Status Dashboard Of Consulting Firm Report Background PDF
This slide showcases project status dashboard that provides a concise visual of key indicators progress and allow to compare actual performance with pre-built objectives. Key metrics covered are cost performance, time v or s project phase, timeline v or s resource capacity. Showcasing this set of slides titled Automation Project Status Dashboard Of Consulting Firm Report Background PDF. The topics addressed in these templates are Project Phase, Planned Value, Cost Performance Index. All the content presented in this PPT design is completely editable. Download it and make adjustments in color, background, font etc. as per your unique business setting.
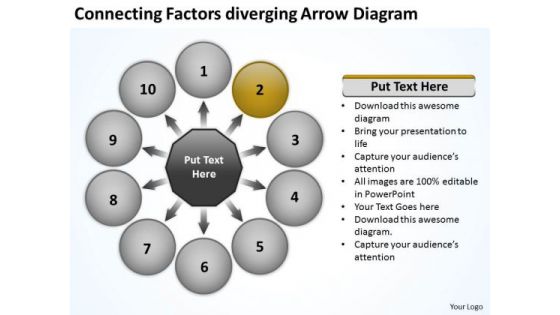
Connecting Factors Diverging Arrow Diagram Circular Process Network PowerPoint Templates
We present our connecting factors diverging arrow diagram Circular Process Network PowerPoint templates.Download and present our Success PowerPoint Templates because the success of your venture depends on the performance of every team member. Download and present our Arrows PowerPoint Templates because you can Take your team along by explaining your plans. Download and present our Business PowerPoint Templates because this slide will fire away with all the accuracy at your command. Use our Shapes PowerPoint Templates because you are the star of your enlightened team. Download our Flow Charts PowerPoint Templates because your findings are here to help arrive at an accurate diagnosis.Use these PowerPoint slides for presentations relating to Access, Arrow, Business, Chart, Circle, Concept, Conceptual, Connection, Corporate, Creative, Graphic, Illustration, Process, Shape, Template, Text, Usable, Web, Website. The prominent colors used in the PowerPoint template are Brown, Gray, Black. People tell us our connecting factors diverging arrow diagram Circular Process Network PowerPoint templates will get their audience's attention. Use our Connection PowerPoint templates and PPT Slides will generate and maintain the level of interest you desire. They will create the impression you want to imprint on your audience. Professionals tell us our connecting factors diverging arrow diagram Circular Process Network PowerPoint templates are Spectacular. Presenters tell us our Connection PowerPoint templates and PPT Slides are Fashionable. Professionals tell us our connecting factors diverging arrow diagram Circular Process Network PowerPoint templates are aesthetically designed to attract attention. We guarantee that they will grab all the eyeballs you need. PowerPoint presentation experts tell us our Chart PowerPoint templates and PPT Slides are Luxurious. Our Connecting Factors Diverging Arrow Diagram Circular Process Network PowerPoint Templates make many a feat feasible. They ease out all difficulties.
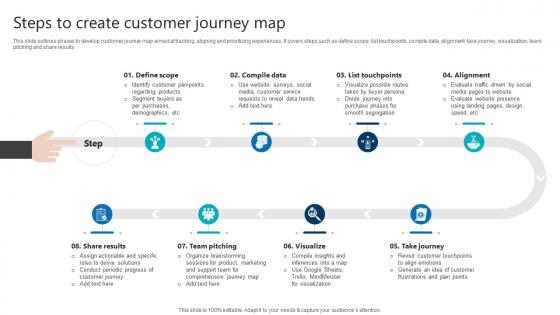
Steps To Create Customer Journey Map Product Analytics Implementation Data Analytics V
This slide outlines phases to develop customer journey map aimed at tracking, aligning and prioritizing experiences. It covers steps such as define scope, list touchpoints, compile data, alignment, take journey, visualization, team pitching and share results Welcome to our selection of the Steps To Create Customer Journey Map Product Analytics Implementation Data Analytics V. These are designed to help you showcase your creativity and bring your sphere to life. Planning and Innovation are essential for any business that is just starting out. This collection contains the designs that you need for your everyday presentations. All of our PowerPoints are 100 percent editable, so you can customize them to suit your needs. This multi-purpose template can be used in various situations. Grab these presentation templates today. This slide outlines phases to develop customer journey map aimed at tracking, aligning and prioritizing experiences. It covers steps such as define scope, list touchpoints, compile data, alignment, take journey, visualization, team pitching and share results
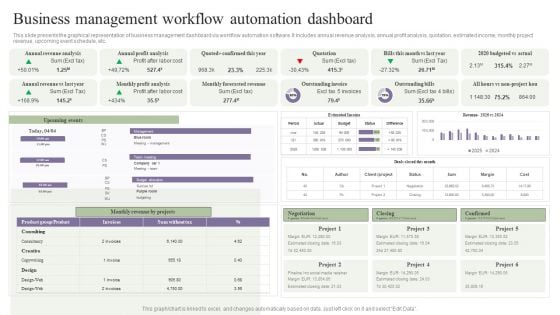
Deployment Of Process Automation To Increase Organisational Performance Business Management Workflow Themes PDF
This slide presents the graphical representation of business management dashboard via workflow automation software. It includes annual revenue analysis, annual profit analysis, quotation, estimated income, monthly project revenue, upcoming event schedule, etc. Presenting this PowerPoint presentation, titled Deployment Of Process Automation To Increase Organisational Performance Business Management Workflow Themes PDF, with topics curated by our researchers after extensive research. This editable presentation is available for immediate download and provides attractive features when used. Download now and captivate your audience. Presenting this Deployment Of Process Automation To Increase Organisational Performance Business Management Workflow Themes PDF. Our researchers have carefully researched and created these slides with all aspects taken into consideration. This is a completely customizable Deployment Of Process Automation To Increase Organisational Performance Business Management Workflow Themes PDF that is available for immediate downloading. Download now and make an impact on your audience. Highlight the attractive features available with our PPTs.
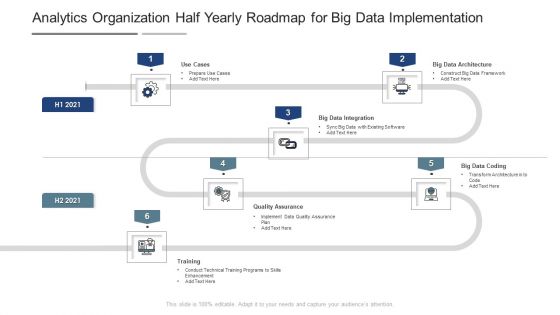
Analytics Organization Half Yearly Roadmap For Big Data Implementation Template
Presenting our innovatively structured analytics organization half yearly roadmap for big data implementation template Template. Showcase your roadmap process in different formats like PDF, PNG, and JPG by clicking the download button below. This PPT design is available in both Standard Screen and Widescreen aspect ratios. It can also be easily personalized and presented with modified font size, font type, color, and shapes to measure your progress in a clear way.
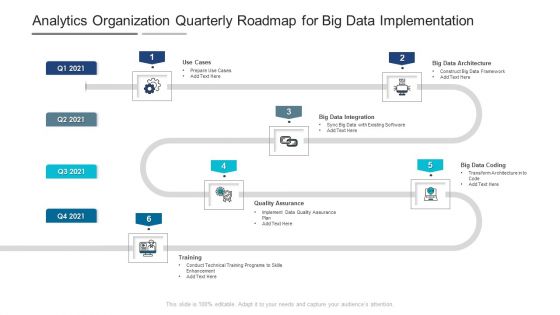
Analytics Organization Quarterly Roadmap For Big Data Implementation Portrait
Introducing our analytics organization quarterly roadmap for big data implementation portrait. This PPT presentation is Google Slides compatible, therefore, you can share it easily with the collaborators for measuring the progress. Also, the presentation is available in both standard screen and widescreen aspect ratios. So edit the template design by modifying the font size, font type, color, and shapes as per your requirements. As this PPT design is fully editable it can be presented in PDF, JPG and PNG formats.
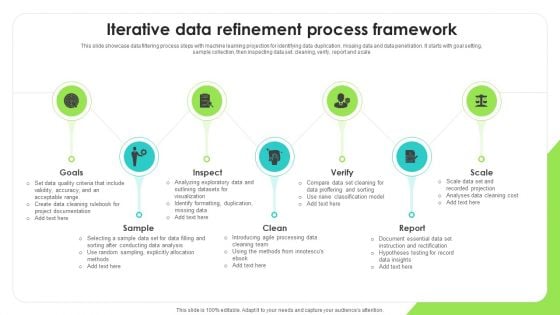
Iterative Data Refinement Process Framework Download PDF
This slide showcase data filtering process steps with machine learning projection for identifying data duplication, missing data and data penetration. It starts with goal setting, sample collection, then inspecting data set, cleaning, verify, report and scale. Presenting Iterative Data Refinement Process Framework Download PDF to dispense important information. This template comprises seven stages. It also presents valuable insights into the topics including Explicitly Allocation, Introducing Processing, Classification Model. This is a completely customizable PowerPoint theme that can be put to use immediately. So, download it and address the topic impactfully.
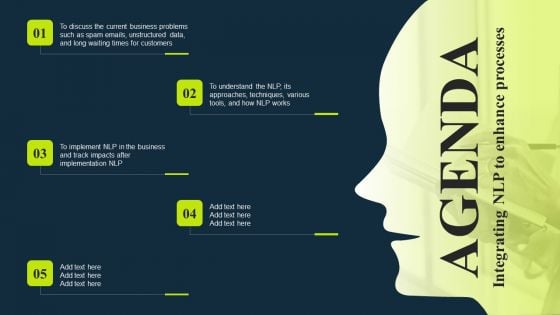
Agenda Integrating Nlp To Enhance Processes Clipart PDF
Whether you have daily or monthly meetings, a brilliant presentation is necessary. Agenda Integrating Nlp To Enhance Processes Clipart PDF can be your best option for delivering a presentation. Represent everything in detail using xxxxxxxxxxxxxxxxxxxxxx and make yourself stand out in meetings. The template is versatile and follows a structure that will cater to your requirements. All the templates prepared by Slidegeeks are easy to download and edit. Our research experts have taken care of the corporate themes as well. So, give it a try and see the results.
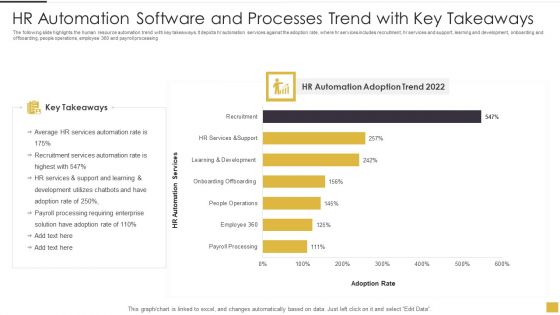
HR Automation Software And Processes Trend With Key Takeaways Themes PDF
The following slide highlights the human resource automation trend with key takeaways. It depicts hr automation services against the adoption rate, where hr services includes recruitment, hr services and support, learning and development, onboarding and offboarding, people operations, employee 360 and payroll processing. Showcasing this set of slides titled HR Automation Software And Processes Trend With Key Takeaways Themes PDF. The topics addressed in these templates are Average, Services Automation Rate, Requiring Enterprise. All the content presented in this PPT design is completely editable. Download it and make adjustments in color, background, font etc. as per your unique business setting.
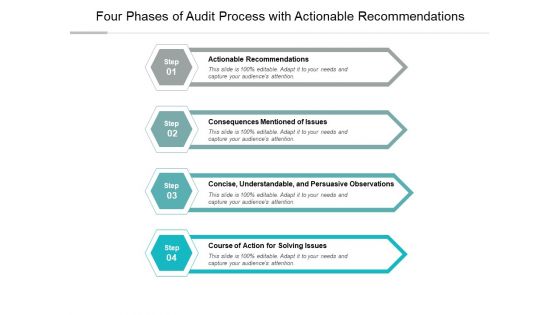
Four Phases Of Audit Process With Actionable Recommendations Ppt PowerPoint Presentation Outline Show
Presenting this set of slides with name four phases of audit process with actionable recommendations ppt powerpoint presentation outline show. This is a four stage process. The stages in this process are audit observation, business analytics, business performance. This is a completely editable PowerPoint presentation and is available for immediate download. Download now and impress your audience.
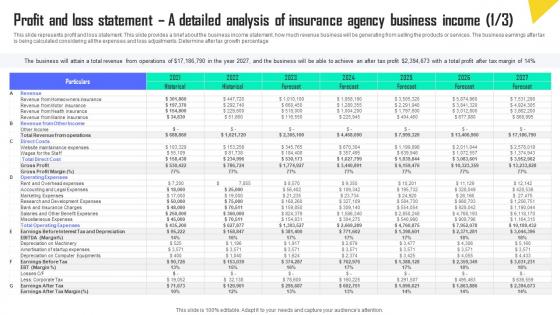
Profit And Loss Statement A Detailed Analysis Of Insurance Automobile Insurance Agency Rules Pdf
This slide represents profit and loss statement. This slide provides a brief about the business income statement, how much revenue business will be generating from selling the products or services. The business earnings after tax is being calculated considering all the expenses and loss adjustments. Determine after tax growth percentage. Retrieve professionally designed Profit And Loss Statement A Detailed Analysis Of Insurance Automobile Insurance Agency Rules Pdf to effectively convey your message and captivate your listeners. Save time by selecting pre-made slideshows that are appropriate for various topics, from business to educational purposes. These themes come in many different styles, from creative to corporate, and all of them are easily adjustable and can be edited quickly. Access them as PowerPoint templates or as Google Slides themes. You do not have to go on a hunt for the perfect presentation because Slidegeeks got you covered from everywhere. This slide represents profit and loss statement. This slide provides a brief about the business income statement, how much revenue business will be generating from selling the products or services. The business earnings after tax is being calculated considering all the expenses and loss adjustments. Determine after tax growth percentage.
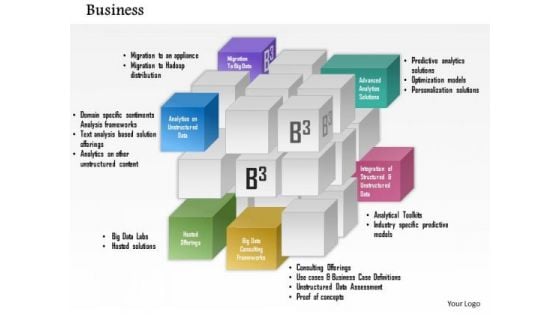
Business Framework Integrated Products And Services PowerPoint Presentation
This business framework power point diagram slide has been crafted for displaying business plan implementation. This PPT slide contains the cubical diagram to display multiple application of business plan. Use this PPT slide for Predictive analytics solutions, Optimization models and \nPersonalization solutions representation.
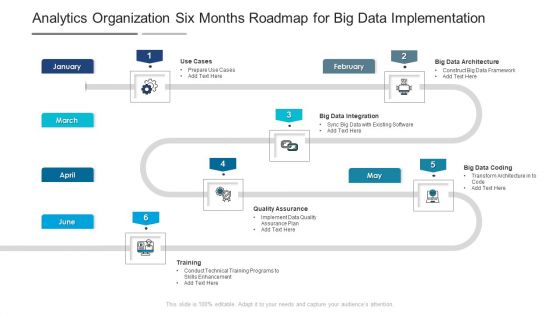
Analytics Organization Six Months Roadmap For Big Data Implementation Inspiration
Presenting the analytics organization six months roadmap for big data implementation inspiration. The template includes a roadmap that can be used to initiate a strategic plan. Not only this, the PowerPoint slideshow is completely editable and you can effortlessly modify the font size, font type, and shapes according to your needs. This PPT slide can be easily reached in standard screen and widescreen aspect ratios. The set is also available in various formats like PDF, PNG, and JPG. So download and use it multiple times as per your knowledge.
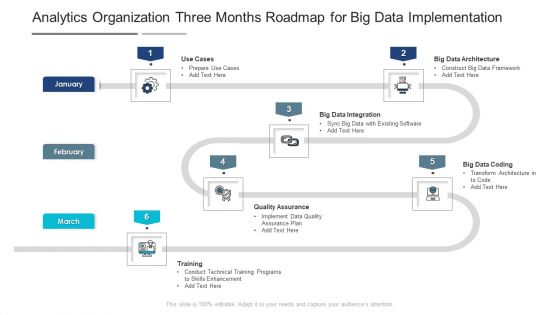
Analytics Organization Three Months Roadmap For Big Data Implementation Demonstration
Presenting our jaw dropping analytics organization three months roadmap for big data implementation demonstration. You can alternate the color, font size, font type, and shapes of this PPT layout according to your strategic process. This PPT presentation is compatible with Google Slides and is available in both standard screen and widescreen aspect ratios. You can also download this well researched PowerPoint template design in different formats like PDF, JPG, and PNG. So utilize this visually appealing design by clicking the download button given below.
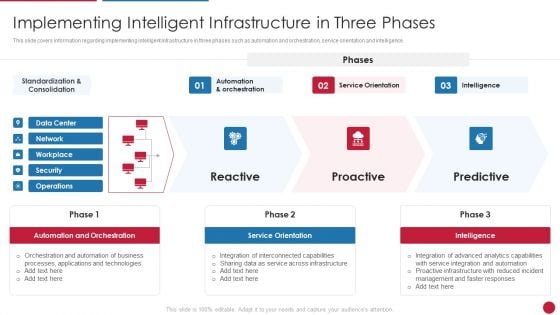
Facilitating IT Intelligence Architecture Implementing Intelligent Infrastructure In Three Phases Guidelines PDF
This slide covers information regarding implementing intelligent Infrastructure in three phases such as automation and orchestration, service orientation and intelligence. Deliver an awe inspiring pitch with this creative Facilitating IT Intelligence Architecture Implementing Intelligent Infrastructure In Three Phases Guidelines PDF bundle. Topics like Automation And Orchestration, Service Orientation, Intelligence can be discussed with this completely editable template. It is available for immediate download depending on the needs and requirements of the user.
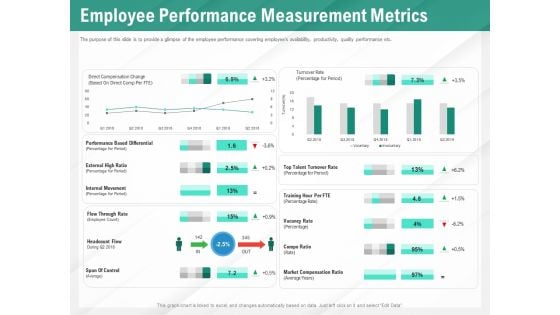
Benefits Of Business Process Automation Employee Performance Measurement Metrics Themes PDF
Presenting this set of slides with name benefits of business process automation employee performance measurement metrics themes pdf. The topics discussed in these slides are performance, training, vacancy rate, internal movement. This is a completely editable PowerPoint presentation and is available for immediate download. Download now and impress your audience.
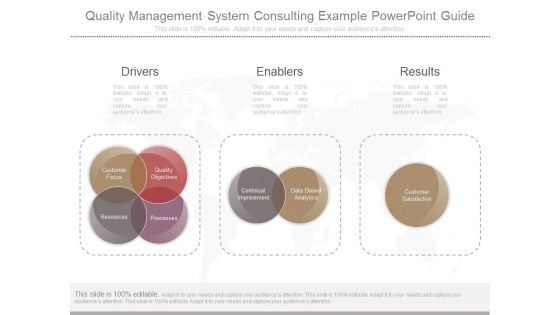
Quality Management System Consulting Example Powerpoint Guide
This is a quality management system consulting example powerpoint guide. This is a three stage process. The stages in this process are drivers, enablers, results, customer focus, quality objectives, processes, resources, continual improvement, data based analytics, customer satisfaction.

Business Diagram Big Data Words Written In Puzzle Pieces Presentation Template
Our above diagram presents big data words written in puzzle pieces. Graphic of white puzzle with big data words has been used to design this diagram. This slide contains the word big data made with puzzles. Use this diagram for your data technology related presentations.
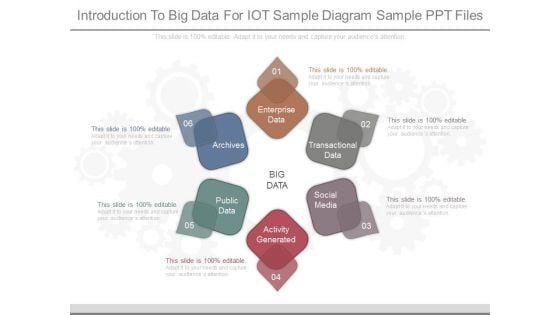
Introduction To Big Data For Iot Sample Diagram Sample Ppt Files
This is a introduction to big data for iot sample diagram sample ppt files. This is a six stage process. The stages in this process are enterprise data, transactional data, social media, activity generated, public data, archives, big data.
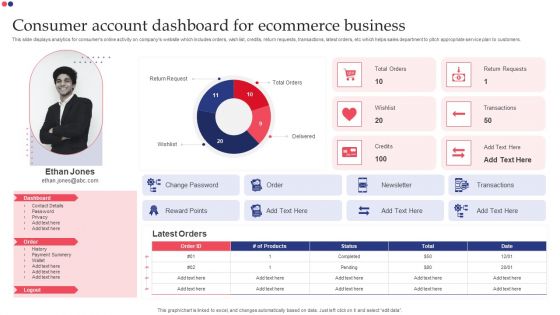
Consumer Account Dashboard For Ecommerce Business Themes PDF
This slide displays analytics for consumers online activity on companys website which includes orders, wish list, credits, return requests, transactions, latest orders, etc which helps sales department to pitch appropriate service plan to customers. Showcasing this set of slides titled Consumer Account Dashboard For Ecommerce Business Themes PDF. The topics addressed in these templates are Dashboard, Return Request, Delivered, Transactions. All the content presented in this PPT design is completely editable. Download it and make adjustments in color, background, font etc. as per your unique business setting.
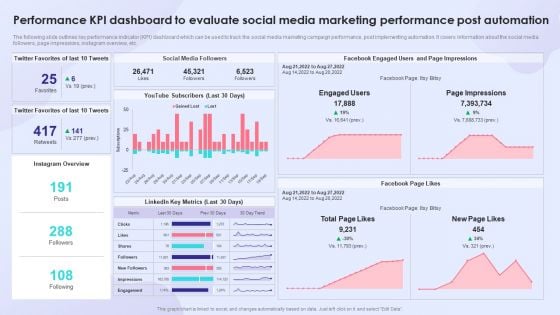
Performance KPI Dashboard To Evaluate Social Media Marketing Performance Post Automation Themes PDF
The following slide outlines key performance indicator KPI dashboard which can be used to track the social media marketing campaign performance, post implementing automation. It covers information about the social media followers, page impressions, instagram overview, etc. Deliver and pitch your topic in the best possible manner with this Performance KPI Dashboard To Evaluate Social Media Marketing Performance Post Automation Themes PDF. Use them to share invaluable insights on Social Media Followers, Linkedin Key Metrics, Performance KPI Dashboard and impress your audience. This template can be altered and modified as per your expectations. So, grab it now.
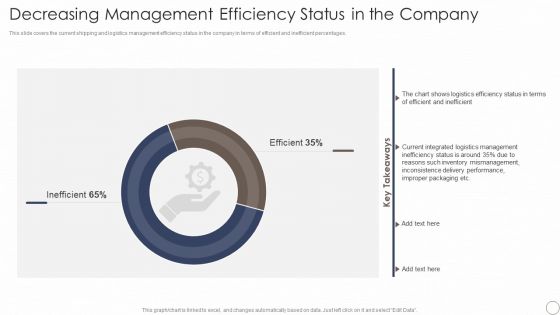
Deploying Automation In Logistics And Supply Chain Decreasing Management Efficiency Status In The Company Themes PDF
This slide covers the current shipping and logistics management efficiency status in the company in terms of efficient and inefficient percentages. Deliver an awe inspiring pitch with this creative Deploying Automation In Logistics And Supply Chain Decreasing Management Efficiency Status In The Company Themes PDF bundle. Topics like Logistics Management, Inventory Mismanagement can be discussed with this completely editable template. It is available for immediate download depending on the needs and requirements of the user.
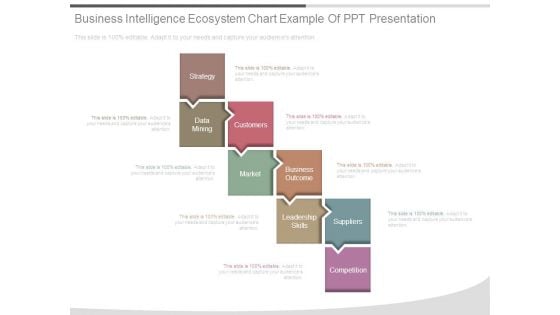
Business Intelligence Ecosystem Chart Example Of Ppt Presentation
This is a business intelligence ecosystem chart example of ppt presentation. This is a eight stage process. The stages in this process are strategy, data mining, customers, market, business outcome, leadership skills, suppliers, competition.
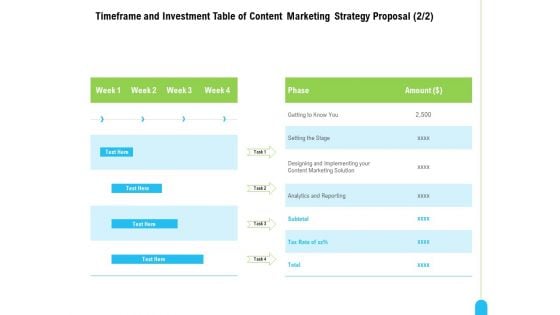
Strategic Marketing Approach Timeframe Investment Table Of Content Marketing Strategy Proposal Phase Summary PDF
Deliver an awe-inspiring pitch with this creative strategic marketing approach timeframe investment table of content marketing strategy proposal phase summary pdf bundle. Topics like designing and implementing your content marketing solution, analytics and reporting can be discussed with this completely editable template. It is available for immediate download depending on the needs and requirements of the user.
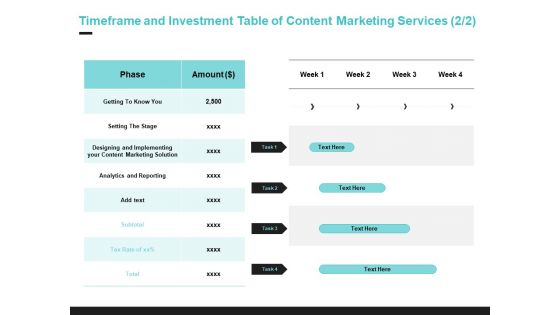
Inbound Marketing Proposal Timeframe And Investment Table Of Content Marketing Services Phase Guidelines PDF
Deliver and pitch your topic in the best possible manner with this inbound marketing proposal timeframe and investment table of content marketing services phase guidelines pdf. Use them to share invaluable insights on analytics, implementing, marketing and impress your audience. This template can be altered and modified as per your expectations. So, grab it now.
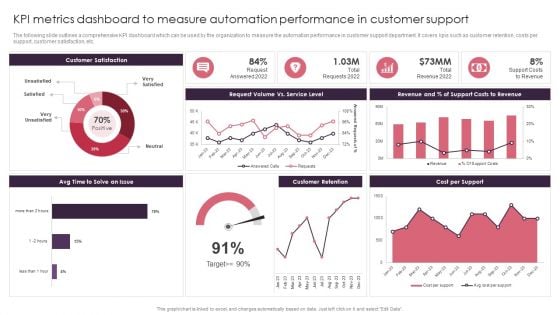
KPI Metrics Dashboard To Measure Automation Performance In Customer Support Themes PDF
The following slide outlines a comprehensive KPI dashboard which can be used by the organization to measure the automation performance in customer support department. It covers kpis such as customer retention, costs per support, customer satisfaction, etc. Present like a pro with KPI Metrics Dashboard To Measure Automation Performance In Customer Support Themes PDF Create beautiful presentations together with your team, using our easy to use presentation slides. Share your ideas in real time and make changes on the fly by downloading our templates. So whether you are in the office, on the go, or in a remote location, you can stay in sync with your team and present your ideas with confidence. With Slidegeeks presentation got a whole lot easier. Grab these presentations today.
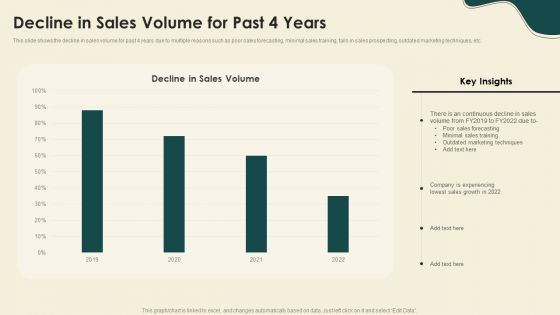
Digitally Streamline Automation Sales Operations Decline In Sales Volume For Past 4 Years Themes PDF
This slide shows the decline in sales volume for past 4 years due to multiple reasons such as poor sales forecasting, minimal sales training, fails in sales prospecting, outdated marketing techniques, etc. Deliver and pitch your topic in the best possible manner with this Digitally Streamline Automation Sales Operations Decline In Sales Volume For Past 4 Years Themes PDF. Use them to share invaluable insights on Outdated Marketing Techniques, Sales Forecasting, Lowest Sales Growth and impress your audience. This template can be altered and modified as per your expectations. So, grab it now.
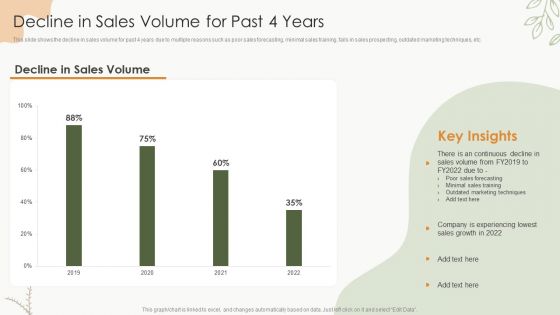
Sales Procedure Automation To Enhance Sales Decline In Sales Volume For Past 4 Years Themes PDF
This slide shows the decline in sales volume for past 4 years due to multiple reasons such as poor sales forecasting, minimal sales training, fails in sales prospecting, outdated marketing techniques, etc.Deliver and pitch your topic in the best possible manner with this Sales Procedure Automation To Enhance Sales Decline In Sales Volume For Past 4 Years Themes PDF. Use them to share invaluable insights on Sales Forecasting, Minimal Sales, Outdated Marketing and impress your audience. This template can be altered and modified as per your expectations. So, grab it now.
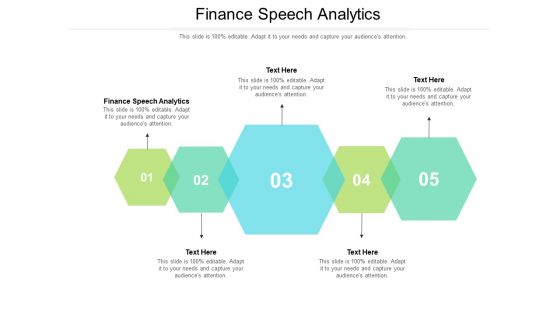
Finance Speech Analytics Ppt PowerPoint Presentation Model Designs Download Cpb Pdf
Presenting this set of slides with name finance speech analytics ppt powerpoint presentation model designs download cpb pdf. This is an editable Powerpoint five stages graphic that deals with topics like finance speech analytics to help convey your message better graphically. This product is a premium product available for immediate download and is 100 percent editable in Powerpoint. Download this now and use it in your presentations to impress your audience.
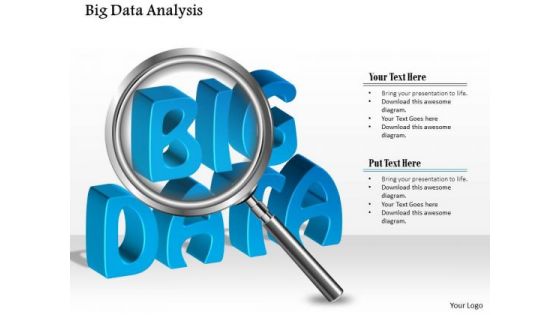
Business Diagram Big Data Analysis Using Magnifying Glass Analysis Ppt Slide
This unique diagram has been designed with graphic of magnifier on blue color text of bag data. This slide depicts concept of big data analysis. This professional diagram can be used for data communication and analysis related topics.
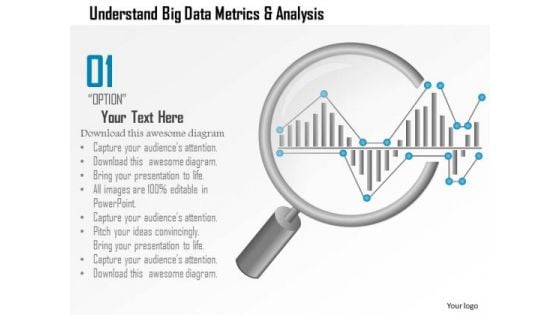
Business Diagram Understand Big Data Metrics And Analysis Showing By Magnifying Glass Ppt Slide
This PPT slide has been designed with big data metrics and magnifying glass. This diagram helps to portray concept of data analysis and data search. Download this diagram to make professional presentations.
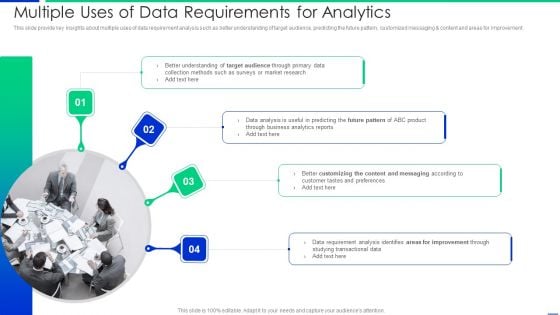
Multiple Uses Of Data Requirements For Analytics Pictures PDF
This slide provide key insights about multiple uses of data requirement analysis such as better understanding of target audience, predicting the future pattern, customized messaging and content and areas for improvement. Presenting multiple uses of data requirements for analytics pictures pdf to dispense important information. This template comprises four stages. It also presents valuable insights into the topics including analysis, customer, requirement. This is a completely customizable PowerPoint theme that can be put to use immediately. So, download it and address the topic impactfully.
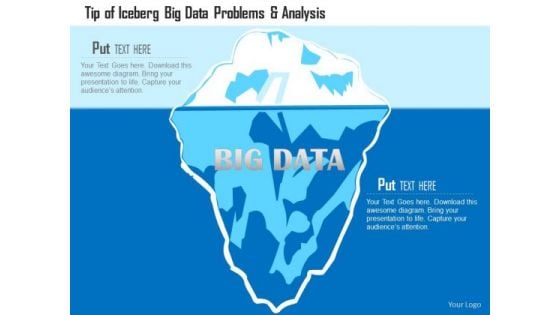
Business Diagram Tip Of Iceberg Big Data Problems And Analysis Ppt Slide
This PowerPoint template has been designed with graphic of iceberg diagram. This diagram slide depicts concept of big data problem and analysis Download this diagram to create professional presentations.
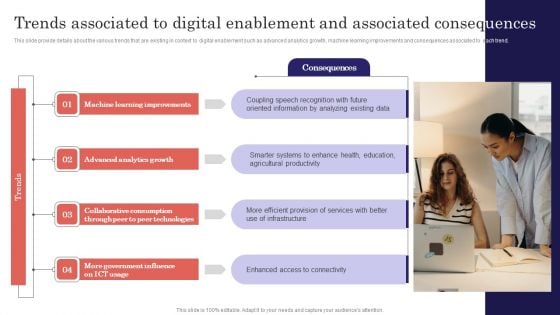
Digitalized Business Checklist Trends Associated To Digital Enablement And Associated Consequences Elements PDF
This slide provide details about the various trends that are existing in context to digital enablement such as advanced analytics growth, machine learning improvements and consequences associated to each trend. Whether you have daily or monthly meetings, a brilliant presentation is necessary. Digitalized Business Checklist Trends Associated To Digital Enablement And Associated Consequences Elements PDF can be your best option for delivering a presentation. Represent everything in detail using Digitalized Business Checklist Trends Associated To Digital Enablement And Associated Consequences Elements PDF and make yourself stand out in meetings. The template is versatile and follows a structure that will cater to your requirements. All the templates prepared by Slidegeeks are easy to download and edit. Our research experts have taken care of the corporate themes as well. So, give it a try and see the results.
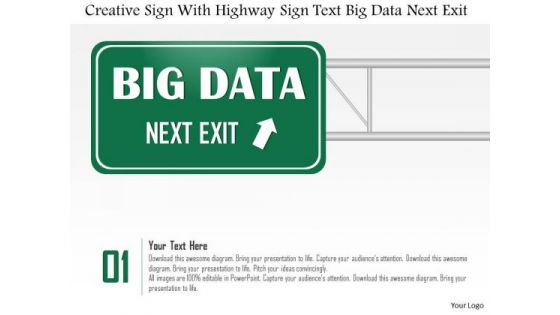
Business Diagram Creative Sign With Highway Sign Text Big Data Next Exit Ppt Slide
This diagram has been designed with graphic of magnifier and text boxes. These boxes are used to display creative sign and highway sign for big data analysis. This diagram can be used for data related topics in any presentation.
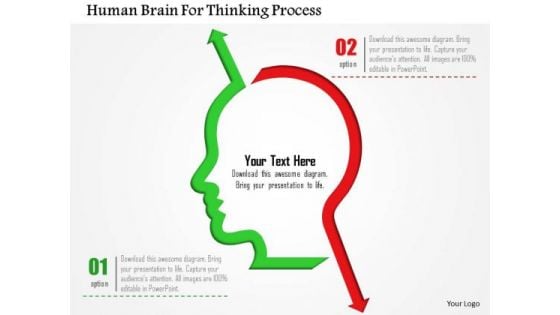
Business Diagram Human Brain For Thinking Process Presentation Template
Thinking process of brain can be defined with this slide. This diagram contains graphics of human mind with two arrows. Use this diagram to build a professional presentation.
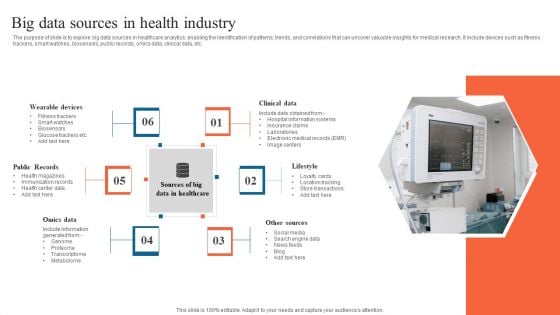
Big Data Sources In Health Industry Professional PDF
The purpose of slide is to explore big data sources in healthcare analytics, enabling the identification of patterns, trends, and correlations that can uncover valuable insights for medical research. It include devices such as fitness trackers, smart watches, biosensors, public records, omics data, clinical data, etc. Presenting Big Data Sources In Health Industry Professional PDF to dispense important information. This template comprises six stages. It also presents valuable insights into the topics including Clinical Data, Lifestyle, Other Sources. This is a completely customizable PowerPoint theme that can be put to use immediately. So, download it and address the topic impactfully.
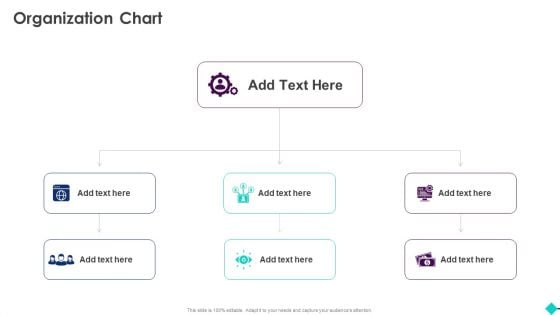
Sales Process Automation For Revenue Growth Organization Chart Rules PDF
Presenting Sales Process Automation For Revenue Growth Organization Chart Rules PDF to provide visual cues and insights. Share and navigate important information on three stages that need your due attention. This template can be used to pitch topics like Organization Chart. In addtion, this PPT design contains high resolution images, graphics, etc, that are easily editable and available for immediate download.
Cloud Analytics Strategy Sample Diagram Powerpoint Guide
This is a cloud analytics strategy sample diagram powerpoint guide. This is a one stage process. The stages in this process are business, marketing, thought, presentation, strategy.
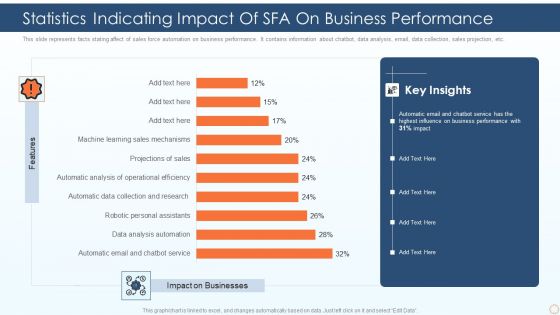
Statistics Indicating Impact Of SFA On Business Performance Ppt PowerPoint Presentation Gallery Outfit PDF
This slide represents facts stating affect of sales force automation on business performance. It contains information about chatbot, data analysis, email, data collection, sales projection, etc. Pitch your topic with ease and precision using this statistics indicating impact of sfa on business performance ppt powerpoint presentation gallery outfit pdf. This layout presents information on automatic email and chatbot service, data analysis automation, robotic personal assistants. It is also available for immediate download and adjustment. So, changes can be made in the color, design, graphics or any other component to create a unique layout.
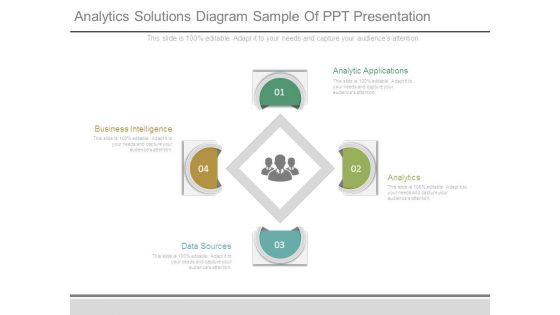
Analytics Solutions Diagram Sample Of Ppt Presentation
This is a analytics solutions diagram sample of ppt presentation. This is a four stage process. The stages in this process are analytic applications, analytics, data sources, business intelligence.
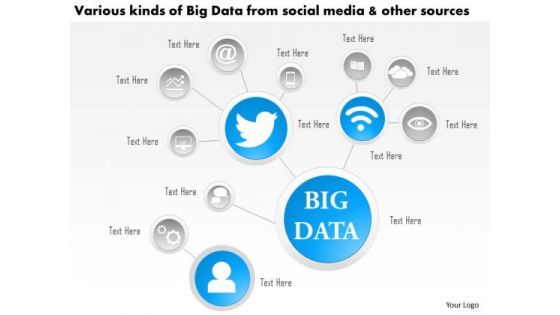
Business Diagram Various Kinds Of Big Data From Social Media And Other Sources Ppt Slide
This technology diagram contains the concept of big data analysis. This slide depicts various kinds of social media and other sources. Use this diagram for mobile and communication related presentations.
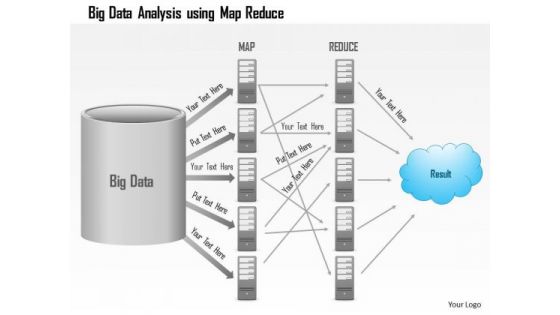
Business Diagram Big Data Analysis Using Map Reduce Batch Processing Ppt Slide
This PowerPoint template has been designed with graphic of server and data transfer network. This slide contains the steps of big data, map, reduce and result. Use this editable diagram for data technology related presentations.
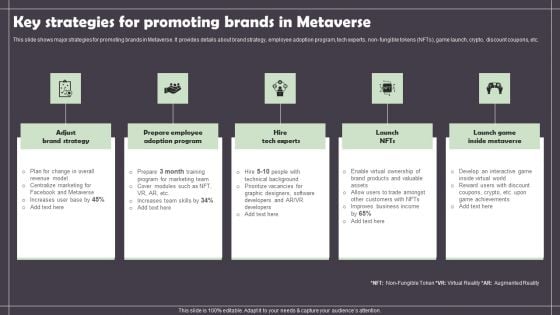
Key Strategies For Promoting Brands In Metaverse Summary PDF
This slide shows major strategies for promoting brands in Metaverse. It provides details about brand strategy, employee adoption program, tech experts, non- fungible tokens NFTs, game launch, crypto, discount coupons, etc. If you are looking for a format to display your unique thoughts, then the professionally designed Key Strategies For Promoting Brands In Metaverse Summary PDF is the one for you. You can use it as a Google Slides template or a PowerPoint template. Incorporate impressive visuals, symbols, images, and other charts. Modify or reorganize the text boxes as you desire. Experiment with shade schemes and font pairings. Alter, share or cooperate with other people on your work. Download Key Strategies For Promoting Brands In Metaverse Summary PDF and find out how to give a successful presentation. Present a perfect display to your team and make your presentation unforgettable.
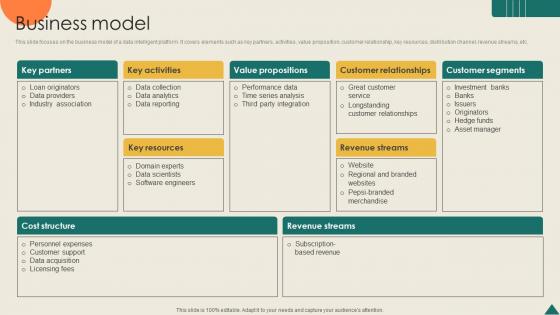
Business Model Financial Analytics Platform Investor Elevator Pitch Deck
This slide focuses on the business model of a data intelligent platform. It covers elements such as key partners, activities, value proposition, customer relationship, key resources, distribution channel, revenue streams, etc. Are you searching for a Business Model Financial Analytics Platform Investor Elevator Pitch Deck that is uncluttered, straightforward, and original Its easy to edit, and you can change the colors to suit your personal or business branding. For a presentation that expresses how much effort you have put in, this template is ideal With all of its features, including tables, diagrams, statistics, and lists, its perfect for a business plan presentation. Make your ideas more appealing with these professional slides. Download Business Model Financial Analytics Platform Investor Elevator Pitch Deck from Slidegeeks today. This slide focuses on the business model of a data intelligent platform. It covers elements such as key partners, activities, value proposition, customer relationship, key resources, distribution channel, revenue streams, etc.
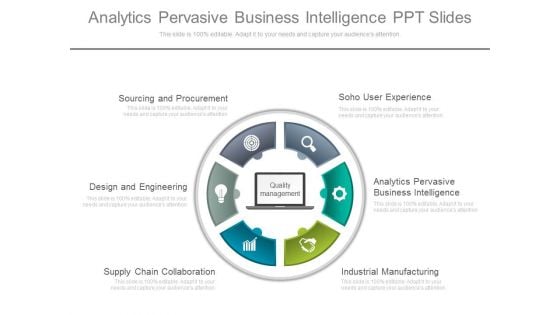
Analytics Pervasive Business Intelligence Ppt Slides
This is a analytics pervasive business intelligence ppt slides. This is a six stage process. The stages in this process are circle charts, business, marketing.
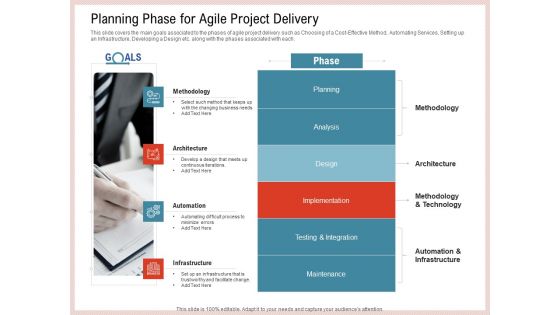
Agile Model Improve Task Team Performance Planning Phase For Agile Project Delivery Introduction PDF
This slide covers the main goals associated to the phases of agile project delivery such as Choosing of a Cost-Effective Method, Automating Services, Setting up an Infrastructure, Developing a Design etc. along with the phases associated with each. This is a agile model improve task team performance planning phase for agile project delivery introduction pdf template with various stages. Focus and dispense information on four stages using this creative set, that comes with editable features. It contains large content boxes to add your information on topics like methodology, architecture, automation, infrastructure. You can also showcase facts, figures, and other relevant content using this PPT layout. Grab it now.
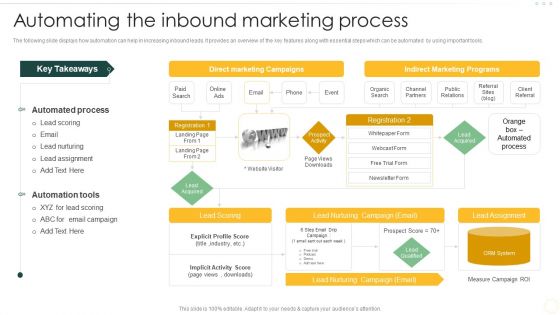
Effective Organizational B2B And B2C Automating The Inbound Marketing Process Themes PDF
The following slide displays how automation can help in increasing inbound leads. It provides an overview of the key features along with essential steps which can be automated by using important tools. If your project calls for a presentation, then Slidegeeks is your go-to partner because we have professionally designed, easy-to-edit templates that are perfect for any presentation. After downloading, you can easily edit Effective Organizational B2B And B2C Automating The Inbound Marketing Process Themes PDF and make the changes accordingly. You can rearrange slides or fill them with different images. Check out all the handy templates.
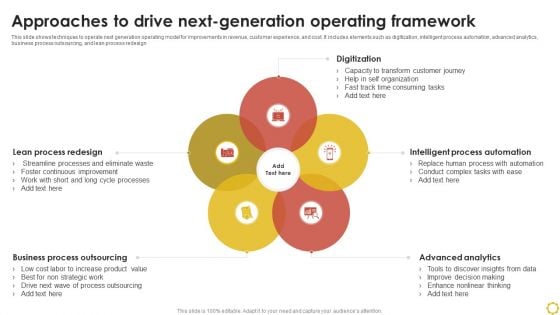
Approaches To Drive Next Generation Operating Framework Ppt Outline Graphics PDF
This slide shows techniques to operate next generation operating model for improvements in revenue, customer experience, and cost. It includes elements such as digitization, intelligent process automation, advanced analytics, business process outsourcing, and lean process redesign. Presenting Approaches To Drive Next Generation Operating Framework Ppt Outline Graphics PDF to dispense important information. This template comprises five stages. It also presents valuable insights into the topics including Lean Process Redesign, Business Process Outsourcing, Advanced Analytics. This is a completely customizable PowerPoint theme that can be put to use immediately. So, download it and address the topic impactfully.
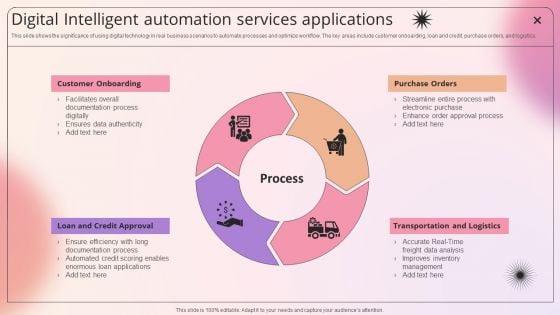
Digital Intelligent Automation Services Applications Elements PDF
This slide shows the significance of using digital technology in real business scenarios to automate processes and optimize workflow. The key areas include customer onboarding, loan and credit, purchase orders, and logistics. Presenting Digital Intelligent Automation Services Applications Elements PDF to dispense important information. This template comprises four stages. It also presents valuable insights into the topics including Transportation And Logistics, Purchase Orders, Customer Onboarding. This is a completely customizable PowerPoint theme that can be put to use immediately. So, download it and address the topic impactfully.
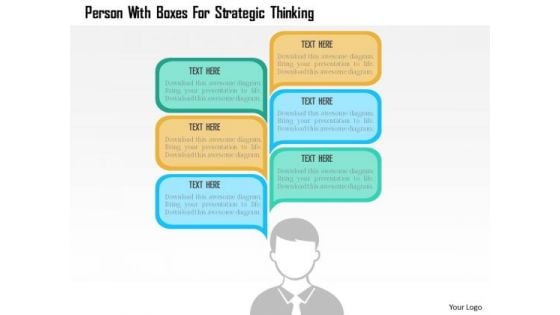
Business Diagram Person With Boxes For Strategic Thinking Presentation Template
This slide contains graphics of a man forming business plans. This slide helps to portray concepts like planning, thinking and business strategies. Sparkling thoughts are swirling around in your head. Filter them through with this diagram slide.
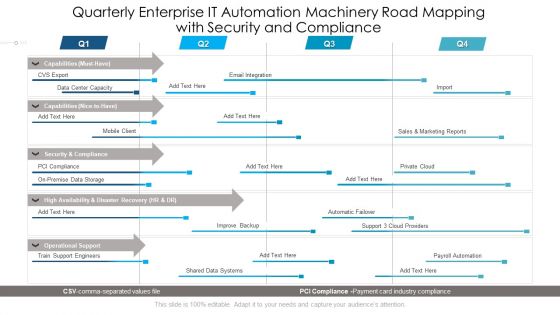
Quarterly Enterprise IT Automation Machinery Road Mapping With Security And Compliance Diagrams
Presenting our innovatively structured quarterly enterprise it automation machinery road mapping with security and compliance diagrams Template. Showcase your roadmap process in different formats like PDF, PNG, and JPG by clicking the download button below. This PPT design is available in both Standard Screen and Widescreen aspect ratios. It can also be easily personalized and presented with modified font size, font type, color, and shapes to measure your progress in a clear way.
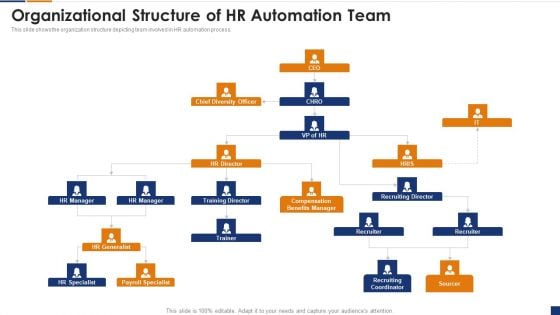
Human Resource Digital Transformation Organizational Structure Of HR Automation Team Themes PDF
This slide shows the organization structure depicting team involved in HR automation process. This is a Human Resource Digital Transformation Organizational Structure Of HR Automation Team Themes PDF template with various stages. Focus and dispense information on seven stages using this creative set, that comes with editable features. It contains large content boxes to add your information on topics like Chief Diversity Officer, HR Director, Training Director. You can also showcase facts, figures, and other relevant content using this PPT layout. Grab it now.
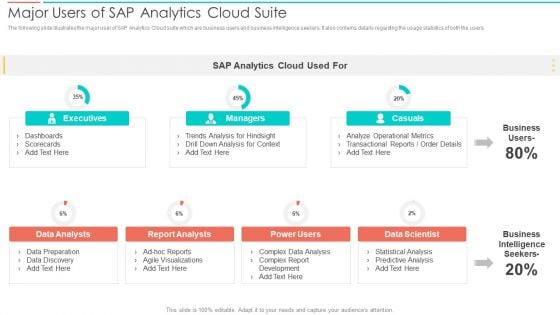
SAC Planning And Implementation Major Users Of SAP Analytics Cloud Suite Diagrams PDF
The following slide illustrates the major user of SAP Analytics Cloud suite which are business users and business intelligence seekers. It also contains details regarding the usage statistics of both the users. Deliver an awe inspiring pitch with this creative SAC Planning And Implementation Major Users Of SAP Analytics Cloud Suite Diagrams PDF bundle. Topics like Executives, Casuals, Business Intelligence Seekers, Data Scientist can be discussed with this completely editable template. It is available for immediate download depending on the needs and requirements of the user.
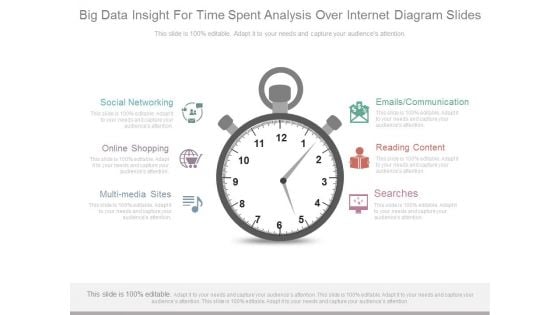
Big Data Insight For Time Spent Analysis Over Internet Diagram Slides
This is a big data insight for time spent analysis over internet diagram slides. This is a one stage process. The stages in this process are social networking, online shopping, multimedia sites, searches, reading content, emails communication.
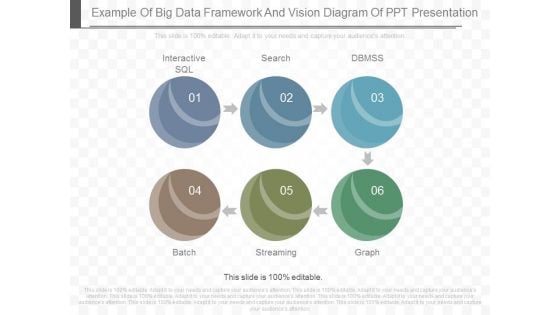
Example Of Big Data Framework And Vision Diagram Of Ppt Presentation
This is a example of big data framework and vision diagram of ppt presentation. This is a six stage process. The stages in this process are interactive sql, search, dbmss, batch, streaming, graph.
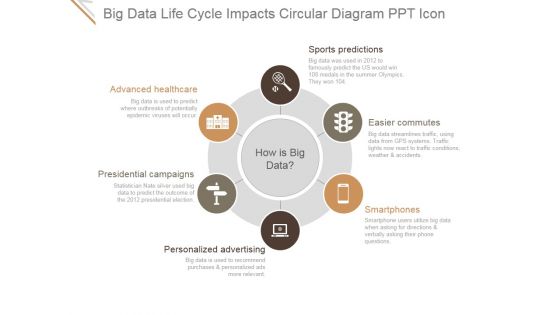
Big Data Life Cycle Impacts Circular Diagram Ppt PowerPoint Presentation Introduction
This is a big data life cycle impacts circular diagram ppt powerpoint presentation introduction. This is a six stage process. The stages in this process are sports predictions, easier commutes, smartphones, personalized advertising, presidential campaigns, advanced healthcare.
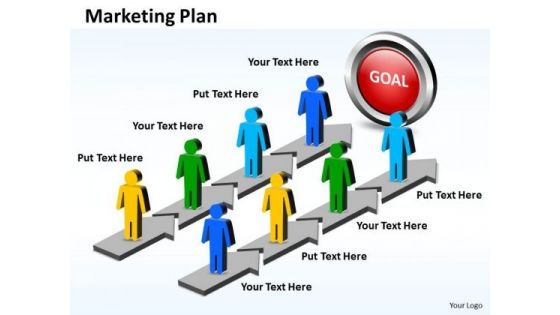
Ppt Power Point Stage For Marketing Plan Operations Management PowerPoint Business Templates
PPT power point stage for marketing plan operations management powerpoint Business Templates-This PowerPoint diagram is a simple diagram that provides a graphical overview of a continuing sequence of stages, tasks, actions, or events in a parallel way. This PowerPoint diagram can be used for business process automation and other business related issues.-PPT power point stage for marketing plan operations management powerpoint Business Templates Our Ppt Power Point Stage For Marketing Plan Operations Management PowerPoint Business Templates are like a deep breath. They ensure your ideas endure.
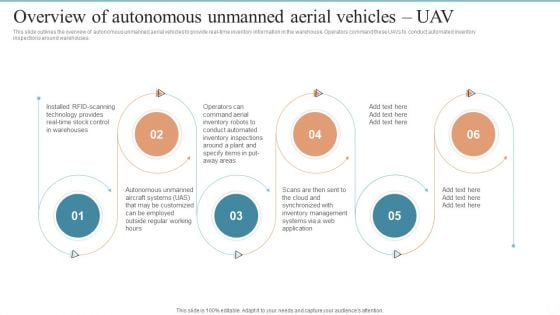
AMR Robot Overview Of Autonomous Unmanned Aerial Vehicles UAV Ppt PowerPoint Presentation Diagram Images PDF
This slide outlines the overview of autonomous unmanned aerial vehicles to provide real-time inventory information in the warehouse. Operators command these UAVs to conduct automated inventory inspections around warehouses. Do you have to make sure that everyone on your team knows about any specific topic I yes, then you should give AMR Robot Overview Of Autonomous Unmanned Aerial Vehicles UAV Ppt PowerPoint Presentation Diagram Images PDF a try. Our experts have put a lot of knowledge and effort into creating this impeccable AMR Robot Overview Of Autonomous Unmanned Aerial Vehicles UAV Ppt PowerPoint Presentation Diagram Images PDF. You can use this template for your upcoming presentations, as the slides are perfect to represent even the tiniest detail. You can download these templates from the Slidegeeks website and these are easy to edit. So grab these today.
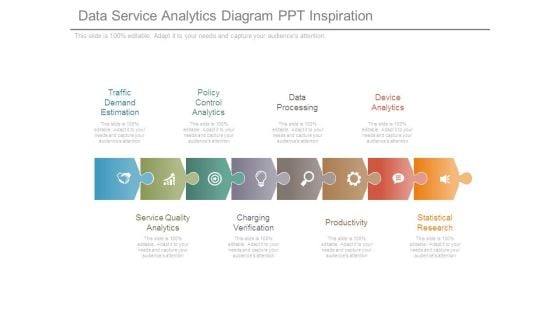
Data Service Analytics Diagram Ppt Inspiration
This is a data service analytics diagram ppt inspiration. This is a eight stage process. The stages in this process are traffic demand estimation, policy control analytics, data processing, device analytics, service quality analytics, charging verification, productivity, statistical research.
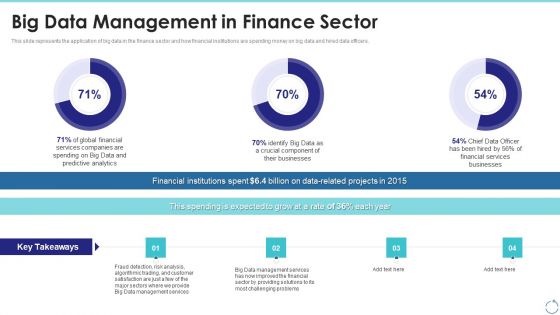
Big Data Management In Finance Sector Ppt Professional Graphics Pictures PDF
This slide represents the application of big data in the finance sector and how financial institutions are spending money on big data and hired data officers. Deliver an awe inspiring pitch with this creative big data management in finance sector ppt professional graphics pictures pdf bundle. Topics like global financial, services, big data, management can be discussed with this completely editable template. It is available for immediate download depending on the needs and requirements of the user.
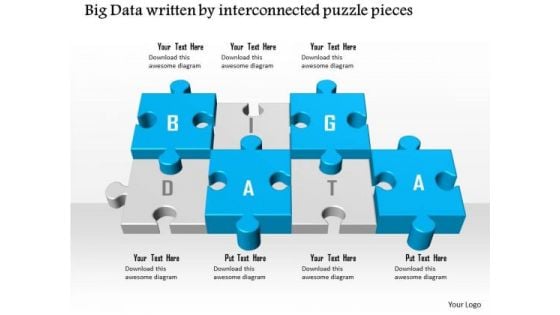
Business Diagram Big Data Written By Interconnected Puzzle Pieces Ppt Slide
Graphic of interconnected puzzles pieces with big data text are used to design this technology diagram. This diagram helps to depict the concept of data solution and strategy. Display your own analysis in any presentation by using this innovative template and build quality presentation for your viewers.
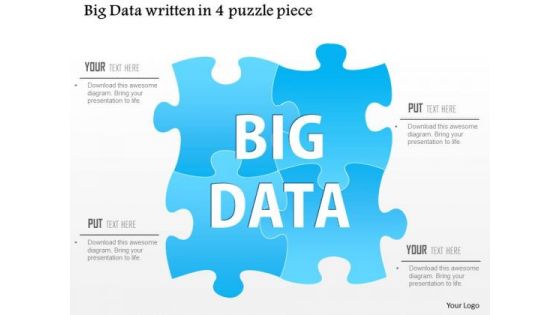
Business Diagram Big Data Written In A 4 Puzzle Piece Ppt Slide
Graphic of interconnected puzzles pieces with big data text are used to design this technology diagram. This diagram helps to depict the concept of data solution and strategy. Display your own analysis in any presentation by using this innovative template and build quality presentation for your viewers.
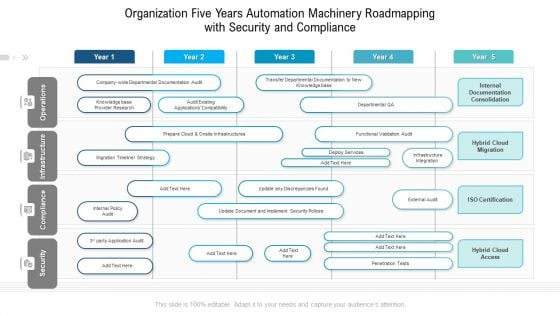
Organization Five Years Automation Machinery Roadmapping With Security And Compliance Diagrams
Presenting the organization five years automation machinery roadmapping with security and compliance diagrams. The template includes a roadmap that can be used to initiate a strategic plan. Not only this, the PowerPoint slideshow is completely editable and you can effortlessly modify the font size, font type, and shapes according to your needs. This PPT slide can be easily reached in standard screen and widescreen aspect ratios. The set is also available in various formats like PDF, PNG, and JPG. So download and use it multiple times as per your knowledge.
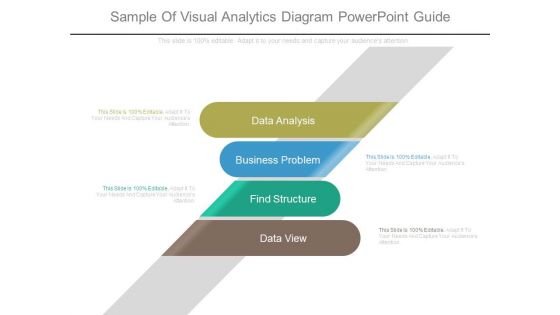
Sample Of Visual Analytics Diagram Powerpoint Guide
This is a sample of visual analytics diagram powerpoint guide. This is a four stage process. The stages in this process are data analysis, business problem, find structure, data view.
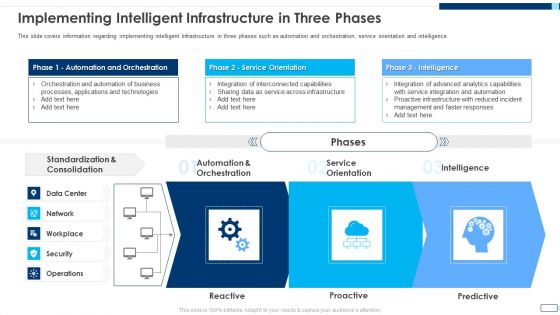
Evolving BI Infrastructure Implementing Intelligent Infrastructure In Three Phases Guidelines PDF
This slide covers information regarding implementing intelligent Infrastructure in three phases such as automation and orchestration, service orientation and intelligence. Presenting evolving bi infrastructure implementing intelligent infrastructure in three phases guidelines pdf to provide visual cues and insights. Share and navigate important information on three stages that need your due attention. This template can be used to pitch topics like automation and orchestration, service orientation, intelligence. In addtion, this PPT design contains high resolution images, graphics, etc, that are easily editable and available for immediate download.
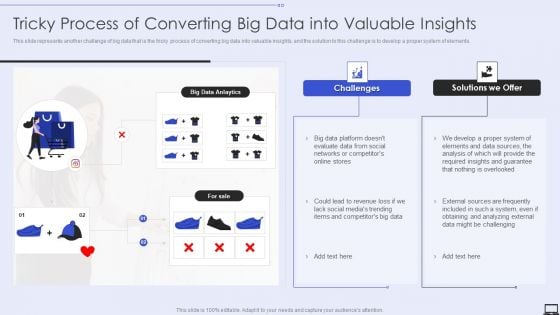
Tricky Process Of Converting Big Data Into Valuable Insights Ppt PowerPoint Presentation File Diagrams PDF
Deliver an awe inspiring pitch with this creative Tricky Process Of Converting Big Data Into Valuable Insights Ppt PowerPoint Presentation File Diagrams PDF bundle. Topics like Social Networks, Evaluate Data, Data Sources can be discussed with this completely editable template. It is available for immediate download depending on the needs and requirements of the user.
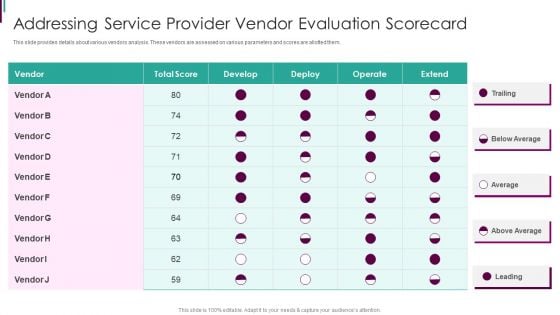
Developing Business Analytics Framework Addressing Service Provider Vendor Themes PDF
This slide provides details about various vendors analysis. These vendors are assessed on various parameters and scores are allotted them. Deliver an awe inspiring pitch with this creative Developing Business Analytics Framework Addressing Service Provider Vendor Themes PDF bundle. Topics like Addressing Service, Provider Vendor, Evaluation Scorecard can be discussed with this completely editable template. It is available for immediate download depending on the needs and requirements of the user.
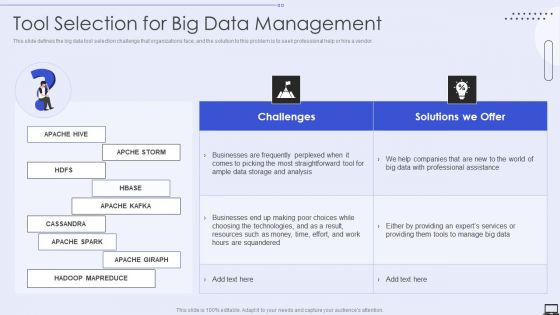
Tool Selection For Big Data Management Ppt PowerPoint Presentation Diagram Images PDF
This slide defines the big data tool selection challenge that organizations face, and the solution to this problem is to seek professional help or hire a vendor. Deliver and pitch your topic in the best possible manner with this Tool Selection For Big Data Management Ppt PowerPoint Presentation Diagram Images PDF. Use them to share invaluable insights on Analysis, Technologies, Resources and impress your audience. This template can be altered and modified as per your expectations. So, grab it now.
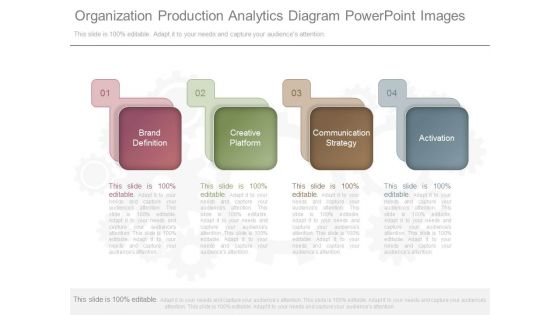
Organization Production Analytics Diagram Powerpoint Images
This is a organization production analytics diagram powerpoint images. This is a four stage process. The stages in this process are brand definition, creative platform, communication strategy, activation.
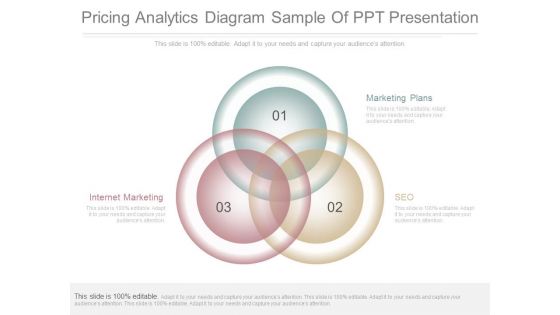
Pricing Analytics Diagram Sample Of Ppt Presentation
This is a pricing analytics diagram sample of ppt presentation. This is a three stage process. The stages in this process are internet marketing, marketing plans, seo.
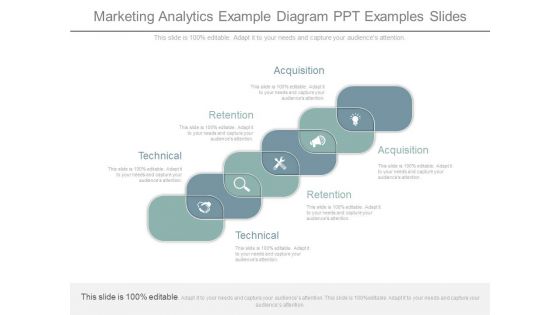
Marketing Analytics Example Diagram Ppt Examples Slides
This is a marketing analytics example diagram ppt examples slides. This is a six stage process. The stages in this process are acquisition, retention, technical.

Trade Promotion Analytics Diagram Powerpoint Layout
This is a trade promotion analytics diagram powerpoint layout. This is a six stage process. The stages in this process are plan, regression, perform, evaluate, settlement, optimization.
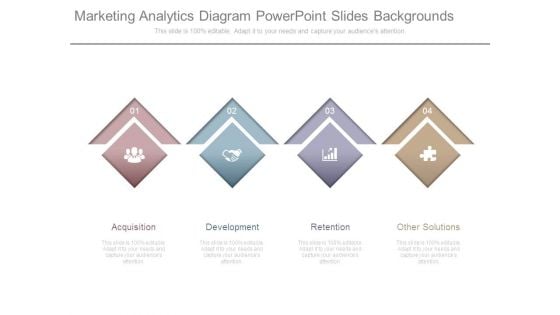
Marketing Analytics Diagram Powerpoint Slides Backgrounds
This is a marketing analytics diagram powerpoint slides backgrounds. This is a four stage process. The stages in this process are acquisition, development, retention, other solutions.
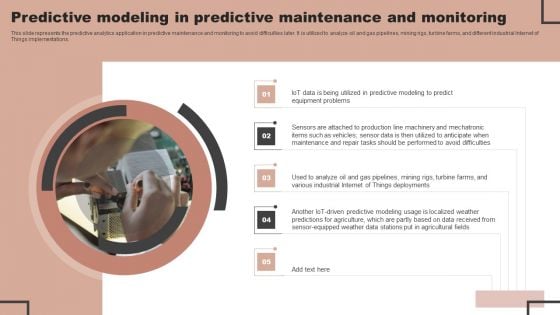
Forecast Analysis Technique IT Predictive Modeling In Predictive Maintenance And Monitoring Formats PDF
This slide represents the predictive analytics application in predictive maintenance and monitoring to avoid difficulties later. It is utilized to analyze oil and gas pipelines, mining rigs, turbine farms, and different industrial Internet of Things implementations. If you are looking for a format to display your unique thoughts, then the professionally designed Forecast Analysis Technique IT Predictive Modeling In Predictive Maintenance And Monitoring Formats PDF is the one for you. You can use it as a Google Slides template or a PowerPoint template. Incorporate impressive visuals, symbols, images, and other charts. Modify or reorganize the text boxes as you desire. Experiment with shade schemes and font pairings. Alter, share or cooperate with other people on your work. Download Forecast Analysis Technique IT Predictive Modeling In Predictive Maintenance And Monitoring Formats PDF and find out how to give a successful presentation. Present a perfect display to your team and make your presentation unforgettable.
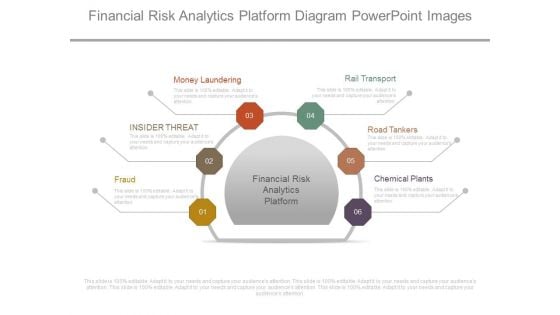
Financial Risk Analytics Platform Diagram Powerpoint Images
This is a financial risk analytics platform diagram powerpoint images. This is a six stage process. The stages in this process are money laundering, insider threat, fraud, rail transport, road tankers, chemical plants, financial risk analytics platform.
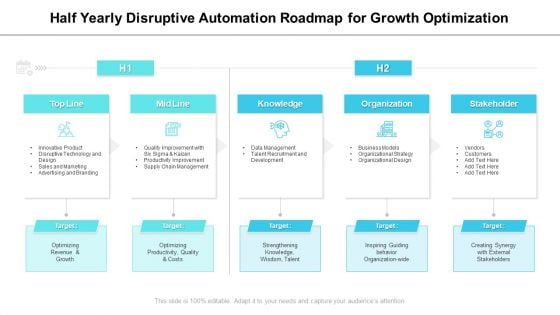
Half Yearly Disruptive Automation Roadmap For Growth Optimization Diagrams
We present our half yearly disruptive automation roadmap for growth optimization diagrams. This PowerPoint layout is easy to edit so you can change the font size, font type, color, and shape conveniently. In addition to this, the PowerPoint layout is Google Slides compatible, so you can share it with your audience and give them access to edit it. Therefore, download and save this well researched half yearly disruptive automation roadmap for growth optimization diagrams in different formats like PDF, PNG, and JPG to smoothly execute your business plan.
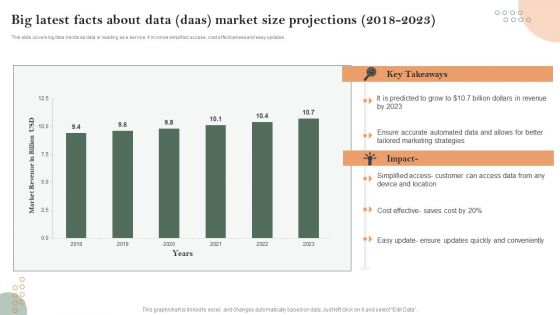
Big Latest Facts About Data Daas Market Size Projections 2018 2023 Portrait PDF
This slide covers big data trends as data is heading as a service. It involves simplified access, cost effectiveness and easy updates. Showcasing this set of slides titled Big Latest Facts About Data Daas Market Size Projections 2018 2023 Portrait PDF. The topics addressed in these templates are Big Latest Facts, About Data, Market Size Projections. All the content presented in this PPT design is completely editable. Download it and make adjustments in color, background, font etc. as per your unique business setting.
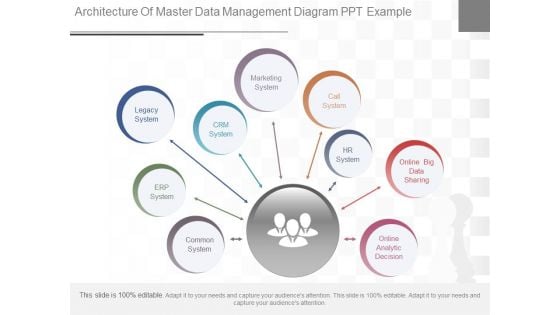
Architecture Of Master Data Management Diagram Ppt Example
This is a architecture of master data management diagram ppt example. This is a nine stage process. The stages in this process are common system, erp system, legacy system, crm system, marketing system, call system, hr system, online big data sharing, online analytic decision.
Business Diagram Big Data Written In Brain Made Of Pcb Board Ppt Slide
To define the concept of human intelligence and data technology we have designed an exclusive diagram. This slide contains the graphic of human brain and text of big data with PCB board graphics. Use this slide to build an innovative presentation for your viewers.
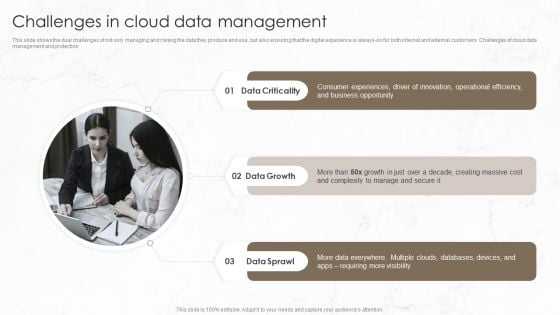
Challenges In Cloud Data Management Diagrams PDF
This slide shows the dual challenges of not only managing and mining the data they produce and use, but also ensuring that the digital experience is always on for both internal and external customers. Challenges of cloud data management and protection.Presenting Challenges In Cloud Data Management Diagrams PDF to provide visual cues and insights. Share and navigate important information on three stages that need your due attention. This template can be used to pitch topics like Data Criticality, Data Growth, Data Sprawl. In addtion, this PPT design contains high resolution images, graphics, etc, that are easily editable and available for immediate download.

Business Analyst Diagrams Man Suffering From Disaster PowerPoint Theme Slides
We present our business analyst diagrams man suffering from disaster powerpoint theme Slides.Present our Security PowerPoint Templates because you should once Tap the ingenuity of our PowerPoint Templates and Slides. They are programmed to succeed. Use our Symbol PowerPoint Templates because Our PowerPoint Templates and Slides have the Brilliant backdrops. Guaranteed to illuminate the minds of your audience. Present our Business PowerPoint Templates because It will Give impetus to the hopes of your colleagues. Our PowerPoint Templates and Slides will aid you in winning their trust. Download our Shapes PowerPoint Templates because Our PowerPoint Templates and Slides are Clear and concise. Use them and dispel any doubts your team may have. Download our People PowerPoint Templates because you should Whip up a frenzy with our PowerPoint Templates and Slides. They will fuel the excitement of your team.Use these PowerPoint slides for presentations relating to Accident, Activity, Assistance, Background, Belt, Buoy, Business, Businessman, Care, Circle, Concept, Crash, Danger, Despair, Disaster, Emergency, Emotional, Equipment, Hand, Help, Hopelessness, Human, Illustration, Insurance, Isolated, Life, Lifebuoy, Life Preserver, Loss, Lost, People, Person, Protection, Rescue, Ring, Risk, Rubber, Safe, Safety, Salvage, Security, Shipwreck, Single, Stress, Survival, Symbol, Warning, White. The prominent colors used in the PowerPoint template are Red, Gray, White. PowerPoint presentation experts tell us our business analyst diagrams man suffering from disaster powerpoint theme Slides are designed by a team of presentation professionals. Use our Assistance PowerPoint templates and PPT Slides provide you with a vast range of viable options. Select the appropriate ones and just fill in your text. You can be sure our business analyst diagrams man suffering from disaster powerpoint theme Slides will help them to explain complicated concepts. Presenters tell us our Care PowerPoint templates and PPT Slides provide you with a vast range of viable options. Select the appropriate ones and just fill in your text. You can be sure our business analyst diagrams man suffering from disaster powerpoint theme Slides have awesome images to get your point across. Professionals tell us our Belt PowerPoint templates and PPT Slides will generate and maintain the level of interest you desire. They will create the impression you want to imprint on your audience. Assist the fallen with our Business Analyst Diagrams Man Suffering From Disaster PowerPoint Theme Slides. Give them hope to rise again.
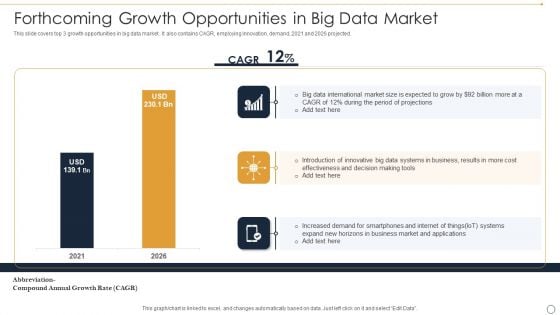
Forthcoming Growth Opportunities In Big Data Market Ppt Inspiration Brochure PDF
This slide covers top 3 growth opportunities in big data market . It also contains CAGR, employing innovation, demand, 2021 and 2026 projected. Showcasing this set of slides titled Forthcoming Growth Opportunities In Big Data Market Ppt Inspiration Brochure PDF. The topics addressed in these templates are Big Data International, Market Size, Period Projections. All the content presented in this PPT design is completely editable. Download it and make adjustments in color, background, font etc. as per your unique business setting.
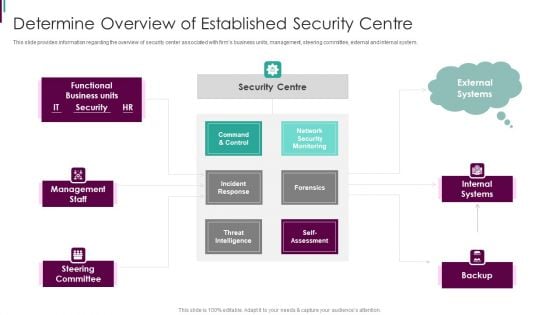
Developing Business Analytics Framework Determine Overview Of Established Themes PDF
This slide provides information regarding the overview of security center associated with firms business units, management, steering committee, external and internal system. This is a Developing Business Analytics Framework Determine Overview Of Established Themes PDF template with various stages. Focus and dispense information on three stages using this creative set, that comes with editable features. It contains large content boxes to add your information on topics like Command And Control, Incident Response, Threat Intelligence You can also showcase facts, figures, and other relevant content using this PPT layout. Grab it now.
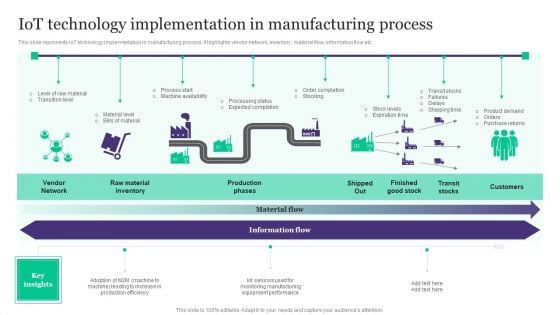
Deployment Of Automated Production Technology Iot Technology Implementation In Manufacturing Process Brochure PDF
This slide represents IoT technology implementation in manufacturing process. It highlights vendor network, inventory, material flow, information flow etc.If you are looking for a format to display your unique thoughts, then the professionally designed Deployment Of Automated Production Technology Iot Technology Implementation In Manufacturing Process Brochure PDF is the one for you. You can use it as a Google Slides template or a PowerPoint template. Incorporate impressive visuals, symbols, images, and other charts. Modify or reorganize the text boxes as you desire. Experiment with shade schemes and font pairings. Alter, share or cooperate with other people on your work. Download Deployment Of Automated Production Technology Iot Technology Implementation In Manufacturing Process Brochure PDF and find out how to give a successful presentation. Present a perfect display to your team and make your presentation unforgettable.
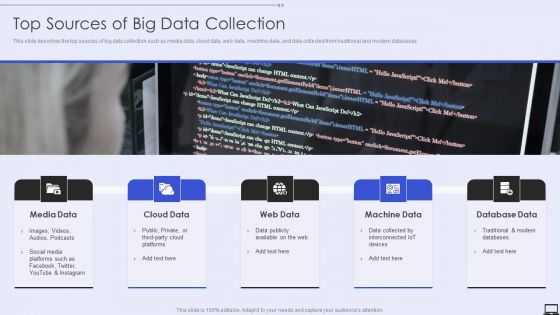
Top Sources Of Big Data Collection Ppt PowerPoint Presentation Diagram Lists PDF
This is a Top Sources Of Big Data Collection Ppt PowerPoint Presentation Diagram Lists PDF template with various stages. Focus and dispense information on five stages using this creative set, that comes with editable features. It contains large content boxes to add your information on topics like Web Data, Machine Data, Database Data. You can also showcase facts, figures, and other relevant content using this PPT layout. Grab it now.

PowerPoint Graphics Business Colorful Slide Of Five Text Circles Slides
We present our powerpoint graphics business colorful slide of five text circles Slides.Use our Ring Charts PowerPoint Templates because Our PowerPoint Templates and Slides will let you meet your Deadlines. Use our Circle Charts PowerPoint Templates because Our PowerPoint Templates and Slides will let you Clearly mark the path for others to follow. Use our Process and Flows PowerPoint Templates because It can Conjure up grand ideas with our magical PowerPoint Templates and Slides. Leave everyone awestruck by the end of your presentation. Download our Shapes PowerPoint Templates because Our PowerPoint Templates and Slides will let you Hit the target. Go the full distance with ease and elan. Present our Business PowerPoint Templates because Our PowerPoint Templates and Slides will effectively help you save your valuable time. They are readymade to fit into any presentation structure. Use these PowerPoint slides for presentations relating to Boxes, brochure, business, button, catalog, chart, circle, company, cross, data, design, diagram, direction, document, financial, four, glossy, goals, graph, junction, management, market, marketing, model, multicolored, multiple, navigation, network, options, plan, presentation, process, purple, results, shiny, sphere, statistics. The prominent colors used in the PowerPoint template are Red, White, Black. Professionals tell us our powerpoint graphics business colorful slide of five text circles Slides look good visually. Presenters tell us our catalog PowerPoint templates and PPT Slides are topically designed to provide an attractive backdrop to any subject. The feedback we get is that our powerpoint graphics business colorful slide of five text circles Slides look good visually. Use our company PowerPoint templates and PPT Slides are readymade to fit into any presentation structure. You can be sure our powerpoint graphics business colorful slide of five text circles Slides are specially created by a professional team with vast experience. They diligently strive to come up with the right vehicle for your brilliant Ideas. Customers tell us our company PowerPoint templates and PPT Slides will generate and maintain the level of interest you desire. They will create the impression you want to imprint on your audience. Demonstrate ability with our PowerPoint Graphics Business Colorful Slide Of Five Text Circles Slides. Download without worries with our money back guaranteee.
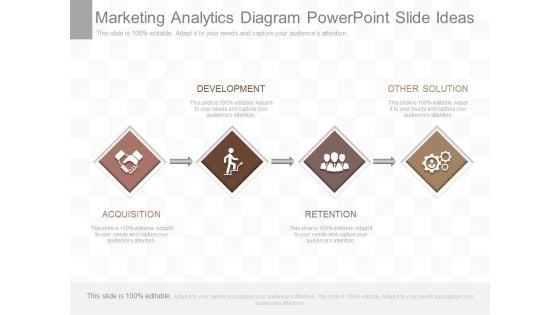
Marketing Analytics Diagram Powerpoint Slide Ideas
This is a marketing analytics diagram powerpoint slide ideas. This is a four stage process. The stages in this process are development, other solution, acquisition, retention.
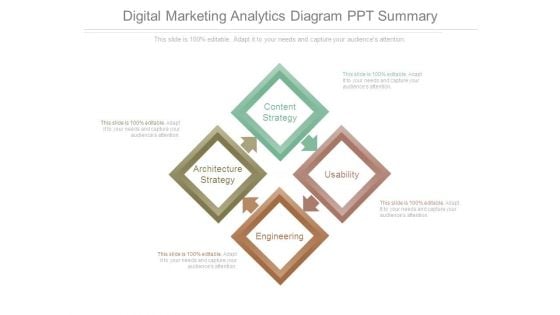
Digital Marketing Analytics Diagram Ppt Summary
This is a digital marketing analytics diagram ppt summary. This is a four stage process. The stages in this process are content strategy, usability, engineering, architecture, strategy.
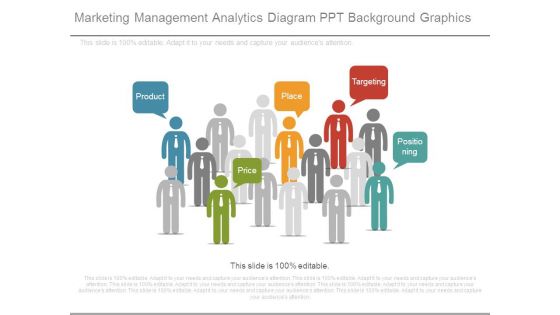
Marketing Management Analytics Diagram Ppt Background Graphics
This is a marketing management analytics diagram ppt background graphics. This is a five stage process. The stages in this process are product, price, place, targeting, positioning.
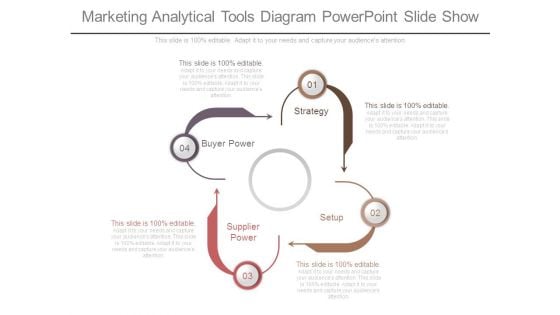
Marketing Analytical Tools Diagram Powerpoint Slide Show
This is a marketing analytical tools diagram powerpoint slide show. This is a four stage process. The stages in this process are buyer power, strategy, supplier power, setup.
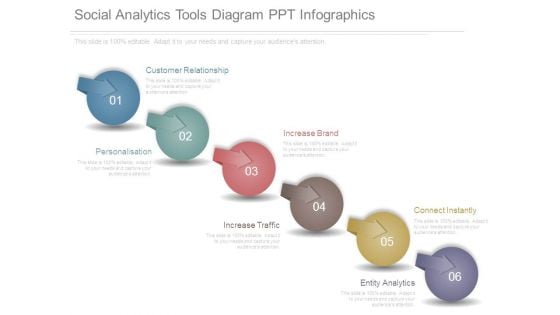
Social Analytics Tools Diagram Ppt Infographics
This is a social analytics tools diagram ppt infographics. This is a six stage process. The stages in this process are customer relationship, personalisation, increase brand, increase traffic, connect instantly, entity analytics.
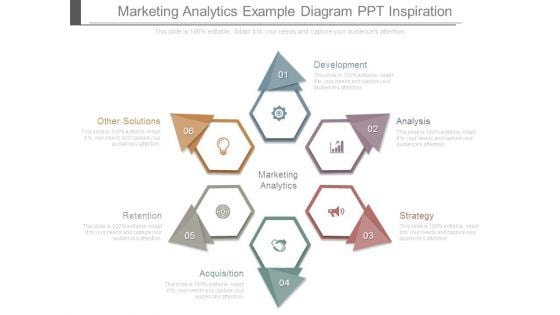
Marketing Analytics Example Diagram Ppt Inspiration
This is a marketing analytics example diagram ppt inspiration. This is a six stage process. The stages in this process are marketing analytics, development, analysis, strategy, acquisition, retention, other solutions.
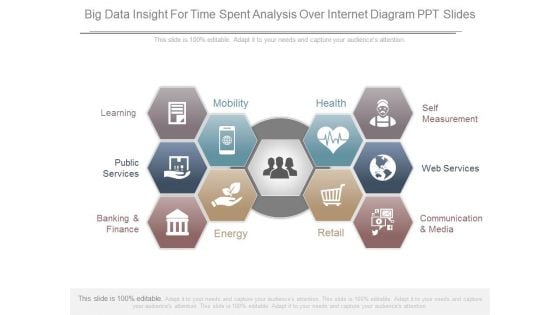
Big Data Insight For Time Spent Analysis Over Internet Diagram Ppt Slides
This is a big data insight for time spent analysis over internet diagram ppt slides. This is a ten stage process. The stages in this process are learning, public services, banking and finance, energy, mobility, health, retail, communication and media, web services, self measurement.
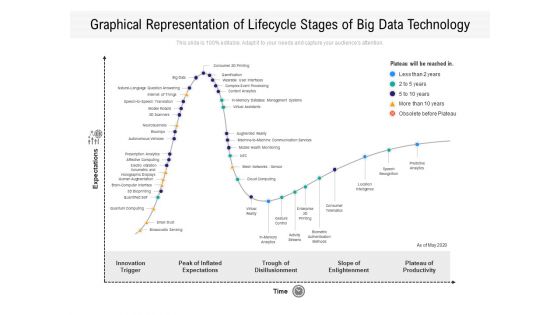
Graphical Representation Of Lifecycle Stages Of Big Data Technology Ppt PowerPoint Presentation Gallery Diagrams PDF
Presenting this set of slides with name graphical representation of lifecycle stages of big data technology ppt powerpoint presentation gallery diagrams pdf. This is a five stage process. The stages in this process are innovation, services, management. This is a completely editable PowerPoint presentation and is available for immediate download. Download now and impress your audience.
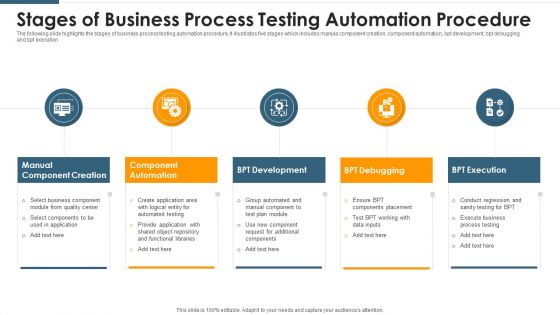
Stages Of Business Process Testing Automation Procedure Sample PDF
The following slide highlights the stages of business process testing automation procedure. It illustrates five stages which includes manula component creation, component automation, bpt development, bpt debugging and bpt execution. Presenting Stages Of Business Process Testing Automation Procedure Sample PDF to dispense important information. This template comprises five stages. It also presents valuable insights into the topics including Quality, Application, Development. This is a completely customizable PowerPoint theme that can be put to use immediately. So, download it and address the topic impactfully.
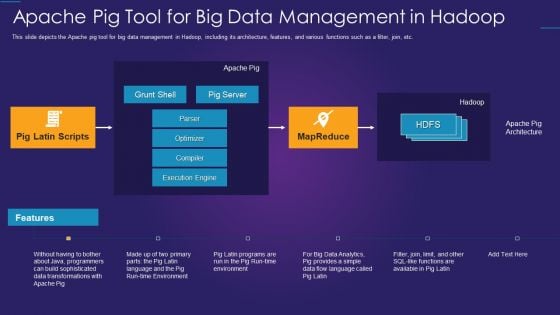
Apache Hadoop IT Apache Pig Tool For Big Data Management In Hadoop Diagrams PDF
This slide depicts the Apache pig tool for big data management in Hadoop, including its architecture, features, and various functions such as a filter, join, etc.Deliver and pitch your topic in the best possible manner with this apache hadoop it apache pig tool for big data management in hadoop diagrams pdf Use them to share invaluable insights on execution engine, programmers can build, data transformations and impress your audience. This template can be altered and modified as per your expectations. So, grab it now.
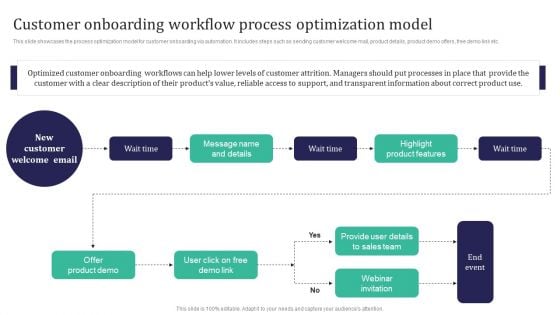
Integration Automation Customer Onboarding Workflow Process Optimization Model Diagrams PDF
This slide showcases the process optimization model for customer onboarding via automation. It includes steps such as sending customer welcome mail, product details, product demo offers, free demo link etc. Present like a pro with Integration Automation Customer Onboarding Workflow Process Optimization Model Diagrams PDF Create beautiful presentations together with your team, using our easy-to-use presentation slides. Share your ideas in real-time and make changes on the fly by downloading our templates. So whether youre in the office, on the go, or in a remote location, you can stay in sync with your team and present your ideas with confidence. With Slidegeeks presentation got a whole lot easier. Grab these presentations today.
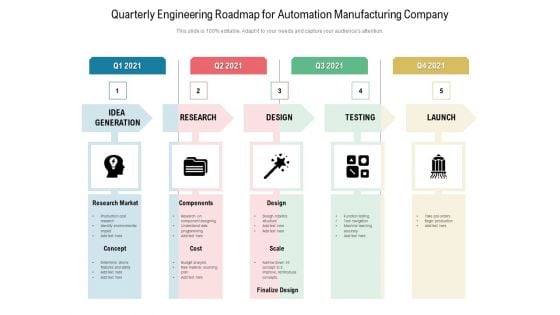
Quarterly Engineering Roadmap For Automation Manufacturing Company Diagrams
Presenting our jaw dropping quarterly engineering roadmap for automation manufacturing company diagrams. You can alternate the color, font size, font type, and shapes of this PPT layout according to your strategic process. This PPT presentation is compatible with Google Slides and is available in both standard screen and widescreen aspect ratios. You can also download this well researched PowerPoint template design in different formats like PDF, JPG, and PNG. So utilize this visually appealing design by clicking the download button given below.
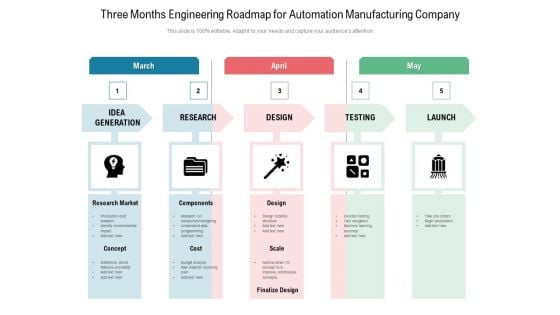
Three Months Engineering Roadmap For Automation Manufacturing Company Diagrams
Introducing our three months engineering roadmap for automation manufacturing company diagrams. This PPT presentation is Google Slides compatible, therefore, you can share it easily with the collaborators for measuring the progress. Also, the presentation is available in both standard screen and widescreen aspect ratios. So edit the template design by modifying the font size, font type, color, and shapes as per your requirements. As this PPT design is fully editable it can be presented in PDF, JPG and PNG formats.
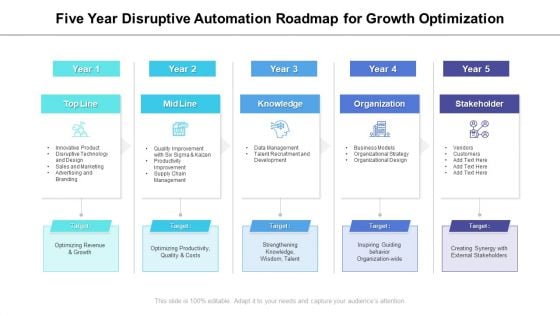
Five Year Disruptive Automation Roadmap For Growth Optimization Diagrams
Presenting our innovatively structured five year disruptive automation roadmap for growth optimization diagrams Template. Showcase your roadmap process in different formats like PDF, PNG, and JPG by clicking the download button below. This PPT design is available in both Standard Screen and Widescreen aspect ratios. It can also be easily personalized and presented with modified font size, font type, color, and shapes to measure your progress in a clear way.
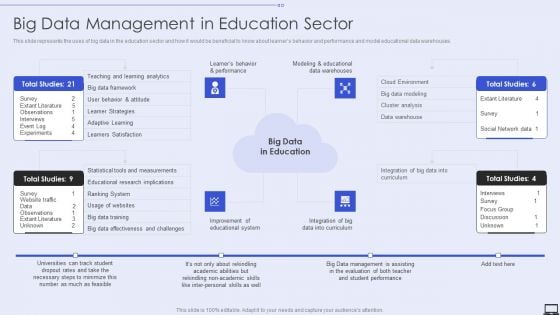
Big Data Management In Education Sector Ppt PowerPoint Presentation Diagram Templates PDF
Presenting Big Data Management In Education Sector Ppt PowerPoint Presentation Diagram Templates PDF to provide visual cues and insights. Share and navigate important information on four stages that need your due attention. This template can be used to pitch topics like Cluster Analysis, Data Warehouse, Cloud Environment. In addtion, this PPT design contains high resolution images, graphics, etc, that are easily editable and available for immediate download.
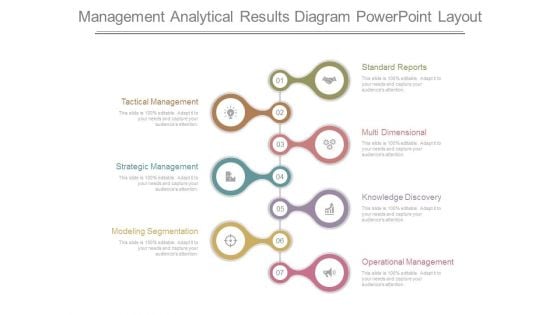
Management Analytical Results Diagram Powerpoint Layout
This is a management analytical results diagram powerpoint layout. This is a seven stage process. The stages in this process are standard reports, multi dimensional, knowledge discovery, operational management, modeling segmentation, strategic management, tactical management.
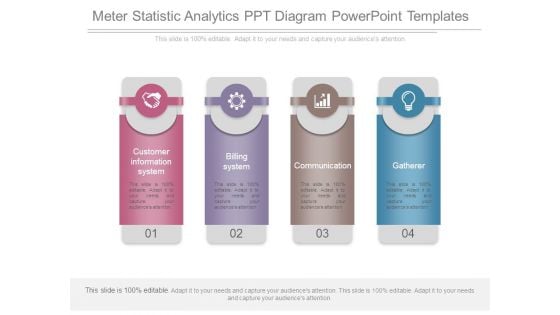
Meter Statistic Analytics Ppt Diagram Powerpoint Templates
This is a meter statistic analytics ppt diagram powerpoint templates. This is a four stage process. The stages in this process are customer information system, billing system, communication, gatherer.

 Home
Home