Analytics Framework
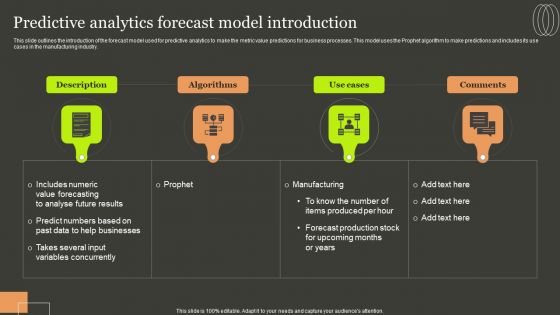
Predictive Analytics Methods Predictive Analytics Forecast Model Introduction Rules PDF
This slide outlines the introduction of the forecast model used for predictive analytics to make the metric value predictions for business processes. This model uses the Prophet algorithm to make predictions and includes its use cases in the manufacturing industry. Make sure to capture your audiences attention in your business displays with our gratis customizable Predictive Analytics Methods Predictive Analytics Forecast Model Introduction Rules PDF. These are great for business strategies, office conferences, capital raising or task suggestions. If you desire to acquire more customers for your tech business and ensure they stay satisfied, create your own sales presentation with these plain slides.

Predictive Analytics Methods Predictive Analytics Model Development Budget Background PDF
This slide describes the budget for developing predictive analytics model by covering details of project cost summary, amount, project details such as company name, project name, project lead, and project start date. The best PPT templates are a great way to save time, energy, and resources. Slidegeeks have 100 percent editable powerpoint slides making them incredibly versatile. With these quality presentation templates, you can create a captivating and memorable presentation by combining visually appealing slides and effectively communicating your message. Download Predictive Analytics Methods Predictive Analytics Model Development Budget Background PDF from Slidegeeks and deliver a wonderful presentation.
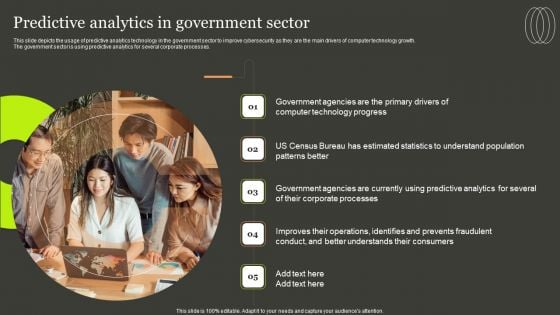
Predictive Analytics Methods Predictive Analytics In Government Sector Information PDF
This slide depicts the usage of predictive analytics technology in the government sector to improve cybersecurity as they are the main drivers of computer technology growth. The government sector is using predictive analytics for several corporate processes. This modern and well arranged Predictive Analytics Methods Predictive Analytics In Government Sector Information PDF provides lots of creative possibilities. It is very simple to customize and edit with the Powerpoint Software. Just drag and drop your pictures into the shapes. All facets of this template can be edited with Powerpoint no extra software is necessary. Add your own material, put your images in the places assigned for them, adjust the colors, and then you can show your slides to the world, with an animated slide included.
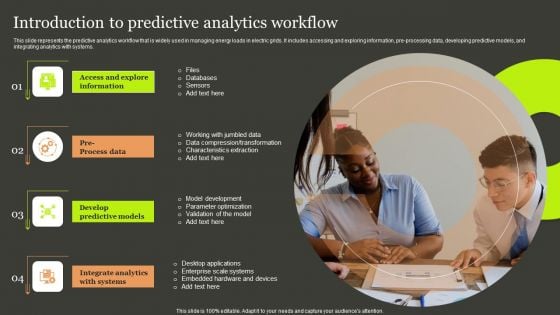
Predictive Analytics Methods Introduction To Predictive Analytics Workflow Slides PDF
This slide represents the predictive analytics workflow that is widely used in managing energy loads in electric grids. It includes accessing and exploring information, pre-processing data, developing predictive models, and integrating analytics with systems. Are you in need of a template that can accommodate all of your creative concepts This one is crafted professionally and can be altered to fit any style. Use it with Google Slides or PowerPoint. Include striking photographs, symbols, depictions, and other visuals. Fill, move around, or remove text boxes as desired. Test out color palettes and font mixtures. Edit and save your work, or work with colleagues. Download Predictive Analytics Methods Introduction To Predictive Analytics Workflow Slides PDF and observe how to make your presentation outstanding. Give an impeccable presentation to your group and make your presentation unforgettable.
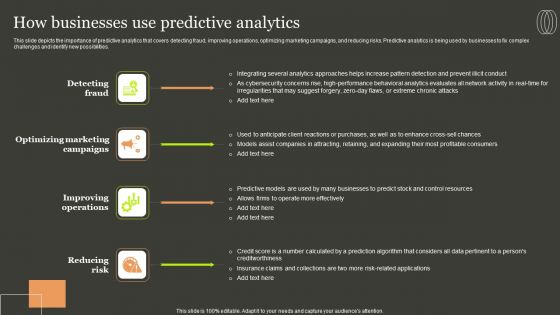
Predictive Analytics Methods How Businesses Use Predictive Analytics Background PDF
This slide depicts the importance of predictive analytics that covers detecting fraud, improving operations, optimizing marketing campaigns, and reducing risks. Predictive analytics is being used by businesses to fix complex challenges and identify new possibilities. Do you know about Slidesgeeks Predictive Analytics Methods How Businesses Use Predictive Analytics Background PDF These are perfect for delivering any kind od presentation. Using it, create PowerPoint presentations that communicate your ideas and engage audiences. Save time and effort by using our pre designed presentation templates that are perfect for a wide range of topic. Our vast selection of designs covers a range of styles, from creative to business, and are all highly customizable and easy to edit. Download as a PowerPoint template or use them as Google Slides themes.
Half Yearly Business Analytics Roadmap With Data Analytics Icons
Presenting our jaw-dropping half yearly business analytics roadmap with data analytics icons. You can alternate the color, font size, font type, and shapes of this PPT layout according to your strategic process. This PPT presentation is compatible with Google Slides and is available in both standard screen and widescreen aspect ratios. You can also download this well-researched PowerPoint template design in different formats like PDF, JPG, and PNG. So utilize this visually-appealing design by clicking the download button given below.
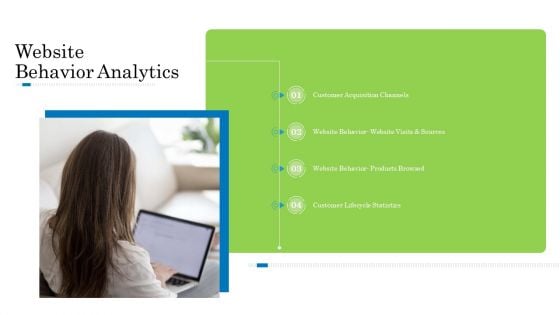
Customer Behavioral Data And Analytics Website Behavior Analytics Elements PDF
Presenting customer behavioral data and analytics website behavior analytics elements pdf to provide visual cues and insights. Share and navigate important information on four stages that need your due attention. This template can be used to pitch topics like customer acquisition channels, website behavior website visits and sources, website behavior products browsed, customer lifecycle statistics. In addtion, this PPT design contains high resolution images, graphics, etc, that are easily editable and available for immediate download.
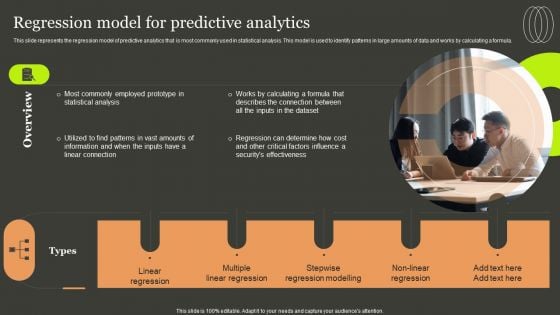
Predictive Analytics Methods Regression Model For Predictive Analytics Template PDF
This slide represents the regression model of predictive analytics that is most commonly used in statistical analysis. This model is used to identify patterns in large amounts of data and works by calculating a formula. Retrieve professionally designed Predictive Analytics Methods Regression Model For Predictive Analytics Template PDF to effectively convey your message and captivate your listeners. Save time by selecting pre made slideshows that are appropriate for various topics, from business to educational purposes. These themes come in many different styles, from creative to corporate, and all of them are easily adjustable and can be edited quickly. Access them as PowerPoint templates or as Google Slides themes. You do not have to go on a hunt for the perfect presentation because Slidegeeks got you covered from everywhere.
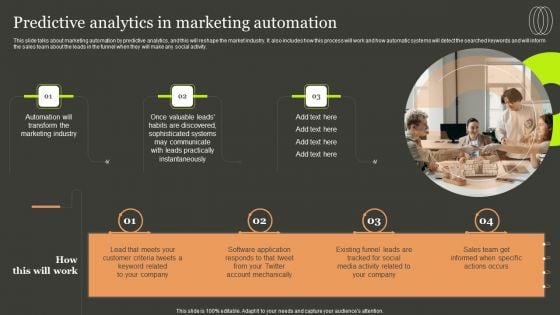
Predictive Analytics Methods Predictive Analytics In Marketing Automation Topics PDF
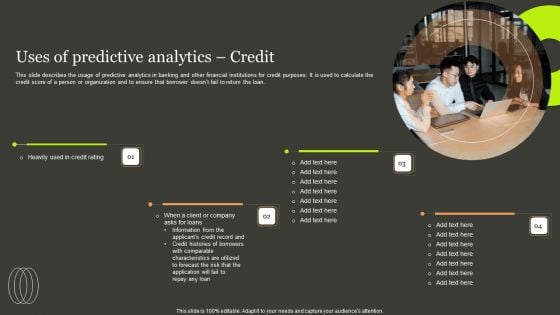
Predictive Analytics Methods Uses Of Predictive Analytics Credit Diagrams PDF
This slide describes the usage of predictive analytics in banking and other financial institutions for credit purposes. It is used to calculate the credit score of a person or organization and to ensure that borrower doesnt fail to return the loan. Slidegeeks is here to make your presentations a breeze with Predictive Analytics Methods Uses Of Predictive Analytics Credit Diagrams PDF With our easy to use and customizable templates, you can focus on delivering your ideas rather than worrying about formatting. With a variety of designs to choose from, you are sure to find one that suits your needs. And with animations and unique photos, illustrations, and fonts, you can make your presentation pop. So whether you are giving a sales pitch or presenting to the board, make sure to check out Slidegeeks first.
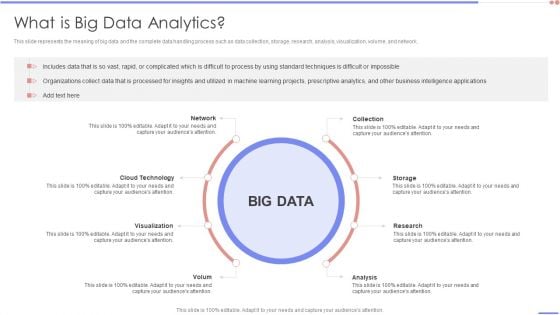
Data Analytics Management What Is Big Data Analytics Slides PDF
This slide represents the meaning of big data and the complete data handling process such as data collection, storage, research, analysis, visualization, volume, and network.This is a Data Analytics Management What Is Big Data Analytics Slides PDF template with various stages. Focus and dispense information on one stage using this creative set, that comes with editable features. It contains large content boxes to add your information on topics like Standard Techniques, Difficult Impossible, Intelligence. You can also showcase facts, figures, and other relevant content using this PPT layout. Grab it now.
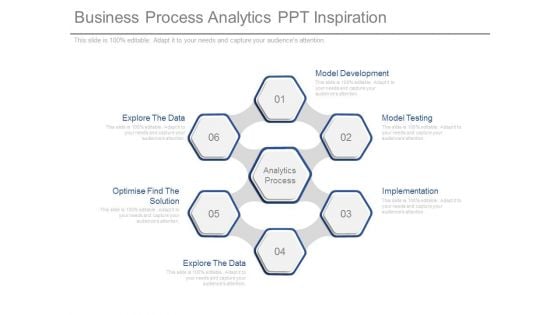
Business Process Analytics Ppt Inspiration
This is a business process analytics ppt inspiration. This is a six stage process. The stages in this process are model development, model testing, implementation, explore the data, optimise find the solution, explore the data, analytics process.

Text Analytics Powerpoint Presentation Slides
This sixty-slide Text Analytics Powerpoint Presentation Slides is your content ready tool to impress the stakeholders with your business planning and its manner of execution. Showcase your ideas and how you plan to make them real in detail with this PPT Template Bundle. The slides have the conceptual bandwidth to present the crucial aspects of your plan, such as funding, marketing, resource allocation, timeline, roadmap, and more. When you present your plans with this PPT Layout, the stakeholders are sure to come on board because you will be able to present a succinct, thought-out, winning project. Download this Complete Deck now to take control into your hands. The 100 percent customizable offer is just too good to be resisted. Our Text Analytics Powerpoint Presentation Slides are topically designed to provide an attractive backdrop to any subject. Use them to look like a presentation pro.

Marketing Predictive Analytics Ppt Example
This is a marketing predictive analytics ppt example. This is a six stage process. The stages in this process are marketing data, explore, transform, model, validate, implement.
Working Capital Analytics Template PDF
Presenting Working Capital Analytics Template PDF to dispense important information. This template comprises two stages. It also presents valuable insights into the topics including Working Capital Analytics This is a completely customizable PowerPoint theme that can be put to use immediately. So, download it and address the topic impactfully.
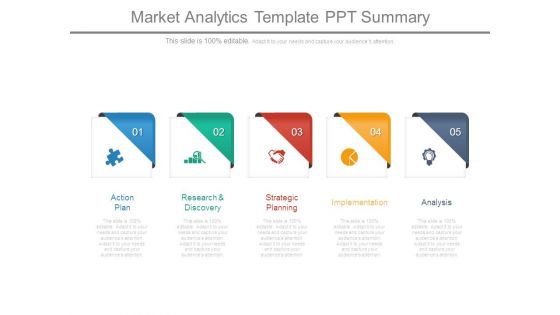
Market Analytics Template Ppt Summary
This is a market analytics template ppt summary. This is a five stage process. The stages in this process are action plan, research and discovery, strategic planning, implementation, analysis.
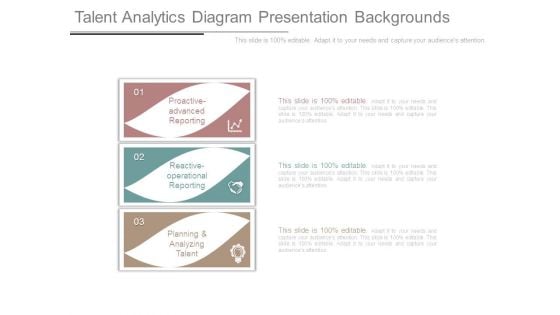
Talent Analytics Diagram Presentation Backgrounds
This is a talent analytics diagram presentation backgrounds. This is a three stage process. The stages in this process are proactive advanced reporting, reactive operational reporting, planning and analyzing talent.
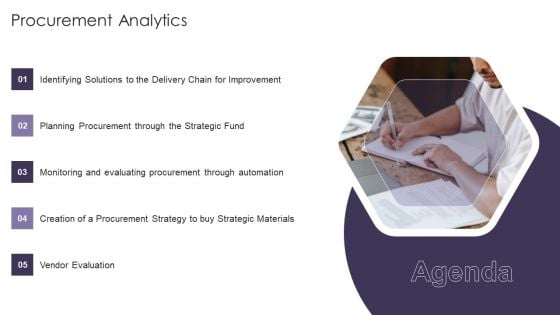
Agenda Procurement Analytics Ideas PDF
This is a Agenda Procurement Analytics Ideas PDF template with various stages. Focus and dispense information on five stages using this creative set, that comes with editable features. It contains large content boxes to add your information on topics like Agenda. You can also showcase facts, figures, and other relevant content using this PPT layout. Grab it now.
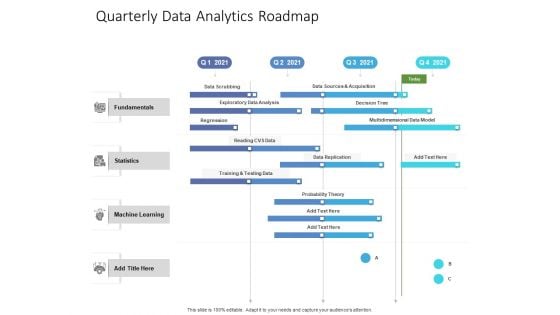
Quarterly Data Analytics Roadmap Pictures
Introducing our quarterly data analytics roadmap pictures. This PPT presentation is Google Slides compatible, therefore, you can share it easily with the collaborators for measuring the progress. Also, the presentation is available in both standard screen and widescreen aspect ratios. So edit the template design by modifying the font size, font type, color, and shapes as per your requirements. As this PPT design is fully editable it can be presented in PDF, JPG and PNG formats.
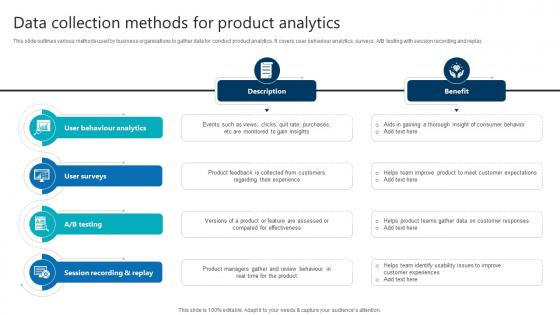
Data Collection Methods For Product Analytics Product Analytics Implementation Data Analytics V
This slide outlines various methods used by business organisations to gather data for conduct product analytics. It covers user behaviour analytics, surveys, A or B testing with session recording and replay.Crafting an eye-catching presentation has never been more straightforward. Let your presentation shine with this tasteful yet straightforward Data Collection Methods For Product Analytics Product Analytics Implementation Data Analytics V template. It offers a minimalistic and classy look that is great for making a statement. The colors have been employed intelligently to add a bit of playfulness while still remaining professional. Construct the ideal Data Collection Methods For Product Analytics Product Analytics Implementation Data Analytics V that effortlessly grabs the attention of your audience Begin now and be certain to wow your customers This slide outlines various methods used by business organisations to gather data for conduct product analytics. It covers user behaviour analytics, surveys, A or B testing with session recording and replay.
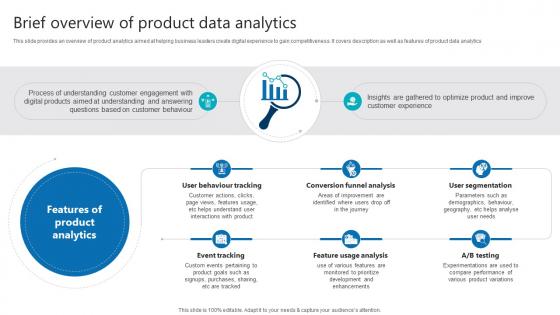
Brief Overview Of Product Data Analytics Product Analytics Implementation Data Analytics V
This slide provides an overview of product analytics aimed at helping business leaders create digital experience to gain competitiveness. It covers description as well as features of product data analytics Get a simple yet stunning designed Brief Overview Of Product Data Analytics Product Analytics Implementation Data Analytics V. It is the best one to establish the tone in your meetings. It is an excellent way to make your presentations highly effective. So, download this PPT today from Slidegeeks and see the positive impacts. Our easy-to-edit Brief Overview Of Product Data Analytics Product Analytics Implementation Data Analytics V can be your go-to option for all upcoming conferences and meetings. So, what are you waiting for Grab this template today. This slide provides an overview of product analytics aimed at helping business leaders create digital experience to gain competitiveness. It covers description as well as features of product data analytics

Types Of Data Monitored In Product Analytics Product Analytics Implementation Data Analytics V
This slide outlines major categories of data tracked using product analytics aimed at improving performance to increase business revenue. It covers categories such as event tracking as well as properties Are you searching for a Types Of Data Monitored In Product Analytics Product Analytics Implementation Data Analytics V that is uncluttered, straightforward, and original Its easy to edit, and you can change the colors to suit your personal or business branding. For a presentation that expresses how much effort you have put in, this template is ideal With all of its features, including tables, diagrams, statistics, and lists, its perfect for a business plan presentation. Make your ideas more appealing with these professional slides. Download Types Of Data Monitored In Product Analytics Product Analytics Implementation Data Analytics V from Slidegeeks today. This slide outlines major categories of data tracked using product analytics aimed at improving performance to increase business revenue. It covers categories such as event tracking as well as properties
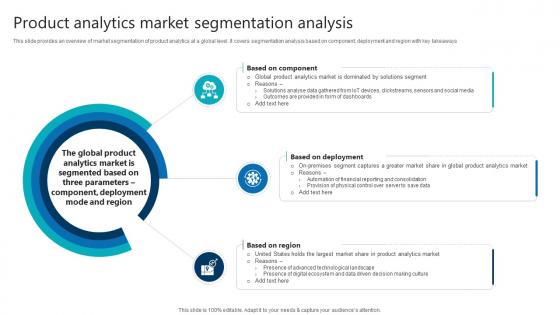
Product Analytics Market Segmentation Analysis Product Analytics Implementation Data Analytics V
This slide provides an overview of market segmentation of product analytics at a global level. It covers segmentation analysis based on component, deployment and region with key takeawaysGet a simple yet stunning designed Product Analytics Market Segmentation Analysis Product Analytics Implementation Data Analytics V. It is the best one to establish the tone in your meetings. It is an excellent way to make your presentations highly effective. So, download this PPT today from Slidegeeks and see the positive impacts. Our easy-to-edit Product Analytics Market Segmentation Analysis Product Analytics Implementation Data Analytics V can be your go-to option for all upcoming conferences and meetings. So, what are you waiting for Grab this template today. This slide provides an overview of market segmentation of product analytics at a global level. It covers segmentation analysis based on component, deployment and region with key takeaways

Growth Restraints Of Product Analytics Market Product Analytics Implementation Data Analytics V
This slide outlines major growth restraints that may hinder increased use of product analytics to boost sales. It covers arguments such as privacy and security issues, data integration from silos and lack of skilled professionals This Growth Restraints Of Product Analytics Market Product Analytics Implementation Data Analytics V is perfect for any presentation, be it in front of clients or colleagues. It is a versatile and stylish solution for organizing your meetings. The Growth Restraints Of Product Analytics Market Product Analytics Implementation Data Analytics V features a modern design for your presentation meetings. The adjustable and customizable slides provide unlimited possibilities for acing up your presentation. Slidegeeks has done all the homework before launching the product for you. So, do not wait, grab the presentation templates today This slide outlines major growth restraints that may hinder increased use of product analytics to boost sales. It covers arguments such as privacy and security issues, data integration from silos and lack of skilled professionals
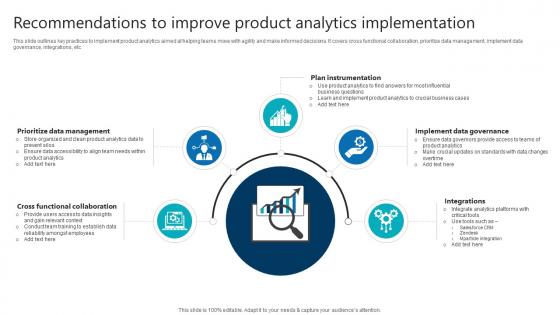
Recommendations To Improve Product Analytics Implementation Product Analytics Implementation Data Analytics V
This slide outlines key practices to implement product analytics aimed at helping teams move with agility and make informed decisions. It covers cross functional collaboration, prioritize data management, implement data governance, integrations, etc Find highly impressive Recommendations To Improve Product Analytics Implementation Product Analytics Implementation Data Analytics V on Slidegeeks to deliver a meaningful presentation. You can save an ample amount of time using these presentation templates. No need to worry to prepare everything from scratch because Slidegeeks experts have already done a huge research and work for you. You need to download Recommendations To Improve Product Analytics Implementation Product Analytics Implementation Data Analytics V for your upcoming presentation. All the presentation templates are 100 percent editable and you can change the color and personalize the content accordingly. Download now This slide outlines key practices to implement product analytics aimed at helping teams move with agility and make informed decisions. It covers cross functional collaboration, prioritize data management, implement data governance, integrations, etc
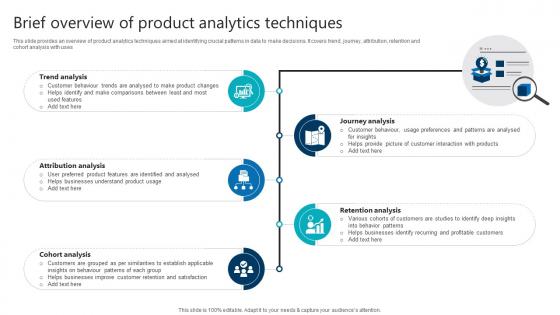
Brief Overview Of Product Analytics Techniques Product Analytics Implementation Data Analytics V
This slide provides an overview of product analytics techniques aimed at identifying crucial patterns in data to make decisions. It covers trend, journey, attribution, retention and cohort analysis with uses.Do you have to make sure that everyone on your team knows about any specific topic I yes, then you should give Brief Overview Of Product Analytics Techniques Product Analytics Implementation Data Analytics V a try. Our experts have put a lot of knowledge and effort into creating this impeccable Brief Overview Of Product Analytics Techniques Product Analytics Implementation Data Analytics V. You can use this template for your upcoming presentations, as the slides are perfect to represent even the tiniest detail. You can download these templates from the Slidegeeks website and these are easy to edit. So grab these today This slide provides an overview of product analytics techniques aimed at identifying crucial patterns in data to make decisions. It covers trend, journey, attribution, retention and cohort analysis with uses.

Global Product Analytics Market Snapshot Product Analytics Implementation Data Analytics V
This slide showcase a graphical representation global product analytics market. It includes present and forecasted values of advanced analytics usage globally with key takeaways on market situationComing up with a presentation necessitates that the majority of the effort goes into the content and the message you intend to convey. The visuals of a PowerPoint presentation can only be effective if it supplements and supports the story that is being told. Keeping this in mind our experts created Global Product Analytics Market Snapshot Product Analytics Implementation Data Analytics V to reduce the time that goes into designing the presentation. This way, you can concentrate on the message while our designers take care of providing you with the right template for the situation. This slide showcase a graphical representation global product analytics market. It includes present and forecasted values of advanced analytics usage globally with key takeaways on market situation
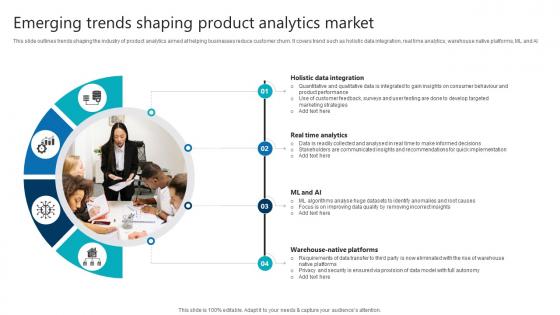
Emerging Trends Shaping Product Analytics Market Product Analytics Implementation Data Analytics V
This slide outlines trends shaping the industry of product analytics aimed at helping businesses reduce customer churn. It covers trend such as holistic data integration, real time analytics, warehouse native platforms, ML and AI Formulating a presentation can take up a lot of effort and time, so the content and message should always be the primary focus. The visuals of the PowerPoint can enhance the presenters message, so our Emerging Trends Shaping Product Analytics Market Product Analytics Implementation Data Analytics V was created to help save time. Instead of worrying about the design, the presenter can concentrate on the message while our designers work on creating the ideal templates for whatever situation is needed. Slidegeeks has experts for everything from amazing designs to valuable content, we have put everything into Emerging Trends Shaping Product Analytics Market Product Analytics Implementation Data Analytics V. This slide outlines trends shaping the industry of product analytics aimed at helping businesses reduce customer churn. It covers trend such as holistic data integration, real time analytics, warehouse native platforms, ML and AI

Product Analytics Tool 3 Chisel For Product Managers Product Analytics Implementation Data Analytics V
This slide provides an overview of product analytic tool Chisel. It covers details regarding tool description, product features and pricing plans such as essential, premium and enterprise Do you have an important presentation coming up Are you looking for something that will make your presentation stand out from the rest Look no further than Product Analytics Tool 3 Chisel For Product Managers Product Analytics Implementation Data Analytics V. With our professional designs, you can trust that your presentation will pop and make delivering it a smooth process. And with Slidegeeks, you can trust that your presentation will be unique and memorable. So why wait Grab Product Analytics Tool 3 Chisel For Product Managers Product Analytics Implementation Data Analytics V today and make your presentation stand out from the rest This slide provides an overview of product analytic tool Chisel. It covers details regarding tool description, product features and pricing plans such as essential, premium and enterprise

Product Analytics Training Plan For Employees Product Analytics Implementation Data Analytics V
This slide outlines training plan aimed at helping employees learn the basics of product analytics to streamline its usage in the business enterprises. It covers details on training module, mode of training, training time slots with trainer name.Whether you have daily or monthly meetings, a brilliant presentation is necessary. Product Analytics Training Plan For Employees Product Analytics Implementation Data Analytics V can be your best option for delivering a presentation. Represent everything in detail using Product Analytics Training Plan For Employees Product Analytics Implementation Data Analytics V and make yourself stand out in meetings. The template is versatile and follows a structure that will cater to your requirements. All the templates prepared by Slidegeeks are easy to download and edit. Our research experts have taken care of the corporate themes as well. So, give it a try and see the results. This slide outlines training plan aimed at helping employees learn the basics of product analytics to streamline its usage in the business enterprises. It covers details on training module, mode of training, training time slots with trainer name.
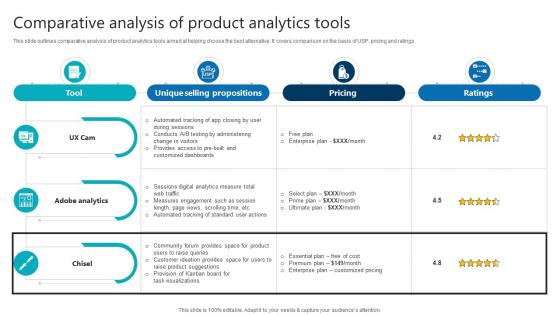
Comparative Analysis Of Product Analytics Tools Product Analytics Implementation Data Analytics V
This slide outlines comparative analysis of product analytics tools aimed at helping choose the best alternative. It covers comparison on the basis of USP, pricing and ratings If your project calls for a presentation, then Slidegeeks is your go-to partner because we have professionally designed, easy-to-edit templates that are perfect for any presentation. After downloading, you can easily edit Comparative Analysis Of Product Analytics Tools Product Analytics Implementation Data Analytics V and make the changes accordingly. You can rearrange slides or fill them with different images. Check out all the handy templates This slide outlines comparative analysis of product analytics tools aimed at helping choose the best alternative. It covers comparison on the basis of USP, pricing and ratings
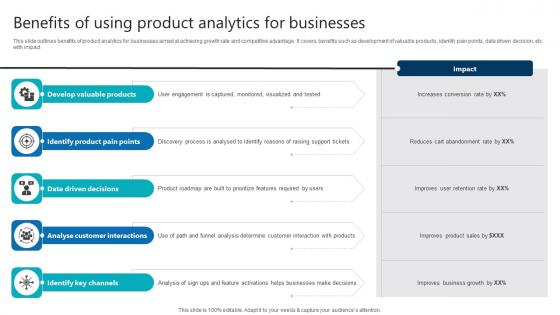
Benefits Of Using Product Analytics For Businesses Product Analytics Implementation Data Analytics V
This slide outlines benefits of product analytics for businesses aimed at achieving growth rate and competitive advantage. It covers benefits such as development of valuable products, identify pain points, data driven decision, etc with impact Slidegeeks is one of the best resources for PowerPoint templates. You can download easily and regulate Benefits Of Using Product Analytics For Businesses Product Analytics Implementation Data Analytics V for your personal presentations from our wonderful collection. A few clicks is all it takes to discover and get the most relevant and appropriate templates. Use our Templates to add a unique zing and appeal to your presentation and meetings. All the slides are easy to edit and you can use them even for advertisement purposes. This slide outlines benefits of product analytics for businesses aimed at achieving growth rate and competitive advantage. It covers benefits such as development of valuable products, identify pain points, data driven decision, etc with impact
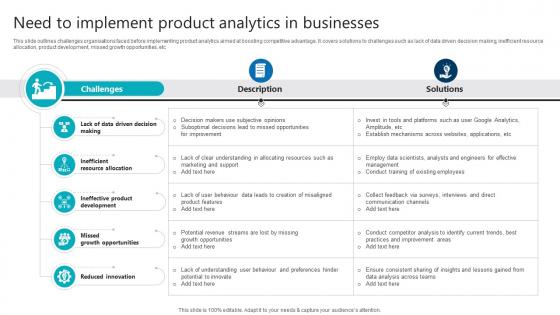
Need To Implement Product Analytics In Businesses Product Analytics Implementation Data Analytics V
This slide outlines challenges organisations faced before implementing product analytics aimed at boosting competitive advantage. It covers solutions to challenges such as lack of data driven decision making, inefficient resource allocation, product development, missed growth opportunities, etc Slidegeeks is one of the best resources for PowerPoint templates. You can download easily and regulate Need To Implement Product Analytics In Businesses Product Analytics Implementation Data Analytics V for your personal presentations from our wonderful collection. A few clicks is all it takes to discover and get the most relevant and appropriate templates. Use our Templates to add a unique zing and appeal to your presentation and meetings. All the slides are easy to edit and you can use them even for advertisement purposes. This slide outlines challenges organisations faced before implementing product analytics aimed at boosting competitive advantage. It covers solutions to challenges such as lack of data driven decision making, inefficient resource allocation, product development, missed growth opportunities, etc
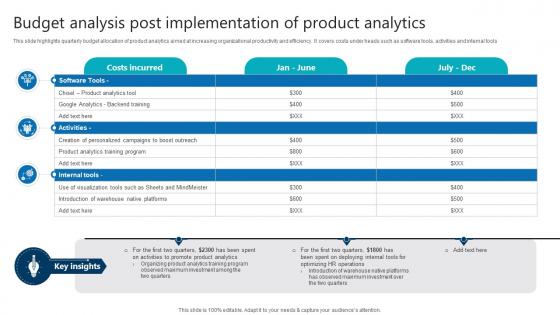
Budget Analysis Post Implementation Of Product Analytics Product Analytics Implementation Data Analytics V
This slide highlights quarterly budget allocation of product analytics aimed at increasing organizational productivity and efficiency. It covers costs under heads such as software tools, activities and internal tools From laying roadmaps to briefing everything in detail, our templates are perfect for you. You can set the stage with your presentation slides. All you have to do is download these easy-to-edit and customizable templates. Budget Analysis Post Implementation Of Product Analytics Product Analytics Implementation Data Analytics V will help you deliver an outstanding performance that everyone would remember and praise you for. Do download this presentation today. This slide highlights quarterly budget allocation of product analytics aimed at increasing organizational productivity and efficiency. It covers costs under heads such as software tools, activities and internal tools

Implementation Timeline Of Product Analytics In Organisation Product Analytics Implementation Data Analytics V
This slide illustrates a weekly timeline of activities undertaken while implementing product analytics in businesses to streamline operations. It covers activities under four heads choose simple use case, implement data governance, democratize product analytics and build expe4rimentataion culture Retrieve professionally designed Implementation Timeline Of Product Analytics In Organisation Product Analytics Implementation Data Analytics V to effectively convey your message and captivate your listeners. Save time by selecting pre-made slideshows that are appropriate for various topics, from business to educational purposes. These themes come in many different styles, from creative to corporate, and all of them are easily adjustable and can be edited quickly. Access them as PowerPoint templates or as Google Slides themes. You do not have to go on a hunt for the perfect presentation because Slidegeeks got you covered from everywhere. This slide illustrates a weekly timeline of activities undertaken while implementing product analytics in businesses to streamline operations. It covers activities under four heads choose simple use case, implement data governance, democratize product analytics and build expe4rimentataion culture

Product Analytics KPI Dashboard For Lead Generation Product Analytics Implementation Data Analytics V
This slide illustrates a dashboard to monitor the lead generation on website page using product analytics aimed at making necessary improvements. It covers insights regarding analysis of lead conversions, event retention rate and page views.Do you have to make sure that everyone on your team knows about any specific topic I yes, then you should give Product Analytics KPI Dashboard For Lead Generation Product Analytics Implementation Data Analytics V a try. Our experts have put a lot of knowledge and effort into creating this impeccable Product Analytics KPI Dashboard For Lead Generation Product Analytics Implementation Data Analytics V. You can use this template for your upcoming presentations, as the slides are perfect to represent even the tiniest detail. You can download these templates from the Slidegeeks website and these are easy to edit. So grab these today This slide illustrates a dashboard to monitor the lead generation on website page using product analytics aimed at making necessary improvements. It covers insights regarding analysis of lead conversions, event retention rate and page views
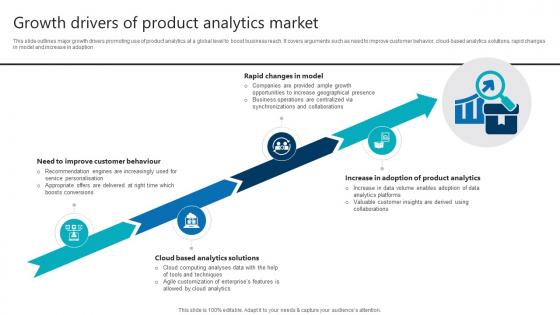
Growth Drivers Of Product Analytics Market Product Analytics Implementation Data Analytics V
This slide outlines major growth drivers promoting use of product analytics at a global level to boost business reach. It covers arguments such as need to improve customer behavior, cloud-based analytics solutions, rapid changes in model and increase in adoption This modern and well-arranged Growth Drivers Of Product Analytics Market Product Analytics Implementation Data Analytics V provides lots of creative possibilities. It is very simple to customize and edit with the Powerpoint Software. Just drag and drop your pictures into the shapes. All facets of this template can be edited with Powerpoint, no extra software is necessary. Add your own material, put your images in the places assigned for them, adjust the colors, and then you can show your slides to the world, with an animated slide included. This slide outlines major growth drivers promoting use of product analytics at a global level to boost business reach. It covers arguments such as need to improve customer behavior, cloud-based analytics solutions, rapid changes in model and increase in adoption

Utilization Of Product Analytics By Various Business Product Analytics Implementation Data Analytics V
This slide provides an overview of business positions leveraging product analytics to improve their business operations. It covers use of product analytics by the following positions product manager, UX designers, marketers, customer success team, executives and business intelligence analyst Retrieve professionally designed Utilization Of Product Analytics By Various Business Product Analytics Implementation Data Analytics V to effectively convey your message and captivate your listeners. Save time by selecting pre-made slideshows that are appropriate for various topics, from business to educational purposes. These themes come in many different styles, from creative to corporate, and all of them are easily adjustable and can be edited quickly. Access them as PowerPoint templates or as Google Slides themes. You do not have to go on a hunt for the perfect presentation because Slidegeeks got you covered from everywhere. This slide provides an overview of business positions leveraging product analytics to improve their business operations. It covers use of product analytics by the following positions product manager, UX designers, marketers, customer success team, executives and business intelligence analyst
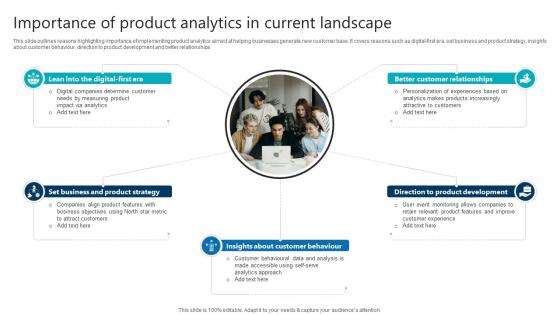
Importance Of Product Analytics In Current Landscape Product Analytics Implementation Data Analytics V
This slide outlines reasons highlighting importance of implementing product analytics aimed at helping businesses generate new customer base. It covers reasons such as digital-first era, set business and product strategy, insights about customer behaviour, direction to product development and better relationships Slidegeeks has constructed Importance Of Product Analytics In Current Landscape Product Analytics Implementation Data Analytics V after conducting extensive research and examination. These presentation templates are constantly being generated and modified based on user preferences and critiques from editors. Here, you will find the most attractive templates for a range of purposes while taking into account ratings and remarks from users regarding the content. This is an excellent jumping-off point to explore our content and will give new users an insight into our top-notch PowerPoint Templates. This slide outlines reasons highlighting importance of implementing product analytics aimed at helping businesses generate new customer base. It covers reasons such as digital-first era, set business and product strategy, insights about customer behaviour, direction to product development and better relationships
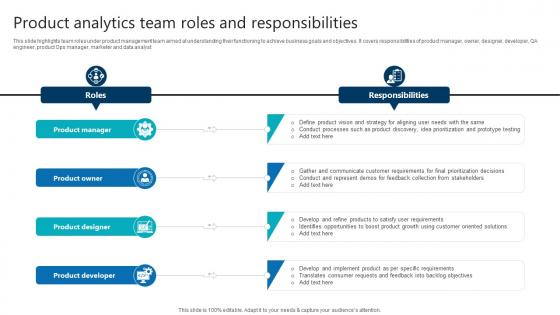
Product Analytics Team Roles And Responsibilities Product Analytics Implementation Data Analytics V
This slide highlights team roles under product management team aimed at understanding their functioning to achieve business goals and objectives. It covers responsibilities of product manager, owner, designer, developer, QA engineer, product Ops manager, marketer and data analyst From laying roadmaps to briefing everything in detail, our templates are perfect for you. You can set the stage with your presentation slides. All you have to do is download these easy-to-edit and customizable templates. Product Analytics Team Roles And Responsibilities Product Analytics Implementation Data Analytics V will help you deliver an outstanding performance that everyone would remember and praise you for. Do download this presentation today. This slide highlights team roles under product management team aimed at understanding their functioning to achieve business goals and objectives. It covers responsibilities of product manager, owner, designer, developer, QA engineer, product Ops manager, marketer and data analyst

Key Metrics Used To Track Product Analytics Product Analytics Implementation Data Analytics V
This slide outlines major metrics used by businesses to analyse product performance aimed at making necessary improvements. It covers key metrics such as engagement, retention, customer lifetime value, number of crashes and feature adoption rate with benefits Do you know about Slidesgeeks Key Metrics Used To Track Product Analytics Product Analytics Implementation Data Analytics V These are perfect for delivering any kind od presentation. Using it, create PowerPoint presentations that communicate your ideas and engage audiences. Save time and effort by using our pre-designed presentation templates that are perfect for a wide range of topic. Our vast selection of designs covers a range of styles, from creative to business, and are all highly customizable and easy to edit. Download as a PowerPoint template or use them as Google Slides themes. This slide outlines major metrics used by businesses to analyse product performance aimed at making necessary improvements. It covers key metrics such as engagement, retention, customer lifetime value, number of crashes and feature adoption rate with benefits
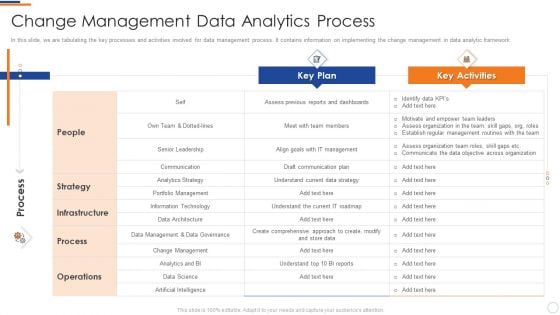
Business Intelligence And Big Data Analytics Change Management Data Analytics Process Infographics PDF
In this slide, we are tabulating the key processes and activities involved for data management process. It contains information on implementing the change management in data analytic framework. Deliver an awe inspiring pitch with this creative business intelligence and big data analytics change management data analytics process infographics pdf bundle. Topics like strategy, key plan, key activities, infrastructure can be discussed with this completely editable template. It is available for immediate download depending on the needs and requirements of the user.
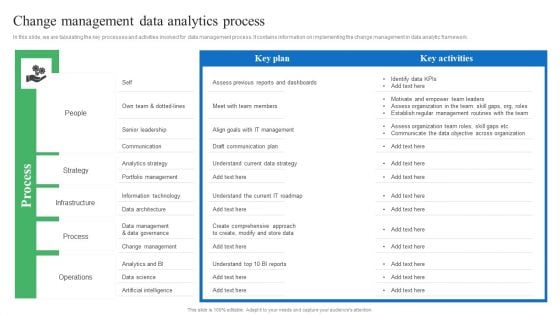
Toolkit For Data Science And Analytics Transition Change Management Data Analytics Process Guidelines PDF
In this slide, we are tabulating the key processes and activities involved for data management process. It contains information on implementing the change management in data analytic framework. Take your projects to the next level with our ultimate collection of Toolkit For Data Science And Analytics Transition Change Management Data Analytics Process Guidelines PDF. Slidegeeks has designed a range of layouts that are perfect for representing task or activity duration, keeping track of all your deadlines at a glance. Tailor these designs to your exact needs and give them a truly corporate look with your own brand colors they will make your projects stand out from the rest.
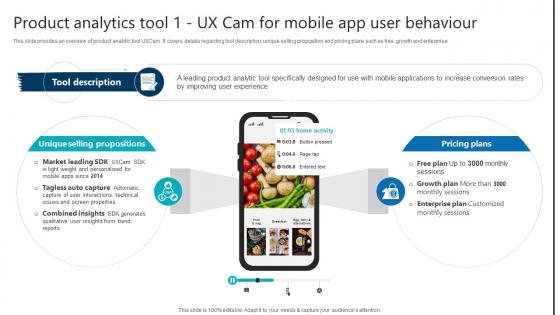
Product Analytics Tool 1 UX Cam For Mobile App User Behaviour Product Analytics Implementation Data Analytics V
This slide provides an overview of product analytic tool UXCam. It covers details regarding tool description, unique selling proposition and pricing plans such as free, growth and enterprise.Present like a pro with Product Analytics Tool 1 UX Cam For Mobile App User Behaviour Product Analytics Implementation Data Analytics V. Create beautiful presentations together with your team, using our easy-to-use presentation slides. Share your ideas in real-time and make changes on the fly by downloading our templates. So whether you are in the office, on the go, or in a remote location, you can stay in sync with your team and present your ideas with confidence. With Slidegeeks presentation got a whole lot easier. Grab these presentations today. This slide provides an overview of product analytic tool UXCam. It covers details regarding tool description, unique selling proposition and pricing plans such as free, growth and enterprise.
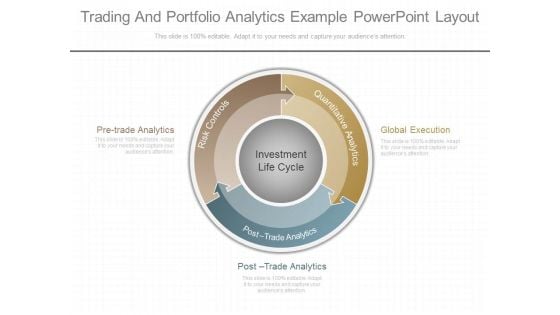
Trading And Portfolio Analytics Example Powerpoint Layout
This is a trading and portfolio analytics example powerpoint layout. This is a three stage process. The stages in this process are global execution, post trade analytics, pre trade analytics, risk controls, quantitative analytics, investment life cycle.
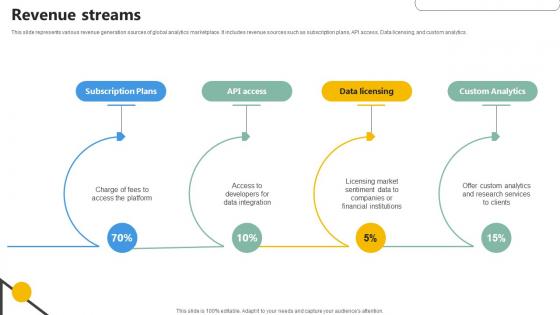
Revenue Streams Analytics Company Investor Funding Elevator
This slide represents various revenue generation sources of global analytics marketplace. It includes revenue sources such as subscription plans, API access, Data licensing, and custom analytics.This Revenue Streams Analytics Company Investor Funding Elevator is perfect for any presentation, be it in front of clients or colleagues. It is a versatile and stylish solution for organizing your meetings. The Revenue Streams Analytics Company Investor Funding Elevator features a modern design for your presentation meetings. The adjustable and customizable slides provide unlimited possibilities for acing up your presentation. Slidegeeks has done all the homework before launching the product for you. So, do not wait, grab the presentation templates today This slide represents various revenue generation sources of global analytics marketplace. It includes revenue sources such as subscription plans, API access, Data licensing, and custom analytics.
Analytics Based Marketing Trends Icon Infographics Pdf
Showcasing this set of slides titled Analytics Based Marketing Trends Icon Infographics Pdf The topics addressed in these templates are Analytics Based, Marketing Trends Icon All the content presented in this PPT design is completely editable. Download it and make adjustments in color, background, font etc. as per your unique business setting. Our Analytics Based Marketing Trends Icon Infographics Pdf are topically designed to provide an attractive backdrop to any subject. Use them to look like a presentation pro.
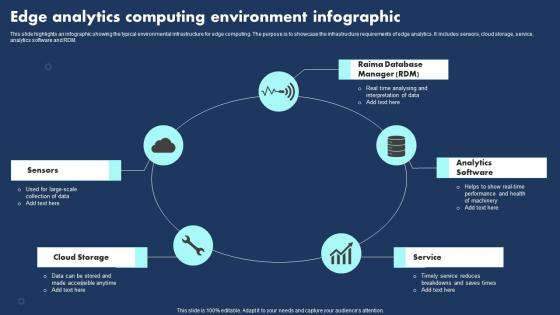
Edge Analytics Computing Environment Infographic Sample Pdf
This slide highlights an infographic showing the typical environmental infrastructure for edge computing. The purpose is to showcase the infrastructure requirements of edge analytics. It includes sensors, cloud storage, service, analytics software and RDM.Showcasing this set of slides titled Edge Analytics Computing Environment Infographic Sample Pdf The topics addressed in these templates are Cloud Storage, Analytics Software, Performance Health All the content presented in this PPT design is completely editable. Download it and make adjustments in color, background, font etc. as per your unique business setting. This slide highlights an infographic showing the typical environmental infrastructure for edge computing. The purpose is to showcase the infrastructure requirements of edge analytics. It includes sensors, cloud storage, service, analytics software and RDM.
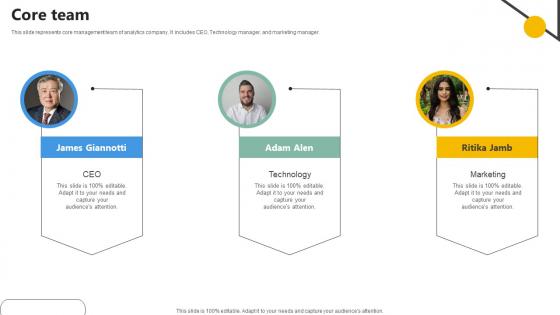
Core Team Analytics Company Investor Funding Elevator
This slide represents core management team of analytics company. It includes CEO, Technology manager, and marketing manager.Formulating a presentation can take up a lot of effort and time, so the content and message should always be the primary focus. The visuals of the PowerPoint can enhance the presenters message, so our Core Team Analytics Company Investor Funding Elevator was created to help save time. Instead of worrying about the design, the presenter can concentrate on the message while our designers work on creating the ideal templates for whatever situation is needed. Slidegeeks has experts for everything from amazing designs to valuable content, we have put everything into Core Team Analytics Company Investor Funding Elevator. This slide represents core management team of analytics company. It includes CEO, Technology manager, and marketing manager.
Digital Analytics Based Marketing Icon Microsoft Pdf
Pitch your topic with ease and precision using this Digital Analytics Based Marketing Icon Microsoft Pdf This layout presents information on Digital Analytics, Based Marketing Icon It is also available for immediate download and adjustment. So, changes can be made in the color, design, graphics or any other component to create a unique layout. Our Digital Analytics Based Marketing Icon Microsoft Pdf are topically designed to provide an attractive backdrop to any subject. Use them to look like a presentation pro.
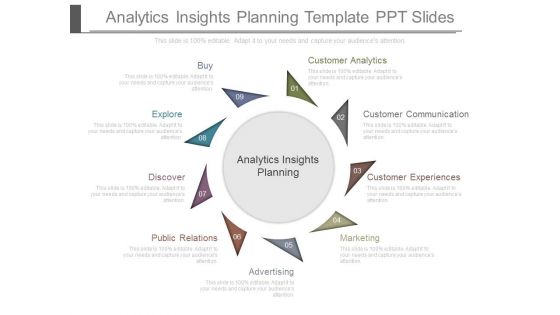
Analytics Insights Planning Template Ppt Slides
This is a analytics insights planning template ppt slides. This is a nine stage process. The stages in this process are buy, explore, discover, public relations, advertising, customer analytics, customer communication, customer experiences, marketing, analytics insights planning.
Analytics Based Marketing Analysis Icon Download Pdf
Pitch your topic with ease and precision using this Analytics Based Marketing Analysis Icon Download Pdf This layout presents information on Analytics Based, Marketing Analysis Icon It is also available for immediate download and adjustment. So, changes can be made in the color, design, graphics or any other component to create a unique layout. Our Analytics Based Marketing Analysis Icon Download Pdf are topically designed to provide an attractive backdrop to any subject. Use them to look like a presentation pro.
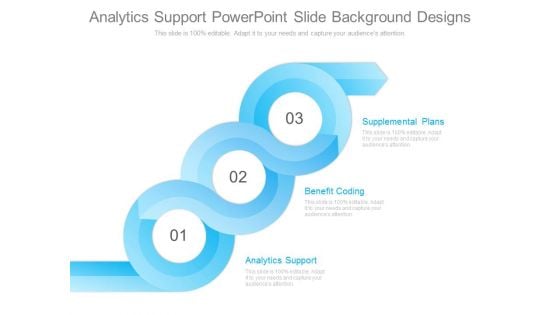
Analytics Support Powerpoint Slide Background Designs
This is a analytics support powerpoint slide background designs. This is a three stage process. The stages in this process are supplemental plans, benefit coding, analytics support.
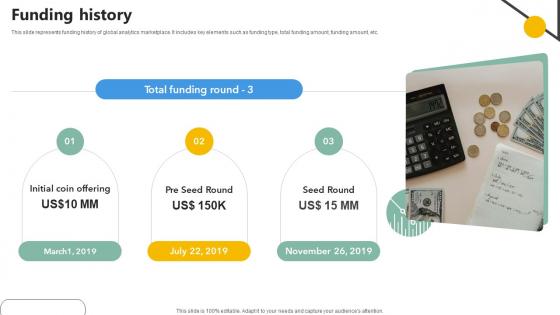
Funding History Analytics Company Investor Funding Elevator
This slide represents funding history of global analytics marketplace. It includes key elements such as funding type, total funding amount, funding amount, etc.Presenting this PowerPoint presentation, titled Funding History Analytics Company Investor Funding Elevator, with topics curated by our researchers after extensive research. This editable presentation is available for immediate download and provides attractive features when used. Download now and captivate your audience. Presenting this Funding History Analytics Company Investor Funding Elevator. Our researchers have carefully researched and created these slides with all aspects taken into consideration. This is a completely customizable Funding History Analytics Company Investor Funding Elevator that is available for immediate downloading. Download now and make an impact on your audience. Highlight the attractive features available with our PPTs. This slide represents funding history of global analytics marketplace. It includes key elements such as funding type, total funding amount, funding amount, etc.
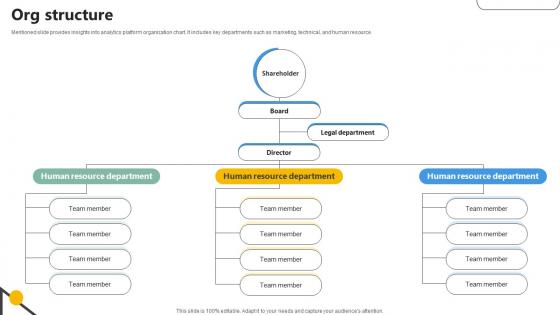
Org Structure Analytics Company Investor Funding Elevator
Mentioned slide provides insights into analytics platform organization chart. It includes key departments such as marketing, technical, and human resource.Find highly impressive Org Structure Analytics Company Investor Funding Elevator on Slidegeeks to deliver a meaningful presentation. You can save an ample amount of time using these presentation templates. No need to worry to prepare everything from scratch because Slidegeeks experts have already done a huge research and work for you. You need to download Org Structure Analytics Company Investor Funding Elevator for your upcoming presentation. All the presentation templates are 100 percent editable and you can change the color and personalize the content accordingly. Download now Mentioned slide provides insights into analytics platform organization chart. It includes key departments such as marketing, technical, and human resource.

Shareholding Pattern Analytics Company Investor Funding Elevator
This slide represents shareholding pattern of financial analytics company before and after funding. It includes key components such as shareholders list, before funding shareholding amount and after funding shareholding amount.Explore a selection of the finest Shareholding Pattern Analytics Company Investor Funding Elevator here. With a plethora of professionally designed and pre-made slide templates, you can quickly and easily find the right one for your upcoming presentation. You can use our Shareholding Pattern Analytics Company Investor Funding Elevator to effectively convey your message to a wider audience. Slidegeeks has done a lot of research before preparing these presentation templates. The content can be personalized and the slides are highly editable. Grab templates today from Slidegeeks. This slide represents shareholding pattern of financial analytics company before and after funding. It includes key components such as shareholders list, before funding shareholding amount and after funding shareholding amount.
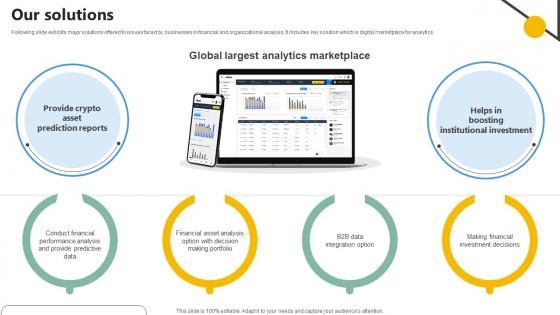
Our Solutions Analytics Company Investor Funding Elevator
Following slide exhibits major solutions offered to issues faced by businesses in financial and organizational analysis. It includes key solution which is digital marketplace for analytics. If you are looking for a format to display your unique thoughts, then the professionally designed Our Solutions Analytics Company Investor Funding Elevator is the one for you. You can use it as a Google Slides template or a PowerPoint template. Incorporate impressive visuals, symbols, images, and other charts. Modify or reorganize the text boxes as you desire. Experiment with shade schemes and font pairings. Alter, share or cooperate with other people on your work. Download Our Solutions Analytics Company Investor Funding Elevator and find out how to give a successful presentation. Present a perfect display to your team and make your presentation unforgettable. Following slide exhibits major solutions offered to issues faced by businesses in financial and organizational analysis. It includes key solution which is digital marketplace for analytics.

Agenda Driving Business Success Integrating Product Analytics
Find a pre-designed and impeccable Agenda Driving Business Success Integrating Product Analytics. The templates can ace your presentation without additional effort. You can download these easy-to-edit presentation templates to make your presentation stand out from others. So, what are you waiting for Download the template from Slidegeeks today and give a unique touch to your presentation. Our Agenda Driving Business Success Integrating Product Analytics are topically designed to provide an attractive backdrop to any subject. Use them to look like a presentation pro.
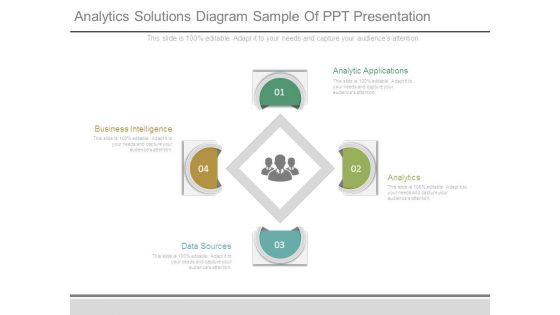
Analytics Solutions Diagram Sample Of Ppt Presentation
This is a analytics solutions diagram sample of ppt presentation. This is a four stage process. The stages in this process are analytic applications, analytics, data sources, business intelligence.
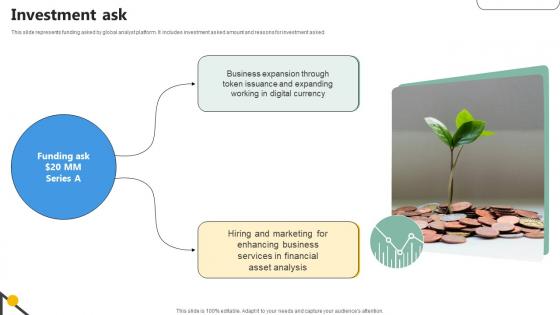
Investment Ask Analytics Company Investor Funding Elevator
This slide represents funding asked by global analyst platform. It includes investment asked amount and reasons for investment asked.Create an editable Investment Ask Analytics Company Investor Funding Elevator that communicates your idea and engages your audience. Whether you are presenting a business or an educational presentation, pre-designed presentation templates help save time. Investment Ask Analytics Company Investor Funding Elevator is highly customizable and very easy to edit, covering many different styles from creative to business presentations. Slidegeeks has creative team members who have crafted amazing templates. So, go and get them without any delay. This slide represents funding asked by global analyst platform. It includes investment asked amount and reasons for investment asked.


 Continue with Email

 Home
Home


