Analytics Icon
Big Data Analytics Lifecycle Most Critical Vs Of Big Data Ppt Icon Aids PDF
This slide describes the top sources of big data collection such as media data, cloud data, web data, machine data, and data collected from traditional and modern databases. Want to ace your presentation in front of a live audience Our Big Data Analytics Lifecycle Most Critical Vs Of Big Data Ppt Icon Aids PDF can help you do that by engaging all the users towards you. Slidegeeks experts have put their efforts and expertise into creating these impeccable powerpoint presentations so that you can communicate your ideas clearly. Moreover, all the templates are customizable, and easy-to-edit and downloadable. Use these for both personal and commercial use.
Icon For Customer Relation Management Lifecycle Process Data Analytics In CRM Portrait PDF
Pitch your topic with ease and precision using this Icon For Customer Relation Management Lifecycle Process Data Analytics In CRM Portrait PDF. This layout presents information on Icon For Customer Relation Management Lifecycle Process Data Analytics In CRM. It is also available for immediate download and adjustment. So, changes can be made in the color, design, graphics or any other component to create a unique layout.
Web Analytics Charts Visits Bounce Rate Page Views Ppt PowerPoint Presentation Icon Layouts
This is a web analytics charts visits bounce rate page views ppt powerpoint presentation icon layouts. This is a six stage process. The stages in this process are digital analytics, digital dashboard, marketing.
Optimizing Marketing Analytics To Enhance Organizational Growth Major Types Of Marketing Icons PDF
This slide covers three types of models to conduct marketing analytics. The mentioned models are descriptive models to identify what happened, predictive models to know what will happen, and prescriptive models to determine how to make it happen. Explore a selection of the finest Optimizing Marketing Analytics To Enhance Organizational Growth Major Types Of Marketing Icons PDF here. With a plethora of professionally designed and pre made slide templates, you can quickly and easily find the right one for your upcoming presentation. You can use our Optimizing Marketing Analytics To Enhance Organizational Growth Major Types Of Marketing Icons PDF to effectively convey your message to a wider audience. Slidegeeks has done a lot of research before preparing these presentation templates. The content can be personalized and the slides are highly editable. Grab templates today from Slidegeeks.
Optimizing Marketing Analytics To Enhance Organizational Growth Analyzing Landing Page Views Icons PDF
This slide covers an overview of page view KPI to identify which pages drive the most traffic and which are underperforming. It also includes improvement strategies such as push notifications, yes or yes campaigns, and popups for related articles. Here you can discover an assortment of the finest PowerPoint and Google Slides templates. With these templates, you can create presentations for a variety of purposes while simultaneously providing your audience with an eye catching visual experience. Download Optimizing Marketing Analytics To Enhance Organizational Growth Analyzing Landing Page Views Icons PDF to deliver an impeccable presentation. These templates will make your job of preparing presentations much quicker, yet still, maintain a high level of quality. Slidegeeks has experienced researchers who prepare these templates and write high quality content for you. Later on, you can personalize the content by editing the Optimizing Marketing Analytics To Enhance Organizational Growth Analyzing Landing Page Views Icons PDF.
Information Analytics Company Outline ESG Performance Gender And Ethnic Diversity Icons PDF
This slide highlights the Experian ESG performance which includes gender diversity by level, racial and ethnic diversity by level USA and gender diversity targets. This Information Analytics Company Outline ESG Performance Gender And Ethnic Diversity Icons PDF is perfect for any presentation, be it in front of clients or colleagues. It is a versatile and stylish solution for organizing your meetings. The Information Analytics Company Outline ESG Performance Gender And Ethnic Diversity Icons PDF features a modern design for your presentation meetings. The adjustable and customizable slides provide unlimited possibilities for acing up your presentation. Slidegeeks has done all the homework before launching the product for you. So, do not wait, grab the presentation templates today
Multi Levels Analytics Process Plan With Reporting Ppt PowerPoint Presentation Gallery Icons PDF
Persuade your audience using this multi levels analytics process plan with reporting ppt powerpoint presentation gallery icons pdf. This PPT design covers four stages, thus making it a great tool to use. It also caters to a variety of topics including business, marketing, budget. Download this PPT design now to present a convincing pitch that not only emphasizes the topic but also showcases your presentation skills.
Financial Analytics Solution Investor Funding Elevator Pitch Deck Financial Projections Icons PDF
Mentioned slide provides information about anticipated financial growth of business after receiving investment and allocation of funds. It includes revenue in US doller MM and projected years of growth Welcome to our selection of the Financial Analytics Solution Investor Funding Elevator Pitch Deck Financial Projections Icons PDF. These are designed to help you showcase your creativity and bring your sphere to life. Planning and Innovation are essential for any business that is just starting out. This collection contains the designs that you need for your everyday presentations. All of our PowerPoints are 100 percent editable, so you can customize them to suit your needs. This multi purpose template can be used in various situations. Grab these presentation templates today.
Icons Slide For Data Modeling Approaches For Modern Analytics Microsoft Pdf
Introducing our well designed Icons Slide For Data Modeling Approaches For Modern Analytics Microsoft Pdf set of slides. The slide displays editable icons to enhance your visual presentation. The icons can be edited easily. So customize according to your business to achieve a creative edge. Download and share it with your audience. Our Icons Slide For Data Modeling Approaches For Modern Analytics Microsoft Pdf are topically designed to provide an attractive backdrop to any subject. Use them to look like a presentation pro.
Information Technology In A Supply Chain Analytical Applications Ppt PowerPoint Presentation Portfolio Icon
This is a information technology in a supply chain analytical applications ppt powerpoint presentation portfolio icon. This is a three stage process. The stages in this process are strategic, planning, operational, supplier apps, manufacturer.
Icons Slide For Business Intelligence And Big Data Analytics Transformation Toolkit Slides PDF
Introducing our well designed icons slide for business intelligence and big data analytics transformation toolkit slides pdf set of slides. The slide displays editable icons to enhance your visual presentation. The icons can be edited easily. So customize according to your business to achieve a creative edge. Download and share it with your audience.
Icons Slide For Toolkit For Data Science And Analytics Transition Elements PDF
Presenting our innovatively structured Icons Slide For Toolkit For Data Science And Analytics Transition Elements PDF set of slides. The slides contain a hundred percent editable icons. You can replace these icons without any inconvenience. Therefore, pick this set of slides and create a striking presentation.
Online Marketing Analytics To Enhance Business Growth Analyzing Backlinks For Improved Search Icons PDF
This slide covers an overview of backlinks KPI to identify count as one of the most important Google ranking factors. It also includes improvement strategies such as finding backlink opportunities with top referral sources, guest blogging, and writing testimonials. Create an editable Online Marketing Analytics To Enhance Business Growth Analyzing Backlinks For Improved Search Icons PDF that communicates your idea and engages your audience. Whether youre presenting a business or an educational presentation, pre designed presentation templates help save time. Online Marketing Analytics To Enhance Business Growth Analyzing Backlinks For Improved Search Icons PDF is highly customizable and very easy to edit, covering many different styles from creative to business presentations. Slidegeeks has creative team members who have crafted amazing templates. So, go and get them without any delay.
Icons Slide For Developing Strategic Insights Using Big Data Analytics Across Business Sectors
Download our innovative and attention grabbing Icons Slide For Developing Strategic Insights Using Big Data Analytics Across Business Sectors template. The set of slides exhibit completely customizable icons. These icons can be incorporated into any business presentation. So download it immediately to clearly communicate with your clientele. Our Icons Slide For Developing Strategic Insights Using Big Data Analytics Across Business Sectors are topically designed to provide an attractive backdrop to any subject. Use them to look like a presentation pro.
Icons Slide For Site Analytic And Audit Proposal Ppt Inspiration Introduction PDF
Introducing our well designed icons slide for site analytic and audit proposal ppt inspiration introduction pdf set of slides. The slide displays editable icons to enhance your visual presentation. The icons can be edited easily. So customize according to your business to achieve a creative edge. Download and share it with your audience.
Data Analytics Management Tricky Process Of Converting Big Data Into Valuable Insights Icons PDF
This slide represents another challenge of big data that is the tricky process of converting big data into valuable insights, and the solution to this challenge is to develop a proper system of elements.Deliver and pitch your topic in the best possible manner with this Data Analytics Management Tricky Process Of Converting Big Data Into Valuable Insights Icons PDF. Use them to share invaluable insights on Challenges, Data Platform, Evaluate Data and impress your audience. This template can be altered and modified as per your expectations. So, grab it now.
Cognitive Analytics Strategy And Techniques How Cognitive Technology Affects Functional Business Areas Icons PDF
This slide provides information regarding how cognitive technology affect core functional business areas such as front office, middle office and back office. Slidegeeks is one of the best resources for PowerPoint templates. You can download easily and regulate Cognitive Analytics Strategy And Techniques How Cognitive Technology Affects Functional Business Areas Icons PDF for your personal presentations from our wonderful collection. A few clicks is all it takes to discover and get the most relevant and appropriate templates. Use our Templates to add a unique zing and appeal to your presentation and meetings. All the slides are easy to edit and you can use them even for advertisement purposes.
Gym Health And Fitness Market Industry Report Analytics Dashboard For Gym Health And Fitness Clubs Ppt Icon Slideshow PDF
Presenting this set of slides with name gym health and fitness market industry report analytics dashboard for gym health and fitness clubs ppt icon slideshow pdf. This is a seven stage process. The stages in this process are attended special events, facebook fans, web hits, enrollment for gym, social media friends, twitter followers, emails collected on website. This is a completely editable PowerPoint presentation and is available for immediate download. Download now and impress your audience.
Icons Slide For Administered Data And Analytic Quality Playbook Microsoft PDF
Introducing our well designed Icons Slide For Administered Data And Analytic Quality Playbook Microsoft PDF set of slides. The slide displays editable icons to enhance your visual presentation. The icons can be edited easily. So customize according to your business to achieve a creative edge. Download and share it with your audience.
Analytical Incrementalism Conducting A Strategic Gap Analysis Ppt Ideas Icon PDF
The purpose of this slide is to provide a glimpse of the companys strategic gap analysis considering the focus areas, current and future state and action plan. This is a analytical incrementalism conducting a strategic gap analysis ppt ideas icon pdf template with various stages. Focus and dispense information on three stages using this creative set, that comes with editable features. It contains large content boxes to add your information on topics like focus areas, current state, identified gap, action plan, desired future state. You can also showcase facts, figures, and other relevant content using this PPT layout. Grab it now.
Administered Data And Analytic Quality Playbook How To Fix The Business Intelligence Problem Icons PDF
This template covers the solution for BI problems such as analytics transformation and business intelligence program. It also depicts that switching to next-generation analytics platform that gives business users data driven insights.This is a Administered Data And Analytic Quality Playbook How To Fix The Business Intelligence Problem Icons PDF template with various stages. Focus and dispense information on six stages using this creative set, that comes with editable features. It contains large content boxes to add your information on topics like Driven Analytics, Automated Discovery, Bridging Business You can also showcase facts, figures, and other relevant content using this PPT layout. Grab it now.
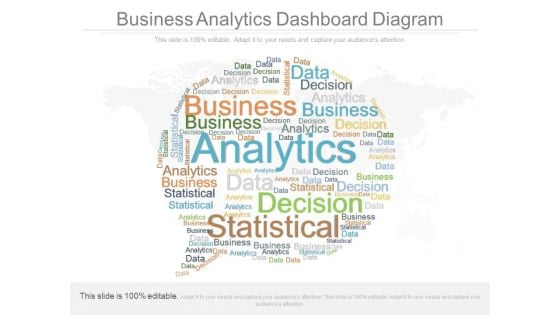
Business Analytics Dashboard Diagram
This is a business analytics dashboard diagram. This is a one stage process. The stages in this process are analytics, decision, data, business, statistics.
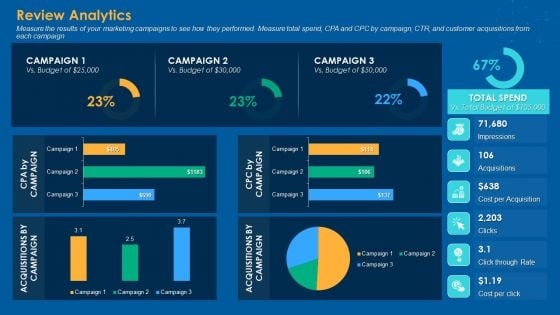
Review Analytics Elements PDF
Deliver and pitch your topic in the best possible manner with this review analytics elements pdf. Use them to share invaluable insights on impressions, acquisitions, cost per acquisition, click through rate, cost per click and impress your audience. This template can be altered and modified as per your expectations. So, grab it now.
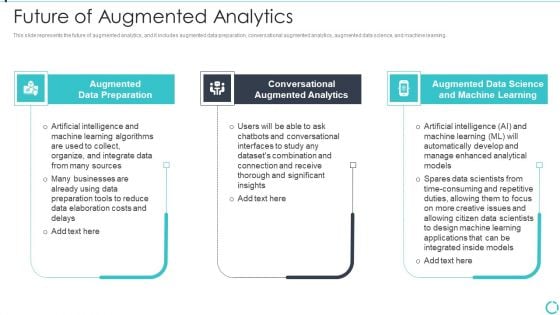
Augmented Analytics Implementation IT Future Of Augmented Analytics Brochure PDF
This slide represents the future of augmented analytics, and it includes augmented data preparation, conversational augmented analytics, augmented data science, and machine learning. Presenting Augmented Analytics Implementation IT Future Of Augmented Analytics Brochure PDF to provide visual cues and insights. Share and navigate important information on three stages that need your due attention. This template can be used to pitch topics like Augmented Data Preparation, Conversational Augmented Analytics, Augmented Data Science, Machine Learning. In addtion, this PPT design contains high resolution images, graphics, etc, that are easily editable and available for immediate download.
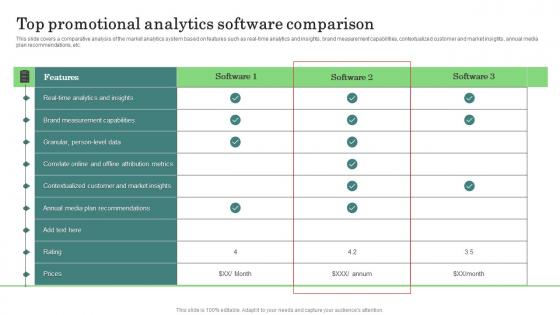
Top Promotional Analytics Major Promotional Analytics Future Trends Diagrams Pdf
This slide covers a comparative analysis of the market analytics system based on features such as real time analytics and insights, brand measurement capabilities, contextualized customer and market insights, annual media plan recommendations, etc. Do you know about Slidesgeeks Top Promotional Analytics Major Promotional Analytics Future Trends Diagrams Pdf These are perfect for delivering any kind od presentation. Using it, create PowerPoint presentations that communicate your ideas and engage audiences. Save time and effort by using our pre designed presentation templates that are perfect for a wide range of topic. Our vast selection of designs covers a range of styles, from creative to business, and are all highly customizable and easy to edit. Download as a PowerPoint template or use them as Google Slides themes. This slide covers a comparative analysis of the market analytics system based on features such as real time analytics and insights, brand measurement capabilities, contextualized customer and market insights, annual media plan recommendations, etc.

Prescriptive Analytics Software Tool Rapidminer Data Analytics SS V
This slide provides overview of RapidMiner as a prescriptive analytics tool to help businesses evaluate its usability. It covers details of RapidMiner regarding description, features and pricing plans.Are you searching for a Prescriptive Analytics Software Tool Rapidminer Data Analytics SS V that is uncluttered, straightforward, and original Its easy to edit, and you can change the colors to suit your personal or business branding. For a presentation that expresses how much effort you have put in, this template is ideal With all of its features, including tables, diagrams, statistics, and lists, its perfect for a business plan presentation. Make your ideas more appealing with these professional slides. Download Prescriptive Analytics Software Tool Rapidminer Data Analytics SS V from Slidegeeks today. This slide provides overview of RapidMiner as a prescriptive analytics tool to help businesses evaluate its usability. It covers details of RapidMiner regarding description, features and pricing plans.

Product Analytics Implementation For Enhanced Business Insights Data Analytics V
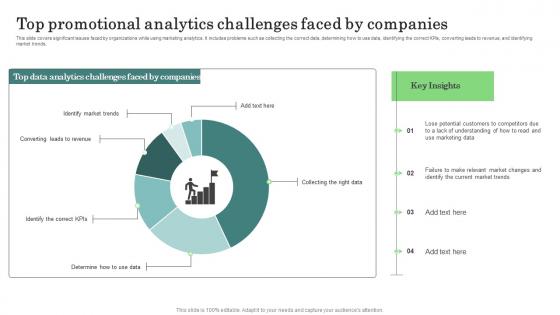
Major Promotional Analytics Future Trends Top Promotional Analytics Ideas Pdf
This slide covers significant issues faced by organizations while using marketing analytics. It includes problems such as collecting the correct data, determining how to use data, identifying the correct KPIs, converting leads to revenue, and identifying market trends. qSlidegeeks has constructed Major Promotional Analytics Future Trends Top Promotional Analytics Ideas Pdf after conducting extensive research and examination. These presentation templates are constantly being generated and modified based on user preferences and critiques from editors. Here, you will find the most attractive templates for a range of purposes while taking into account ratings and remarks from users regarding the content. This is an excellent jumping off point to explore our content and will give new users an insight into our top notch PowerPoint Templates. This slide covers significant issues faced by organizations while using marketing analytics. It includes problems such as collecting the correct data, determining how to use data, identifying the correct KPIs, converting leads to revenue, and identifying market trends.

Graph Illustrating Impact Of Prescriptive Analytics Data Analytics SS V
This slide showcases graph highlighting impact analysis of prescriptive analytics on businesses via use of major performance indicators. It provides information total revenue, inventory levels and labour costs with key insights.Take your projects to the next level with our ultimate collection of Graph Illustrating Impact Of Prescriptive Analytics Data Analytics SS V. Slidegeeks has designed a range of layouts that are perfect for representing task or activity duration, keeping track of all your deadlines at a glance. Tailor these designs to your exact needs and give them a truly corporate look with your own brand colors they will make your projects stand out from the rest This slide showcases graph highlighting impact analysis of prescriptive analytics on businesses via use of major performance indicators. It provides information total revenue, inventory levels and labour costs with key insights.

Segmentation Of Global Prescriptive Analytics Market Data Analytics SS V
This slide provides an overview of market segmentation of prescriptive analytics at a global level. It covers segmentation analysis based on region, data type, component and deployment with key takeaways.Take your projects to the next level with our ultimate collection of Segmentation Of Global Prescriptive Analytics Market Data Analytics SS V. Slidegeeks has designed a range of layouts that are perfect for representing task or activity duration, keeping track of all your deadlines at a glance. Tailor these designs to your exact needs and give them a truly corporate look with your own brand colors they will make your projects stand out from the rest This slide provides an overview of market segmentation of prescriptive analytics at a global level. It covers segmentation analysis based on region, data type, component and deployment with key takeaways.
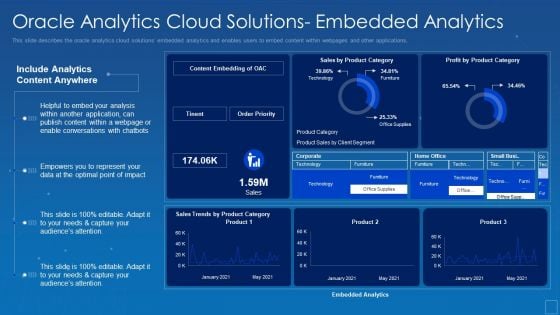
Oracle Analytics Cloud Solutions Embedded Analytics Elements PDF
This slide describes the oracle analytics cloud solutions embedded analytics and enables users to embed content within webpages and other applications. Deliver an awe inspiring pitch with this creative oracle analytics cloud solutions embedded analytics elements pdf bundle. Topics like application, conversations, optimal, empowers, analytics can be discussed with this completely editable template. It is available for immediate download depending on the needs and requirements of the user.
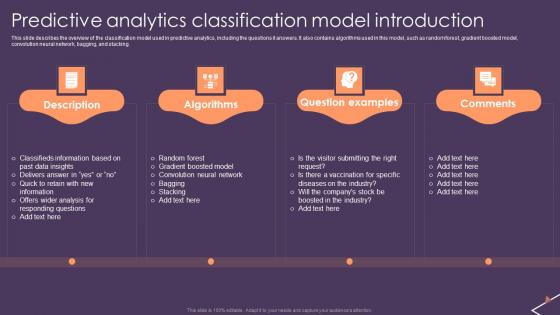
Predictive Analytics For Empowering Predictive Analytics Classification Model Information Pdf
This slide describes the overview of the classification model used in predictive analytics, including the questions it answers. It also contains algorithms used in this model, such as random forest, gradient boosted model, convolution neural network, bagging, and stacking. If you are looking for a format to display your unique thoughts, then the professionally designed Predictive Analytics For Empowering Predictive Analytics Classification Model Information Pdf is the one for you. You can use it as a Google Slides template or a PowerPoint template. Incorporate impressive visuals, symbols, images, and other charts. Modify or reorganize the text boxes as you desire. Experiment with shade schemes and font pairings. Alter, share or cooperate with other people on your work. Download Predictive Analytics For Empowering Predictive Analytics Classification Model Information Pdf and find out how to give a successful presentation. Present a perfect display to your team and make your presentation unforgettable. This slide describes the overview of the classification model used in predictive analytics, including the questions it answers. It also contains algorithms used in this model, such as random forest, gradient boosted model, convolution neural network, bagging, and stacking.

Prescriptive Analytics Software Tool Tableau Data Analytics SS V
This slide provides overview of Tableau as a data analytics tools providing data visualization features. It covers details of Tableau regarding description, features and pricing plans.Retrieve professionally designed Prescriptive Analytics Software Tool Tableau Data Analytics SS V to effectively convey your message and captivate your listeners. Save time by selecting pre-made slideshows that are appropriate for various topics, from business to educational purposes. These themes come in many different styles, from creative to corporate, and all of them are easily adjustable and can be edited quickly. Access them as PowerPoint templates or as Google Slides themes. You do not have to go on a hunt for the perfect presentation because Slidegeeks got you covered from everywhere. This slide provides overview of Tableau as a data analytics tools providing data visualization features. It covers details of Tableau regarding description, features and pricing plans.
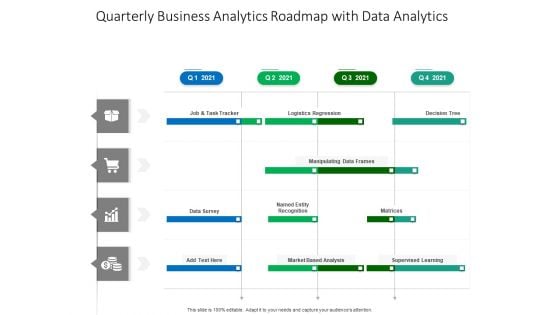
Quarterly Business Analytics Roadmap With Data Analytics Brochure
We present our quarterly business analytics roadmap with data analytics brochure. This PowerPoint layout is easy-to-edit so you can change the font size, font type, color, and shape conveniently. In addition to this, the PowerPoint layout is Google Slides compatible, so you can share it with your audience and give them access to edit it. Therefore, download and save this well-researched quarterly business analytics roadmap with data analytics brochure in different formats like PDF, PNG, and JPG to smoothly execute your business plan.
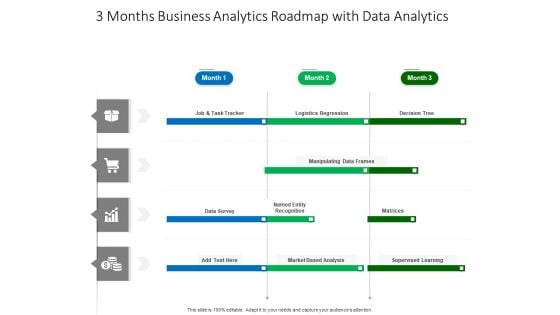
3 Months Business Analytics Roadmap With Data Analytics Structure
We present our 3 months business analytics roadmap with data analytics structure. This PowerPoint layout is easy-to-edit so you can change the font size, font type, color, and shape conveniently. In addition to this, the PowerPoint layout is Google Slides compatible, so you can share it with your audience and give them access to edit it. Therefore, download and save this well-researched 3 months business analytics roadmap with data analytics structure in different formats like PDF, PNG, and JPG to smoothly execute your business plan.
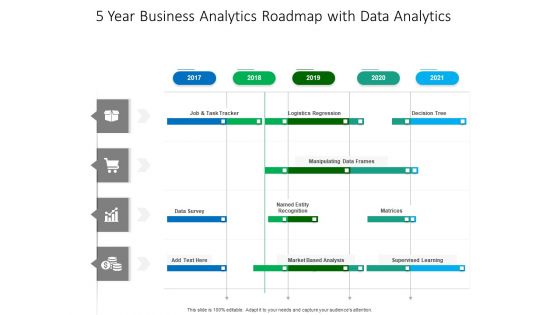
5 Year Business Analytics Roadmap With Data Analytics Sample
We present our 5 year business analytics roadmap with data analytics sample. This PowerPoint layout is easy-to-edit so you can change the font size, font type, color, and shape conveniently. In addition to this, the PowerPoint layout is Google Slides compatible, so you can share it with your audience and give them access to edit it. Therefore, download and save this well-researched 5 year business analytics roadmap with data analytics sample in different formats like PDF, PNG, and JPG to smoothly execute your business plan.
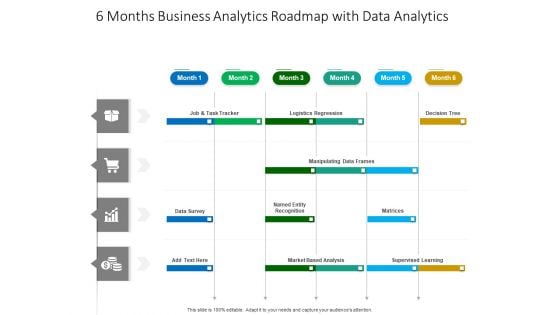
6 Months Business Analytics Roadmap With Data Analytics Brochure
We present our 6 months business analytics roadmap with data analytics brochure. This PowerPoint layout is easy-to-edit so you can change the font size, font type, color, and shape conveniently. In addition to this, the PowerPoint layout is Google Slides compatible, so you can share it with your audience and give them access to edit it. Therefore, download and save this well-researched 6 months business analytics roadmap with data analytics brochure in different formats like PDF, PNG, and JPG to smoothly execute your business plan.
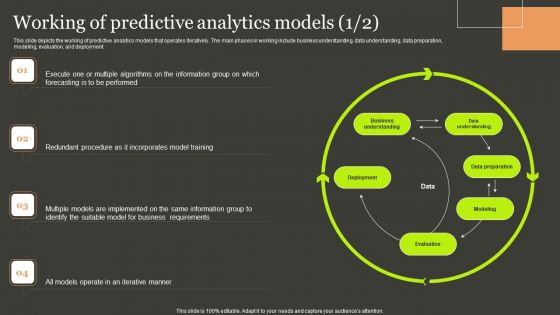
Predictive Analytics Methods Working Of Predictive Analytics Models Summary PDF
This slide depicts the working of predictive analytics models that operates iteratively. The main phases in working include business understanding, data understanding, data preparation, modeling, evaluation, and deployment. Find highly impressive Predictive Analytics Methods Working Of Predictive Analytics Models Summary PDF on Slidegeeks to deliver a meaningful presentation. You can save an ample amount of time using these presentation templates. No need to worry to prepare everything from scratch because Slidegeeks experts have already done a huge research and work for you. You need to download Predictive Analytics Methods Working Of Predictive Analytics Models Summary PDF for your upcoming presentation. All the presentation templates are 100 percent editable and you can change the color and personalize the content accordingly. Download now.
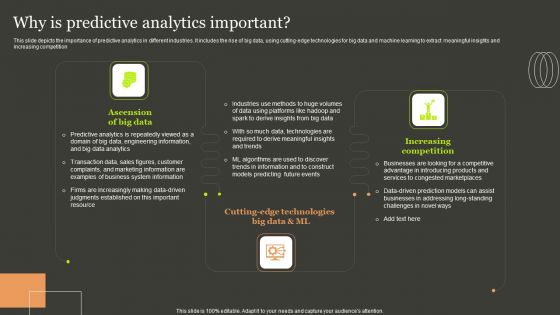
Predictive Analytics Methods Why Is Predictive Analytics Important Ideas PDF
This slide depicts the importance of predictive analytics in different industries. It includes the rise of big data, using cutting-edge technologies for big data and machine learning to extract meaningful insights and increasing competition. Whether you have daily or monthly meetings, a brilliant presentation is necessary. Predictive Analytics Methods Why Is Predictive Analytics Important Ideas PDF can be your best option for delivering a presentation. Represent everything in detail using Predictive Analytics Methods Why Is Predictive Analytics Important Ideas PDF and make yourself stand out in meetings. The template is versatile and follows a structure that will cater to your requirements. All the templates prepared by Slidegeeks are easy to download and edit. Our research experts have taken care of the corporate themes as well. So, give it a try and see the results.
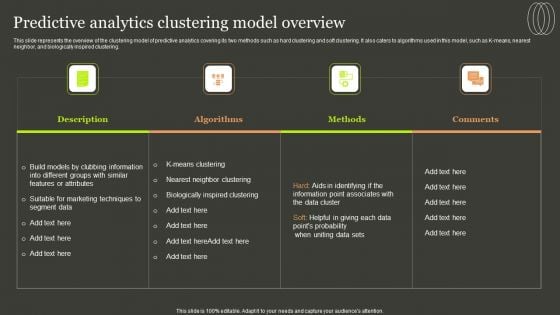
Predictive Analytics Methods Predictive Analytics Clustering Model Overview Template PDF
This slide represents the overview of the clustering model of predictive analytics covering its two methods such as hard clustering and soft clustering. It also caters to algorithms used in this model, such as K-means, nearest neighbor, and biologically inspired clustering. Whether you have daily or monthly meetings, a brilliant presentation is necessary. Predictive Analytics Methods Predictive Analytics Clustering Model Overview Template PDF can be your best option for delivering a presentation. Represent everything in detail using Predictive Analytics Methods Predictive Analytics Clustering Model Overview Template PDF and make yourself stand out in meetings. The template is versatile and follows a structure that will cater to your requirements. All the templates prepared by Slidegeeks are easy to download and edit. Our research experts have taken care of the corporate themes as well. So, give it a try and see the results.
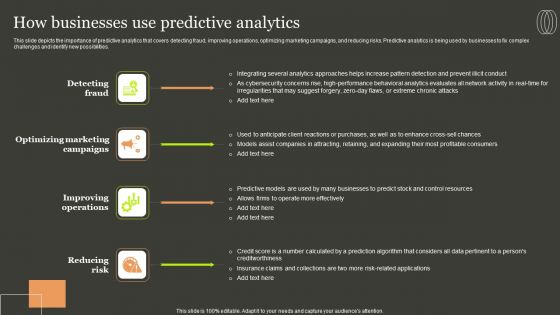
Predictive Analytics Methods How Businesses Use Predictive Analytics Background PDF
This slide depicts the importance of predictive analytics that covers detecting fraud, improving operations, optimizing marketing campaigns, and reducing risks. Predictive analytics is being used by businesses to fix complex challenges and identify new possibilities. Do you know about Slidesgeeks Predictive Analytics Methods How Businesses Use Predictive Analytics Background PDF These are perfect for delivering any kind od presentation. Using it, create PowerPoint presentations that communicate your ideas and engage audiences. Save time and effort by using our pre designed presentation templates that are perfect for a wide range of topic. Our vast selection of designs covers a range of styles, from creative to business, and are all highly customizable and easy to edit. Download as a PowerPoint template or use them as Google Slides themes.
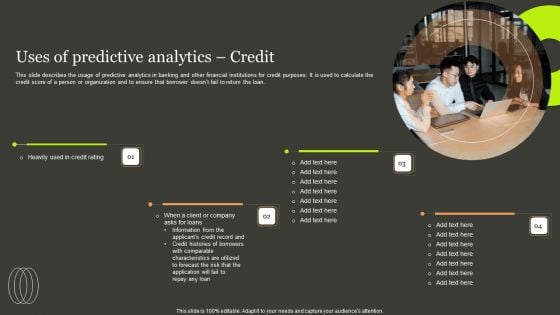
Predictive Analytics Methods Uses Of Predictive Analytics Credit Diagrams PDF
This slide describes the usage of predictive analytics in banking and other financial institutions for credit purposes. It is used to calculate the credit score of a person or organization and to ensure that borrower doesnt fail to return the loan. Slidegeeks is here to make your presentations a breeze with Predictive Analytics Methods Uses Of Predictive Analytics Credit Diagrams PDF With our easy to use and customizable templates, you can focus on delivering your ideas rather than worrying about formatting. With a variety of designs to choose from, you are sure to find one that suits your needs. And with animations and unique photos, illustrations, and fonts, you can make your presentation pop. So whether you are giving a sales pitch or presenting to the board, make sure to check out Slidegeeks first.
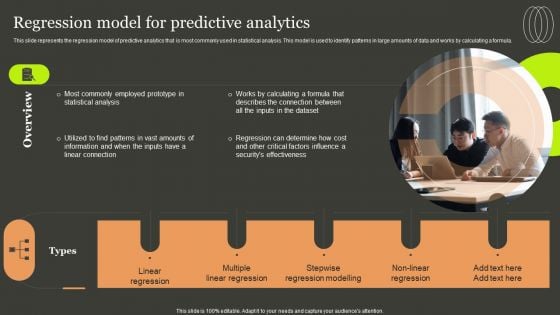
Predictive Analytics Methods Regression Model For Predictive Analytics Template PDF
This slide represents the regression model of predictive analytics that is most commonly used in statistical analysis. This model is used to identify patterns in large amounts of data and works by calculating a formula. Retrieve professionally designed Predictive Analytics Methods Regression Model For Predictive Analytics Template PDF to effectively convey your message and captivate your listeners. Save time by selecting pre made slideshows that are appropriate for various topics, from business to educational purposes. These themes come in many different styles, from creative to corporate, and all of them are easily adjustable and can be edited quickly. Access them as PowerPoint templates or as Google Slides themes. You do not have to go on a hunt for the perfect presentation because Slidegeeks got you covered from everywhere.
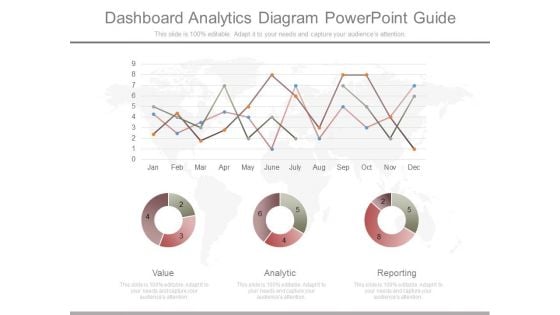
Dashboard Analytics Diagram Powerpoint Guide
This is a dashboard analytics diagram powerpoint guide. This is a three stage process. The stages in this process are value, analytic, reporting.
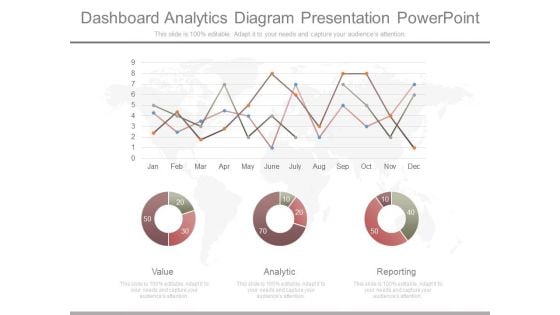
Dashboard Analytics Diagram Presentation Powerpoint
This is a dashboard analytics diagram presentation powerpoint. This is a three stage process. The stages in this process are value, analytic, reporting.
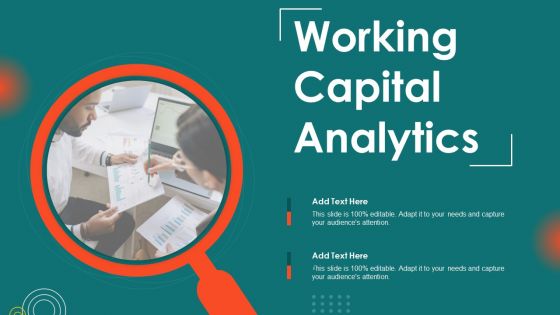
Working Capital Analytics Template PDF
Presenting Working Capital Analytics Template PDF to dispense important information. This template comprises two stages. It also presents valuable insights into the topics including Working Capital Analytics This is a completely customizable PowerPoint theme that can be put to use immediately. So, download it and address the topic impactfully.
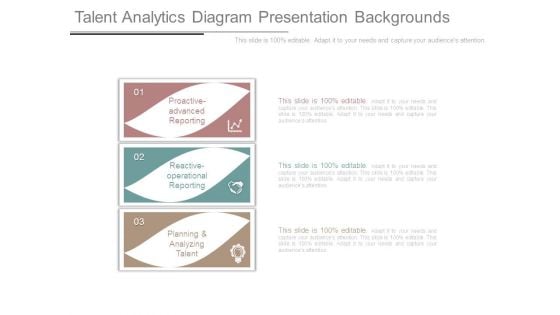
Talent Analytics Diagram Presentation Backgrounds
This is a talent analytics diagram presentation backgrounds. This is a three stage process. The stages in this process are proactive advanced reporting, reactive operational reporting, planning and analyzing talent.
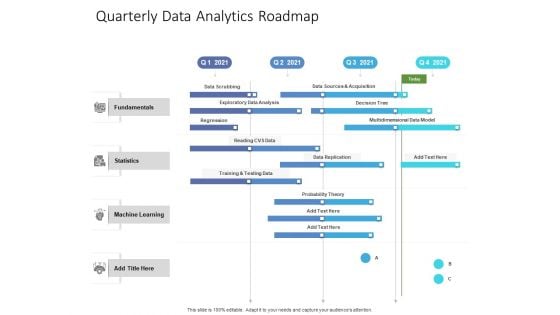
Quarterly Data Analytics Roadmap Pictures
Introducing our quarterly data analytics roadmap pictures. This PPT presentation is Google Slides compatible, therefore, you can share it easily with the collaborators for measuring the progress. Also, the presentation is available in both standard screen and widescreen aspect ratios. So edit the template design by modifying the font size, font type, color, and shapes as per your requirements. As this PPT design is fully editable it can be presented in PDF, JPG and PNG formats.

Types Of Data Monitored In Product Analytics Product Analytics Implementation Data Analytics V
This slide outlines major categories of data tracked using product analytics aimed at improving performance to increase business revenue. It covers categories such as event tracking as well as properties Are you searching for a Types Of Data Monitored In Product Analytics Product Analytics Implementation Data Analytics V that is uncluttered, straightforward, and original Its easy to edit, and you can change the colors to suit your personal or business branding. For a presentation that expresses how much effort you have put in, this template is ideal With all of its features, including tables, diagrams, statistics, and lists, its perfect for a business plan presentation. Make your ideas more appealing with these professional slides. Download Types Of Data Monitored In Product Analytics Product Analytics Implementation Data Analytics V from Slidegeeks today. This slide outlines major categories of data tracked using product analytics aimed at improving performance to increase business revenue. It covers categories such as event tracking as well as properties

Global Product Analytics Market Snapshot Product Analytics Implementation Data Analytics V
This slide showcase a graphical representation global product analytics market. It includes present and forecasted values of advanced analytics usage globally with key takeaways on market situationComing up with a presentation necessitates that the majority of the effort goes into the content and the message you intend to convey. The visuals of a PowerPoint presentation can only be effective if it supplements and supports the story that is being told. Keeping this in mind our experts created Global Product Analytics Market Snapshot Product Analytics Implementation Data Analytics V to reduce the time that goes into designing the presentation. This way, you can concentrate on the message while our designers take care of providing you with the right template for the situation. This slide showcase a graphical representation global product analytics market. It includes present and forecasted values of advanced analytics usage globally with key takeaways on market situation

Product Analytics Training Plan For Employees Product Analytics Implementation Data Analytics V
This slide outlines training plan aimed at helping employees learn the basics of product analytics to streamline its usage in the business enterprises. It covers details on training module, mode of training, training time slots with trainer name.Whether you have daily or monthly meetings, a brilliant presentation is necessary. Product Analytics Training Plan For Employees Product Analytics Implementation Data Analytics V can be your best option for delivering a presentation. Represent everything in detail using Product Analytics Training Plan For Employees Product Analytics Implementation Data Analytics V and make yourself stand out in meetings. The template is versatile and follows a structure that will cater to your requirements. All the templates prepared by Slidegeeks are easy to download and edit. Our research experts have taken care of the corporate themes as well. So, give it a try and see the results. This slide outlines training plan aimed at helping employees learn the basics of product analytics to streamline its usage in the business enterprises. It covers details on training module, mode of training, training time slots with trainer name.

Product Analytics KPI Dashboard For Lead Generation Product Analytics Implementation Data Analytics V
This slide illustrates a dashboard to monitor the lead generation on website page using product analytics aimed at making necessary improvements. It covers insights regarding analysis of lead conversions, event retention rate and page views.Do you have to make sure that everyone on your team knows about any specific topic I yes, then you should give Product Analytics KPI Dashboard For Lead Generation Product Analytics Implementation Data Analytics V a try. Our experts have put a lot of knowledge and effort into creating this impeccable Product Analytics KPI Dashboard For Lead Generation Product Analytics Implementation Data Analytics V. You can use this template for your upcoming presentations, as the slides are perfect to represent even the tiniest detail. You can download these templates from the Slidegeeks website and these are easy to edit. So grab these today This slide illustrates a dashboard to monitor the lead generation on website page using product analytics aimed at making necessary improvements. It covers insights regarding analysis of lead conversions, event retention rate and page views

Implementation Timeline Of Product Analytics In Organisation Product Analytics Implementation Data Analytics V
This slide illustrates a weekly timeline of activities undertaken while implementing product analytics in businesses to streamline operations. It covers activities under four heads choose simple use case, implement data governance, democratize product analytics and build expe4rimentataion culture Retrieve professionally designed Implementation Timeline Of Product Analytics In Organisation Product Analytics Implementation Data Analytics V to effectively convey your message and captivate your listeners. Save time by selecting pre-made slideshows that are appropriate for various topics, from business to educational purposes. These themes come in many different styles, from creative to corporate, and all of them are easily adjustable and can be edited quickly. Access them as PowerPoint templates or as Google Slides themes. You do not have to go on a hunt for the perfect presentation because Slidegeeks got you covered from everywhere. This slide illustrates a weekly timeline of activities undertaken while implementing product analytics in businesses to streamline operations. It covers activities under four heads choose simple use case, implement data governance, democratize product analytics and build expe4rimentataion culture

Product Analytics Dashboard To Track Engagement Product Analytics Implementation Data Analytics V
This slide illustrates a dashboard to monitor customer engagement on company website by leveraging product analytics tools aimed at making necessary improvements. It covers insights regarding active monthly users, new users, total completed purchases, screen views, average duration of session, etc Want to ace your presentation in front of a live audience Our Product Analytics Dashboard To Track Engagement Product Analytics Implementation Data Analytics V can help you do that by engaging all the users towards you. Slidegeeks experts have put their efforts and expertise into creating these impeccable powerpoint presentations so that you can communicate your ideas clearly. Moreover, all the templates are customizable, and easy-to-edit and downloadable. Use these for both personal and commercial use. This slide illustrates a dashboard to monitor customer engagement on company website by leveraging product analytics tools aimed at making necessary improvements. It covers insights regarding active monthly users, new users, total completed purchases, screen views, average duration of session, etc

Utilization Of Product Analytics By Various Business Product Analytics Implementation Data Analytics V
This slide provides an overview of business positions leveraging product analytics to improve their business operations. It covers use of product analytics by the following positions product manager, UX designers, marketers, customer success team, executives and business intelligence analyst Retrieve professionally designed Utilization Of Product Analytics By Various Business Product Analytics Implementation Data Analytics V to effectively convey your message and captivate your listeners. Save time by selecting pre-made slideshows that are appropriate for various topics, from business to educational purposes. These themes come in many different styles, from creative to corporate, and all of them are easily adjustable and can be edited quickly. Access them as PowerPoint templates or as Google Slides themes. You do not have to go on a hunt for the perfect presentation because Slidegeeks got you covered from everywhere. This slide provides an overview of business positions leveraging product analytics to improve their business operations. It covers use of product analytics by the following positions product manager, UX designers, marketers, customer success team, executives and business intelligence analyst

Key Metrics Used To Track Product Analytics Product Analytics Implementation Data Analytics V
This slide outlines major metrics used by businesses to analyse product performance aimed at making necessary improvements. It covers key metrics such as engagement, retention, customer lifetime value, number of crashes and feature adoption rate with benefits Do you know about Slidesgeeks Key Metrics Used To Track Product Analytics Product Analytics Implementation Data Analytics V These are perfect for delivering any kind od presentation. Using it, create PowerPoint presentations that communicate your ideas and engage audiences. Save time and effort by using our pre-designed presentation templates that are perfect for a wide range of topic. Our vast selection of designs covers a range of styles, from creative to business, and are all highly customizable and easy to edit. Download as a PowerPoint template or use them as Google Slides themes. This slide outlines major metrics used by businesses to analyse product performance aimed at making necessary improvements. It covers key metrics such as engagement, retention, customer lifetime value, number of crashes and feature adoption rate with benefits
Icons Slide For Optimizing Decision Making The Power Of Prescriptive Analytics Data Analytics SS V
Introducing our well designed Icons Slide For Optimizing Decision Making The Power Of Prescriptive Analytics Data Analytics SS V set of slides. The slide displays editable icons to enhance your visual presentation. The icons can be edited easily. So customize according to your business to achieve a creative edge. Download and share it with your audience. Our Icons Slide For Optimizing Decision Making The Power Of Prescriptive Analytics Data Analytics SS V are topically designed to provide an attractive backdrop to any subject. Use them to look like a presentation pro.
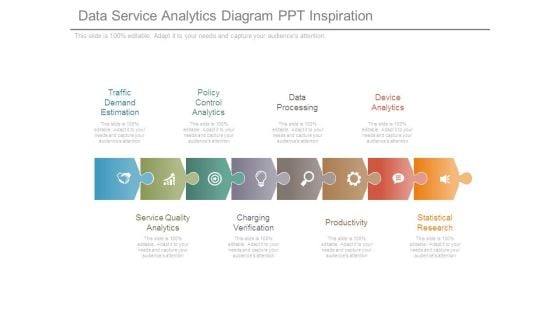
Data Service Analytics Diagram Ppt Inspiration
This is a data service analytics diagram ppt inspiration. This is a eight stage process. The stages in this process are traffic demand estimation, policy control analytics, data processing, device analytics, service quality analytics, charging verification, productivity, statistical research.
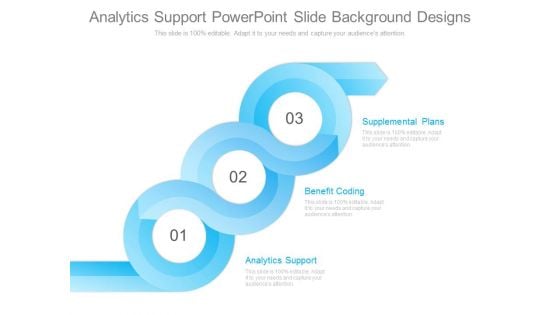
Analytics Support Powerpoint Slide Background Designs
This is a analytics support powerpoint slide background designs. This is a three stage process. The stages in this process are supplemental plans, benefit coding, analytics support.
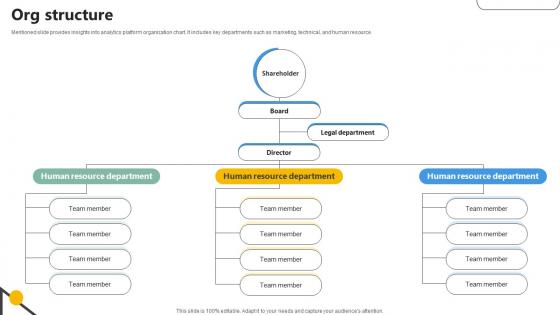
Org Structure Analytics Company Investor Funding Elevator
Mentioned slide provides insights into analytics platform organization chart. It includes key departments such as marketing, technical, and human resource.Find highly impressive Org Structure Analytics Company Investor Funding Elevator on Slidegeeks to deliver a meaningful presentation. You can save an ample amount of time using these presentation templates. No need to worry to prepare everything from scratch because Slidegeeks experts have already done a huge research and work for you. You need to download Org Structure Analytics Company Investor Funding Elevator for your upcoming presentation. All the presentation templates are 100 percent editable and you can change the color and personalize the content accordingly. Download now Mentioned slide provides insights into analytics platform organization chart. It includes key departments such as marketing, technical, and human resource.
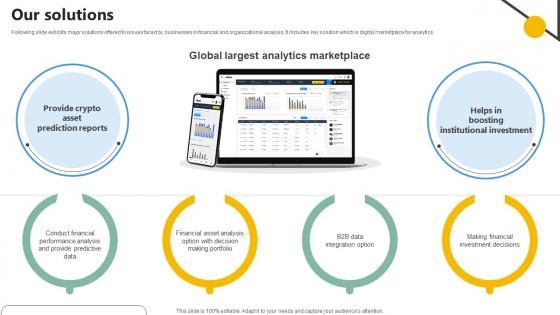
Our Solutions Analytics Company Investor Funding Elevator
Following slide exhibits major solutions offered to issues faced by businesses in financial and organizational analysis. It includes key solution which is digital marketplace for analytics. If you are looking for a format to display your unique thoughts, then the professionally designed Our Solutions Analytics Company Investor Funding Elevator is the one for you. You can use it as a Google Slides template or a PowerPoint template. Incorporate impressive visuals, symbols, images, and other charts. Modify or reorganize the text boxes as you desire. Experiment with shade schemes and font pairings. Alter, share or cooperate with other people on your work. Download Our Solutions Analytics Company Investor Funding Elevator and find out how to give a successful presentation. Present a perfect display to your team and make your presentation unforgettable. Following slide exhibits major solutions offered to issues faced by businesses in financial and organizational analysis. It includes key solution which is digital marketplace for analytics.
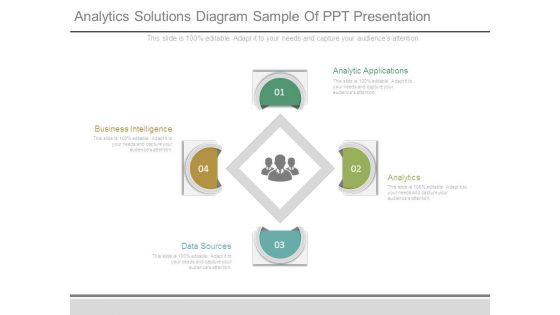
Analytics Solutions Diagram Sample Of Ppt Presentation
This is a analytics solutions diagram sample of ppt presentation. This is a four stage process. The stages in this process are analytic applications, analytics, data sources, business intelligence.
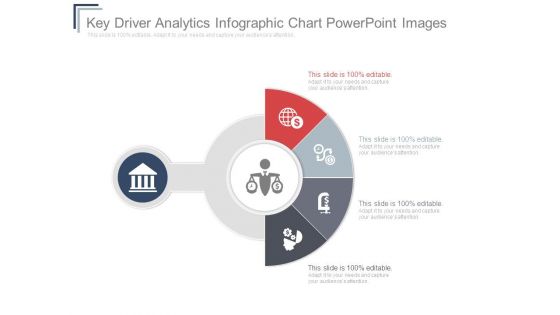
Key Driver Analytics Infographic Chart Powerpoint Images
This is a key driver analytics infographic chart powerpoint images. This is a five stage process. The stages in this process are business, marketing, semicircle, icons, strategy.
Key Driver Analytics Ppt PowerPoint Presentation Designs
This is a key driver analytics ppt powerpoint presentation designs. This is a four stage process. The stages in this process are business, strategy, marketing, analysis, success, icons.
Key Driver Analytics Ppt PowerPoint Presentation Visuals
This is a key driver analytics ppt powerpoint presentation visuals. This is a four stage process. The stages in this process are icons, management, currency, technology, business.

Key Driver Analytics Ppt PowerPoint Presentation Microsoft
This is a key driver analytics ppt powerpoint presentation microsoft. This is a five stage process. The stages in this process are icons, business, marketing, strategy, success.
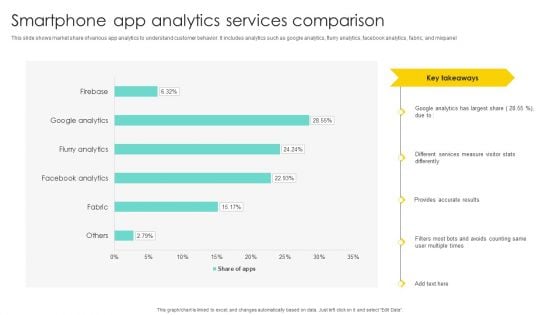
Smartphone App Analytics Services Comparison Brochure PDF
This slide shows market share of various app analytics to understand customer behavior. It includes analytics such as google analytics, flurry analytics, facebook analytics, fabric, and mixpanel. Pitch your topic with ease and precision using this Smartphone App Analytics Services Comparison Brochure PDF. This layout presents information on Different Services Measure, Visitor Stats Differently, Provides Accurate Results. It is also available for immediate download and adjustment. So, changes can be made in the color, design, graphics or any other component to create a unique layout.
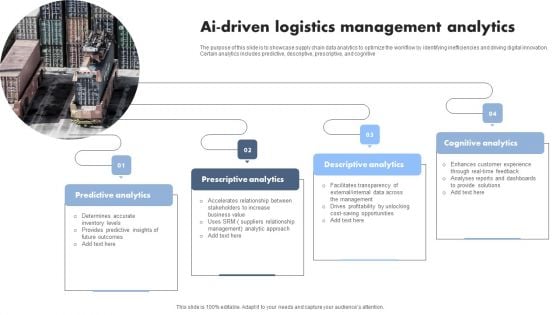
AI Driven Logistics Management Analytics Professional PDF
The purpose of this slide is to showcase supply chain data analytics to optimize the workflow by identifying inefficiencies and driving digital innovation. Certain analytics includes predictive, descriptive, prescriptive, and cognitive. Presenting AI Driven Logistics Management Analytics Professional PDF to dispense important information. This template comprises four stages. It also presents valuable insights into the topics including Predictive Analytics, Prescriptive Analytics, Descriptive Analytics. This is a completely customizable PowerPoint theme that can be put to use immediately. So, download it and address the topic impactfully.
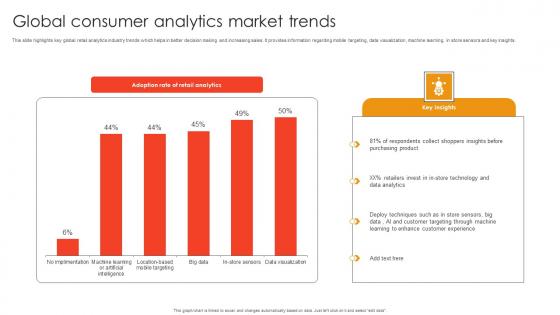
Global Consumer Analytics Market Trends Template Pdf
This slide highlights key global retail analytics industry trends which helps in better decision making and increasing sales. It provides information regarding mobile targeting, data visualization, machine learning, in store sensors and key insights. Pitch your topic with ease and precision using this Global Consumer Analytics Market Trends Template Pdf. This layout presents information on Respondents Collect Shoppers, Retailers Invest Store, Deploy Techniques Store Sensors. It is also available for immediate download and adjustment. So, changes can be made in the color, design, graphics or any other component to create a unique layout. This slide highlights key global retail analytics industry trends which helps in better decision making and increasing sales. It provides information regarding mobile targeting, data visualization, machine learning, in store sensors and key insights.
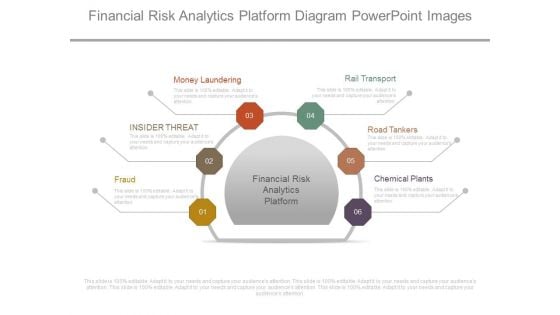
Financial Risk Analytics Platform Diagram Powerpoint Images
This is a financial risk analytics platform diagram powerpoint images. This is a six stage process. The stages in this process are money laundering, insider threat, fraud, rail transport, road tankers, chemical plants, financial risk analytics platform.
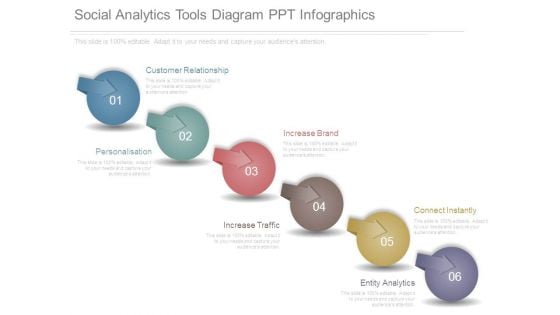
Social Analytics Tools Diagram Ppt Infographics
This is a social analytics tools diagram ppt infographics. This is a six stage process. The stages in this process are customer relationship, personalisation, increase brand, increase traffic, connect instantly, entity analytics.
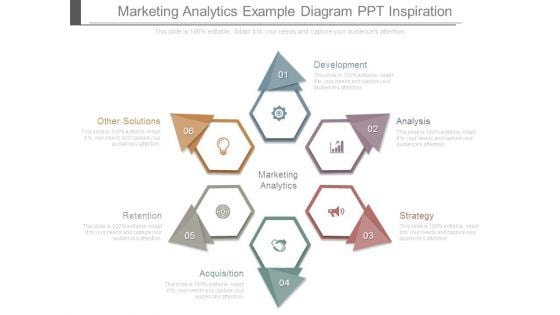
Marketing Analytics Example Diagram Ppt Inspiration
This is a marketing analytics example diagram ppt inspiration. This is a six stage process. The stages in this process are marketing analytics, development, analysis, strategy, acquisition, retention, other solutions.
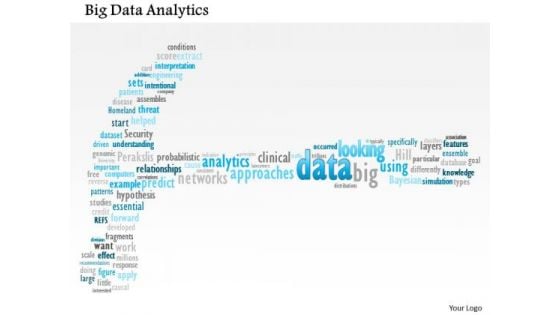
Business Framework Big Data Analytics PowerPoint Presentation
This unique power point diagram slide has been crafted with big data analytics. This data analytics is used to improve predictions and support decision making. Use this image slide for big data analysis related presentations.
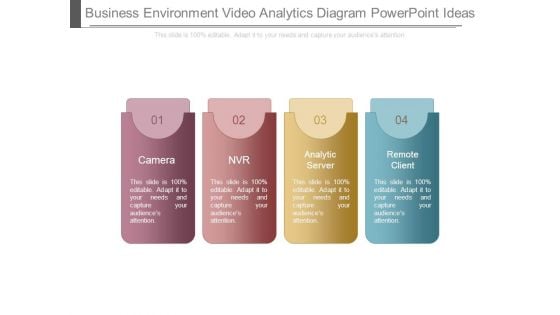
Business Environment Video Analytics Diagram Powerpoint Ideas
This is a business environment video analytics diagram powerpoint ideas. This is a four stage process. The stages in this process are camera, nvr, analytic server, remote client.
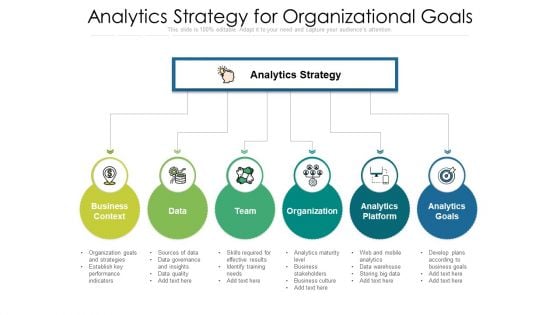
Analytics Strategy For Organizational Goals Clipart PDF
Presenting analytics strategy for organizational goals clipart pdf. to dispense important information. This template comprises six stages. It also presents valuable insights into the topics including business context, organization, analytics platform, analytics goals. This is a completely customizable PowerPoint theme that can be put to use immediately. So, download it and address the topic impactfully.
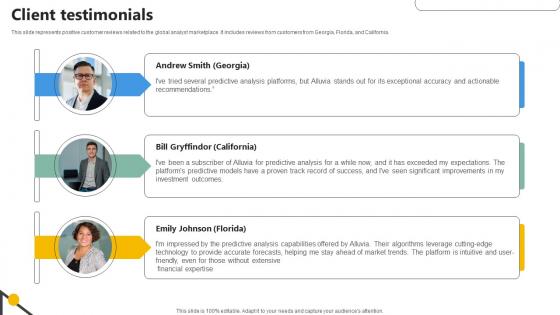
Client Testimonials Analytics Company Investor Funding Elevator
This slide represents positive customer reviews related to the global analyst marketplace. It includes reviews from customers from Georgia, Florida, and California.Whether you have daily or monthly meetings, a brilliant presentation is necessary. Client Testimonials Analytics Company Investor Funding Elevator can be your best option for delivering a presentation. Represent everything in detail using Client Testimonials Analytics Company Investor Funding Elevator and make yourself stand out in meetings. The template is versatile and follows a structure that will cater to your requirements. All the templates prepared by Slidegeeks are easy to download and edit. Our research experts have taken care of the corporate themes as well. So, give it a try and see the results. This slide represents positive customer reviews related to the global analyst marketplace. It includes reviews from customers from Georgia, Florida, and California.

Exit Strategy Analytics Company Investor Funding Elevator
Mentioned slide provides information about the exit strategy of global analyst platform to reduce risk. It includes strategies such as management mergers and acquisitions, Initial Public Offer, and liquidation.Are you searching for a Exit Strategy Analytics Company Investor Funding Elevator that is uncluttered, straightforward, and original Its easy to edit, and you can change the colors to suit your personal or business branding. For a presentation that expresses how much effort you have put in, this template is ideal With all of its features, including tables, diagrams, statistics, and lists, its perfect for a business plan presentation. Make your ideas more appealing with these professional slides. Download Exit Strategy Analytics Company Investor Funding Elevator from Slidegeeks today. Mentioned slide provides information about the exit strategy of global analyst platform to reduce risk. It includes strategies such as management mergers and acquisitions, Initial Public Offer, and liquidation.
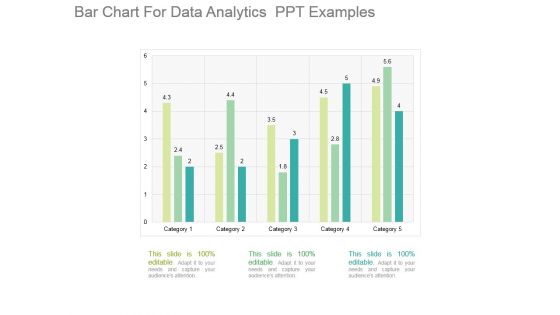
Bar Chart For Data Analytics Ppt Examples
This is a bar chart for data analytics ppt examples. This is a five stage process. The stages in this process are category.
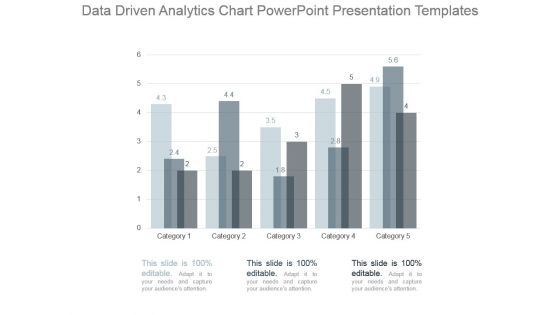
Data Driven Analytics Chart Powerpoint Presentation Templates
This is a data driven analytics chart powerpoint presentation templates. This is a five stage process. The stages in this process are category.
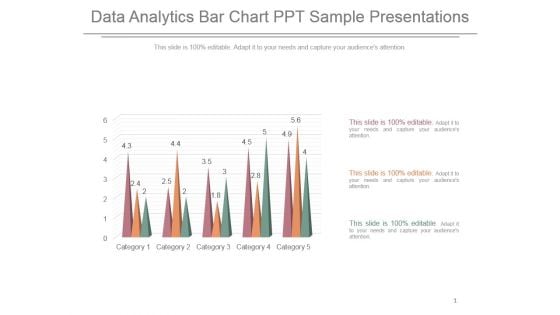
Data Analytics Bar Chart Ppt Sample Presentations
This is a data analytics bar chart ppt sample presentations. This is a five stage process. The stages in this process are category.
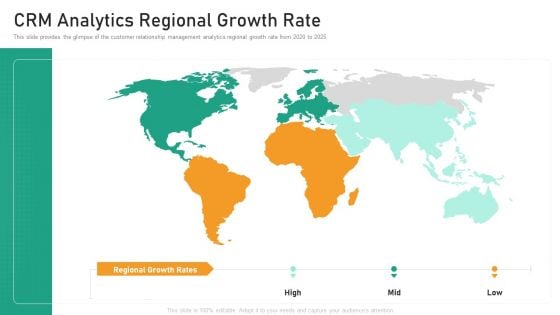
CRM Analytics Regional Growth Rate Diagrams PDF
This slide provides the glimpse of the customer relationship management analytics regional growth rate from 2020 to 2025.This is a crm analytics regional growth rate diagrams pdf template with various stages. Focus and dispense information on three stages using this creative set, that comes with editable features. It contains large content boxes to add your information on topics like crm analytics regional growth rate. You can also showcase facts, figures, and other relevant content using this PPT layout. Grab it now.
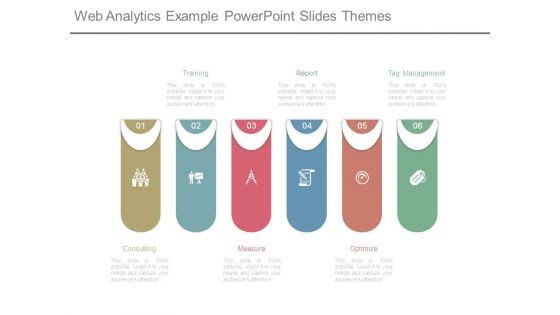
Web Analytics Example Powerpoint Slides Themes
This is a web analytics example powerpoint slides themes. This is a six stage process. The stages in this process are consulting, training, measure, report, optimize, tag management.
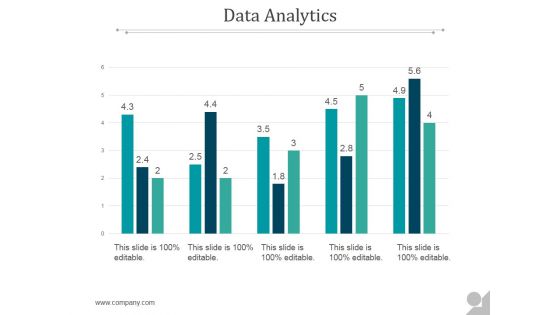
Data Analytics Ppt PowerPoint Presentation Themes
This is a data analytics ppt powerpoint presentation themes. This is a five stage process. The stages in this process are business, marketing, presentation, data analyst, management.
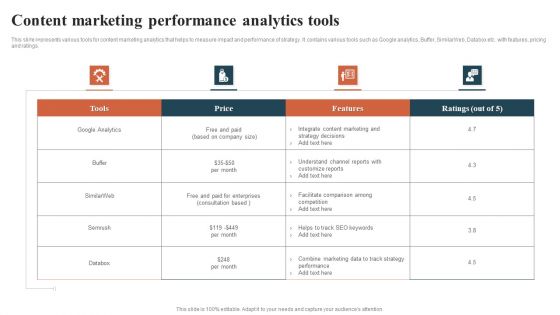
Content Marketing Performance Analytics Tools Themes PDF
This slide represents various tools for content marketing analytics that helps to measure impact and performance of strategy. It contains various tools such as Google analytics, Buffer, SimilarWeb, Databox etc. with features, pricing and ratings. Showcasing this set of slides titled Content Marketing Performance Analytics Tools Themes PDF. The topics addressed in these templates are Content Marketing, Performance Analytics Tools. All the content presented in this PPT design is completely editable. Download it and make adjustments in color, background, font etc. as per your unique business setting.
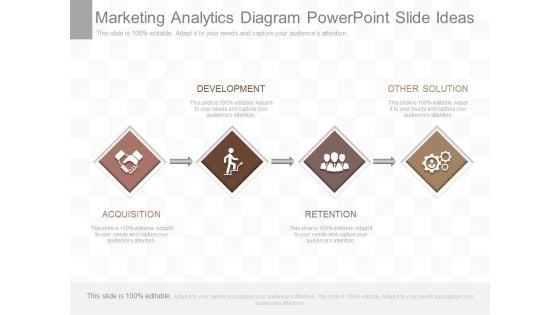
Marketing Analytics Diagram Powerpoint Slide Ideas
This is a marketing analytics diagram powerpoint slide ideas. This is a four stage process. The stages in this process are development, other solution, acquisition, retention.
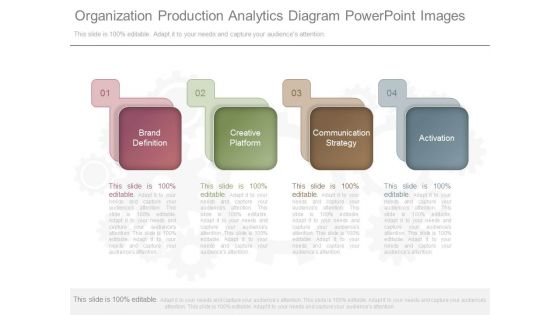
Organization Production Analytics Diagram Powerpoint Images
This is a organization production analytics diagram powerpoint images. This is a four stage process. The stages in this process are brand definition, creative platform, communication strategy, activation.
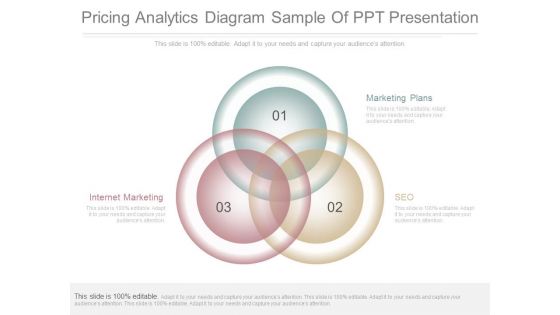
Pricing Analytics Diagram Sample Of Ppt Presentation
This is a pricing analytics diagram sample of ppt presentation. This is a three stage process. The stages in this process are internet marketing, marketing plans, seo.
Cloud Analytics Strategy Sample Diagram Powerpoint Guide
This is a cloud analytics strategy sample diagram powerpoint guide. This is a one stage process. The stages in this process are business, marketing, thought, presentation, strategy.
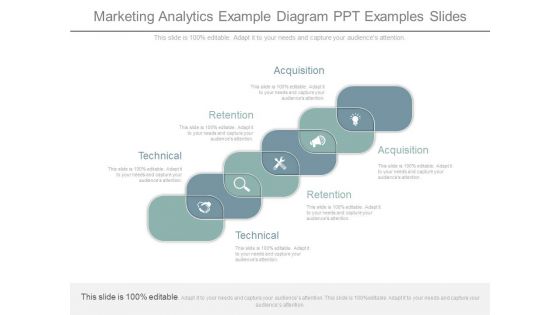
Marketing Analytics Example Diagram Ppt Examples Slides
This is a marketing analytics example diagram ppt examples slides. This is a six stage process. The stages in this process are acquisition, retention, technical.

Trade Promotion Analytics Diagram Powerpoint Layout
This is a trade promotion analytics diagram powerpoint layout. This is a six stage process. The stages in this process are plan, regression, perform, evaluate, settlement, optimization.
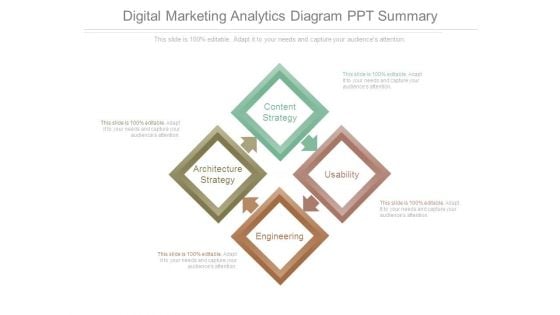
Digital Marketing Analytics Diagram Ppt Summary
This is a digital marketing analytics diagram ppt summary. This is a four stage process. The stages in this process are content strategy, usability, engineering, architecture, strategy.
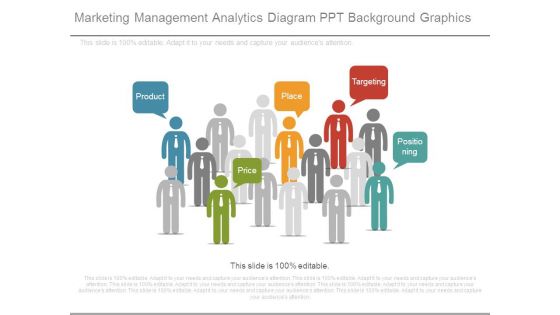
Marketing Management Analytics Diagram Ppt Background Graphics
This is a marketing management analytics diagram ppt background graphics. This is a five stage process. The stages in this process are product, price, place, targeting, positioning.
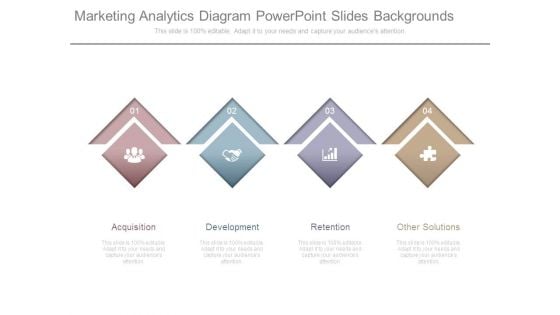
Marketing Analytics Diagram Powerpoint Slides Backgrounds
This is a marketing analytics diagram powerpoint slides backgrounds. This is a four stage process. The stages in this process are acquisition, development, retention, other solutions.
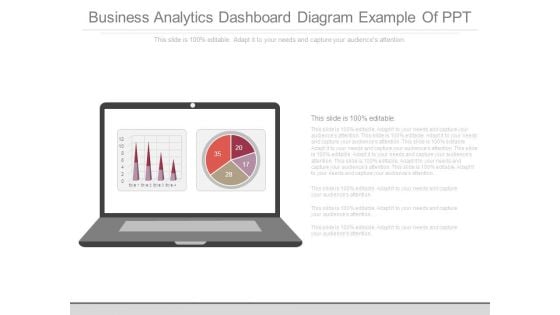
Business Analytics Dashboard Diagram Example Of Ppt
This is a business analytics dashboard diagram example of ppt. This is a one stage process. The stages in this process are business, management, strategy, pie, presentation.
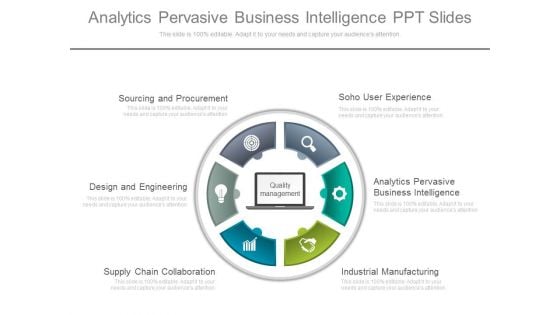
Analytics Pervasive Business Intelligence Ppt Slides
This is a analytics pervasive business intelligence ppt slides. This is a six stage process. The stages in this process are circle charts, business, marketing.

Ebitda Data Analytics Company Outline Topics PDF
This slide illustrates a graph of EBITDA for Kantar company showing growth trend in from 2021. It also showcases key insights for EBITDA highlighting estimated EBITDA for 2022 and 2023. Present like a pro with Ebitda Data Analytics Company Outline Topics PDF Create beautiful presentations together with your team, using our easy-to-use presentation slides. Share your ideas in real-time and make changes on the fly by downloading our templates. So whether you are in the office, on the go, or in a remote location, you can stay in sync with your team and present your ideas with confidence. With Slidegeeks presentation got a whole lot easier. Grab these presentations today. This slide illustrates a graph of EBITDA for Kantar company showing growth trend in from 2021. It also showcases key insights for EBITDA highlighting estimated EBITDA for 2022 and 2023
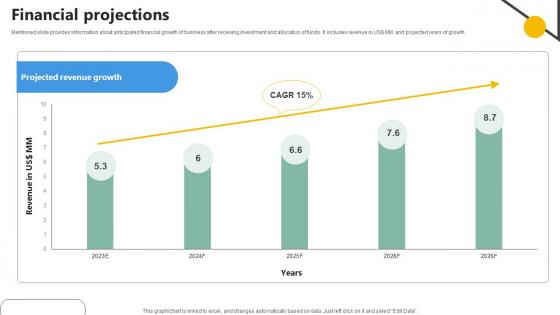
Financial Projections Analytics Company Investor Funding Elevator
Mentioned slide provides information about anticipated financial growth of business after receiving investment and allocation of funds. It includes revenue in USdollar MM and projected years of growthSlidegeeks has constructed Financial Projections Analytics Company Investor Funding Elevator after conducting extensive research and examination. These presentation templates are constantly being generated and modified based on user preferences and critiques from editors. Here, you will find the most attractive templates for a range of purposes while taking into account ratings and remarks from users regarding the content. This is an excellent jumping-off point to explore our content and will give new users an insight into our top-notch PowerPoint Templates. Mentioned slide provides information about anticipated financial growth of business after receiving investment and allocation of funds. It includes revenue in USdollar MM and projected years of growth
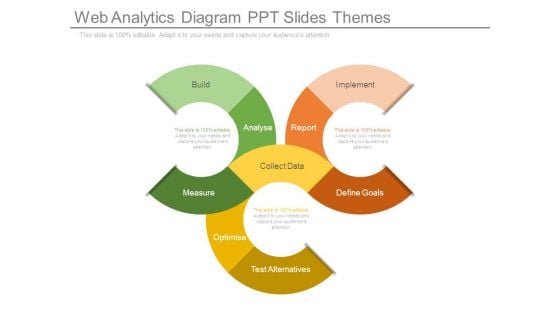
Web Analytics Diagram Ppt Slides Themes
This is a web analytics diagram ppt slides themes. This is a three stage process. The stages in this process are build, analyse, measure, test alternatives, optimise, collect data, define goals, report, implement.
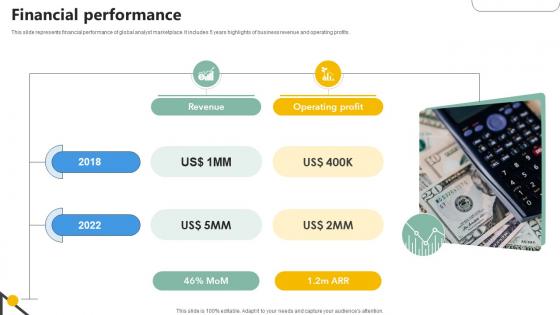
Financial Performance Analytics Company Investor Funding Elevator
This slide represents financial performance of global analyst marketplace. It includes 5 years highlights of business revenue and operating profits.Retrieve professionally designed Financial Performance Analytics Company Investor Funding Elevator to effectively convey your message and captivate your listeners. Save time by selecting pre-made slideshows that are appropriate for various topics, from business to educational purposes. These themes come in many different styles, from creative to corporate, and all of them are easily adjustable and can be edited quickly. Access them as PowerPoint templates or as Google Slides themes. You do not have to go on a hunt for the perfect presentation because Slidegeeks got you covered from everywhere. This slide represents financial performance of global analyst marketplace. It includes 5 years highlights of business revenue and operating profits.
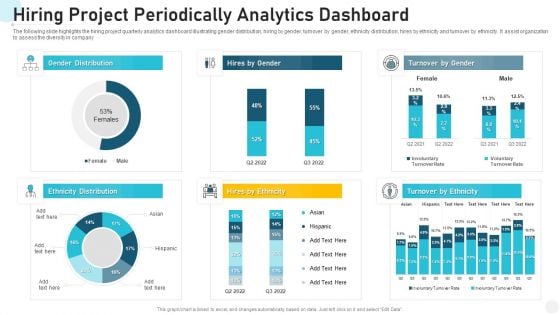
Hiring Project Periodically Analytics Dashboard Summary PDF
The following slide highlights the hiring project quarterly analytics dashboard illustrating gender distribution, hiring by gender, turnover by gender, ethnicity distribution, hires by ethnicity and turnover by ethnicity. It assist organization to assess the diversity in company Showcasing this set of slides titled hiring project periodically analytics dashboard summary pdf. The topics addressed in these templates are hiring project periodically analytics dashboard. All the content presented in this PPT design is completely editable. Download it and make adjustments in color, background, font etc. as per your unique business setting.
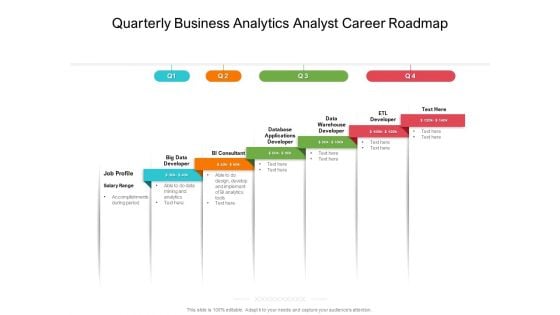
Quarterly Business Analytics Analyst Career Roadmap Themes
We present our quarterly business analytics analyst career roadmap themes. This PowerPoint layout is easy-to-edit so you can change the font size, font type, color, and shape conveniently. In addition to this, the PowerPoint layout is Google Slides compatible, so you can share it with your audience and give them access to edit it. Therefore, download and save this well-researched quarterly business analytics analyst career roadmap themes in different formats like PDF, PNG, and JPG to smoothly execute your business plan.
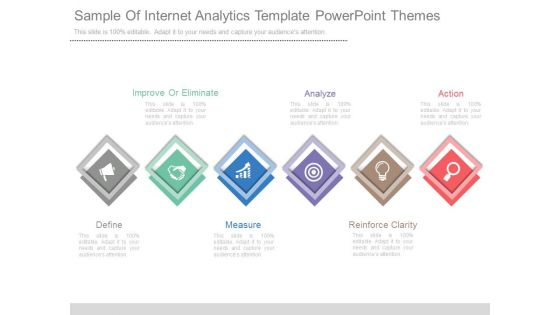
Sample Of Internet Analytics Template Powerpoint Themes
This is a sample of internet analytics template powerpoint themes. This is a six stage process. The stages in this process are improve or eliminate, analyze, action, define, measure, reinforce clarity.
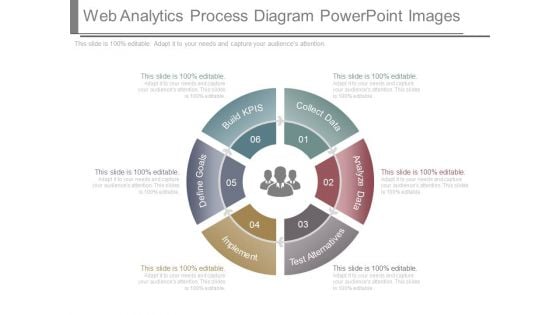
Web Analytics Process Diagram Powerpoint Images
This is a web analytics process diagram powerpoint images. This is a six stage process. The stages in this process are build kpis, define goals, implement, test alternatives, analyze data, collect data.
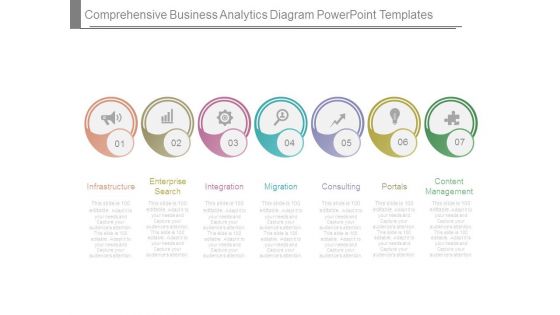
Comprehensive Business Analytics Diagram Powerpoint Templates
This is a comprehensive business analytics diagram powerpoint templates. This is a seven stage process. The stages in this process are infrastructure, enterprise search, integration, migration, consulting, portals, content management.
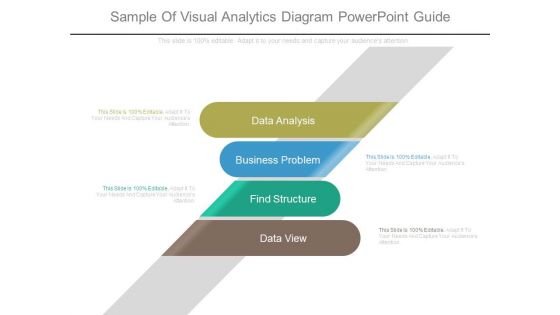
Sample Of Visual Analytics Diagram Powerpoint Guide
This is a sample of visual analytics diagram powerpoint guide. This is a four stage process. The stages in this process are data analysis, business problem, find structure, data view.
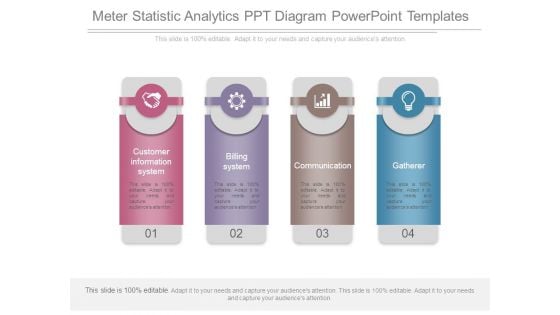
Meter Statistic Analytics Ppt Diagram Powerpoint Templates
This is a meter statistic analytics ppt diagram powerpoint templates. This is a four stage process. The stages in this process are customer information system, billing system, communication, gatherer.
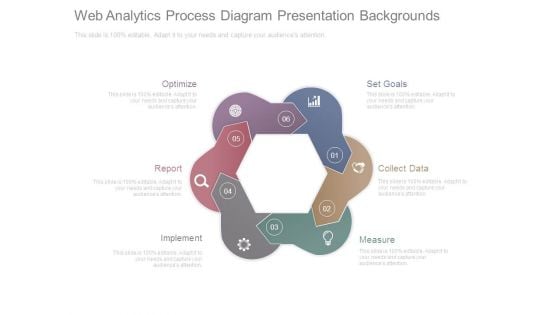
Web Analytics Process Diagram Presentation Backgrounds
This is a web analytics process diagram presentation backgrounds. This is a six stage process. The stages in this process are optimize, report, implement, measure, collect data, set goals.
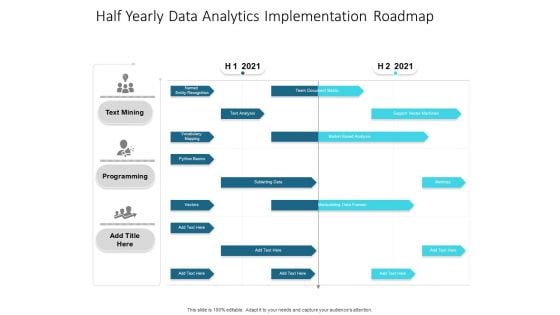
Half Yearly Data Analytics Implementation Roadmap Demonstration
We present our half yearly data analytics implementation roadmap demonstration. This PowerPoint layout is easy-to-edit so you can change the font size, font type, color, and shape conveniently. In addition to this, the PowerPoint layout is Google Slides compatible, so you can share it with your audience and give them access to edit it. Therefore, download and save this well-researched half yearly data analytics implementation roadmap demonstration in different formats like PDF, PNG, and JPG to smoothly execute your business plan.
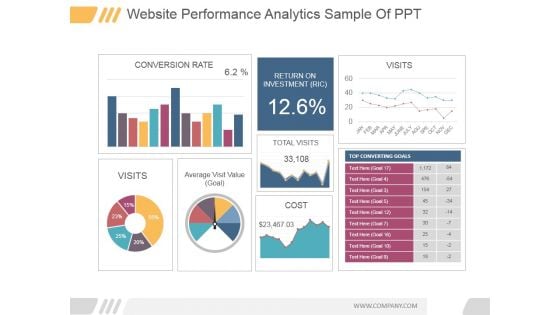
Website Performance Analytics Ppt PowerPoint Presentation Show
This is a website performance analytics ppt powerpoint presentation show. This is a three stage process. The stages in this process are conversion rate, visits, average visit value goal, return on investment ric, total visits, cost.
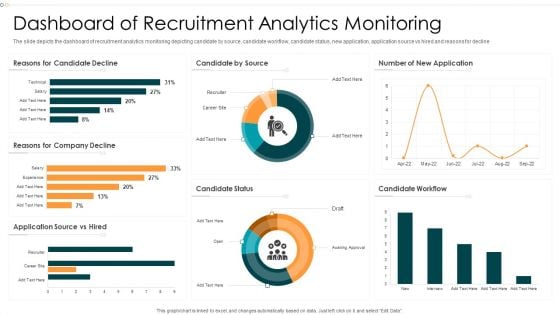
Dashboard Of Recruitment Analytics Monitoring Brochure PDF
The slide depicts the dashboard of recruitment analytics monitoring depicting candidate by source, candidate workflow, candidate status, new application, application source vs hired and reasons for decline.Showcasing this set of slides titled Dashboard Of Recruitment Analytics Monitoring Brochure PDF The topics addressed in these templates are Candidate Workflow, Reasons Candidate, Candidate Status All the content presented in this PPT design is completely editable. Download it and make adjustments in color, background, font etc. as per your unique business setting.
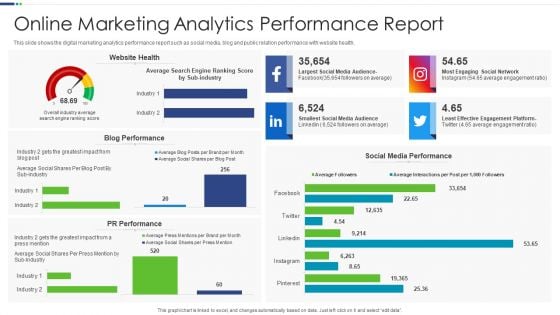
Online Marketing Analytics Performance Report Microsoft PDF
This slide shows the digital marketing analytics performance report such as social media, blog and public relation performance with website health.Pitch your topic with ease and precision using this Online Marketing Analytics Performance Report Microsoft PDF This layout presents information on Blog Performance, Media Performance, Effective Engagement It is also available for immediate download and adjustment. So, changes can be made in the color, design, graphics or any other component to create a unique layout.
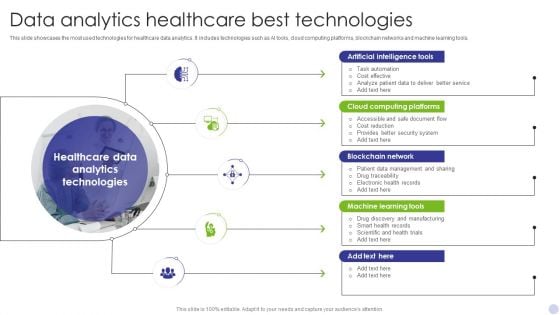
Data Analytics Healthcare Best Technologies Template PDF
This slide showcases the most used technologies for healthcare data analytics. It includes technologies such as AI tools, cloud computing platforms, blockchain networks and machine learning tools. Presenting Data Analytics Healthcare Best Technologies Template PDF to dispense important information. This template comprises Five stages. It also presents valuable insights into the topics including Artificial Intelligence Tools, Cloud Computing Platforms, Blockchain Network. This is a completely customizable PowerPoint theme that can be put to use immediately. So, download it and address the topic impactfully.
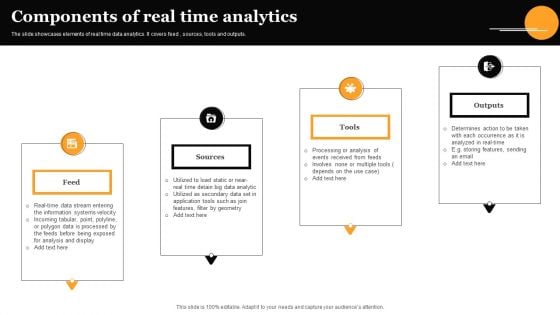
Components Of Real Time Analytics Graphics PDF
The slide showcases elements of real time data analytics. It covers feed, sources, tools and outputs. Presenting Components Of Real Time Analytics Graphics PDF to dispense important information. This template comprises four stages. It also presents valuable insights into the topics including Feed, Sources, Tools . This is a completely customizable PowerPoint theme that can be put to use immediately. So, download it and address the topic impactfully.
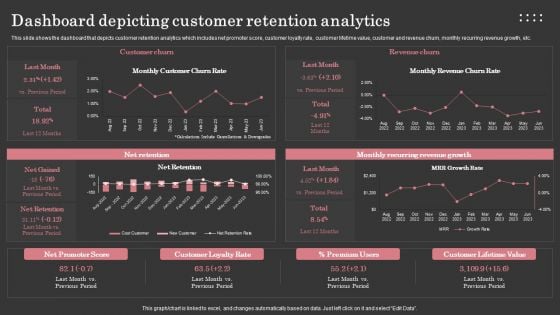
Dashboard Depicting Customer Retention Analytics Background PDF
This slide shows the dashboard that depicts customer retention analytics which includes net promoter score, customer loyalty rate, customer lifetime value, customer and revenue churn, monthly recurring revenue growth, etc. Make sure to capture your audiences attention in your business displays with our gratis customizable Dashboard Depicting Customer Retention Analytics Background PDF. These are great for business strategies, office conferences, capital raising or task suggestions. If you desire to acquire more customers for your tech business and ensure they stay satisfied, create your own sales presentation with these plain slides.
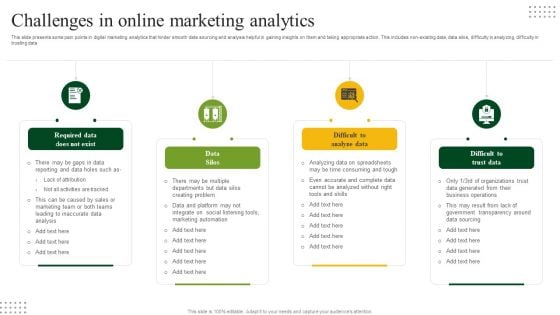
Challenges In Online Marketing Analytics Elements PDF
This slide presents some pain points in digital marketing analytics that hinder smooth data sourcing and analysis helpful in gaining insights on them and taking appropriate action. This includes non-existing data, data silos, difficulty in analyzing, difficulty in trusting data. Presenting Challenges In Online Marketing Analytics Elements PDF to dispense important information. This template comprises four stages. It also presents valuable insights into the topics including Data Silos, Difficult Analyze Data, Difficult Trust Data. This is a completely customizable PowerPoint theme that can be put to use immediately. So, download it and address the topic impactfully.
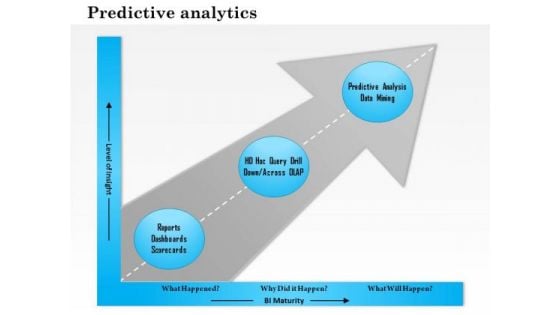
Business Framework Predictive Analytics PowerPoint Presentation
Explain the concept of predictive analytics in any presentation with this unique PPT slide. This PPT diagram slide contains the graphic of arrow diagram with three text boxes on a graph. This PPT slide shows the growth analysis an make a professional presentation.
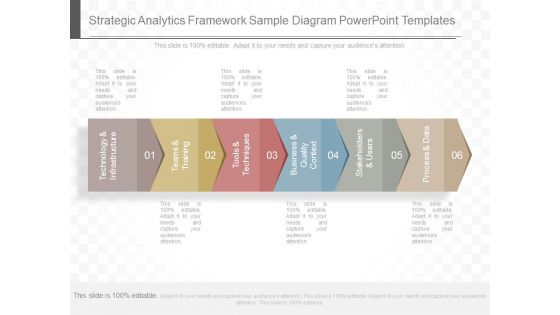
Strategic Analytics Framework Sample Diagram Powerpoint Templates
This is a strategic analytics framework sample diagram powerpoint templates. This is a six stage process. The stages in this process are technology and infrastructure, teams and training, tools and techniques, business and quality context, stakeholders and users, process and data.

Agenda For Data Analytics Management Diagrams PDF
Presenting Agenda For Data Analytics Management Diagrams PDF to provide visual cues and insights. Share and navigate important information on five stages that need your due attention. This template can be used to pitch topics like Agenda. In addtion, this PPT design contains high resolution images, graphics, etc, that are easily editable and available for immediate download.
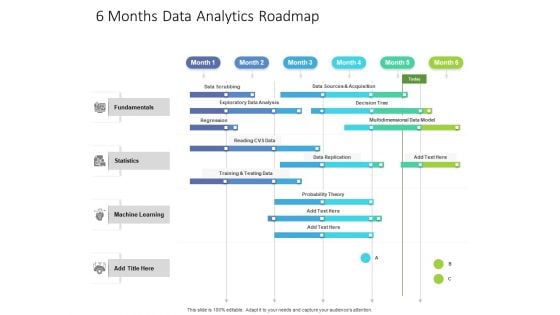
6 Months Data Analytics Roadmap Diagrams
Presenting our innovatively-structured 6 months data analytics roadmap diagrams Template. Showcase your roadmap process in different formats like PDF, PNG, and JPG by clicking the download button below. This PPT design is available in both Standard Screen and Widescreen aspect ratios. It can also be easily personalized and presented with modified font size, font type, color, and shapes to measure your progress in a clear way.
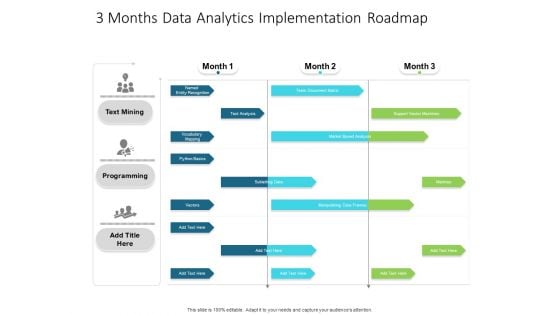
3 Months Data Analytics Implementation Roadmap Elements
Presenting our innovatively-structured 3 months data analytics implementation roadmap elements Template. Showcase your roadmap process in different formats like PDF, PNG, and JPG by clicking the download button below. This PPT design is available in both Standard Screen and Widescreen aspect ratios. It can also be easily personalized and presented with modified font size, font type, color, and shapes to measure your progress in a clear way.

 Home
Home