Analytics Icon
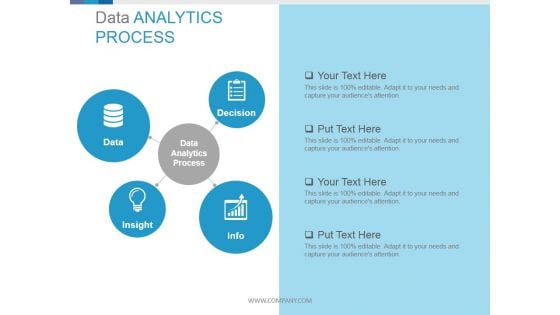
Data Analytics Process Circular Diagrams Ppt PowerPoint Presentation Guidelines
This is a data analytics process circular diagrams ppt powerpoint presentation guidelines. This is a four stage process. The stages in this process are data analytics process, data, decision, insight, info.
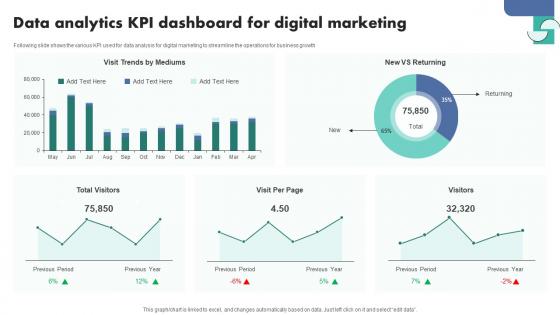
Data Analytics Kpi Dashboard For Digital Marketing Inspiration Pdf
Following slide shows the various KPI used for data analysis for digital marketing to streamline the operations for business growth.Showcasing this set of slides titled Data Analytics Kpi Dashboard For Digital Marketing Inspiration Pdf The topics addressed in these templates are Data Analytics KPI, Dashboard Digital Marketing All the content presented in this PPT design is completely editable. Download it and make adjustments in color, background, font etc. as per your unique business setting. Following slide shows the various KPI used for data analysis for digital marketing to streamline the operations for business growth.
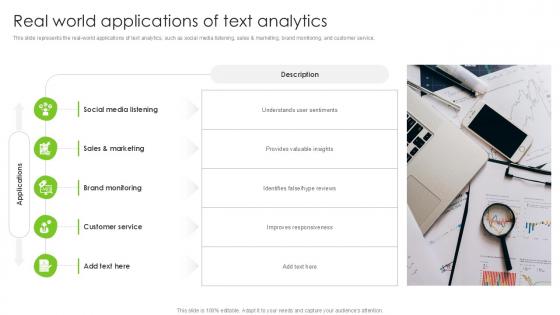
Real World Applications Of Text Analytics PPT Slide SS
This slide represents the real-world applications of text analytics, such as social media listening, sales and marketing, brand monitoring, and customer service. Retrieve professionally designed Real World Applications Of Text Analytics PPT Slide SS to effectively convey your message and captivate your listeners. Save time by selecting pre-made slideshows that are appropriate for various topics, from business to educational purposes. These themes come in many different styles, from creative to corporate, and all of them are easily adjustable and can be edited quickly. Access them as PowerPoint templates or as Google Slides themes. You do not have to go on a hunt for the perfect presentation because Slidegeeks got you covered from everywhere. This slide represents the real-world applications of text analytics, such as social media listening, sales and marketing, brand monitoring, and customer service.
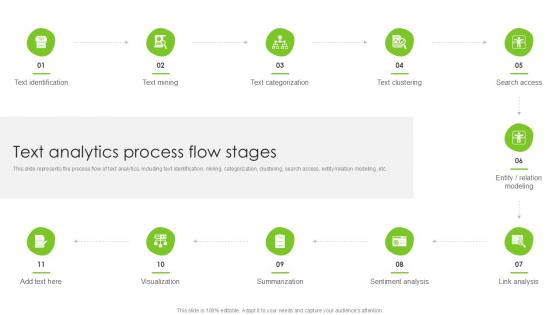
Text Analytics Process Flow Stages PPT Sample SS
This slide represents the process flow of text analytics, including text identification, mining, categorization, clustering, search access, entity relation modeling, etc. Do you know about Slidesgeeks Text Analytics Process Flow Stages PPT Sample SS These are perfect for delivering any kind od presentation. Using it, create PowerPoint presentations that communicate your ideas and engage audiences. Save time and effort by using our pre-designed presentation templates that are perfect for a wide range of topic. Our vast selection of designs covers a range of styles, from creative to business, and are all highly customizable and easy to edit. Download as a PowerPoint template or use them as Google Slides themes. This slide represents the process flow of text analytics, including text identification, mining, categorization, clustering, search access, entity relation modeling, etc.
Data Research And Analytics Ppt PowerPoint Presentation Infographics Examples
This is a data research and analytics ppt powerpoint presentation infographics examples. This is a one stage process. The stages in this process are metrics icon, kpis icon, statistics icon.
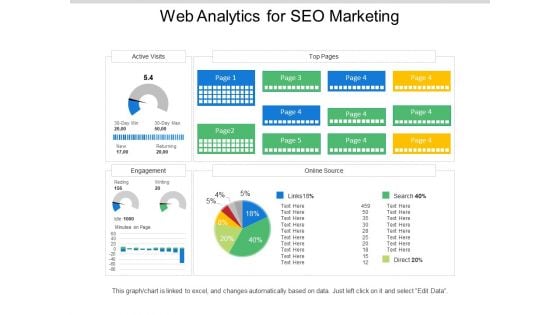
Web Analytics For Seo Marketing Ppt PowerPoint Presentation Examples
This is a web analytics for seo marketing ppt powerpoint presentation examples. This is a five stage process. The stages in this process are digital analytics, digital dashboard, marketing.
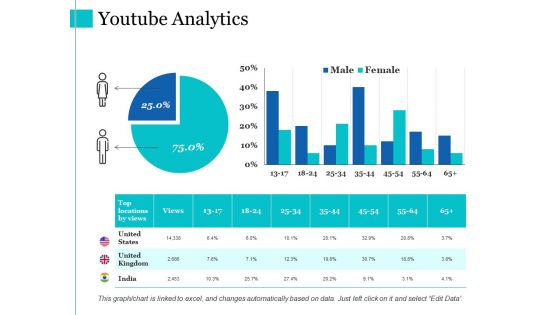
Youtube Analytics Ppt PowerPoint Presentation Layouts Graphic Images
This is a youtube analytics ppt powerpoint presentation layouts graphic images. This is a three stage process. The stages in this process are youtube analytics, finance, percentage, bar graph.
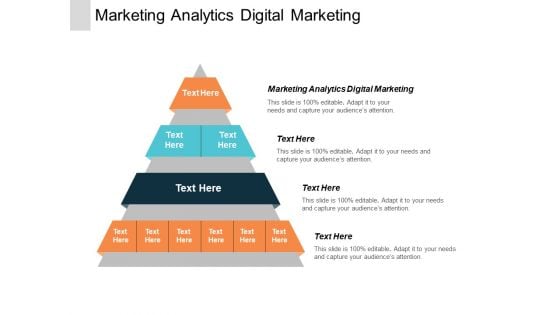
Marketing Analytics Digital Marketing Ppt PowerPoint Presentation Slides Demonstration Cpb
This is a marketing analytics digital marketing ppt powerpoint presentation slides demonstration cpb. The topics discussed in this diagram are marketing analytics digital marketing. This is a completely editable PowerPoint presentation and is available for immediate download.
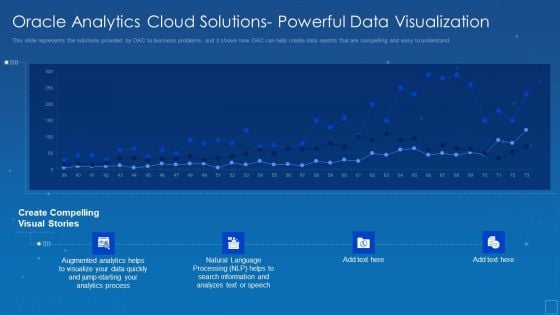
Oracle Analytics Cloud Solutions Powerful Data Visualization Template PDF
This slide represents the predictive analytics solution of the oracle analytics cloud and how it is helpful to predict outputs and display quickly with the help of ML. Deliver an awe inspiring pitch with this creative oracle analytics cloud solutions powerful data visualization template pdf bundle. Topics like oracle analytics cloud solutions powerful data visualization can be discussed with this completely editable template. It is available for immediate download depending on the needs and requirements of the user.
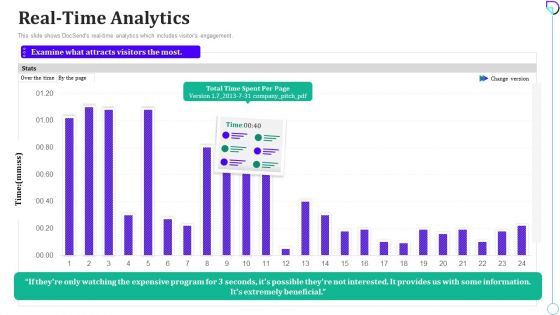
Docsend Capital Fundraising Real Time Analytics Ppt Styles Show PDF
This slide shows DocSends real time analytics which includes visitors engagement. Deliver an awe inspiring pitch with this creative docsend capital fundraising real time analytics ppt styles show pdf bundle. Topics like real time analytics can be discussed with this completely editable template. It is available for immediate download depending on the needs and requirements of the user.
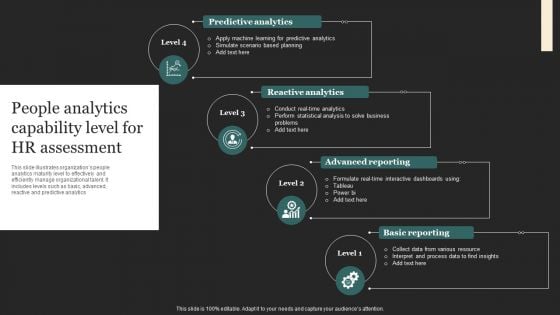
People Analytics Capability Level For HR Assessment Mockup PDF
This slide illustrates organizations people analytics maturity level to effectively and efficiently manage organizational talent. It includes levels such as basic, advanced, reactive and predictive analytics. Presenting People Analytics Capability Level For HR Assessment Mockup PDF to dispense important information. This template comprises four stages. It also presents valuable insights into the topics including Reactive Analytics, Advanced Reporting, Basic Reporting. This is a completely customizable PowerPoint theme that can be put to use immediately. So, download it and address the topic impactfully.
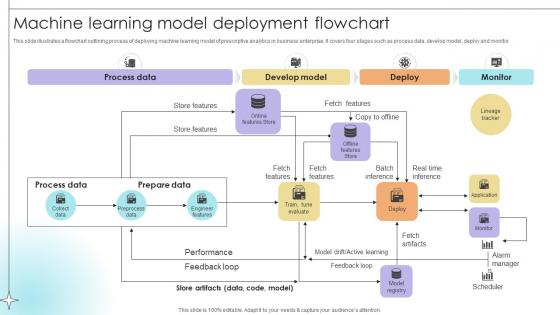
Machine Learning Model Deployment Flowchart Data Analytics SS V
This slide illustrates a flowchart outlining process of deploying machine learning model of prescriptive analytics in business enterprise. It covers four stages such as process data, develop model, deploy and monitor.If your project calls for a presentation, then Slidegeeks is your go-to partner because we have professionally designed, easy-to-edit templates that are perfect for any presentation. After downloading, you can easily edit Machine Learning Model Deployment Flowchart Data Analytics SS V and make the changes accordingly. You can rearrange slides or fill them with different images. Check out all the handy templates This slide illustrates a flowchart outlining process of deploying machine learning model of prescriptive analytics in business enterprise. It covers four stages such as process data, develop model, deploy and monitor.
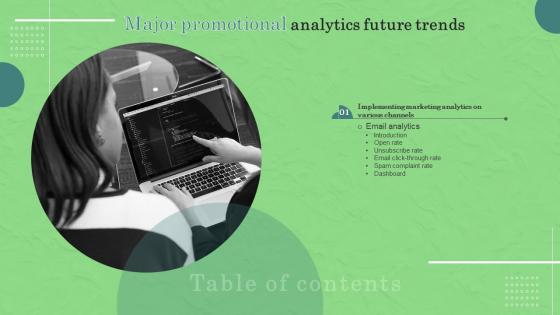
Major Promotional Analytics Future Trends Table Of Contents Structure Pdf
Retrieve professionally designed Major Promotional Analytics Future Trends Table Of Contents Structure Pdf to effectively convey your message and captivate your listeners. Save time by selecting pre made slideshows that are appropriate for various topics, from business to educational purposes. These themes come in many different styles, from creative to corporate, and all of them are easily adjustable and can be edited quickly. Access them as PowerPoint templates or as Google Slides themes. You do not have to go on a hunt for the perfect presentation because Slidegeeks got you covered from everywhere. Our Major Promotional Analytics Future Trends Table Of Contents Structure Pdf are topically designed to provide an attractive backdrop to any subject. Use them to look like a presentation pro.
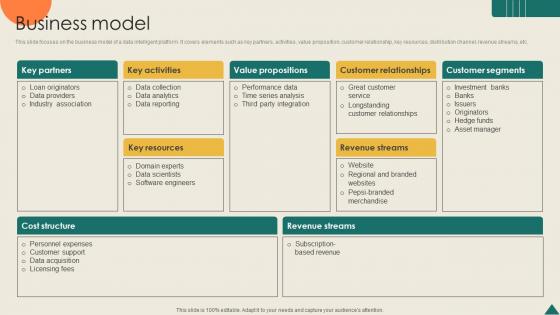
Business Model Financial Analytics Platform Investor Elevator Pitch Deck
This slide focuses on the business model of a data intelligent platform. It covers elements such as key partners, activities, value proposition, customer relationship, key resources, distribution channel, revenue streams, etc. Are you searching for a Business Model Financial Analytics Platform Investor Elevator Pitch Deck that is uncluttered, straightforward, and original Its easy to edit, and you can change the colors to suit your personal or business branding. For a presentation that expresses how much effort you have put in, this template is ideal With all of its features, including tables, diagrams, statistics, and lists, its perfect for a business plan presentation. Make your ideas more appealing with these professional slides. Download Business Model Financial Analytics Platform Investor Elevator Pitch Deck from Slidegeeks today. This slide focuses on the business model of a data intelligent platform. It covers elements such as key partners, activities, value proposition, customer relationship, key resources, distribution channel, revenue streams, etc.
Data Analytics For Informed Decision Making Ppt Sample
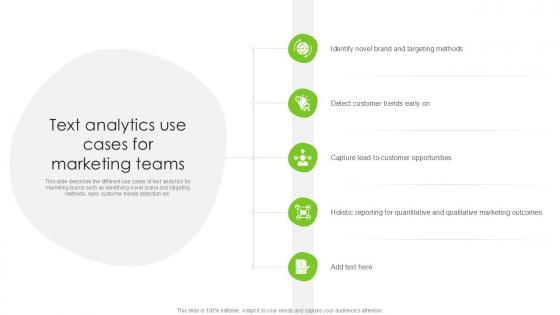
Text Analytics Use Cases For Marketing Teams PPT Sample SS
This slide describes the different use cases of text analytics for marketing teams such as identifying novel brand and targeting methods, early customer trends detection etc. Retrieve professionally designed Text Analytics Use Cases For Marketing Teams PPT Sample SS to effectively convey your message and captivate your listeners. Save time by selecting pre-made slideshows that are appropriate for various topics, from business to educational purposes. These themes come in many different styles, from creative to corporate, and all of them are easily adjustable and can be edited quickly. Access them as PowerPoint templates or as Google Slides themes. You do not have to go on a hunt for the perfect presentation because Slidegeeks got you covered from everywhere. This slide describes the different use cases of text analytics for marketing teams such as identifying novel brand and targeting methods, early customer trends detection etc.
Gross Profit Data Analytics Company Outline Pictures PDF
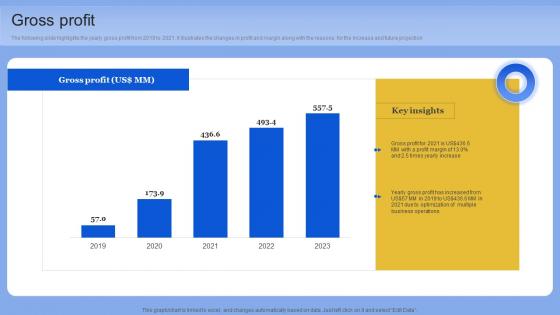
The following slide highlights the yearly gross profit from 2019 to 2021. it illustrates the changes in profit and margin along with the reasons for the increase and future projection. Formulating a presentation can take up a lot of effort and time, so the content and message should always be the primary focus. The visuals of the PowerPoint can enhance the presenters message, so our Gross Profit Data Analytics Company Outline Pictures PDF was created to help save time. Instead of worrying about the design, the presenter can concentrate on the message while our designers work on creating the ideal templates for whatever situation is needed. Slidegeeks has experts for everything from amazing designs to valuable content, we have put everything into Gross Profit Data Analytics Company Outline Pictures PDF The following slide highlights the yearly gross profit from 2019 to 2021. it illustrates the changes in profit and margin along with the reasons for the increase and future projection
Learning And Improvement KPI Course Analytics Dashboard Inspiration Pdf
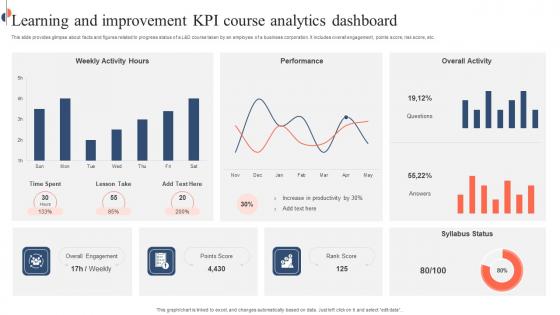
This slide provides glimpse about facts and figures related to progress status of a L and D course taken by an employee of a business corporation. It includes overall engagement, points score, risk score, etc. Showcasing this set of slides titled Learning And Improvement KPI Course Analytics Dashboard Inspiration Pdf. The topics addressed in these templates are Learning And Improvement KPI, Course Analytics Dashboard, Risk Score. All the content presented in this PPT design is completely editable. Download it and make adjustments in color, background, font etc. as per your unique business setting. This slide provides glimpse about facts and figures related to progress status of a L and D course taken by an employee of a business corporation. It includes overall engagement, points score, risk score, etc.
Key Facts Cloud Based Predictive Analytics Software Pitch Deck
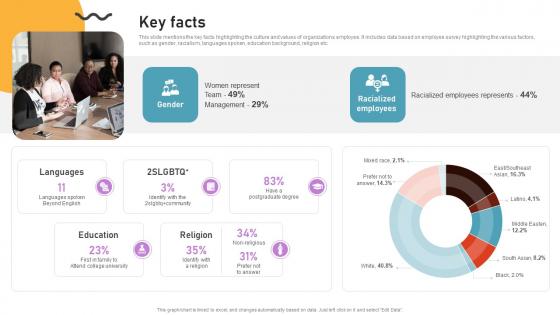
This slide mentions the key facts highlighting the culture and values of organizations employee. It includes data based on employee survey highlighting the various factors, such as gender, racialism, languages spoken, education background, religion etc. Find highly impressive Key Facts Cloud Based Predictive Analytics Software Pitch Deck on Slidegeeks to deliver a meaningful presentation. You can save an ample amount of time using these presentation templates. No need to worry to prepare everything from scratch because Slidegeeks experts have already done a huge research and work for you. You need to download Key Facts Cloud Based Predictive Analytics Software Pitch Deck for your upcoming presentation. All the presentation templates are 100 percent editable and you can change the color and personalize the content accordingly. Download now This slide mentions the key facts highlighting the culture and values of organizations employee. It includes data based on employee survey highlighting the various factors, such as gender, racialism, languages spoken, education background, religion etc.
Shareholding Pattern Financial Analytics Platform Investor Elevator Pitch Deck
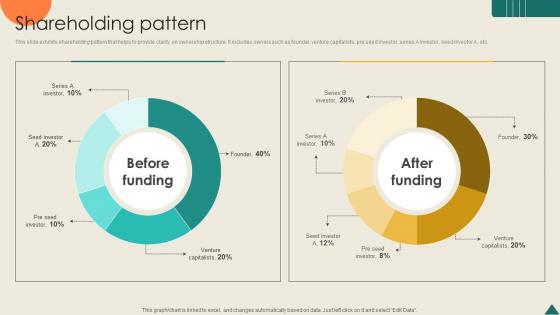
This slide exhibits shareholding pattern that helps to provide clarity on ownership structure. It includes owners such as founder, venture capitalists, pre seed investor, series A investor, seed investor A, etc. Find highly impressive Shareholding Pattern Financial Analytics Platform Investor Elevator Pitch Deck on Slidegeeks to deliver a meaningful presentation. You can save an ample amount of time using these presentation templates. No need to worry to prepare everything from scratch because Slidegeeks experts have already done a huge research and work for you. You need to download Shareholding Pattern Financial Analytics Platform Investor Elevator Pitch Deck for your upcoming presentation. All the presentation templates are 100 percent editable and you can change the color and personalize the content accordingly. Download now This slide exhibits shareholding pattern that helps to provide clarity on ownership structure. It includes owners such as founder, venture capitalists, pre seed investor, series A investor, seed investor A, etc.
Shareholding Pattern Big Data Analytics Investor Funding Elevator Pitch Deck
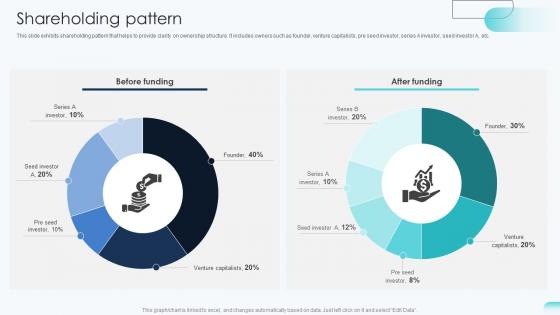
This slide exhibits shareholding pattern that helps to provide clarity on ownership structure. It includes owners such as founder, venture capitalists, pre seed investor, series A investor, seed investor A, etc. This Shareholding Pattern Big Data Analytics Investor Funding Elevator Pitch Deck is perfect for any presentation, be it in front of clients or colleagues. It is a versatile and stylish solution for organizing your meetings. The Shareholding Pattern Big Data Analytics Investor Funding Elevator Pitch Deck features a modern design for your presentation meetings. The adjustable and customizable slides provide unlimited possibilities for acing up your presentation. Slidegeeks has done all the homework before launching the product for you. So, do not wait, grab the presentation templates today This slide exhibits shareholding pattern that helps to provide clarity on ownership structure. It includes owners such as founder, venture capitalists, pre seed investor, series A investor, seed investor A, etc.
Analytics Based Marketing Strategies To Grow Business Themes Pdf
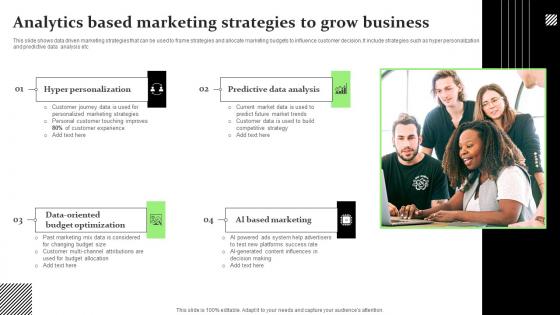
This slide shows data driven marketing strategies that can be used to frame strategies and allocate marketing budgets to influence customer decision. It include strategies such as hyper personalization and predictive data analysis etc.Showcasing this set of slides titled Analytics Based Marketing Strategies To Grow Business Themes Pdf The topics addressed in these templates are Hyper Personalization, Predictive Data Analysis, Budget Optimization All the content presented in this PPT design is completely editable. Download it and make adjustments in color, background, font etc. as per your unique business setting. This slide shows data driven marketing strategies that can be used to frame strategies and allocate marketing budgets to influence customer decision. It include strategies such as hyper personalization and predictive data analysis etc.
Investment Ask Smart Grid Analytics Investor Fund Raising Template PDF
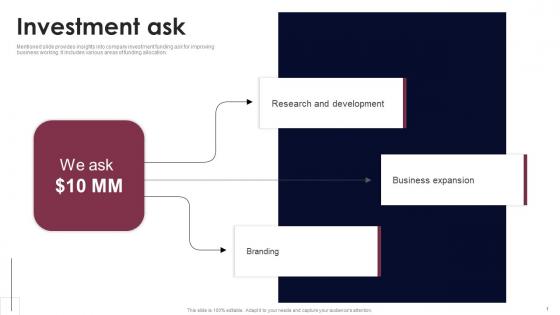
Mentioned slide provides insights into company investment funding ask for improving business working. It includes various areas of funding allocation. Whether you have daily or monthly meetings, a brilliant presentation is necessary. Investment Ask Smart Grid Analytics Investor Fund Raising Template PDF can be your best option for delivering a presentation. Represent everything in detail using Investment Ask Smart Grid Analytics Investor Fund Raising Template PDF and make yourself stand out in meetings. The template is versatile and follows a structure that will cater to your requirements. All the templates prepared by Slidegeeks are easy to download and edit. Our research experts have taken care of the corporate themes as well. So, give it a try and see the results. Mentioned slide provides insights into company investment funding ask for improving business working. It includes various areas of funding allocation.
Investment Ask Cloud Based Predictive Analytics Software Pitch Deck
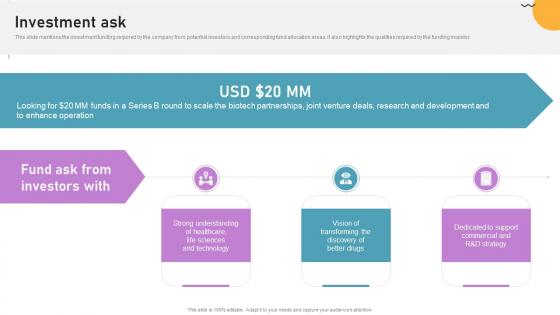
This slide mentions the investment funding required by the company from potential investors and corresponding fund allocation areas. It also highlights the qualities required by the funding investor. Whether you have daily or monthly meetings, a brilliant presentation is necessary. Investment Ask Cloud Based Predictive Analytics Software Pitch Deck can be your best option for delivering a presentation. Represent everything in detail using Investment Ask Cloud Based Predictive Analytics Software Pitch Deck and make yourself stand out in meetings. The template is versatile and follows a structure that will cater to your requirements. All the templates prepared by Slidegeeks are easy to download and edit. Our research experts have taken care of the corporate themes as well. So, give it a try and see the results. This slide mentions the investment funding required by the company from potential investors and corresponding fund allocation areas. It also highlights the qualities required by the funding investor.
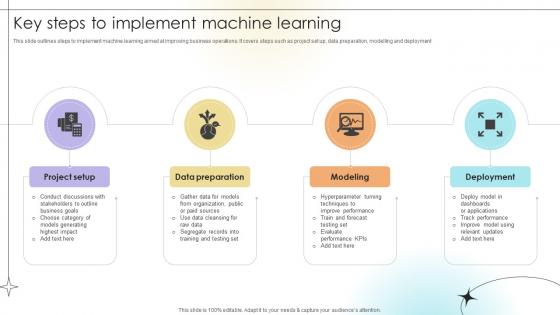
Key Steps To Implement Machine Learning Data Analytics SS V
This slide outlines steps to implement machine learning aimed at improving business operations. It covers steps such as project set up, data preparation, modelling and deployment. Whether you have daily or monthly meetings, a brilliant presentation is necessary. Key Steps To Implement Machine Learning Data Analytics SS V can be your best option for delivering a presentation. Represent everything in detail using Key Steps To Implement Machine Learning Data Analytics SS V and make yourself stand out in meetings. The template is versatile and follows a structure that will cater to your requirements. All the templates prepared by Slidegeeks are easy to download and edit. Our research experts have taken care of the corporate themes as well. So, give it a try and see the results. This slide outlines steps to implement machine learning aimed at improving business operations. It covers steps such as project set up, data preparation, modelling and deployment.
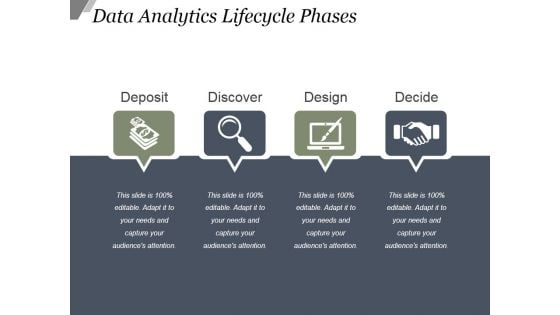
Data Analytics Lifecycle Phases Ppt PowerPoint Presentation Example File
This is a data analytics lifecycle phases ppt powerpoint presentation example file. This is a four stage process. The stages in this process are deposit, discover, design, decide.
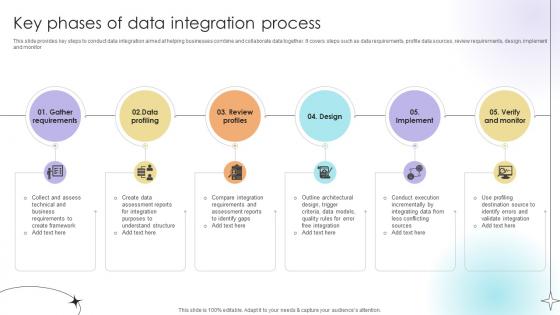
Key Phases Of Data Integration Process Data Analytics SS V
This slide provides key steps to conduct data integration aimed at helping businesses combine and collaborate data together. It covers steps such as data requirements, profile data sources, review requirements, design, implement and monitor.Slidegeeks is here to make your presentations a breeze with Key Phases Of Data Integration Process Data Analytics SS V With our easy-to-use and customizable templates, you can focus on delivering your ideas rather than worrying about formatting. With a variety of designs to choose from, you are sure to find one that suits your needs. And with animations and unique photos, illustrations, and fonts, you can make your presentation pop. So whether you are giving a sales pitch or presenting to the board, make sure to check out Slidegeeks first This slide provides key steps to conduct data integration aimed at helping businesses combine and collaborate data together. It covers steps such as data requirements, profile data sources, review requirements, design, implement and monitor.
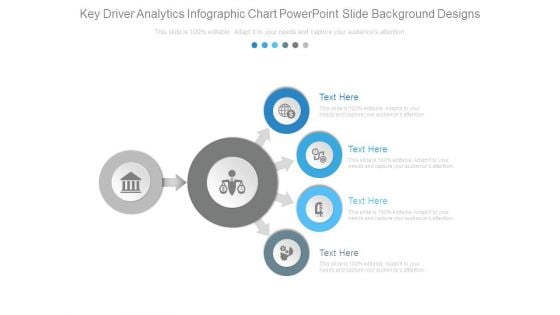
Key Driver Analytics Infographic Chart Powerpoint Slide Background Designs
This is a key driver analytics infographic chart powerpoint slide background designs. This is a four stage process. The stages in this process are business, marketing, arrows, icons, strategy.
Key Drivers Of Analytics Market Powerpoint Slide Templates Download
This is a key drivers of analytics market powerpoint slide templates download. This is a four stage process. The stages in this process are icon, business, management, marketing, market.
Driving Value Through Data Analytics Ppt Samples Download
This is a driving value through data analytics ppt samples download. This is a four stage process. The stages in this process are icons, business, strategy, management, process, marketing.
Key Driver Analytics Template 1 Ppt PowerPoint Presentation Shapes
This is a key driver analytics template 1 ppt powerpoint presentation shapes. This is a four stage process. The stages in this process are business, strategy, marketing, analysis, icons, arrow.
Key Driver Analytics Ppt PowerPoint Presentation Design Templates
This is a key driver analytics ppt powerpoint presentation design templates. This is a four stage process. The stages in this process are fact, business, marketing, strategy, success, icons.
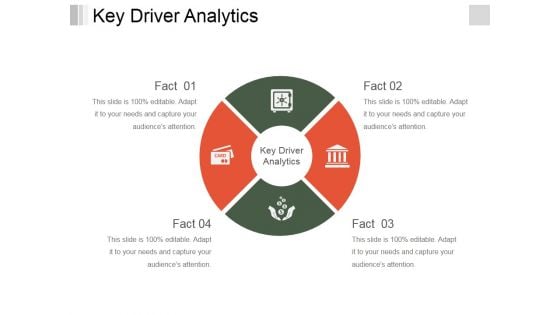
Key Driver Analytics Template 1 Ppt PowerPoint Presentation Layouts Aids
This is a key driver analytics template 1 ppt powerpoint presentation layouts aids. This is a four stage process. The stages in this process are business, icons, marketing, strategy, process.
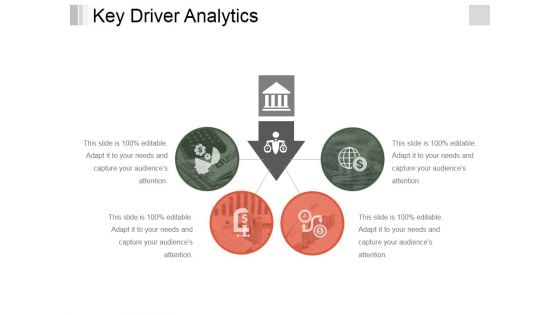
Key Driver Analytics Template 2 Ppt PowerPoint Presentation Inspiration Example
This is a key driver analytics template 2 ppt powerpoint presentation inspiration example. This is a four stage process. The stages in this process are business, icons, marketing, strategy, management.

Key Driver Analytics Template 1 Ppt PowerPoint Presentation Inspiration Files
This is a key driver analytics template 1 ppt powerpoint presentation inspiration files. This is a three stage process. The stages in this process are business, icons, strategy, marketing.
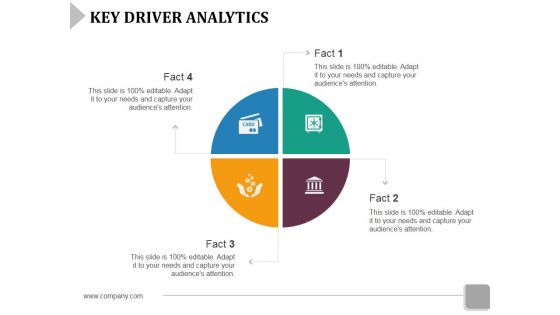
Key Driver Analytics Template 2 Ppt PowerPoint Presentation Slides Examples
This is a key driver analytics template 2 ppt powerpoint presentation slides examples. This is a four stage process. The stages in this process are management, business, icons, strategy, marketing.
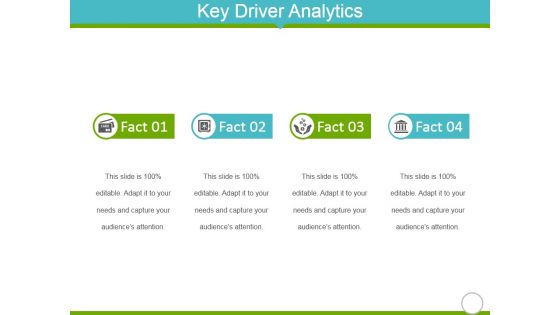
Key Driver Analytics Template 1 Ppt Powerpoint Presentation Infographics Slides
This is a key driver analytics template 1 ppt powerpoint presentation infographics slides. This is a four stage process. The stages in this process are fact, marketing, business, icons.
Key Driver Analytics Template 2 Ppt Powerpoint Presentation Summary Ideas
This is a key driver analytics template 2 ppt powerpoint presentation summary ideas. This is a four stage process. The stages in this process are business, marketing, icons, management.
Key Driver Analytics Template 1 Ppt PowerPoint Presentation Gallery Samples
This is a key driver analytics template 1 ppt powerpoint presentation gallery samples. This is a four stage process. The stages in this process are business, icons, management, marketing, strategy, analysis.
Key Driver Analytics Template 2 Ppt PowerPoint Presentation Summary Inspiration
This is a key driver analytics template 2 ppt powerpoint presentation summary inspiration. This is a four stage process. The stages in this process are business, icons, analysis, strategy, marketing.
Generic Big Data And Analytics Framework Themes PDF
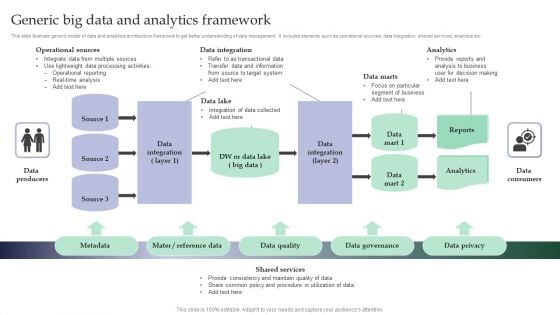
This slide illustrate generic model of data and analytics architecture framework to get better understanding of data management. It includes elements such as operational sources, data integration, shared services, analytics etc. Showcasing this set of slides titled Generic Big Data And Analytics Framework Themes PDF. The topics addressed in these templates are Metadata, Data Quality, Governance. All the content presented in this PPT design is completely editable. Download it and make adjustments in color, background, font etc. as per your unique business setting.
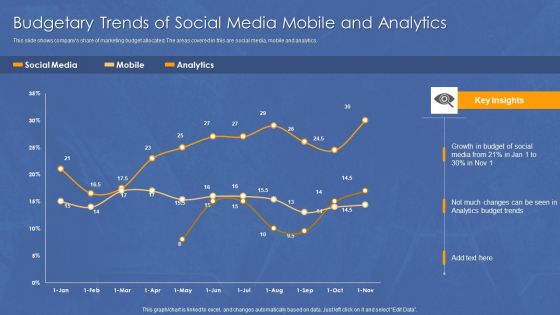
Budgetary Trends Of Social Media Mobile And Analytics Infographics PDF
This slide shows companys share of marketing budget allocated. The areas covered in this are social media, mobile and analytics.Showcasing this set of slides titled Budgetary Trends Of Social Media Mobile And Analytics Infographics PDF. The topics addressed in these templates are Growth Budget, Changes Can, Analytics Budget. All the content presented in this PPT design is completely editable. Download it and make adjustments in color, background, font etc. as per your unique business setting.

Software Application Marketing Data Analytics Report Mockup PDF
This slide shows app marketing analytics dashboard to gauge how well the marketing efforts are performing. It includes parameters like non organic content, organic content attribution,reengegement. Showcasing this set of slides titled Software Application Marketing Data Analytics Report Mockup PDF. The topics addressed in these templates are Software Application, Marketing Data, Analytics Report. All the content presented in this PPT design is completely editable. Download it and make adjustments in color, background, font etc. as per your unique business setting.
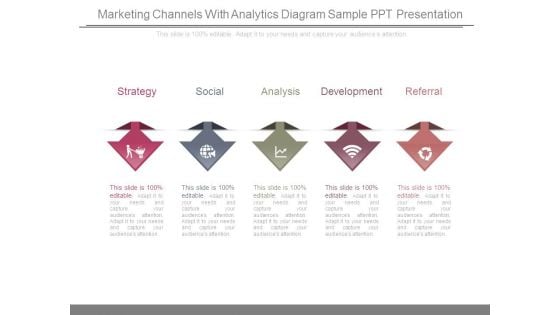
Marketing Channels With Analytics Diagram Sample Ppt Presentation
This is a marketing channels with analytics diagram sample ppt presentation. This is a five stage process. The stages in this process are strategy, social, analysis, development, referral.
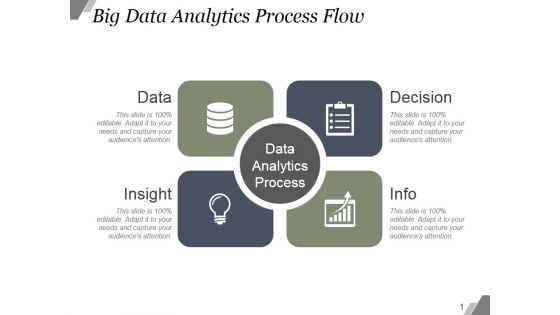
Big Data Analytics Process Flow Ppt PowerPoint Presentation Diagrams
This is a big data analytics process flow ppt powerpoint presentation diagrams. This is a four stage process. The stages in this process are data, decision, insight, info.
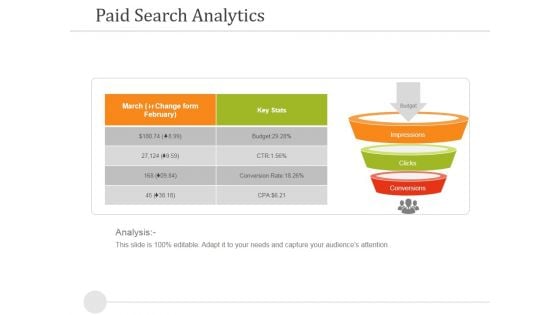
Paid Search Analytics Ppt PowerPoint Presentation Model Diagrams
This is a paid search analytics ppt powerpoint presentation model diagrams. This is a three stage process. The stages in this process are budget, impressions, clicks, conversions.
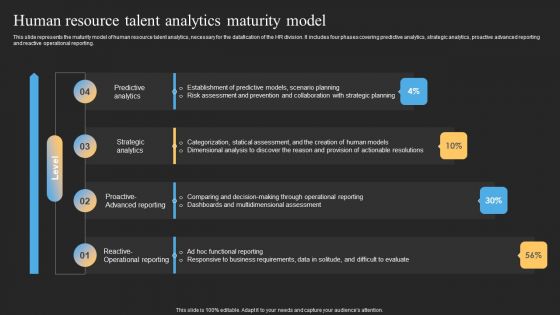
Datafy Human Resource Talent Analytics Maturity Model Microsoft PDF
This slide represents the maturity model of human resource talent analytics, necessary for the datafication of the HR division. It includes four phases covering predictive analytics, strategic analytics, proactive advanced reporting and reactive operational reporting. If your project calls for a presentation, then Slidegeeks is your go-to partner because we have professionally designed, easy-to-edit templates that are perfect for any presentation. After downloading, you can easily edit Datafy Human Resource Talent Analytics Maturity Model Microsoft PDF and make the changes accordingly. You can rearrange slides or fill them with different images. Check out all the handy templates
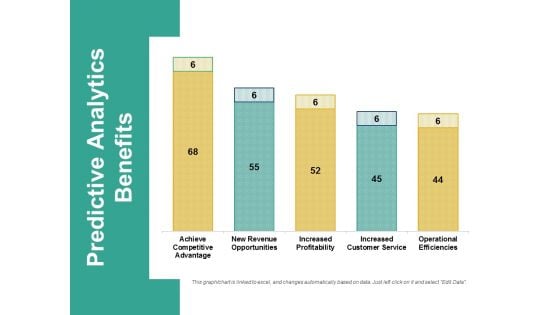
Predictive Analytics Benefits Ppt PowerPoint Presentation Professional Samples
This is a predictive analytics benefits ppt powerpoint presentation professional samples. This is a five stage process. The stages in this process are business, finance, marketing, strategy, analysis.

Product Data Analytics Ppt PowerPoint Presentation Complete Deck With Slides
If designing a presentation takes a lot of your time and resources and you are looking for a better alternative, then this Product Data Analytics Ppt PowerPoint Presentation Complete Deck With Slides is the right fit for you. This is a prefabricated set that can help you deliver a great presentation on the topic. All the twenty slides included in this sample template can be used to present a birds eye view of the topic. These slides are also fully editable, giving you enough freedom to add specific details to make this layout more suited to your business setting. Apart from the content, all other elements like color, design, theme are also replaceable and editable. This helps in designing a variety of presentations with a single layout. Not only this, you can use this PPT design in formats like PDF, PNG, and JPG once downloaded. Therefore, without any further ado, download and utilize this sample presentation as per your liking. Our Product Data Analytics Ppt PowerPoint Presentation Complete Deck With Slides are topically designed to provide an attractive backdrop to any subject. Use them to look like a presentation pro.

Edge Computing Analytics Ppt Powerpoint Presentation Complete Deck With Slides
Share a great deal of information on the topic by deploying this Edge Computing Analytics Ppt Powerpoint Presentation Complete Deck With Slides Support your ideas and thought process with this prefabricated set. It includes a set of seventeen slides, all fully modifiable and editable. Each slide can be restructured and induced with the information and content of your choice. You can add or remove large content boxes as well, to make this PPT slideshow more personalized. Its high-quality graphics and visuals help in presenting a well-coordinated pitch. This PPT template is also a resourceful tool to take visual cues from and implement the best ideas to help your business grow and expand. The main attraction of this well-formulated deck is that everything is editable, giving you the freedom to adjust it to your liking and choice. Changes can be made in the background and theme as well to deliver an outstanding pitch. Therefore, click on the download button now to gain full access to this multifunctional set. Our Edge Computing Analytics Ppt Powerpoint Presentation Complete Deck With Slides are topically designed to provide an attractive backdrop to any subject. Use them to look like a presentation pro.
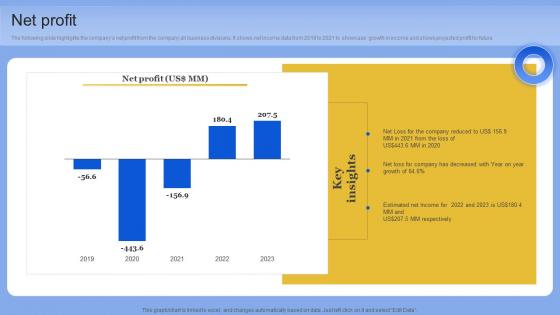
Net Profit Data Analytics Company Outline Diagrams PDF
The following slide highlights the companys net profit from the company all business divisions. It shows net income data from 2019 to 2021 to showcase growth in income and shows projected profit for future. Retrieve professionally designed Net Profit Data Analytics Company Outline Diagrams PDF to effectively convey your message and captivate your listeners. Save time by selecting pre-made slideshows that are appropriate for various topics, from business to educational purposes. These themes come in many different styles, from creative to corporate, and all of them are easily adjustable and can be edited quickly. Access them as PowerPoint templates or as Google Slides themes. You do not have to go on a hunt for the perfect presentation because Slidegeeks got you covered from everywhere. The following slide highlights the companys net profit from the company all business divisions. It shows net income data from 2019 to 2021 to showcase growth in income and shows projected profit for future

Table Of Prescriptive Model Deployment Timeline Data Analytics SS V
This slide provides a deployment table of prescriptive model aimed at highlighting movement of models through various phases. The basis of deployment are stage, start and end date, manager name with resources utilized.The Table Of Prescriptive Model Deployment Timeline Data Analytics SS V is a compilation of the most recent design trends as a series of slides. It is suitable for any subject or industry presentation, containing attractive visuals and photo spots for businesses to clearly express their messages. This template contains a variety of slides for the user to input data, such as structures to contrast two elements, bullet points, and slides for written information. Slidegeeks is prepared to create an impression. This slide provides a deployment table of prescriptive model aimed at highlighting movement of models through various phases. The basis of deployment are stage, start and end date, manager name with resources utilized.
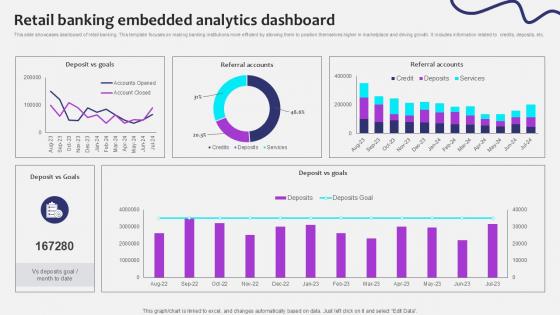
Retail Banking Embedded Analytics Initiating Globalization Of Banking Ppt Powerpoint
This slide showcases dashboard of retail banking. This template focuses on making banking institutions more efficient by allowing them to position themselves higher in marketplace and driving growth. It includes information related to credits, deposits, etc. Are you searching for a Retail Banking Embedded Analytics Initiating Globalization Of Banking Ppt Powerpoint that is uncluttered, straightforward, and original Its easy to edit, and you can change the colors to suit your personal or business branding. For a presentation that expresses how much effort you have put in, this template is ideal With all of its features, including tables, diagrams, statistics, and lists, its perfect for a business plan presentation. Make your ideas more appealing with these professional slides. Download Retail Banking Embedded Analytics Initiating Globalization Of Banking Ppt Powerpoint from Slidegeeks today. This slide showcases dashboard of retail banking. This template focuses on making banking institutions more efficient by allowing them to position themselves higher in marketplace and driving growth. It includes information related to credits, deposits, etc.
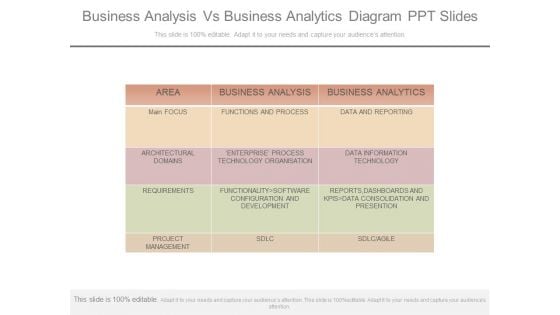
Business Analysis Vs Business Analytics Diagram Ppt Slides
This is a business analysis vs business analytics diagram ppt slides. This is a one stage process. The stages in this process are area, main focus, architectural domains, requirements, project management, business analysis, functions and process, enterprise? process technology organisation, functionality software configuration and development, sdlc, business analytics, data and reporting, data information technology, reports, dashboards and kpis data consolidation and presention, sdlc agile.
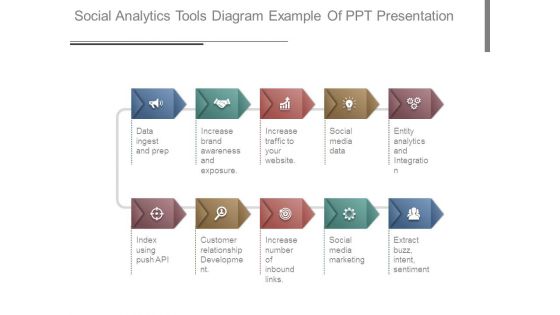
Social Analytics Tools Diagram Example Of Ppt Presentation
This is a social analytics tools diagram example of ppt presentation. This is a ten stage process. The stages in this process are data ingest and prep, increase brand awareness and exposure, increase traffic to your website, social media data, entity analytics and integration, index using push api, customer relationship development, increase number of inbound links, social media marketing, extract buzz, intent, sentiment.
Channel Analytics Ppt PowerPoint Presentation Portfolio Diagrams Cpb
Presenting this set of slides with name channel analytics ppt powerpoint presentation portfolio diagrams cpb. This is a three satge process. The stages in this process are channel analytics. This is a completely editable PowerPoint presentation and is available for immediate download. Download now and impress your audience.
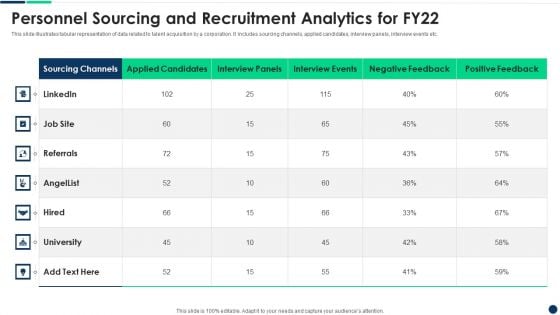
Personnel Sourcing And Recruitment Analytics For FY22 Diagrams PDF
Pitch your topic with ease and precision using this Personnel Sourcing And Recruitment Analytics For FY22 Diagrams PDF This layout presents information on Personnel Sourcing And Recruitment Analytics For Fy22 It is also available for immediate download and adjustment. So, changes can be made in the color, design, graphics or any other component to create a unique layout.
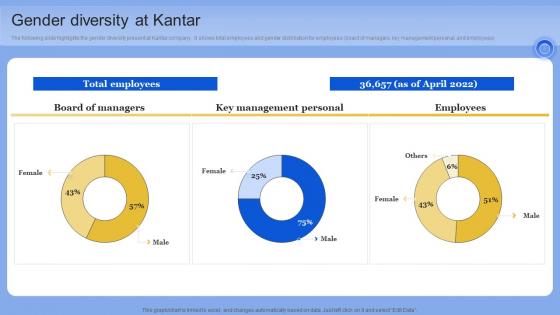
Gender Diversity At Kantar Data Analytics Company Outline Portrait PDF
The following slide highlights the gender diversity present at Kantar company. It shows total employees and gender distribution for employees board of managers, key management personal, and employees. If you are looking for a format to display your unique thoughts, then the professionally designed Gender Diversity At Kantar Data Analytics Company Outline Portrait PDF is the one for you. You can use it as a Google Slides template or a PowerPoint template. Incorporate impressive visuals, symbols, images, and other charts. Modify or reorganize the text boxes as you desire. Experiment with shade schemes and font pairings. Alter, share or cooperate with other people on your work. Download Gender Diversity At Kantar Data Analytics Company Outline Portrait PDF and find out how to give a successful presentation. Present a perfect display to your team and make your presentation unforgettable. The following slide highlights the gender diversity present at Kantar company. It shows total employees and gender distribution for employees board of managers, key management personal, and employees
Dashboard Tracking Business Major Promotional Analytics Future Trends Clipart Pdf
This slide covers the dashboard for analyzing blogging KPIs such as performance, published posts, views, new blog subscribers, top blog posts by pageviews, top blog posts by CTR, etc. If you are looking for a format to display your unique thoughts, then the professionally designed Dashboard Tracking Business Major Promotional Analytics Future Trends Clipart Pdf is the one for you. You can use it as a Google Slides template or a PowerPoint template. Incorporate impressive visuals, symbols, images, and other charts. Modify or reorganize the text boxes as you desire. Experiment with shade schemes and font pairings. Alter, share or cooperate with other people on your work. Download Dashboard Tracking Business Major Promotional Analytics Future Trends Clipart Pdf and find out how to give a successful presentation. Present a perfect display to your team and make your presentation unforgettable. This slide covers the dashboard for analyzing blogging KPIs such as performance, published posts, views, new blog subscribers, top blog posts by pageviews, top blog posts by CTR, etc.
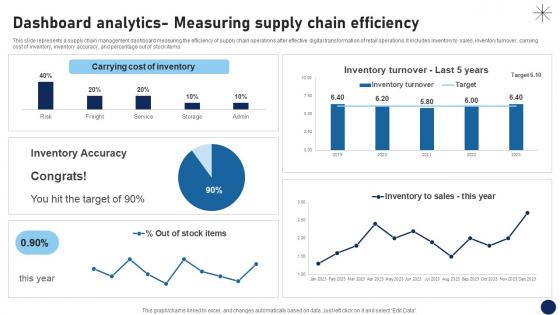
Dashboard Analytics Measuring Supply Chain Efficiency DT SS V
This slide represents a supply chain management dashboard measuring the efficiency of supply chain operations after effective digital transformation of retail operations. It includes inventory to sales, inventory turnover, carrying cost of inventory, inventory accuracy, and percentage out of stock items.If you are looking for a format to display your unique thoughts, then the professionally designed Dashboard Analytics Measuring Supply Chain Efficiency DT SS V is the one for you. You can use it as a Google Slides template or a PowerPoint template. Incorporate impressive visuals, symbols, images, and other charts. Modify or reorganize the text boxes as you desire. Experiment with shade schemes and font pairings. Alter, share or cooperate with other people on your work. Download Dashboard Analytics Measuring Supply Chain Efficiency DT SS V and find out how to give a successful presentation. Present a perfect display to your team and make your presentation unforgettable. This slide represents a supply chain management dashboard measuring the efficiency of supply chain operations after effective digital transformation of retail operations. It includes inventory to sales, inventory turnover, carrying cost of inventory, inventory accuracy, and percentage out of stock items.

 Home
Home