Analytics
KPI Dashboard For Tracking Major Promotional Analytics Future Trends Clipart Pdf
This slide covers the dashboard for analysing email marketing metrics such as overall open rate, click through rate, click to open ratio, unsubscribe rate, hard bounce rate, soft rate, monthly open rate, total monthly subscribers, etc. The best PPT templates are a great way to save time, energy, and resources. Slidegeeks have 100 percent editable powerpoint slides making them incredibly versatile. With these quality presentation templates, you can create a captivating and memorable presentation by combining visually appealing slides and effectively communicating your message. Download KPI Dashboard For Tracking Major Promotional Analytics Future Trends Clipart Pdf from Slidegeeks and deliver a wonderful presentation. This slide covers the dashboard for analysing email marketing metrics such as overall open rate, click through rate, click to open ratio, unsubscribe rate, hard bounce rate, soft rate, monthly open rate, total monthly subscribers, etc.
Tracking Social Media Engagement Major Promotional Analytics Future Trends Diagrams Pdf
This slide covers an overview of the social media engagement rate to identify if the content is reaching the target audience. It also includes improvement strategies such as having a consistent, authentic voice, knowing your algorithms, and creating shareable content. Slidegeeks is one of the best resources for PowerPoint templates. You can download easily and regulate Tracking Social Media Engagement Major Promotional Analytics Future Trends Diagrams Pdf for your personal presentations from our wonderful collection. A few clicks is all it takes to discover and get the most relevant and appropriate templates. Use our Templates to add a unique zing and appeal to your presentation and meetings. All the slides are easy to edit and you can use them even for advertisement purposes. This slide covers an overview of the social media engagement rate to identify if the content is reaching the target audience. It also includes improvement strategies such as having a consistent, authentic voice, knowing your algorithms, and creating shareable content.
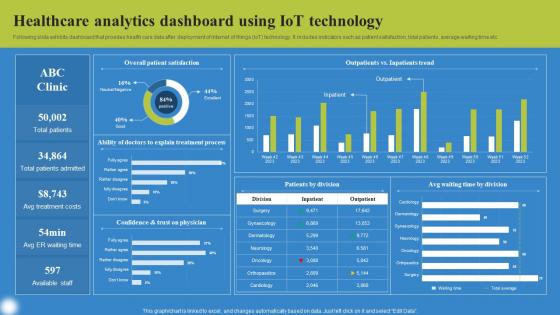
Healthcare Analytics Dashboard Using Deploying IoT Solutions For Enhanced Healthcare Background Pdf
Following slide exhibits dashboard that provides health care data after deployment of internet of things IoT technology. It includes indicators such as patient satisfaction, total patients, average waiting time etc. Do you know about Slidesgeeks Healthcare Analytics Dashboard Using Deploying IoT Solutions For Enhanced Healthcare Background Pdf These are perfect for delivering any kind od presentation. Using it, create PowerPoint presentations that communicate your ideas and engage audiences. Save time and effort by using our pre designed presentation templates that are perfect for a wide range of topic. Our vast selection of designs covers a range of styles, from creative to business, and are all highly customizable and easy to edit. Download as a PowerPoint template or use them as Google Slides themes. Following slide exhibits dashboard that provides health care data after deployment of internet of things IoT technology. It includes indicators such as patient satisfaction, total patients, average waiting time etc.
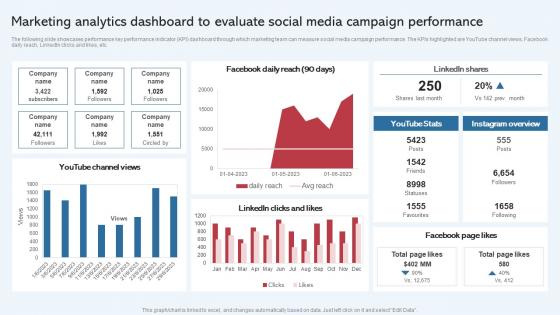
Marketing Analytics Dashboard To Evaluate Social Effective Startup Promotion Structure Rules Pdf
The following slide showcases performance key performance indicator KPI dashboard through which marketing team can measure social media campaign performance. The KPIs highlighted are YouTube channel views, Facebook daily reach, LinkedIn clicks and likes, etc. The best PPT templates are a great way to save time, energy, and resources. Slidegeeks have 100 percent editable powerpoint slides making them incredibly versatile. With these quality presentation templates, you can create a captivating and memorable presentation by combining visually appealing slides and effectively communicating your message. Download Marketing Analytics Dashboard To Evaluate Social Effective Startup Promotion Structure Rules Pdf from Slidegeeks and deliver a wonderful presentation. The following slide showcases performance key performance indicator KPI dashboard through which marketing team can measure social media campaign performance. The KPIs highlighted are YouTube channel views, Facebook daily reach, LinkedIn clicks and likes, etc.
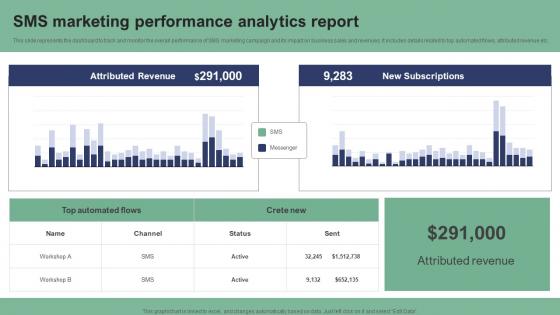
SMS Marketing Performance Analytics Report Text Message Marketing Strategies Structure Pdf
This slide represents the dashboard to track and monitor the overall performance of SMS marketing campaign and its impact on business sales and revenues. It includes details related to top automated flows, attributed revenue etc. From laying roadmaps to briefing everything in detail, our templates are perfect for you. You can set the stage with your presentation slides. All you have to do is download these easy-to-edit and customizable templates. SMS Marketing Performance Analytics Report Text Message Marketing Strategies Structure Pdf will help you deliver an outstanding performance that everyone would remember and praise you for. Do download this presentation today. This slide represents the dashboard to track and monitor the overall performance of SMS marketing campaign and its impact on business sales and revenues. It includes details related to top automated flows, attributed revenue etc.
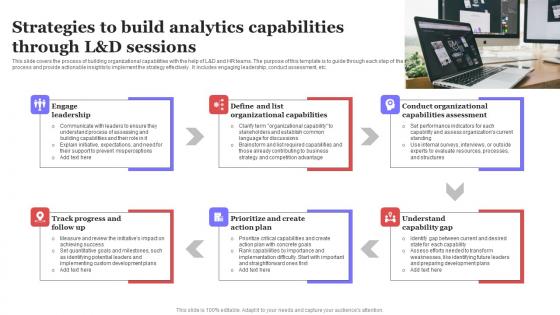
Strategies To Build Analytics Capabilities Through L And D Sessions Ppt Styles Picture PDF
This slide covers the process of building organizational capabilities with the help of LandD and HR teams. The purpose of this template is to guide through each step of the process and provide actionable insights to implement the strategy effectively. It includes engaging leadership, conduct assessment, etc. Showcasing this set of slides titled Strategies To Build Analytics Capabilities Through L And D Sessions Ppt Styles Picture PDF. The topics addressed in these templates are Strategy Effectively, Engaging Leadership, Conduct Assessment. All the content presented in this PPT design is completely editable. Download it and make adjustments in color, background, font etc. as per your unique business setting. This slide covers the process of building organizational capabilities with the help of LandD and HR teams. The purpose of this template is to guide through each step of the process and provide actionable insights to implement the strategy effectively. It includes engaging leadership, conduct assessment, etc.
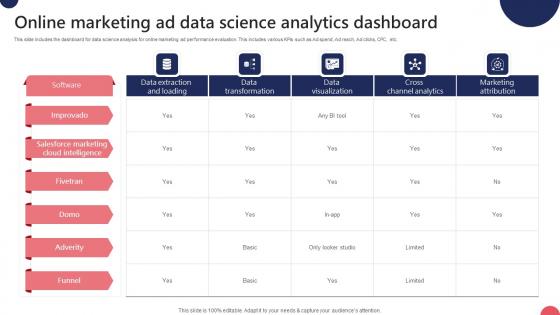
Online Marketing Ad Data Science Analytics Dashboard Ppt Inspiration Guidelines Pdf
This slide includes the dashboard for data science analysis for online marketing ad performance evaluation. This includes various KPIs such as Ad spend, Ad reach, Ad clicks, CPC, etc. Pitch your topic with ease and precision using this Online Marketing Ad Data Science Analytics Dashboard Ppt Inspiration Guidelines Pdf. This layout presents information on Ad Spend, Cost Per Thousand, Cost Per Click. It is also available for immediate download and adjustment. So, changes can be made in the color, design, graphics or any other component to create a unique layout. This slide includes the dashboard for data science analysis for online marketing ad performance evaluation. This includes various KPIs such as Ad spend, Ad reach, Ad clicks, CPC, etc.
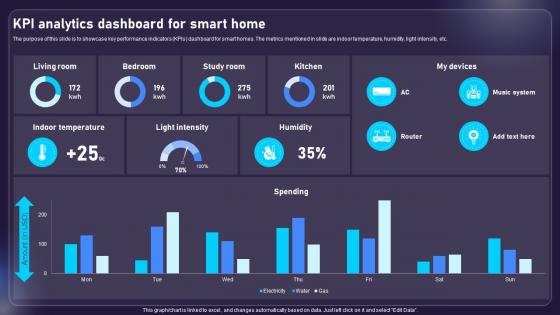
Kpi Analytics Dashboard For Smart Home AIOT Applications For Various Industries IoT SS V
The purpose of this slide is to showcase key performance indicators KPIs dashboard for smart homes. The metrics mentioned in slide are indoor temperature, humidity, light intensity, etc. Slidegeeks has constructed Kpi Analytics Dashboard For Smart Home AIOT Applications For Various Industries IoT SS V after conducting extensive research and examination. These presentation templates are constantly being generated and modified based on user preferences and critiques from editors. Here, you will find the most attractive templates for a range of purposes while taking into account ratings and remarks from users regarding the content. This is an excellent jumping-off point to explore our content and will give new users an insight into our top-notch PowerPoint Templates. The purpose of this slide is to showcase key performance indicators KPIs dashboard for smart homes. The metrics mentioned in slide are indoor temperature, humidity, light intensity, etc.

Equity Asset Allocation Dashboard Analytics Strategic Investment Plan For Optimizing Risk SS V
This slide represents an equity asset allocation dashboard to measure and manage the performance of equity overtime. It tracks KPIs such as, average position size, market cap distribution, average PE distribution, ratio and yield, by geography, industry, currency and holding lists.If your project calls for a presentation, then Slidegeeks is your go-to partner because we have professionally designed, easy-to-edit templates that are perfect for any presentation. After downloading, you can easily edit Equity Asset Allocation Dashboard Analytics Strategic Investment Plan For Optimizing Risk SS V and make the changes accordingly. You can rearrange slides or fill them with different images. Check out all the handy templates This slide represents an equity asset allocation dashboard to measure and manage the performance of equity overtime. It tracks KPIs such as, average position size, market cap distribution, average PE distribution, ratio and yield, by geography, industry, currency and holding lists.
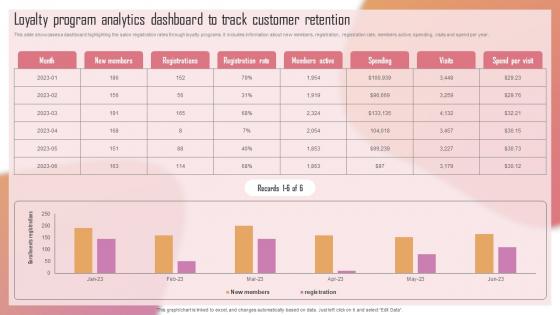
Customizing The Salon Experience Loyalty Program Analytics Dashboard To Track Customer Strategy SS V
This slide showcases a dashboard highlighting the salon registration rates through loyalty programs. It includes information about new members, registration, registration rate, members active, spending, visits and spend per year. There are so many reasons you need a Customizing The Salon Experience Loyalty Program Analytics Dashboard To Track Customer Strategy SS V. The first reason is you can not spend time making everything from scratch, Thus, Slidegeeks has made presentation templates for you too. You can easily download these templates from our website easily. This slide showcases a dashboard highlighting the salon registration rates through loyalty programs. It includes information about new members, registration, registration rate, members active, spending, visits and spend per year.
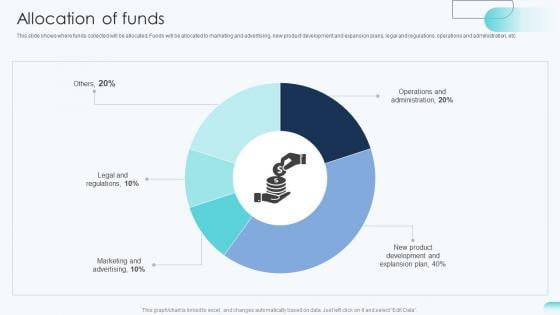
Allocation Of Funds Big Data Analytics Investor Funding Elevator Pitch Deck
This slide shows where funds collected will be allocated. Funds will be allocated to marketing and advertising, new product development and expansion plans, legal and regulations, operations and administration, etc. Find a pre-designed and impeccable Allocation Of Funds Big Data Analytics Investor Funding Elevator Pitch Deck. The templates can ace your presentation without additional effort. You can download these easy-to-edit presentation templates to make your presentation stand out from others. So, what are you waiting for Download the template from Slidegeeks today and give a unique touch to your presentation. This slide shows where funds collected will be allocated. Funds will be allocated to marketing and advertising, new product development and expansion plans, legal and regulations, operations and administration, etc.
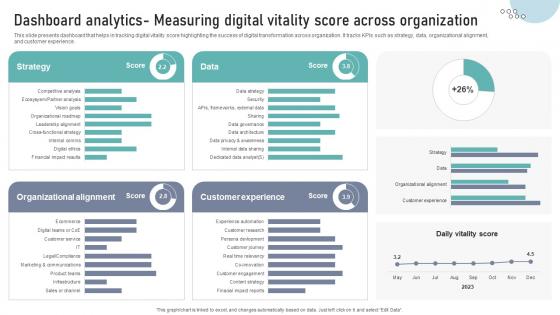
Dashboard Analytics Measuring Digital Vitality Score Across Organization DT SS V
This slide presents dashboard that helps in tracking digital vitality score highlighting the success of digital transformation across organization. It tracks KPIs such as strategy, data, organizational alignment,and customer experience.Make sure to capture your audiences attention in your business displays with our gratis customizable Dashboard Analytics Measuring Digital Vitality Score Across Organization DT SS V. These are great for business strategies, office conferences, capital raising or task suggestions. If you desire to acquire more customers for your tech business and ensure they stay satisfied, create your own sales presentation with these plain slides. This slide presents dashboard that helps in tracking digital vitality score highlighting the success of digital transformation across organization. It tracks KPIs such as strategy, data, organizational alignment,and customer experience.
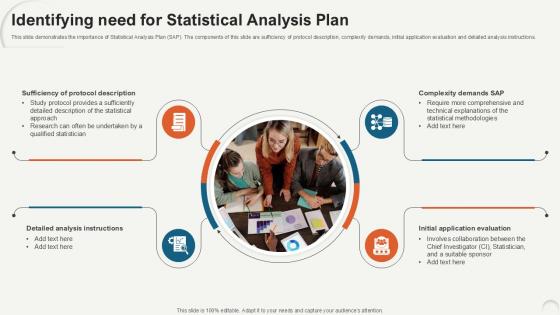
Identifying Need For Statistical Data Analytics For Informed Decision Ppt PowerPoint
This slide demonstrates the importance of Statistical Analysis Plan SAP. The components of this slide are sufficiency of protocol description, complexity demands, initial application evaluation and detailed analysis instructions. Coming up with a presentation necessitates that the majority of the effort goes into the content and the message you intend to convey. The visuals of a PowerPoint presentation can only be effective if it supplements and supports the story that is being told. Keeping this in mind our experts created Identifying Need For Statistical Data Analytics For Informed Decision Ppt PowerPoint to reduce the time that goes into designing the presentation. This way, you can concentrate on the message while our designers take care of providing you with the right template for the situation. This slide demonstrates the importance of Statistical Analysis Plan SAP. The components of this slide are sufficiency of protocol description, complexity demands, initial application evaluation and detailed analysis instructions.

Overview Of Different Types Of Data Analytics For Informed Decision Ppt PowerPoint
This slide outlines the various types of statistical analysis. These are mechanistic analysis, descriptive statistical analysis, inferential statistical analysis, predictive statistical analysis, prescriptive statistical analysis, exploratory data analysis, etc. The Overview Of Different Types Of Data Analytics For Informed Decision Ppt PowerPoint is a compilation of the most recent design trends as a series of slides. It is suitable for any subject or industry presentation, containing attractive visuals and photo spots for businesses to clearly express their messages. This template contains a variety of slides for the user to input data, such as structures to contrast two elements, bullet points, and slides for written information. Slidegeeks is prepared to create an impression. This slide outlines the various types of statistical analysis. These are mechanistic analysis, descriptive statistical analysis, inferential statistical analysis, predictive statistical analysis, prescriptive statistical analysis, exploratory data analysis, etc.
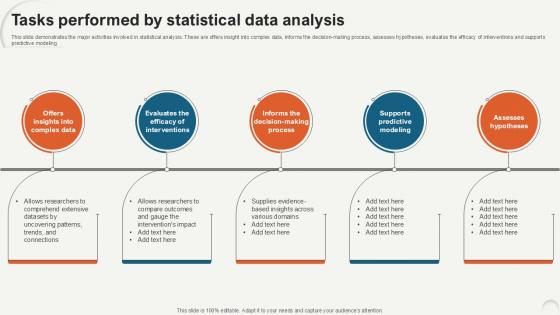
Tasks Performed By Statistical Data Analytics For Informed Decision Ppt Presentation
This slide demonstrates the major activities involved in statistical analysis. These are offers insight into complex data, informs the decision-making process, assesses hypotheses, evaluates the efficacy of interventions and supports predictive modeling. Present like a pro with Tasks Performed By Statistical Data Analytics For Informed Decision Ppt Presentation. Create beautiful presentations together with your team, using our easy-to-use presentation slides. Share your ideas in real-time and make changes on the fly by downloading our templates. So whether you are in the office, on the go, or in a remote location, you can stay in sync with your team and present your ideas with confidence. With Slidegeeks presentation got a whole lot easier. Grab these presentations today. This slide demonstrates the major activities involved in statistical analysis. These are offers insight into complex data, informs the decision-making process, assesses hypotheses, evaluates the efficacy of interventions and supports predictive modeling.
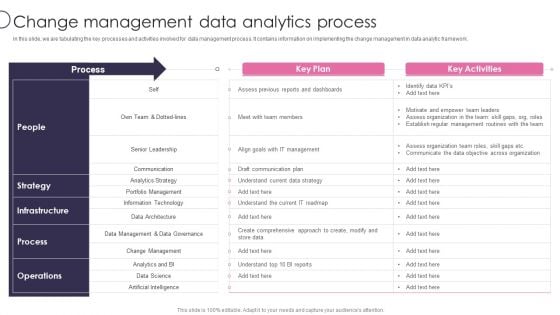
Information Transformation Process Toolkit Change Management Data Analytics Process Elements PDF
In this slide, we are tabulating the key processes and activities involved for data management process. It contains information on implementing the change management in data analytic framework. Deliver an awe inspiring pitch with this creative Information Transformation Process Toolkit Change Management Data Analytics Process Elements PDF bundle. Topics like Information Technology, Data Architecture, Analytics Strategy can be discussed with this completely editable template. It is available for immediate download depending on the needs and requirements of the user.
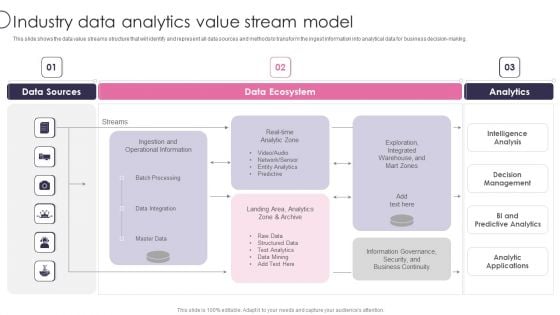
Information Transformation Process Toolkit Industry Data Analytics Value Stream Model Warehouse Template PDF
This slide shows the data value streams structure that will identify and represent all data sources and methods to transform the ingest information into analytical data for business decision making. Deliver an awe inspiring pitch with this creative Information Transformation Process Toolkit Industry Data Analytics Value Stream Model Warehouse Template PDF bundle. Topics like Data Sources, Data Ecosystem, Analytics can be discussed with this completely editable template. It is available for immediate download depending on the needs and requirements of the user.
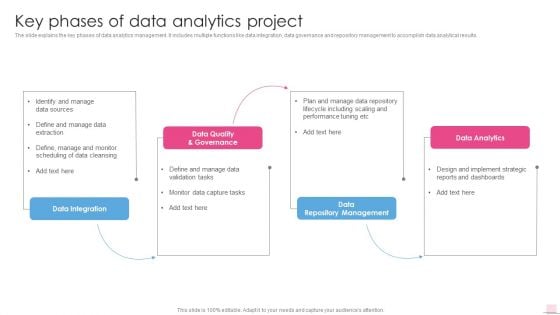
Key Phases Of Data Analytics Project Business Analysis Modification Toolkit Diagrams PDF
The slide explains the key phases of data analytics management. It includes multiple functions like data integration, data governance and repository management to accomplish data analytical results.Deliver and pitch your topic in the best possible manner with this Key Phases Of Data Analytics Project Business Analysis Modification Toolkit Diagrams PDF. Use them to share invaluable insights on Data Quality Governance, Performance Tuning, Including Scaling and impress your audience. This template can be altered and modified as per your expectations. So, grab it now.
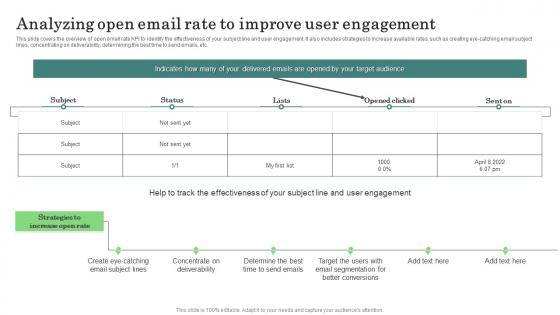
Analyzing Open Email Rate Improve Major Promotional Analytics Future Trends Portrait Pdf
This slide covers the overview of open email rate KPI to identify the effectiveness of your subject line and user engagement. It also includes strategies to increase available rates, such as creating eye catching email subject lines, concentrating on deliverability, determining the best time to send emails, etc. Get a simple yet stunning designed Analyzing Open Email Rate Improve Major Promotional Analytics Future Trends Portrait Pdf. It is the best one to establish the tone in your meetings. It is an excellent way to make your presentations highly effective. So, download this PPT today from Slidegeeks and see the positive impacts. Our easy to edit Analyzing Open Email Rate Improve Major Promotional Analytics Future Trends Portrait Pdf can be your go to option for all upcoming conferences and meetings. So, what are you waiting for Grab this template today. This slide covers the overview of open email rate KPI to identify the effectiveness of your subject line and user engagement. It also includes strategies to increase available rates, such as creating eye catching email subject lines, concentrating on deliverability, determining the best time to send emails, etc.
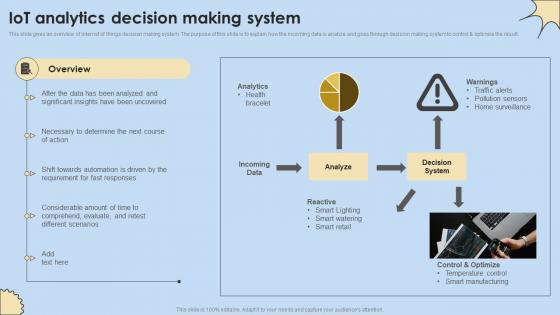
IoT Analytics Decision Making System Internet Of Things Analysis Professional Pdf
This slide gives an overview of internet of things decision making system. The purpose of this slide is to explain how the incoming data is analyze and goes through decision making system to control and optimize the result. Welcome to our selection of the IoT Analytics Decision Making System Internet Of Things Analysis Professional Pdf. These are designed to help you showcase your creativity and bring your sphere to life. Planning and Innovation are essential for any business that is just starting out. This collection contains the designs that you need for your everyday presentations. All of our PowerPoints are 100 percent editable, so you can customize them to suit your needs. This multi-purpose template can be used in various situations. Grab these presentation templates today. This slide gives an overview of internet of things decision making system. The purpose of this slide is to explain how the incoming data is analyze and goes through decision making system to control and optimize the result.
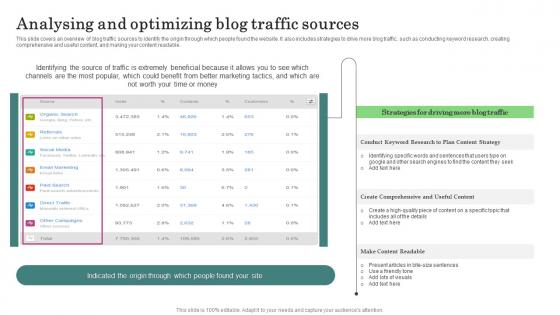
Analysing And Optimizing Blog Major Promotional Analytics Future Trends Inspiration Pdf
This slide covers an overview of blog traffic sources to identify the origin through which people found the website. It also includes strategies to drive more blog traffic, such as conducting keyword research, creating comprehensive and useful content, and making your content readable. This Analysing And Optimizing Blog Major Promotional Analytics Future Trends Inspiration Pdf from Slidegeeks makes it easy to present information on your topic with precision. It provides customization options, so you can make changes to the colors, design, graphics, or any other component to create a unique layout. It is also available for immediate download, so you can begin using it right away. Slidegeeks has done good research to ensure that you have everything you need to make your presentation stand out. Make a name out there for a brilliant performance. This slide covers an overview of blog traffic sources to identify the origin through which people found the website. It also includes strategies to drive more blog traffic, such as conducting keyword research, creating comprehensive and useful content, and making your content readable.
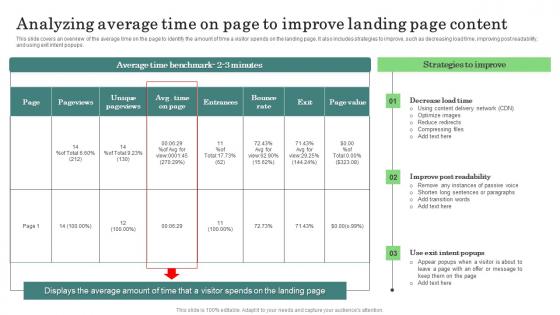
Analyzing Average Time Page Major Promotional Analytics Future Trends Microsoft Pdf
This slide covers an overview of the average time on the page to identify the amount of time a visitor spends on the landing page. It also includes strategies to improve, such as decreasing load time, improving post readability, and using exit intent popups. Take your projects to the next level with our ultimate collection of Analyzing Average Time Page Major Promotional Analytics Future Trends Microsoft Pdf. Slidegeeks has designed a range of layouts that are perfect for representing task or activity duration, keeping track of all your deadlines at a glance. Tailor these designs to your exact needs and give them a truly corporate look with your own brand colors they will make your projects stand out from the rest This slide covers an overview of the average time on the page to identify the amount of time a visitor spends on the landing page. It also includes strategies to improve, such as decreasing load time, improving post readability, and using exit intent popups.
Tracking Spam Complaint Rate Major Promotional Analytics Future Trends Mockup Pdf
This slide covers an overview of the spam rate to identify the number of recipients who mark messages as spam in their inboxes. It also includes strategies to reduce spam, such as sending emails only to those who have opted to receive them, segmenting your email list, etc. Want to ace your presentation in front of a live audience Our Tracking Spam Complaint Rate Major Promotional Analytics Future Trends Mockup Pdf can help you do that by engaging all the users towards you. Slidegeeks experts have put their efforts and expertise into creating these impeccable powerpoint presentations so that you can communicate your ideas clearly. Moreover, all the templates are customizable, and easy to edit and downloadable. Use these for both personal and commercial use. This slide covers an overview of the spam rate to identify the number of recipients who mark messages as spam in their inboxes. It also includes strategies to reduce spam, such as sending emails only to those who have opted to receive them, segmenting your email list, etc.

Why Invest With Us Financial Analytics Platform Investor Elevator Pitch Deck
This slide exhibits strengths and compelling reasons for investors to invest in company. It showcases benefits that the company possesses such as domain expertise, talented people, and support to provide an incredible customer experience. Are you in need of a template that can accommodate all of your creative concepts This one is crafted professionally and can be altered to fit any style. Use it with Google Slides or PowerPoint. Include striking photographs, symbols, depictions, and other visuals. Fill, move around, or remove text boxes as desired. Test out color palettes and font mixtures. Edit and save your work, or work with colleagues. Download Why Invest With Us Financial Analytics Platform Investor Elevator Pitch Deck and observe how to make your presentation outstanding. Give an impeccable presentation to your group and make your presentation unforgettable. This slide exhibits strengths and compelling reasons for investors to invest in company. It showcases benefits that the company possesses such as domain expertise, talented people, and support to provide an incredible customer experience.
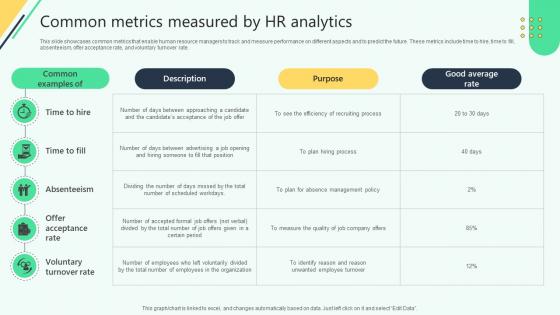
Common Metrics Measured By Hr Analytics Analysing Hr Data For Effective Decision Making
This slide showcases common metrics that enable human resource managers to track and measure performance on different aspects and to predict the future. These metrics include time to hire, time to fill,absenteeism, offer acceptance rate, and voluntary turnover rate. Slidegeeks is here to make your presentations a breeze with Common Metrics Measured By Hr Analytics Analysing Hr Data For Effective Decision Making With our easy-to-use and customizable templates, you can focus on delivering your ideas rather than worrying about formatting. With a variety of designs to choose from, you are sure to find one that suits your needs. And with animations and unique photos, illustrations, and fonts, you can make your presentation pop. So whether you are giving a sales pitch or presenting to the board, make sure to check out Slidegeeks first This slide showcases common metrics that enable human resource managers to track and measure performance on different aspects and to predict the future. These metrics include time to hire, time to fill,absenteeism, offer acceptance rate, and voluntary turnover rate.
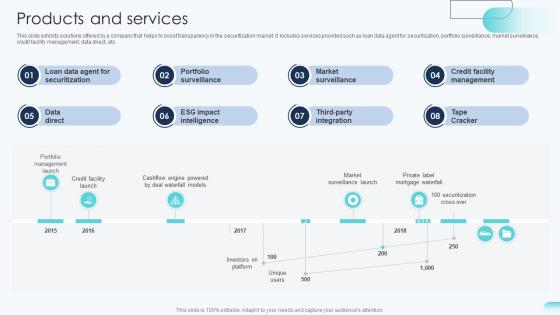
Products And Services Big Data Analytics Investor Funding Elevator Pitch Deck
This slide exhibits solutions offered by a company that helps to boost transparency in the securitization market. It includes services provided such as loan data agent for securitization, portfolio surveillance, market surveillance, credit facility management, data direct, etc. Coming up with a presentation necessitates that the majority of the effort goes into the content and the message you intend to convey. The visuals of a PowerPoint presentation can only be effective if it supplements and supports the story that is being told. Keeping this in mind our experts created Products And Services Big Data Analytics Investor Funding Elevator Pitch Deck to reduce the time that goes into designing the presentation. This way, you can concentrate on the message while our designers take care of providing you with the right template for the situation. This slide exhibits solutions offered by a company that helps to boost transparency in the securitization market. It includes services provided such as loan data agent for securitization, portfolio surveillance, market surveillance, credit facility management, data direct, etc.
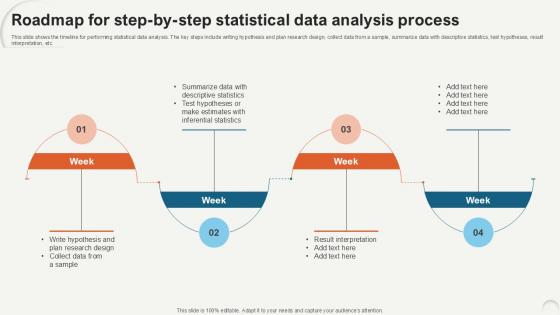
Roadmap For Step By Step Statistical Data Analytics For Informed Decision Ppt PowerPoint
This slide shows the timeline for performing statistical data analysis. The key steps include writing hypothesis and plan research design, collect data from a sample, summarize data with descriptive statistics, test hypotheses, result interpretation, etc. Retrieve professionally designed Roadmap For Step By Step Statistical Data Analytics For Informed Decision Ppt PowerPoint to effectively convey your message and captivate your listeners. Save time by selecting pre-made slideshows that are appropriate for various topics, from business to educational purposes. These themes come in many different styles, from creative to corporate, and all of them are easily adjustable and can be edited quickly. Access them as PowerPoint templates or as Google Slides themes. You do not have to go on a hunt for the perfect presentation because Slidegeeks got you covered from everywhere. This slide shows the timeline for performing statistical data analysis. The key steps include writing hypothesis and plan research design, collect data from a sample, summarize data with descriptive statistics, test hypotheses, result interpretation, etc.
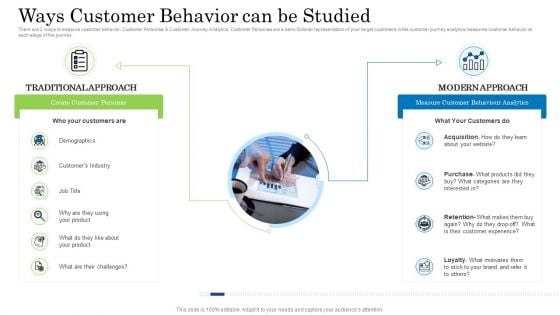
Customer Behavioral Data And Analytics Ways Customer Behavior Can Be Studied Elements PDF
There are 2 ways to measure customer behavior Customer Personas and Customer Journey Analytics. Customer Personas are a semi fictional representation of your target customers while customer journey analytics measures customer behavior at each stage of the journey.This is a customer behavioral data and analytics ways customer behavior can be studied elements pdf template with various stages. Focus and dispense information on two stages using this creative set, that comes with editable features. It contains large content boxes to add your information on topics like customers, demographics, customers industry, acquisition, purchase. You can also showcase facts, figures, and other relevant content using this PPT layout. Grab it now.
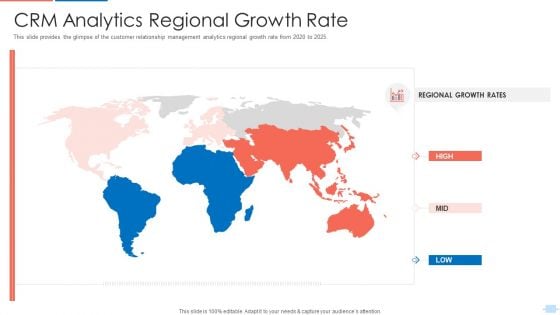
Customer Relationship Management Application Investor CRM Analytics Regional Growth Rate Elements PDF
This slide provides the glimpse of the customer relationship management analytics regional growth rate from 2020 to 2025. This is a customer relationship management application investor crm analytics regional growth rate elements pdf template with various stages. Focus and dispense information on one stage using this creative set, that comes with editable features. It contains large content boxes to add your information on topics like crm analytics regional growth rate. You can also showcase facts, figures, and other relevant content using this PPT layout. Grab it now.
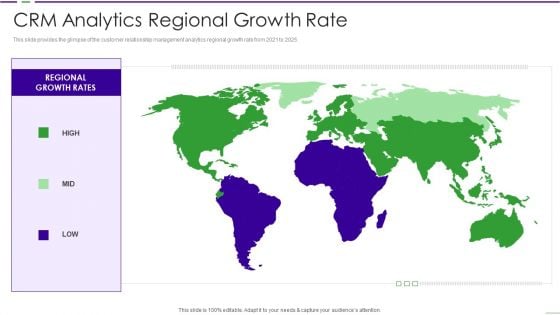
CRM Investor Fundraising Pitch Deck CRM Analytics Regional Growth Rate Ppt PowerPoint Presentation File Format PDF
This slide provides the glimpse of the customer relationship management analytics regional growth rate from 2021 to 2025. Presenting crm investor fundraising pitch deck crm analytics regional growth rate ppt powerpoint presentation file format pdf to provide visual cues and insights. Share and navigate important information on three stages that need your due attention. This template can be used to pitch topics like crm analytics regional growth rate. In addtion, this PPT design contains high resolution images, graphics, etc, that are easily editable and available for immediate download.
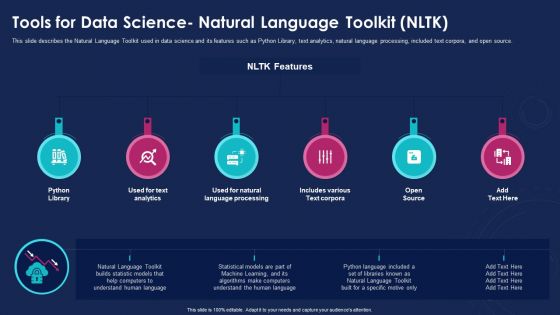
Data Analytics IT Tools For Data Science Natural Language Toolkit NLTK Ppt Professional Guidelines PDF
This slide describes the Natural Language Toolkit used in data science and its features such as Python Library, text analytics, natural language processing, included text corpora, and open source. Presenting data analytics it tools for data science natural language toolkit nltk ppt professional guidelines pdf to provide visual cues and insights. Share and navigate important information on six stages that need your due attention. This template can be used to pitch topics like python library, analytics, processing, open source. In addtion, this PPT design contains high resolution images, graphics, etc, that are easily editable and available for immediate download.
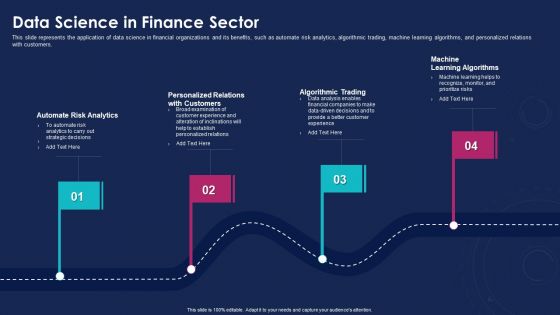
Data Analytics IT Data Science In Finance Sector Ppt Gallery Inspiration PDF
This slide represents the application of data science in financial organizations and its benefits, such as automate risk analytics, algorithmic trading, machine learning algorithms, and personalized relations with customers. This is a data analytics it data science in finance sector ppt gallery inspiration pdf template with various stages. Focus and dispense information on four stages using this creative set, that comes with editable features. It contains large content boxes to add your information on topics like automate risk analytics, personalized relations with customers, algorithmic trading, machine learning algorithms. You can also showcase facts, figures, and other relevant content using this PPT layout. Grab it now.
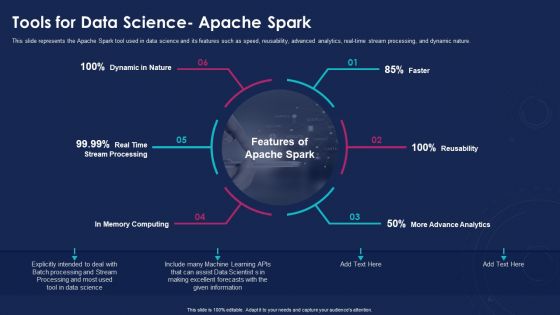
Data Analytics IT Tools For Data Science Apache Spark Ppt Styles Tips PDF
This slide represents the Apache Spark tool used in data science and its features such as speed, reusability, advanced analytics, real-time stream processing, and dynamic nature. This is a data analytics it tools for data science apache spark ppt styles tips pdf template with various stages. Focus and dispense information on six stages using this creative set, that comes with editable features. It contains large content boxes to add your information on topics like dynamic in nature, faster, reusability, real time stream processing, advance analytics. You can also showcase facts, figures, and other relevant content using this PPT layout. Grab it now.
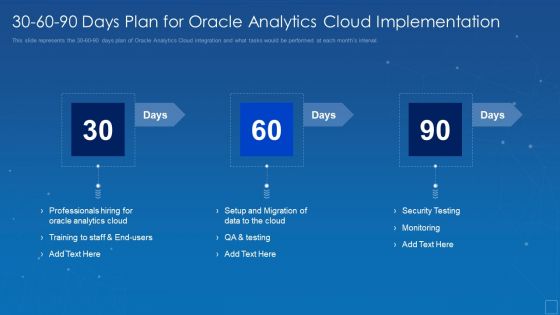
30 60 90 Days Plan For Oracle Analytics Cloud Implementation Mockup PDF
This slide represents the 30 60 90 days plan of Oracle Analytics Cloud integration and what tasks would be performed at each months interval. Presenting 30 60 90 days plan for oracle analytics cloud implementation mockup pdf to provide visual cues and insights. Share and navigate important information on three stages that need your due attention. This template can be used to pitch topics like training, professionals, analytics, staff, migration. In addtion, this PPT design contains high resolution images, graphics, etc, that are easily editable and available for immediate download.
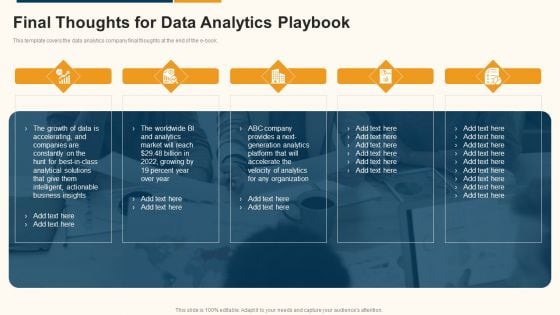
Data Interpretation And Analysis Playbook Final Thoughts For Data Analytics Playbook Graphics PDF
This template covers the data analytics company final thoughts at the end of the e-book. This is a data interpretation and analysis playbook final thoughts for data analytics playbook graphics pdf template with various stages. Focus and dispense information on five stages using this creative set, that comes with editable features. It contains large content boxes to add your information on topics like business, analytics, growth, organization. You can also showcase facts, figures, and other relevant content using this PPT layout. Grab it now.
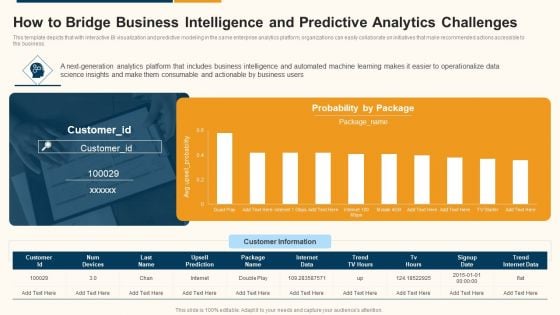
Data Interpretation And Analysis Playbook How To Bridge Business Intelligence And Predictive Analytics Challenges Designs PDF
This template depicts that with interactive BI visualization and predictive modeling in the same enterprise analytics platform, organizations can easily collaborate on initiatives that make recommended actions accessible to the business. Deliver an awe inspiring pitch with this creative data interpretation and analysis playbook how to bridge business intelligence and predictive analytics challenges designs pdf bundle. Topics like how to bridge business intelligence and predictive analytics challenges can be discussed with this completely editable template. It is available for immediate download depending on the needs and requirements of the user.
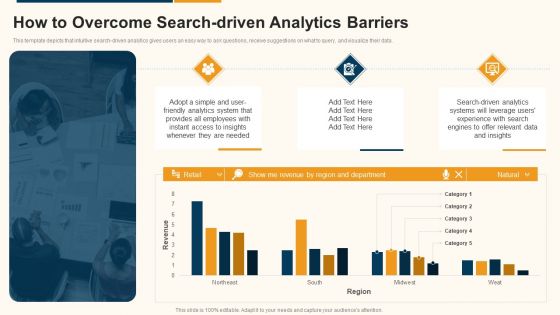
Data Interpretation And Analysis Playbook How To Overcome Search Driven Analytics Barriers Summary PDF
This template depicts that intuitive search-driven analytics gives users an easy way to ask questions, receive suggestions on what to query, and visualize their data. Deliver and pitch your topic in the best possible manner with this data interpretation and analysis playbook how to overcome search driven analytics barriers summary pdf. Use them to share invaluable insights on how to overcome search driven analytics barriers and impress your audience. This template can be altered and modified as per your expectations. So, grab it now.

Executing Advance Data Analytics At Workspace Determine Dimensions For Digitally Summary PDF
This slide provides information regarding the areas in which firm can digitally advanced such as infrastructure, base technology and data analytics engine and application. Firm can choose any or all the dimensions as per requirement at a time. Presenting executing advance data analytics at workspace determine dimensions for digitally summary pdf to provide visual cues and insights. Share and navigate important information on four stages that need your due attention. This template can be used to pitch topics like infrastructure, technology, analytics. In addtion, this PPT design contains high resolution images, graphics, etc, that are easily editable and available for immediate download.
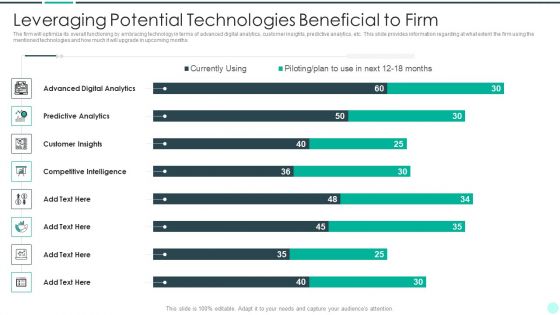
Executing Advance Data Analytics At Workspace Leveraging Potential Technologies Rules PDF
The firm will optimize its overall functioning by embracing technology in terms of advanced digital analytics, customer insights, predictive analytics, etc. This slide provides information regarding at what extent the firm using the mentioned technologies and how much it will upgrade in upcoming months. Deliver and pitch your topic in the best possible manner with this executing advance data analytics at workspace leveraging potential technologies rules pdf. Use them to share invaluable insights on leveraging potential technologies beneficial to firm and impress your audience. This template can be altered and modified as per your expectations. So, grab it now.
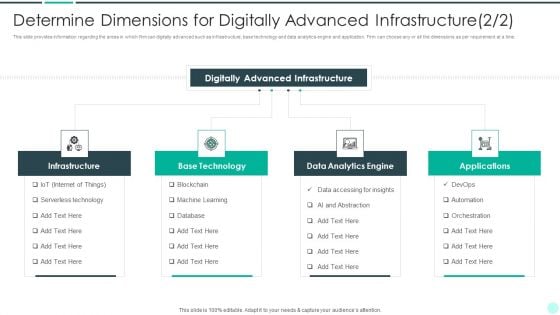
Executing Advance Data Analytics At Workspace Determine Dimensions For Digitally Ideas PDF
This slide provides information regarding the areas in which firm can digitally advanced such as infrastructure, base technology and data analytics engine and application. Firm can choose any or all the dimensions as per requirement at a time. Presenting executing advance data analytics at workspace determine dimensions for digitally ideas pdf to provide visual cues and insights. Share and navigate important information on four stages that need your due attention. This template can be used to pitch topics like infrastructure, base technology, analytics engine . In addtion, this PPT design contains high resolution images, graphics, etc, that are easily editable and available for immediate download.
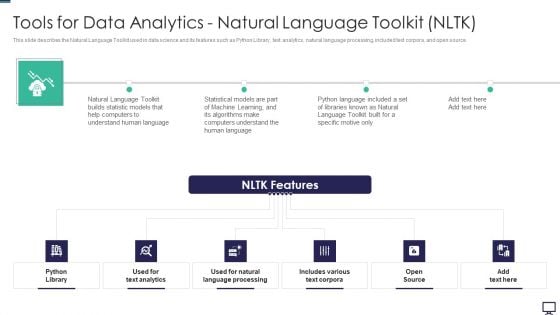
Tools For Data Analytics Natural Language Toolkit NLTK Ppt Pictures Example Introduction PDF
This slide describes the Natural Language Toolkit used in data science and its features such as Python Library, text analytics, natural language processing, included text corpora, and open source. This is a tools for data analytics natural language toolkit nltk ppt pictures example introduction pdf template with various stages. Focus and dispense information on four stages using this creative set, that comes with editable features. It contains large content boxes to add your information on topics like tools for data analytics natural language toolkit nltk. You can also showcase facts, figures, and other relevant content using this PPT layout. Grab it now.
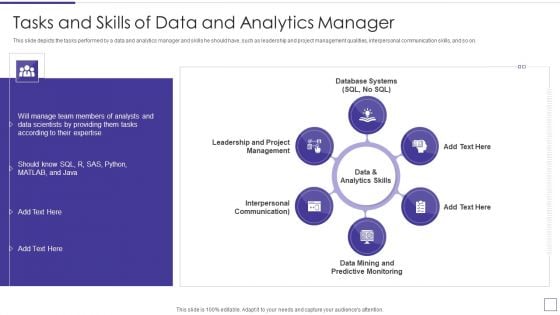
Data Mining Implementation Tasks And Skills Of Data And Analytics Manager Graphics PDF
This slide depicts the tasks performed by a data and analytics manager and skills he should have, such as leadership and project management qualities, interpersonal communication skills, and so on. This is a data mining implementation tasks and skills of data and analytics manager graphics pdf template with various stages. Focus and dispense information on six stages using this creative set, that comes with editable features. It contains large content boxes to add your information on topics like interpersonal communication, mining and predictive monitoring, data and analytics skills You can also showcase facts, figures, and other relevant content using this PPT layout. Grab it now.
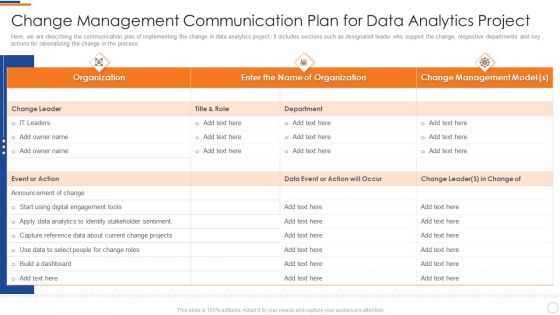
Business Intelligence And Big Data Analytics Change Management Communication Plan Diagrams PDF
Here, we are describing the communication plan of implementing the change in data analytics project. It includes sections such as designated leader who support the change, respective departments and key actions for rationalizing the change in the process. Deliver and pitch your topic in the best possible manner with this business intelligence and big data analytics change management communication plan diagrams pdf. Use them to share invaluable insights on change management model, organization, apply data analytics and impress your audience. This template can be altered and modified as per your expectations. So, grab it now.

Business Intelligence And Big Key Features Of Predictive Data Analytics Software Microsoft PDF
This slide represents the characteristics of predictive data analytics software. It includes features like predictive modeling, predictive scoring and data mining functions that help companies to get better insights. This is a business intelligence and big key features of predictive data analytics software microsoft pdf template with various stages. Focus and dispense information on five stages using this creative set, that comes with editable features. It contains large content boxes to add your information on topics like analysis network and links, data mining functions, predictive modeling, predictive scoring, automate analytics. You can also showcase facts, figures, and other relevant content using this PPT layout. Grab it now.
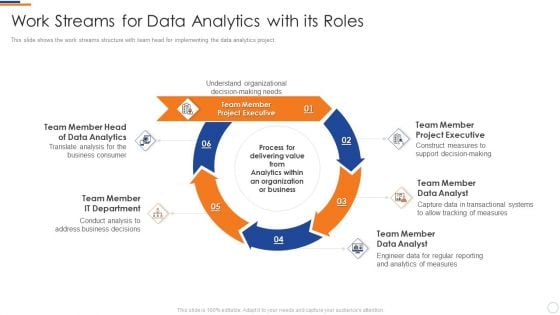
Business Intelligence And Big Work Streams For Data Analytics With Its Roles Microsoft PDF
This slide shows the work streams structure with team head for implementing the data analytics project. This is a business intelligence and big work streams for data analytics with its roles microsoft pdf template with various stages. Focus and dispense information on six stages using this creative set, that comes with editable features. It contains large content boxes to add your information on topics like team member head, data analytics, team member, it department, team member. You can also showcase facts, figures, and other relevant content using this PPT layout. Grab it now.
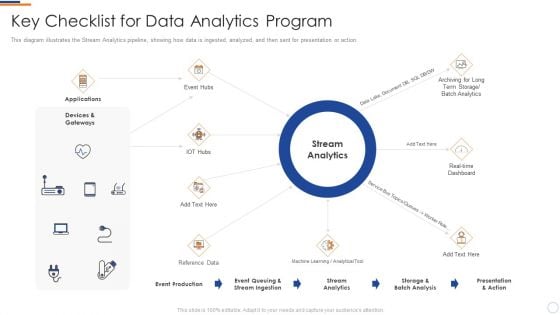
Key Checklist For Data Analytics Program Business Intelligence And Big Graphics PDF
This diagram illustrates the stream Analytics pipeline, showing how data is ingested, analyzed, and then sent for presentation or action. This is a key checklist for data analytics program business intelligence and big graphics pdf template with various stages. Focus and dispense information on eight stages using this creative set, that comes with editable features. It contains large content boxes to add your information on topics like applications, devices and gateways, stream analytics, presentation and action. You can also showcase facts, figures, and other relevant content using this PPT layout. Grab it now.
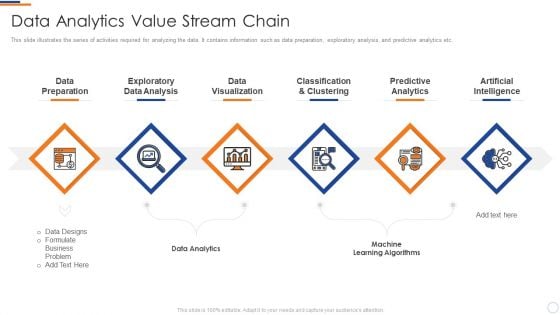
Business Intelligence And Big Transformation Toolkit Data Analytics Value Stream Chain Guidelines PDF
This slide illustrates the series of activities required for analyzing the data. It contains information such as data preparation, exploratory analysis, and predictive analytics etc. This is a business intelligence and big transformation toolkit data analytics value stream chain guidelines pdf template with various stages. Focus and dispense information on six stages using this creative set, that comes with editable features. It contains large content boxes to add your information on topics like data preparation, exploratory data analysis, data visualization, classification and clustering, predictive analytics. You can also showcase facts, figures, and other relevant content using this PPT layout. Grab it now.
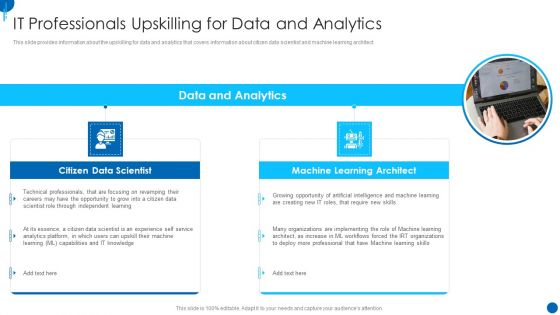
Information Technology Strategy IT Professionals Upskilling For Data And Analytics Diagrams PDF
This slide provides information about the upskilling for data and analytics that covers information about citizen data scientist and machine learning architect. This is a information technology strategy it professionals upskilling for data and analytics diagrams pdf template with various stages. Focus and dispense information on two stages using this creative set, that comes with editable features. It contains large content boxes to add your information on topics like data and analytics, citizen data scientist, machine learning architect. You can also showcase facts, figures, and other relevant content using this PPT layout. Grab it now.
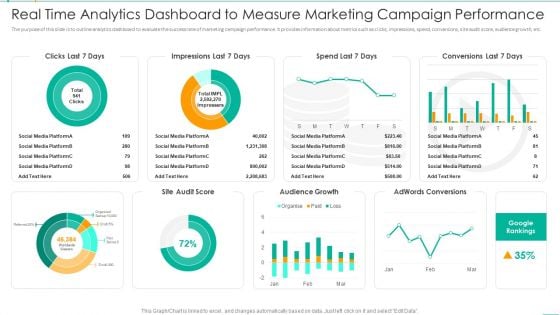
Real Time Analytics Dashboard To Measure Marketing Campaign Performance Information PDF
The purpose of this slide is to outline analytics dashboard to evaluate the success rate of marketing campaign performance. It provides information about metrics such as clicks, impressions, spend, conversions, site audit score, audience growth, etc. Pitch your topic with ease and precision using this Real Time Analytics Dashboard To Measure Marketing Campaign Performance Information PDF. This layout presents information on Real Time Analytics Dashboard To Measure Marketing Campaign Performance. It is also available for immediate download and adjustment. So, changes can be made in the color, design, graphics or any other component to create a unique layout.
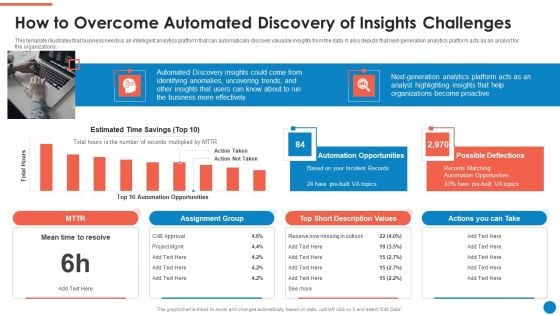
Data And Analytics Playbook How To Overcome Automated Discovery Of Insights Background PDF
This template illustrates that business needs is an intelligent analytics platform that can automatically discover valuable insights from the data. It also depicts that next-generation analytics platform acts as an analyst for the organizations. Deliver an awe inspiring pitch with this creative Data And Analytics Playbook How To Overcome Automated Discovery Of Insights Background PDF bundle. Topics like Estimated Time Savings, Automation Opportunities, Possible Deflections, Assignment Group can be discussed with this completely editable template. It is available for immediate download depending on the needs and requirements of the user.
Playbook For Content Advertising Google Analytics For All Web Tracking Demonstration PDF
This template covers tools to measure marketing analytics such as google analytics for all web tracking, google data studio to build real time reporting dashboards and google data studio reports. Deliver and pitch your topic in the best possible manner with this Playbook For Content Advertising Google Analytics For All Web Tracking Demonstration PDF. Use them to share invaluable insights on Demographics, Devices, Social Networks and impress your audience. This template can be altered and modified as per your expectations. So, grab it now.
Social Media Brand Promotion Instructions Playbook Google Analytics For All Web Tracking Graphics PDF
This template covers tools to measure marketing analytics such as google analytics for all web tracking, google data studio to build real-time reporting dashboards and google data studio reports.Deliver and pitch your topic in the best possible manner with this Social Media Brand Promotion Instructions Playbook Google Analytics For All Web Tracking Graphics PDF Use them to share invaluable insights on Demographics, Social Networks, Returning and impress your audience. This template can be altered and modified as per your expectations. So, grab it now.
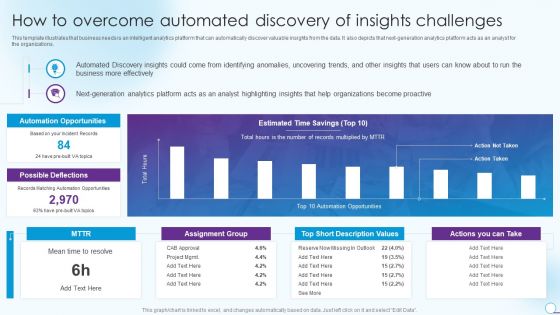
Information Analytics And Ml Strategy Playbook How To Overcome Automated Discovery Of Insights Challenges Information PDF
This template illustrates that business needs is an intelligent analytics platform that can automatically discover valuable insights from the data. It also depicts that next-generation analytics platform acts as an analyst for the organizations. Deliver an awe inspiring pitch with this creative Information Analytics And Ml Strategy Playbook How To Overcome Automated Discovery Of Insights Challenges Information PDF bundle. Topics like Organizations, Automation Opportunities, Description Values can be discussed with this completely editable template. It is available for immediate download depending on the needs and requirements of the user.
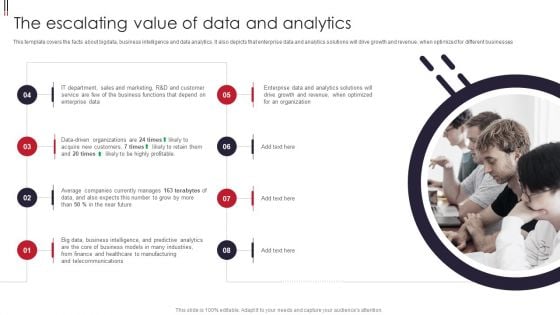
Information Visualizations Playbook The Escalating Value Of Data And Analytics Portrait PDF
This template covers the facts about bigdata, business intelligence and data analytics. It also depicts that enterprise data and analytics solutions will drive growth and revenue, when optimized for different businesses. This is a Information Visualizations Playbook The Escalating Value Of Data And Analytics Portrait PDF template with various stages. Focus and dispense information on eight stages using this creative set, that comes with editable features. It contains large content boxes to add your information on topics like Data Driven Organizations, Acquire New Customers, Profitable. You can also showcase facts, figures, and other relevant content using this PPT layout. Grab it now.

SAC Planning And Implementation Sap Analytics Cloud Training Plan For Organization Information PDF
The purpose of this slide is to showcase the training plan for SAP Analytics Cloud coaching. It contains information regarding the basic perquisite, trainer name and number of attendees. It also contains details of training modules along with hours allocated, expected completion date. Deliver an awe inspiring pitch with this creative SAC Planning And Implementation Sap Analytics Cloud Training Plan For Organization Information PDF bundle. Topics like Training Modules Breakup, Augmented Analytics, Planning can be discussed with this completely editable template. It is available for immediate download depending on the needs and requirements of the user.
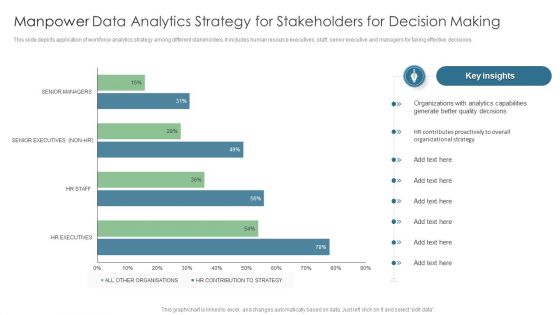
Manpower Data Analytics Strategy For Stakeholders For Decision Making Summary PDF
This slide depicts application of workforce analytics strategy among different stakeholders. It includes human resource executives, staff, senior executive and managers for taking effective decisions. Pitch your topic with ease and precision using this Manpower Data Analytics Strategy For Stakeholders For Decision Making Summary PDF. This layout presents information on Organizations, Analytics Capabilities, Generate Better Quality. It is also available for immediate download and adjustment. So, changes can be made in the color, design, graphics or any other component to create a unique layout.
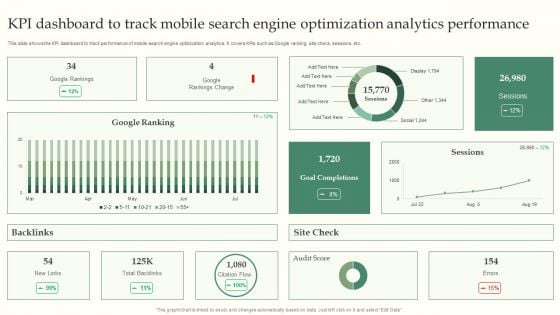
KPI Dashboard To Track Mobile Search Engine Optimization Analytics Performance Introduction PDF
This slide shows the KPI dashboard to track performance of mobile search engine optimization analytics. It covers KPIs such as Google ranking, site check, sessions, etc. Showcasing this set of slides titled KPI Dashboard To Track Mobile Search Engine Optimization Analytics Performance Introduction PDF. The topics addressed in these templates are KPI Dashboard, Search Engine Optimization, Analytics Performance. All the content presented in this PPT design is completely editable. Download it and make adjustments in color, background, font etc. as per your unique business setting.
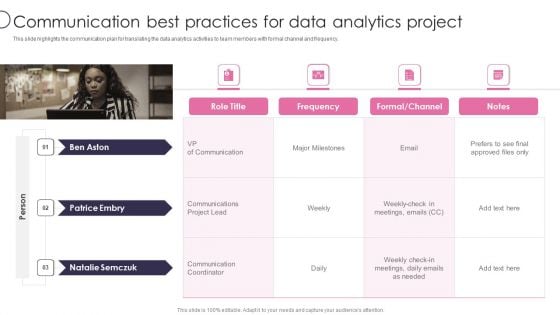
Information Transformation Process Toolkit Communication Best Practices For Data Analytics Project Professional PDF
This slide highlights the communication plan for translating the data analytics activities to team members with formal channel and frequency. Presenting Information Transformation Process Toolkit Communication Best Practices For Data Analytics Project Professional PDF to provide visual cues and insights. Share and navigate important information on four stages that need your due attention. This template can be used to pitch topics like Communication Best Practices, Data Analytics Project. In addtion, this PPT design contains high resolution images, graphics, etc, that are easily editable and available for immediate download.
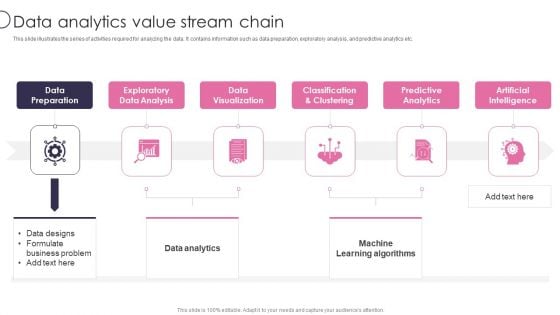
Information Transformation Process Toolkit Data Analytics Value Stream Chain Microsoft PDF
This slide illustrates the series of activities required for analyzing the data. It contains information such as data preparation, exploratory analysis, and predictive analytics etc. Presenting Information Transformation Process Toolkit Data Analytics Value Stream Chain Microsoft PDF to provide visual cues and insights. Share and navigate important information on six stages that need your due attention. This template can be used to pitch topics like Exploratory Data Analysis, Data Visualization, Predictive Analytics. In addtion, this PPT design contains high resolution images, graphics, etc, that are easily editable and available for immediate download.
Information Transformation Process Toolkit Essential Business Requirements For Data Analytics In Venn Diagram Icons PDF
In this slide, we are showing the basic key components including people, process and technology that are required for data analytics strategy management process. This is a Information Transformation Process Toolkit Essential Business Requirements For Data Analytics In Venn Diagram Icons PDF template with various stages. Focus and dispense information on three stages using this creative set, that comes with editable features. It contains large content boxes to add your information on topics like Analytics, Processes, Technologies. You can also showcase facts, figures, and other relevant content using this PPT layout. Grab it now.


 Continue with Email

 Home
Home


