Annual Sales Performance Review
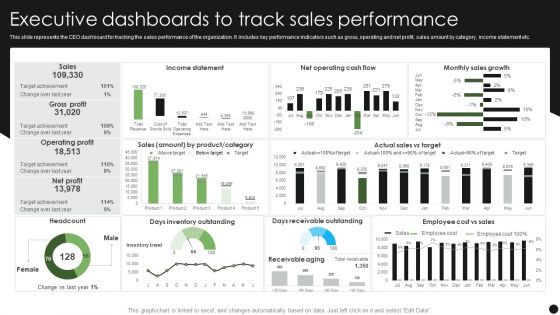
Executive Dashboards To Track Sales Performance Guidelines PDF
This slide represents the CEO dashboard for tracking the sales performance of the organization. It includes key performance indicators such as gross, operating and net profit, sales amount by category, income statement etc. Pitch your topic with ease and precision using this Executive Dashboards To Track Sales Performance Guidelines PDF. This layout presents information on Income Statement, Monthly Sales Growth, Days Receivable Outstanding. It is also available for immediate download and adjustment. So, changes can be made in the color, design, graphics or any other component to create a unique layout.
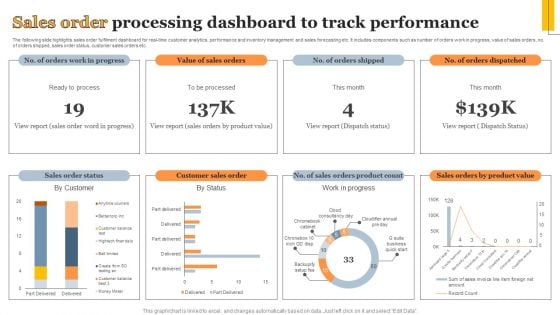
Sales Order Processing Dashboard To Track Performance Information PDF
The following slide highlights sales order fulfilment dashboard for real-time customer analytics, performance and inventory management and sales forecasting etc. It includes components such as number of orders work in progress, value of sales orders, no. of orders shipped, sales order status, customer sales orders etc. Showcasing this set of slides titled Sales Order Processing Dashboard To Track Performance Information PDF. The topics addressed in these templates are Sales Order Status, Customer Sales Order, Work Progress. All the content presented in this PPT design is completely editable. Download it and make adjustments in color, background, font etc. as per your unique business setting.
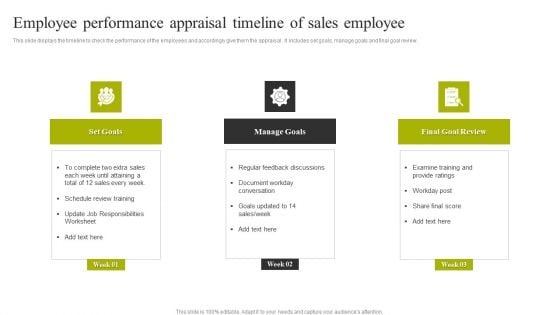
Employee Performance Appraisal Timeline Of Sales Employee Introduction PDF
This slide displays the timeline to check the performance of the employees and accordingly give them the appraisal . It includes set goals, manage goals and final goal review. Persuade your audience using this Employee Performance Appraisal Timeline Of Sales Employee Introduction PDF. This PPT design covers Three stages, thus making it a great tool to use. It also caters to a variety of topics including Set Goals, Manage Goals, Final Goal Review. Download this PPT design now to present a convincing pitch that not only emphasizes the topic but also showcases your presentation skills.
Sales Department Management To Enhance Performance Management Icon Template PDF
Showcasing this set of slides titled Sales Department Management To Enhance Performance Management Icon Template PDF. The topics addressed in these templates are Sales Department, Management Enhance, Performance Management. All the content presented in this PPT design is completely editable. Download it and make adjustments in color, background, font etc. as per your unique business setting.
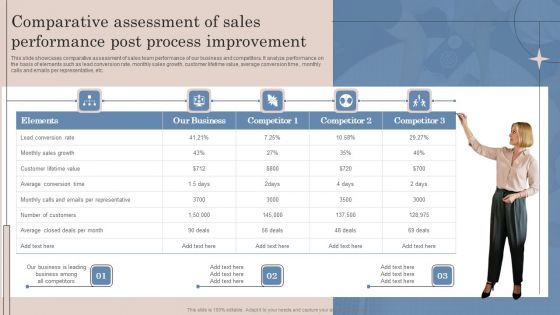
Comparative Assessment Of Sales Performance Post Process Improvement Clipart PDF
This slide showcases comparative assessment of sales team performance of our business and competitors. It analyze performance on the basis of elements such as lead conversion rate, monthly sales growth, customer lifetime value, average conversion time , monthly calls and emails per representative, etc. Find a pre designed and impeccable Comparative Assessment Of Sales Performance Post Process Improvement Clipart PDF. The templates can ace your presentation without additional effort. You can download these easy to edit presentation templates to make your presentation stand out from others. So, what are you waiting for Download the template from Slidegeeks today and give a unique touch to your presentation.
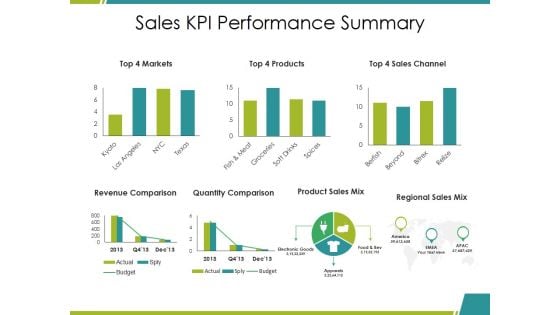
Sales Kpi Performance Summary Ppt PowerPoint Presentation Infographic Template Elements
This is a sales kpi performance summary ppt powerpoint presentation infographic template elements. This is a seven stage process. The stages in this process are revenue comparison, quantity comparison, product sales mix, regional sales mix, budget.

Sales Kpi Performance Summary Ppt PowerPoint Presentation Ideas Graphics Template
This is a sales kpi performance summary ppt powerpoint presentation ideas graphics template. This is a seven stage process. The stages in this process are revenue comparison, quantity comparison, product sales mix, regional sales mix.
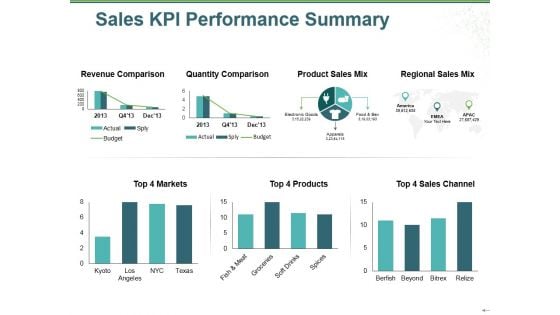
Sales Kpi Performance Summary Ppt PowerPoint Presentation Show Inspiration
This is a sales kpi performance summary ppt powerpoint presentation show inspiration. This is a two stage process. The stages in this process are revenue comparison, quantity comparison, product sales mix, regional sales mix, budget.

Sales Kpi Performance Summary Ppt PowerPoint Presentation Show Themes
This is a sales kpi performance summary ppt powerpoint presentation show themes. This is a three stage process. The stages in this process are revenue comparison, quantity comparison, product sales mix, markets, sales channel.
Sales Target Vs Accomplishment Performance Assessment Icon Slides PDF
Presenting Sales Target Vs Accomplishment Performance Assessment Icon Slides PDF to dispense important information. This template comprises three stages. It also presents valuable insights into the topics including Sales Target Vs Accomplishment, Performance, Assessment Icon. This is a completely customizable PowerPoint theme that can be put to use immediately. So, download it and address the topic impactfully.
Sales Roadmap Model For Performance Analysis Icon Structure PDF
Presenting Sales Roadmap Model For Performance Analysis Icon Structure PDF to dispense important information. This template comprises three stages. It also presents valuable insights into the topics including Sales Roadmap Model, Performance Analysis Icon. This is a completely customizable PowerPoint theme that can be put to use immediately. So, download it and address the topic impactfully.
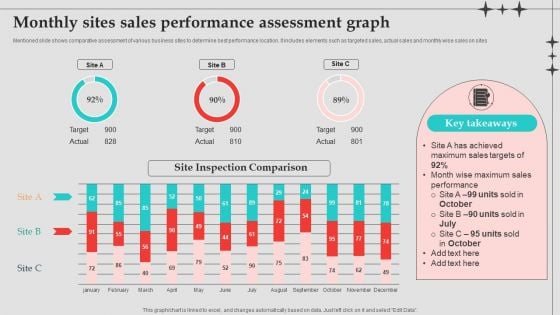
Monthly Sites Sales Performance Assessment Graph Designs PDF
Mentioned slide shows comparative assessment of various business sites to determine best performance location. It includes elements such as targeted sales, actual sales and monthly wise sales on sites. Pitch your topic with ease and precision using this Monthly Sites Sales Performance Assessment Graph Designs PDF. This layout presents information on Sales Performance, Sales Targets, Performance Assessment Graph . It is also available for immediate download and adjustment. So, changes can be made in the color, design, graphics or any other component to create a unique layout.
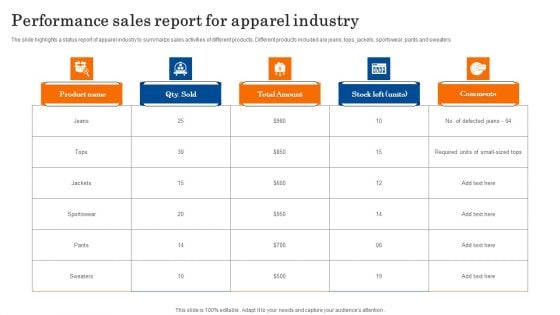
Performance Sales Report For Apparel Industry Portrait PDF
The slide highlights a status report of apparel industry to summarize sales activities of different products. Different products included are jeans, tops, jackets, sportswear, pants and sweaters. Pitch your topic with ease and precision using this Performance Sales Report For Apparel Industry Portrait PDF. This layout presents information on Performance Sales Report, Apparel Industry. It is also available for immediate download and adjustment. So, changes can be made in the color, design, graphics or any other component to create a unique layout.
Determine Pipeline By Individual Sales Representative Performance Icons PDF
This slide provides information regarding monitoring of different sales representatives performance by determine sales duration at various pipeline stages. Deliver an awe inspiring pitch with this creative Determine Pipeline By Individual Sales Representative Performance Icons PDF bundle. Topics like Sales Representative, Sales Department, Shorter Sales Cycle can be discussed with this completely editable template. It is available for immediate download depending on the needs and requirements of the user.

Monthly Sales Report For New Performance Ideas PDF
The slide carries a monthly report to record and track sakes of new product after launch. Various elements included are units sold and total sales amount. Showcasing this set of slides titled Monthly Sales Report For New Performance Ideas PDF. The topics addressed in these templates are Monthly Sales Report, New Performance. All the content presented in this PPT design is completely editable. Download it and make adjustments in color, background, font etc. as per your unique business setting.
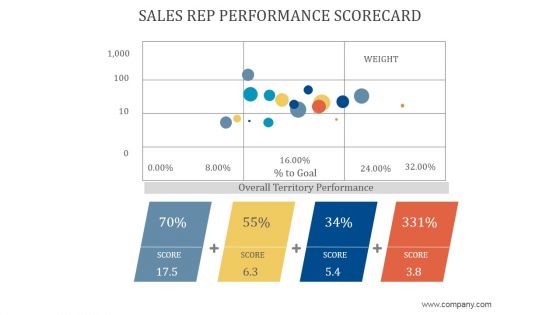
Sales Rep Performance Scorecard Ppt PowerPoint Presentation Example 2015
This is a sales rep performance scorecard ppt powerpoint presentation example 2015. This is a four stage process. The stages in this process are overall territory performance, weight, score.
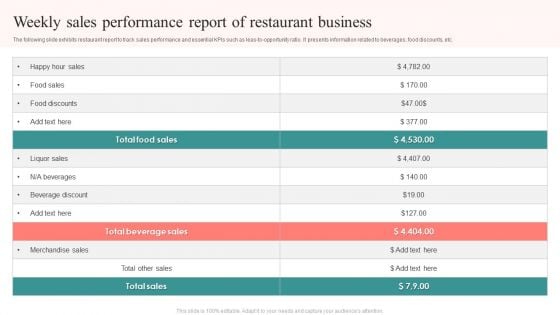
Weekly Sales Performance Report Of Restaurant Business Clipart PDF
The following slide exhibits restaurant report to track sales performance and essential KPIs such as leas-to-opportunity ratio. It presents information related to beverages, food discounts, etc. Pitch your topic with ease and precision using this Weekly Sales Performance Report Of Restaurant Business Clipart PDF. This layout presents information on Total Beverage Sales, Total Food Sales, Total Sales. It is also available for immediate download and adjustment. So, changes can be made in the color, design, graphics or any other component to create a unique layout.
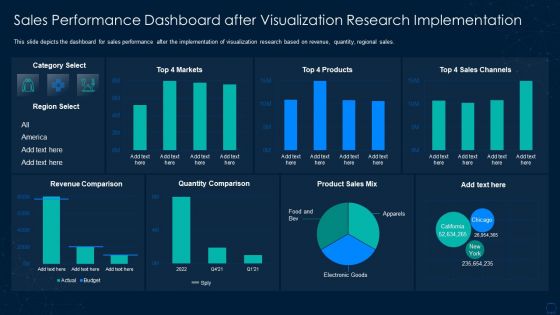
Graphical Representation Of Research IT Sales Performance Dashboard Sample PDF
This slide depicts the dashboard for sales performance after the implementation of visualization research based on revenue, quantity, regional sales. Deliver and pitch your topic in the best possible manner with this graphical representation of research it sales performance dashboard sample pdf. Use them to share invaluable insights on sales performance dashboard after visualization research implementation and impress your audience. This template can be altered and modified as per your expectations. So, grab it now.
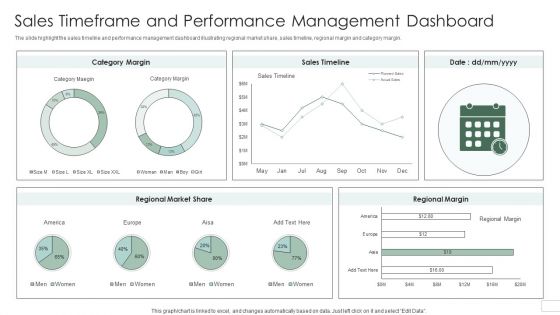
Sales Timeframe And Performance Management Dashboard Introduction PDF
The slide highlight the sales timeline and performance management dashboard illustrating regional market share, sales timeline, regional margin and category margin. Pitch your topic with ease and precision using this Sales Timeframe And Performance Management Dashboard Introduction PDF. This layout presents information on Regional Market Share, Category Margin, Sales Timeline. It is also available for immediate download and adjustment. So, changes can be made in the color, design, graphics or any other component to create a unique layout.
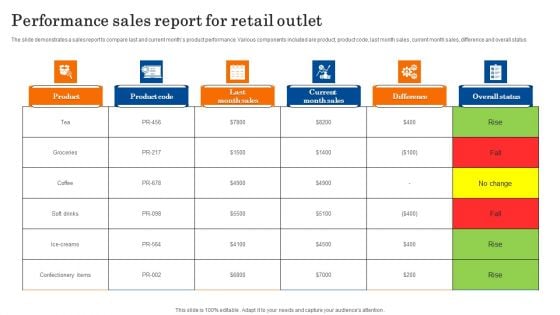
Performance Sales Report For Retail Outlet Slides PDF
The slide demonstrates a sales report to compare last and current months product performance. Various components included are product, product code, last month sales, current month sales, difference and overall status. Pitch your topic with ease and precision using this Performance Sales Report For Retail Outlet Slides PDF. This layout presents information on Product Code, Last Month Sales, Retail Outlet. It is also available for immediate download and adjustment. So, changes can be made in the color, design, graphics or any other component to create a unique layout.
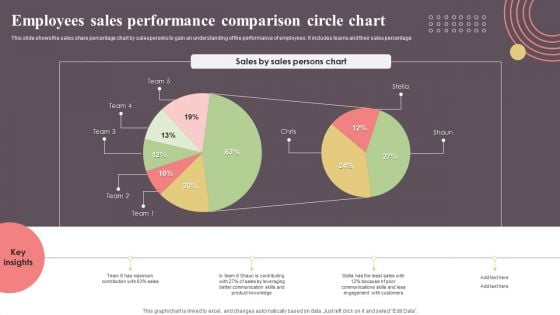
Employees Sales Performance Comparison Circle Chart Topics PDF
This slide shows the sales share percentage chart by salespersons to gain an understanding of the performance of employees. It includes teams and their sales percentage. Pitch your topic with ease and precision using this Employees Sales Performance Comparison Circle Chart Topics PDF. This layout presents information on Employees Sales Performance, Comparison Circle Chart. It is also available for immediate download and adjustment. So, changes can be made in the color, design, graphics or any other component to create a unique layout.
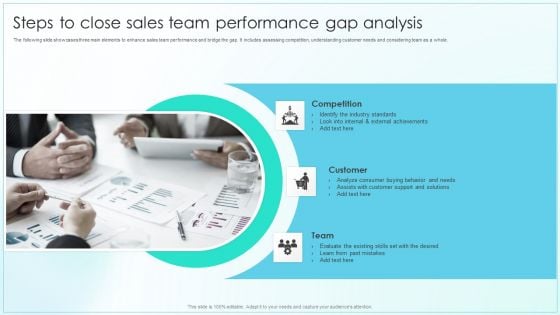
Steps To Close Sales Team Performance Gap Analysis Slides PDF
The following slide showcases three main elements to enhance sales team performance and bridge the gap. It includes assessing competition, understanding customer needs and considering team as a whole.Presenting Steps To Close Sales Team Performance Gap Analysis Slides PDF to dispense important information. This template comprises three. It also presents valuable insights into the topics including Competition, External Achievements, Analyze Consumer. This is a completely customizable PowerPoint theme that can be put to use immediately. So, download it and address the topic impactfully.
B2B Sales Representatives Performance Tracking Dashboard Background PDF
This slide provides information regarding B2B sales representatives performance tracking dashboard to measure leads by region, revenue breakdown, top performers by leads, revenues, etc. Deliver and pitch your topic in the best possible manner with this B2B Sales Representatives Performance Tracking Dashboard Background PDF. Use them to share invaluable insights on Individual Performance, Achieved Highest, Revenue Relative and impress your audience. This template can be altered and modified as per your expectations. So, grab it now.
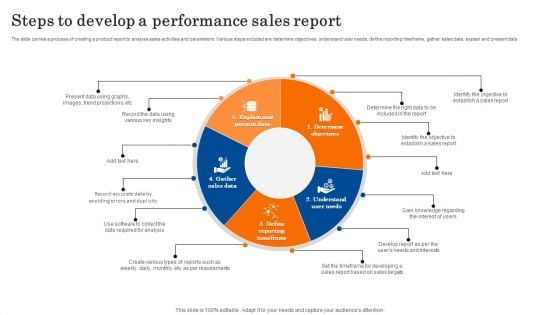
Steps To Develop A Performance Sales Report Mockup PDF
The slide carries a process of creating a product report to analyse sales activities and parameters. Various steps included are determine objectives, understand user needs, define reporting timeframe, gather sales data, explain and present data. Persuade your audience using this Steps To Develop A Performance Sales Report Mockup PDF. This PPT design covers five stages, thus making it a great tool to use. It also caters to a variety of topics including Determine Objectives, Understand User Needs, Define Reporting Timeframe. Download this PPT design now to present a convincing pitch that not only emphasizes the topic but also showcases your presentation skills.
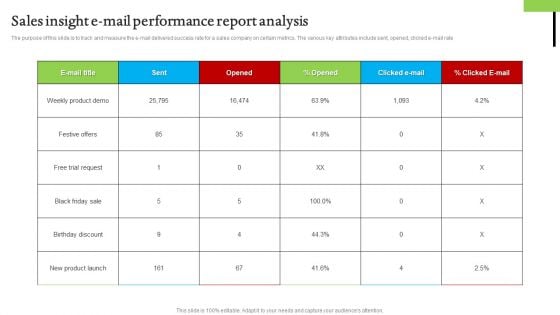
Sales Insight E Mail Performance Report Analysis Brochure PDF
The purpose of this slide is to track and measure the e-mail delivered success rate for a sales company on certain metrics. The various key attributes include sent, opened, clicked e-mail rate Showcasing this set of slides titled Sales Insight E Mail Performance Report Analysis Brochure PDF. The topics addressed in these templates are Sales Insight E Mail, Performance Report Analysis. All the content presented in this PPT design is completely editable. Download it and make adjustments in color, background, font etc. as per your unique business setting.
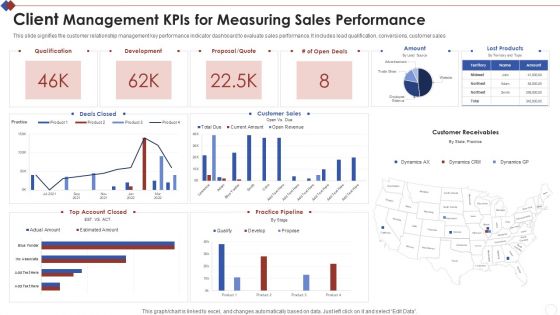
Client Management Kpis For Measuring Sales Performance Elements PDF
Showcasing this set of slides titled Client Management Kpis For Measuring Sales Performance Elements PDF. The topics addressed in these templates are Client Management Kpis For Measuring Sales Performance. All the content presented in this PPT design is completely editable. Download it and make adjustments in color, background, font etc. as per your unique business setting.
B2B Sales Representatives Performance Tracking Dashboard Elements PDF
This slide provides information regarding B2B sales representatives performance tracking dashboard to measure leads by region, revenue breakdown, top performers by leads, revenues, etc. Deliver an awe inspiring pitch with this creative B2B Sales Representatives Performance Tracking Dashboard Elements PDF bundle. Topics like Revenue Actual, Sales Representatives Performance, Tracking Dashboard can be discussed with this completely editable template. It is available for immediate download depending on the needs and requirements of the user.
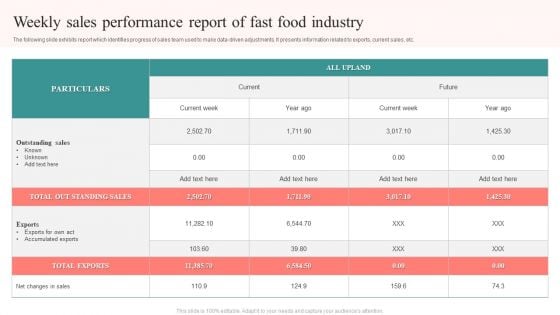
Weekly Sales Performance Report Of Fast Food Industry Slides PDF
The following slide exhibits report which identifies progress of sales team used to make data-driven adjustments. It presents information related to exports, current sales, etc. Showcasing this set of slides titled Weekly Sales Performance Report Of Fast Food Industry Slides PDF. The topics addressed in these templates are Outstanding Sales, Total Exports, Accumulated Exports. All the content presented in this PPT design is completely editable. Download it and make adjustments in color, background, font etc. as per your unique business setting.
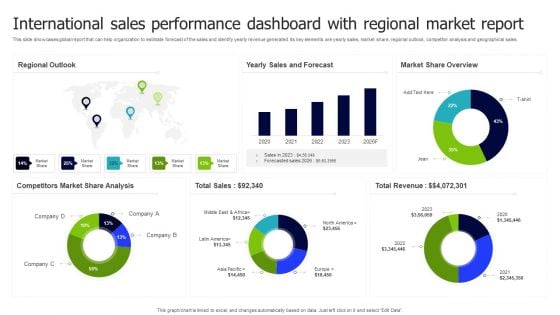
International Sales Performance Dashboard With Regional Market Report Inspiration PDF
This slide showcases global report that can help organization to estimate forecast of the sales and identify yearly revenue generated. Its key elements are yearly sales, market share, regional outlook, competitor analysis and geographical sales. Pitch your topic with ease and precision using this International Sales Performance Dashboard With Regional Market Report Inspiration PDF. This layout presents information on Regional Outlook, Sales And Forecast, Market Share Overview. It is also available for immediate download and adjustment. So, changes can be made in the color, design, graphics or any other component to create a unique layout.
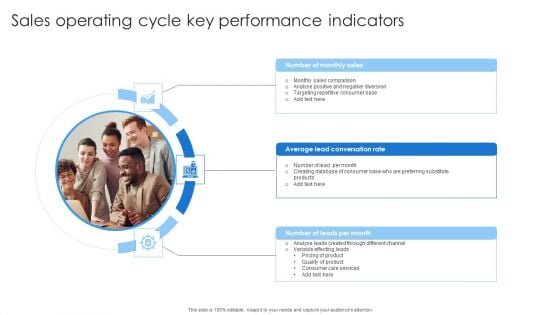
Sales Operating Cycle Key Performance Indicators Professional PDF
Presenting Sales Operating Cycle Key Performance Indicators Professional PDF to dispense important information. This template comprises three stages. It also presents valuable insights into the topics including Sales Comparison, Lead Conversation, Quality Product. This is a completely customizable PowerPoint theme that can be put to use immediately. So, download it and address the topic impactfully.
Sales Team Member Performance Summary Icon Mockup PDF
Persuade your audience using this Sales Team Member Performance Summary Icon Mockup PDF. This PPT design covers Three stages, thus making it a great tool to use. It also caters to a variety of topics including Sales Team Member, Performance Summary. Download this PPT design now to present a convincing pitch that not only emphasizes the topic but also showcases your presentation skills.
Small Business Sales Employee Representative Performance Scorecard Icon Demonstration PDF
Presenting Small Business Sales Employee Representative Performance Scorecard Icon Demonstration PDF to dispense important information. This template comprises three stages. It also presents valuable insights into the topics including Small Business Sales, Employee Representative, Performance Scorecard Icon. This is a completely customizable PowerPoint theme that can be put to use immediately. So, download it and address the topic impactfully.
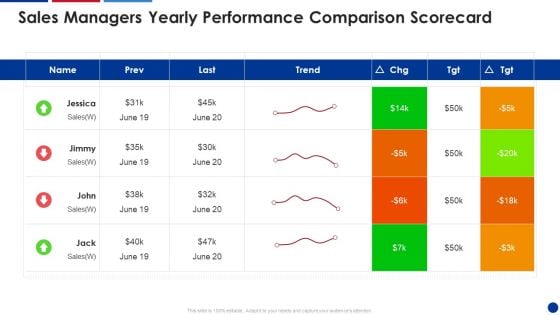
Sales Managers Yearly Performance Comparison Scorecard Designs PDF
Deliver and pitch your topic in the best possible manner with this Sales Managers Yearly Performance Comparison Scorecard Designs PDF. Use them to share invaluable insights on Sales Managers, Yearly Performance, Comparison Scorecard and impress your audience. This template can be altered and modified as per your expectations. So, grab it now.
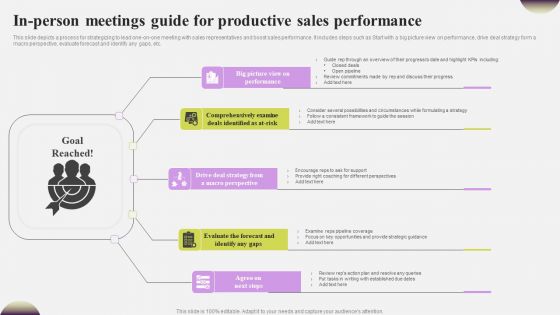
In Person Meetings Guide For Productive Sales Performance Demonstration PDF
This slide depicts a process for strategizing to lead one on one meeting with sales representatives and boost sales performance. It includes steps such as Start with a big picture view on performance, drive deal strategy form a macro perspective, evaluate forecast and identify any gaps, etc. Presenting In Person Meetings Guide For Productive Sales Performance Demonstration PDF to dispense important information. This template comprises five stages. It also presents valuable insights into the topics including Big Picture Performance, Comprehensively Examine, Drive Deal Strategy. This is a completely customizable PowerPoint theme that can be put to use immediately. So, download it and address the topic impactfully.
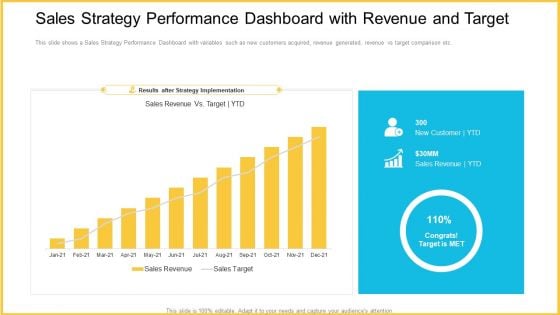
Sales Strategy Performance Dashboard With Revenue And Target Designs PDF
This slide shows a Sales Strategy Performance Dashboard with variables such as new customers acquired, revenue generated, revenue vs target comparison etc. Deliver and pitch your topic in the best possible manner with this sales strategy performance dashboard with revenue and target designs pdf. Use them to share invaluable insights on sales strategy performance dashboard with revenue and target and impress your audience. This template can be altered and modified as per your expectations. So, grab it now.
Sales Performance Measurement Tools Ppt PowerPoint Presentation Pictures Objects Cpb
Presenting this set of slides with name sales performance measurement tools ppt powerpoint presentation pictures objects cpb. This is an editable Powerpoint three stages graphic that deals with topics like sales performance measurement tools to help convey your message better graphically. This product is a premium product available for immediate download and is 100 percent editable in Powerpoint. Download this now and use it in your presentations to impress your audience.

Performance Assessment Sales Initiative Report Quotes Ppt Inspiration Format PDF
Presenting this set of slides with name performance assessment sales initiative report quotes ppt inspiration format pdf. The topics discussed in these slide is quotes. This is a completely editable PowerPoint presentation and is available for immediate download. Download now and impress your audience.
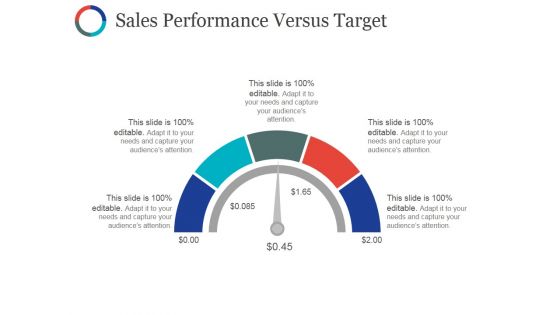
Sales Performance Versus Target Ppt PowerPoint Presentation File Vector
This is a sales performance versus target ppt powerpoint presentation file vector. This is a five stage process. The stages in this process are business, marketing, speed, meter, sales.
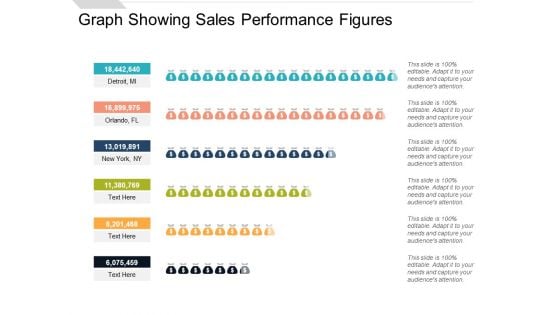
Graph Showing Sales Performance Figures Ppt PowerPoint Presentation Infographics Topics
Presenting this set of slides with name graph showing sales performance figures ppt powerpoint presentation infographics topics. This is a six stage process. The stages in this process are people graph, sales performance, population data demographics. This is a completely editable PowerPoint presentation and is available for immediate download. Download now and impress your audience.
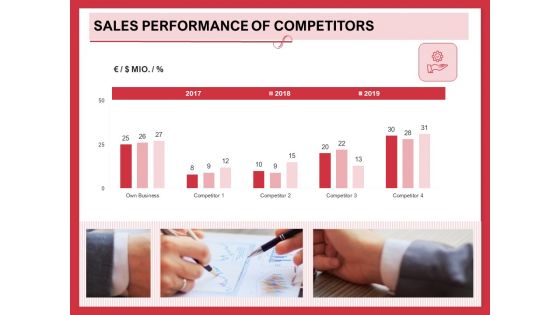
Implementing Compelling Marketing Channel Sales Performance Of Competitors Ideas PDF
Presenting this set of slides with name implementing compelling marketing channel sales performance of competitors ideas pdf. This is a one stage process. The stages in this process are own business, 2017 to 2019, sales performance, competitors. This is a completely editable PowerPoint presentation and is available for immediate download. Download now and impress your audience.
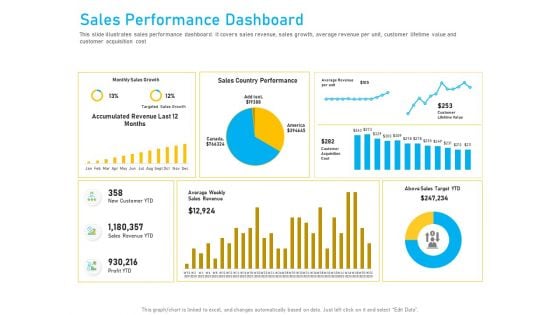
Competitor Analysis Sales Performance Dashboard Ppt Infographics Samples PDF
Deliver and pitch your topic in the best possible manner with this competitor analysis sales performance dashboard ppt infographics samples pdf. Use them to share invaluable insights on sales, revenue, performance, growth and impress your audience. This template can be altered and modified as per your expectations. So, grab it now.

Evaluating Projected Vs Actual Sales Performance Diagrams PDF
The following slide depicts the evaluation of existing sales performance to set future standards and determine opportunities for improvement. It mainly includes key performance indicators KPIs such as pipeline, forecast, attainment, gap etc. There are so many reasons you need a Evaluating Projected Vs Actual Sales Performance Diagrams PDF. The first reason is you can not spend time making everything from scratch, Thus, Slidegeeks has made presentation templates for you too. You can easily download these templates from our website easily.
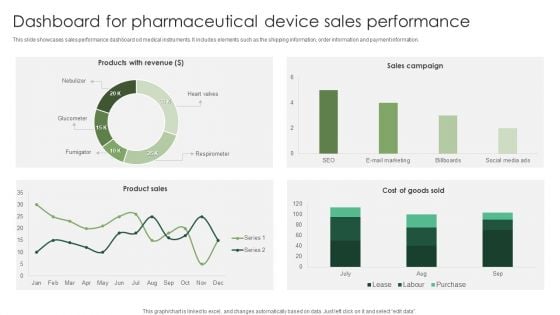
Dashboard For Pharmaceutical Device Sales Performance Graphics PDF
This slide showcases sales performance dashboard od medical instruments. It includes elements such as the shipping information, order information and payment information. Showcasing this set of slides titled Dashboard For Pharmaceutical Device Sales Performance Graphics PDF. The topics addressed in these templates are Pharmaceutical Device, Sales Performance. All the content presented in this PPT design is completely editable. Download it and make adjustments in color, background, font etc. as per your unique business setting.
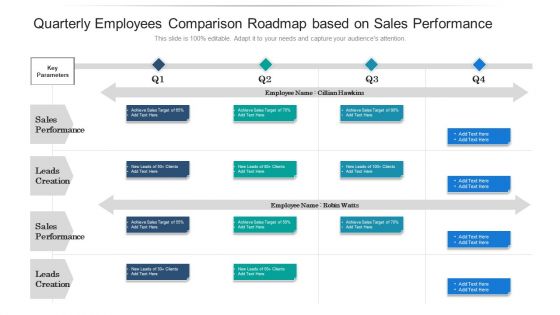
Quarterly Employees Comparison Roadmap Based On Sales Performance Slides
We present our quarterly employees comparison roadmap based on sales performance slides. This PowerPoint layout is easy to edit so you can change the font size, font type, color, and shape conveniently. In addition to this, the PowerPoint layout is Google Slides compatible, so you can share it with your audience and give them access to edit it. Therefore, download and save this well researched quarterly employees comparison roadmap based on sales performance slides in different formats like PDF, PNG, and JPG to smoothly execute your business plan.

Sales Product Performance Dashboard Ppt PowerPoint Presentation Model Graphics Design
This is a sales product performance dashboard ppt powerpoint presentation model graphics design. This is a four stage process. The stages in this process are top products in revenue, incremental sales, cost of goods.
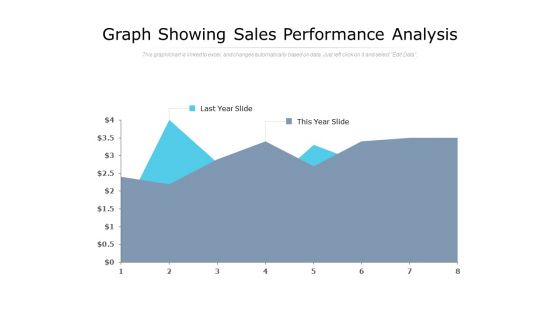
Graph Showing Sales Performance Analysis Ppt PowerPoint Presentation Professional Information
Presenting this set of slides with name graph showing sales performance analysis ppt powerpoint presentation professional information. The topics discussed in these slide is graph showing sales performance analysis. This is a completely editable PowerPoint presentation and is available for immediate download. Download now and impress your audience.
Monthly Sales Performance Tracking And Monitoring Dashboard Diagrams PDF
This slide showcases a dashboard presenting various metrics to measure and analyze sales performance for revenue growth. It includes key components such as number of sales, revenue, profit, cost, sales revenue, sales increment, cost analysis and cross sell. Make sure to capture your audiences attention in your business displays with our gratis customizable Monthly Sales Performance Tracking And Monitoring Dashboard Diagrams PDF. These are great for business strategies, office conferences, capital raising or task suggestions. If you desire to acquire more customers for your tech business and ensure they stay satisfied, create your own sales presentation with these plain slides.
Monthly Sales Performance Tracking And Monitoring Dashboard Designs PDF
This slide showcases a dashboard presenting various metrics to measure and analyze sales performance for revenue growth. It includes key components such as number of sales, revenue, profit, cost, sales revenue, sales increment, cost analysis and cross sell. Make sure to capture your audiences attention in your business displays with our gratis customizable Monthly Sales Performance Tracking And Monitoring Dashboard Designs PDF. These are great for business strategies, office conferences, capital raising or task suggestions. If you desire to acquire more customers for your tech business and ensure they stay satisfied, create your own sales presentation with these plain slides.
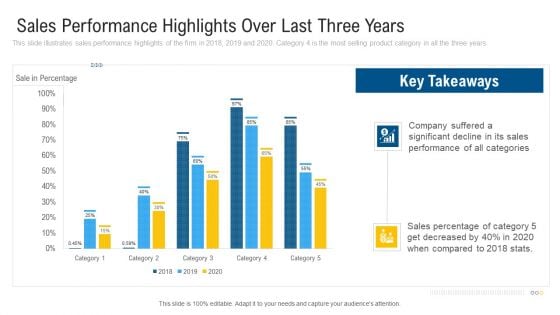
Sales Performance Highlights Over Last Three Years Ideas PDF
This slide illustrates sales performance highlights of the firm in 2018, 2019 and 2020. Category 4 is the most selling product category in all the three years. Deliver an awe inspiring pitch with this creative sales performance highlights over last three years ideas pdf bundle. Topics like sales performance highlights over last three years can be discussed with this completely editable template. It is available for immediate download depending on the needs and requirements of the user.
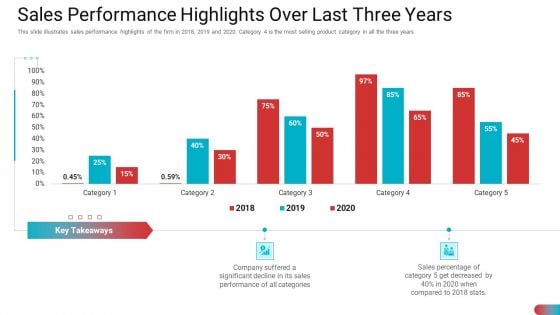
Sales Performance Highlights Over Last Three Years Slides PDF
This slide illustrates sales performance highlights of the firm in 2018, 2019 and 2020. Category 4 is the most selling product category in all the three years. Deliver and pitch your topic in the best possible manner with this sales performance highlights over last three years slides pdf. Use them to share invaluable insights on sales performance highlights over last three years and impress your audience. This template can be altered and modified as per your expectations. So, grab it now.

Manufactured Products Sales Performance Monitoring Dashboard Information PDF
This slide shows the dashboard the data related to the sales performance of the products manufactured by the organization in order to effectively measure and monitor the performance of the sales team. It shows details related to revenue generated and units sold etc.Pitch your topic with ease and precision using this Manufactured Products Sales Performance Monitoring Dashboard Information PDF. This layout presents information on Monthly Revenue, Manufactured Products, Sales Performance Monitoring. It is also available for immediate download and adjustment. So, changes can be made in the color, design, graphics or any other component to create a unique layout.
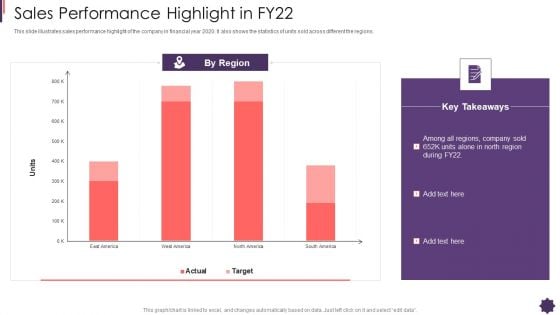
Sales Performance Highlight In Fy22 Brand Techniques Structure Designs PDF
This slide illustrates sales performance highlight of the company in financial year 2020. It also shows the statistics of units sold across different the regions. Deliver and pitch your topic in the best possible manner with this sales performance highlight in fy22 brand techniques structure designs pdf. Use them to share invaluable insights on sales performance highlight in fy22 and impress your audience. This template can be altered and modified as per your expectations. So, grab it now.
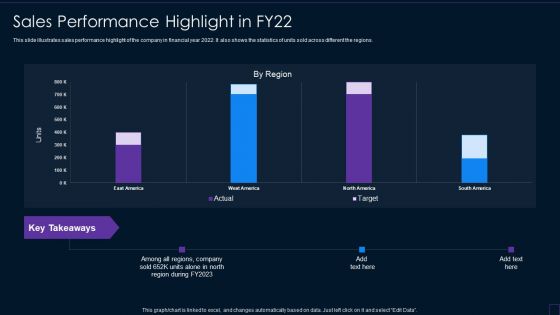
Brand Development Manual Sales Performance Highlight In FY22 Microsoft PDF
This slide illustrates sales performance highlight of the company in financial year 2022. It also shows the statistics of units sold across different the regions.Deliver an awe inspiring pitch with this creative Brand Development Manual Sales Performance Highlight In FY22 Microsoft PDF bundle. Topics like Sales Performance Highlight In FY22 can be discussed with this completely editable template. It is available for immediate download depending on the needs and requirements of the user.
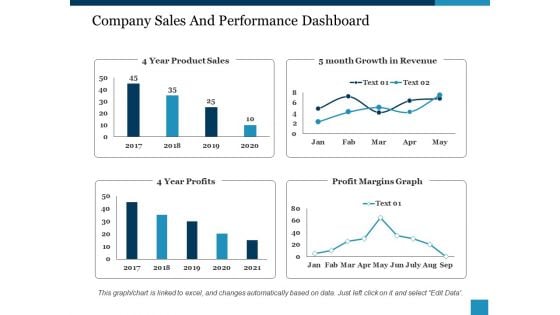
Company Sales And Performance Dashboard Ppt PowerPoint Presentation Show Structure
This is a company sales and performance dashboard ppt powerpoint presentation show structure. This is a four stage process. The stages in this process are year product sales, month growth in revenue, profit margins graph, year profits.
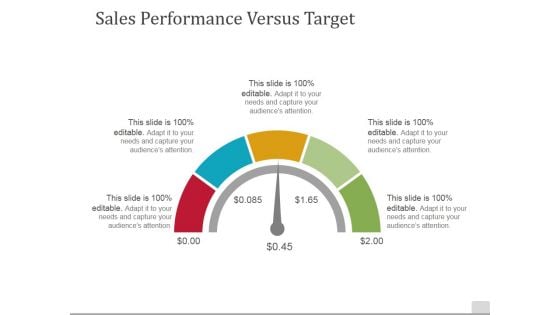
Sales Performance Versus Target Ppt PowerPoint Presentation Pictures Structure
This is a sales performance versus target ppt powerpoint presentation pictures structure. This is a five stage process. The stages in this process are business, dashboard, technology, process, marketing.
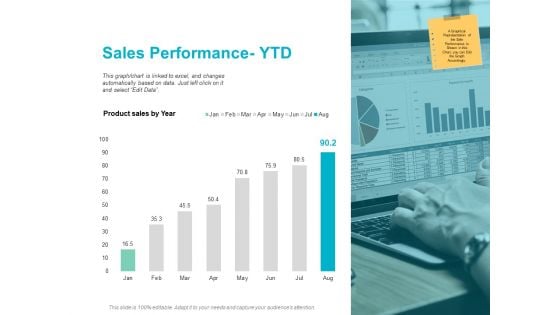
Sales Performance Ytd Planning Ppt PowerPoint Presentation Show Background Designs
This is a sales performance ytd planning ppt powerpoint presentation show background designs. The topics discussed in this diagram are marketing, business, management, planning, strategy This is a completely editable PowerPoint presentation, and is available for immediate download.
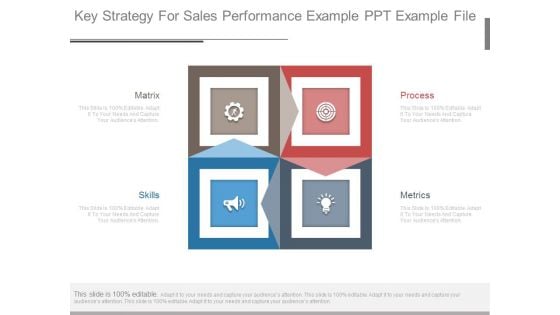
Key Strategy For Sales Performance Example Ppt Example File
This is a key strategy for sales performance example ppt example file. This is a four stage process. The stages in this process are matrix, skills, process, metrics.

Example Of Sales Performance Measurement Tools Diagram Slides
This is a example of sales performance measurement tools diagram slides. This is a six stage process. The stages in this process are active listening skills, interpersonal relation, organization, sales approaches and procedures, productivity, knowledge of business industry, preparation, contact initiation, needs analysis, product service presentation, handling objections, negotiation, closeting the sales.
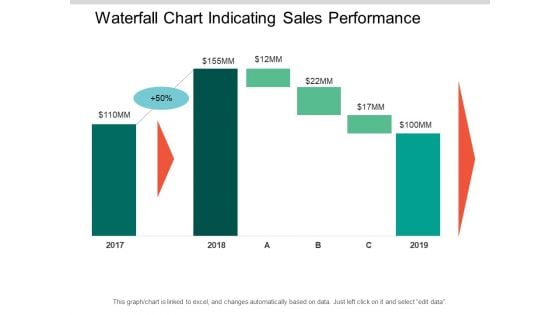
Waterfall Chart Indicating Sales Performance Ppt PowerPoint Presentation Outline Templates
This is a waterfall chart indicating sales performance ppt powerpoint presentation outline templates. This is a seven stage process. The stages in this process are sales waterfall, waterfall chart, business.
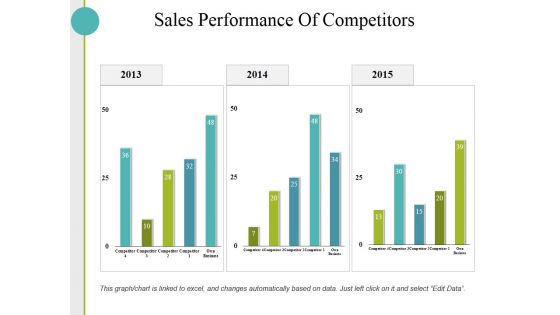
Sales Performance Of Competitors Ppt PowerPoint Presentation Show Graphics Download
This is a sales performance of competitors ppt powerpoint presentation show graphics download. This is a three stage process. The stages in this process are business, finance, marketing, strategy, sales.


 Continue with Email

 Home
Home


