Architecture Icons
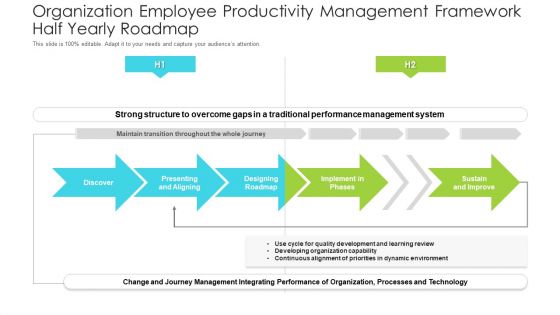
Organization Employee Productivity Management Framework Half Yearly Roadmap Elements
Introducing our organization employee productivity management framework half yearly roadmap elements. This PPT presentation is Google Slides compatible, therefore, you can share it easily with the collaborators for measuring the progress. Also, the presentation is available in both standard screen and widescreen aspect ratios. So edit the template design by modifying the font size, font type, color, and shapes as per your requirements. As this PPT design is fully editable it can be presented in PDF, JPG and PNG formats.
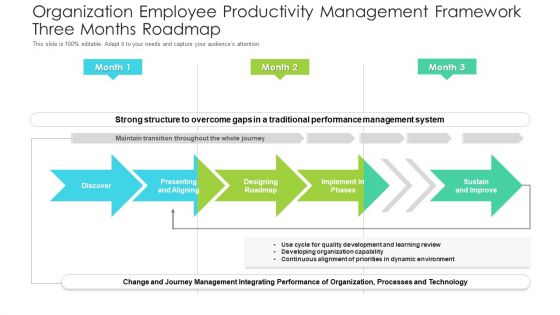
Organization Employee Productivity Management Framework Three Months Roadmap Information
Presenting our jaw dropping organization employee productivity management framework three months roadmap information. You can alternate the color, font size, font type, and shapes of this PPT layout according to your strategic process. This PPT presentation is compatible with Google Slides and is available in both standard screen and widescreen aspect ratios. You can also download this well researched PowerPoint template design in different formats like PDF, JPG, and PNG. So utilize this visually appealing design by clicking the download button given below.
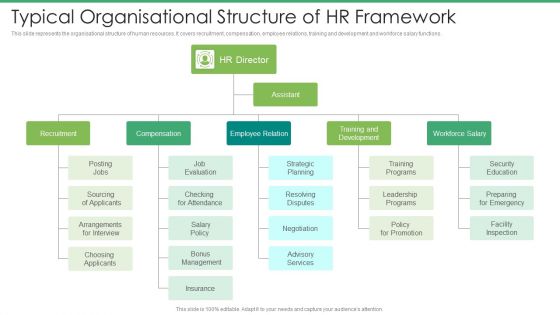
Typical Organisational Structure Of HR Framework Elements PDF
This slide represents the organisational structure of human resources. It covers recruitment, compensation, employee relations, training and development and workforce salary functions.Persuade your audience using this Typical Organisational Structure Of HR Framework Elements PDF.This PPT design covers one stages, thus making it a great tool to use. It also caters to a variety of topics including Recruitment, Strategic, Development. Download this PPT design now to present a convincing pitch that not only emphasizes the topic but also showcases your presentation skills.
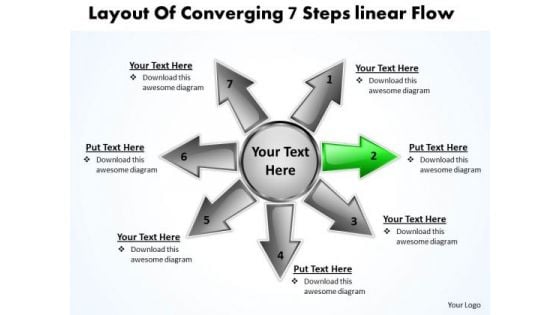
Layout Of Converging 7 Steps Linear Flow Charts And Diagrams PowerPoint Templates
We present our layout of converging 7 steps linear flow Charts and Diagrams PowerPoint templates.Download and present our Advertising PowerPoint Templates because the colour coding of our templates are specifically designed to highlight you points. Present our Arrows PowerPoint Templates because this helps you to put all your brilliant views to your audience. Use our Process and Flows PowerPoint Templates because this unique template give you an enthusiastic response and a purposeful Aye- Aye Sir. Present our Marketing PowerPoint Templates because networking is an imperative in todays world. You need to access the views of others. Similarly you need to give access to them of your abilities. Download our Shapes PowerPoint Templates because you can Enlighten them with your brilliant understanding of mental health.Use these PowerPoint slides for presentations relating to Advertising, Arrow, Background, Banner, Blue, Bookmark, Card, Choice, Concept, Creative, Design, Direction, Flow, Four, Illustration, Instruction, Label, Layout, Manual, Marketing, Modern, Next, Number, Offer, One, Options, Order, Page, Paper, Pointer, Process, Product, Promotion, Sequence, Simple, Special, Step, Symbol. The prominent colors used in the PowerPoint template are Green, Gray, Black. Use our layout of converging 7 steps linear flow Charts and Diagrams PowerPoint templates are Romantic. We assure you our Banner PowerPoint templates and PPT Slides will get their audience's attention. People tell us our layout of converging 7 steps linear flow Charts and Diagrams PowerPoint templates are Spectacular. PowerPoint presentation experts tell us our Concept PowerPoint templates and PPT Slides effectively help you save your valuable time. PowerPoint presentation experts tell us our layout of converging 7 steps linear flow Charts and Diagrams PowerPoint templates are Graceful. Use our Choice PowerPoint templates and PPT Slides are One-of-a-kind. Grab this opportunity to present with our Layout Of Converging 7 Steps Linear Flow Charts And Diagrams PowerPoint Templates. Try us out and see what a difference our templates make.
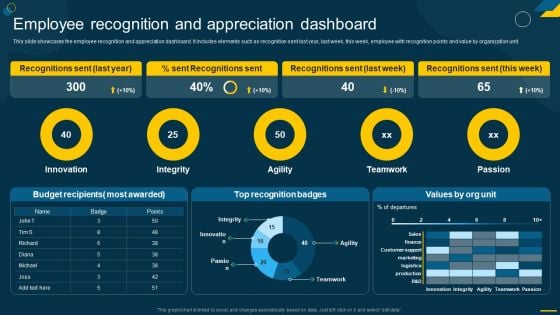
Engaging Employees Strategic Employee Recognition And Appreciation Dashboard Themes PDF
This slide showcases the employee recognition and appreciation dashboard. It includes elements such as recognition sent last year, last week, this week, employee with recognition points and value by organization unit. Slidegeeks is here to make your presentations a breeze with Engaging Employees Strategic Employee Recognition And Appreciation Dashboard Themes PDF With our easy-to-use and customizable templates, you can focus on delivering your ideas rather than worrying about formatting. With a variety of designs to choose from, youre sure to find one that suits your needs. And with animations and unique photos, illustrations, and fonts, you can make your presentation pop. So whether youre giving a sales pitch or presenting to the board, make sure to check out Slidegeeks first.
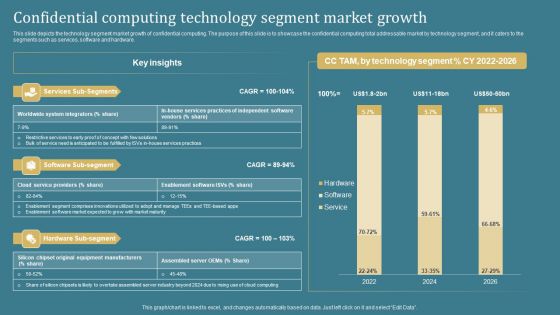
Confidential Computing System Technology Confidential Computing Technology Segment Themes PDF
This slide depicts the technology segment market growth of confidential computing. The purpose of this slide is to showcase the confidential computing total addressable market by technology segment, and it caters to the segments such as services, software and hardware. The Confidential Computing System Technology Confidential Computing Technology Segment Themes PDF is a compilation of the most recent design trends as a series of slides. It is suitable for any subject or industry presentation, containing attractive visuals and photo spots for businesses to clearly express their messages. This template contains a variety of slides for the user to input data, such as structures to contrast two elements, bullet points, and slides for written information. Slidegeeks is prepared to create an impression.
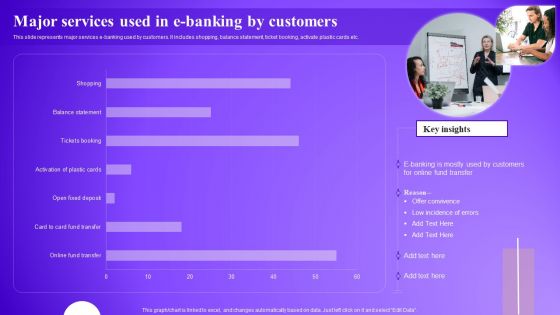
Major Services Used In E Banking By Customers Themes PDF
This slide represents major services e banking used by customers. It includes shopping, balance statement, ticket booking, activate plastic cards etc. Slidegeeks is here to make your presentations a breeze with Major Services Used In E Banking By Customers Themes PDF With our easy to use and customizable templates, you can focus on delivering your ideas rather than worrying about formatting. With a variety of designs to choose from, you are sure to find one that suits your needs. And with animations and unique photos, illustrations, and fonts, you can make your presentation pop. So whether you are giving a sales pitch or presenting to the board, make sure to check out Slidegeeks first.
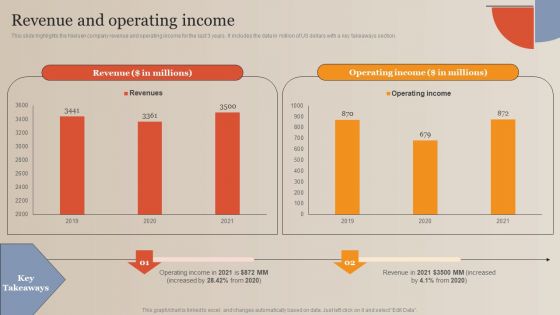
Market Study Company Outline Revenue And Operating Income Themes PDF
This slide highlights the Nielsen company revenue and operating income for the last 3 years. It includes the data in million of US dollars with a key takeaways section. Slidegeeks is here to make your presentations a breeze with Market Study Company Outline Revenue And Operating Income Themes PDF With our easy to use and customizable templates, you can focus on delivering your ideas rather than worrying about formatting. With a variety of designs to choose from, you are sure to find one that suits your needs. And with animations and unique photos, illustrations, and fonts, you can make your presentation pop. So whether you are giving a sales pitch or presenting to the board, make sure to check out Slidegeeks first.
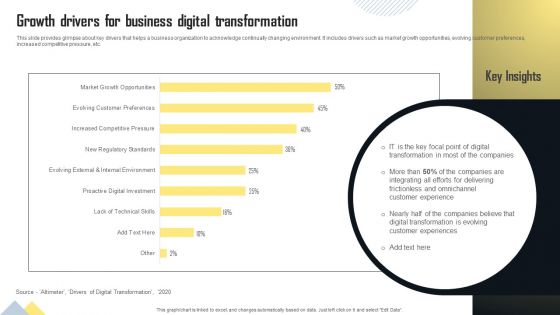
Growth Drivers For Business Digital Transformation Themes PDF
This slide provides glimpse about key drivers that helps a business organization to acknowledge continually changing environment. It includes drivers such as market growth opportunities, evolving customer preferences, increased competitive pressure, etc. This Growth Drivers For Business Digital Transformation Themes PDF from Slidegeeks makes it easy to present information on your topic with precision. It provides customization options, so you can make changes to the colors, design, graphics, or any other component to create a unique layout. It is also available for immediate download, so you can begin using it right away. Slidegeeks has done good research to ensure that you have everything you need to make your presentation stand out. Make a name out there for a brilliant performance.
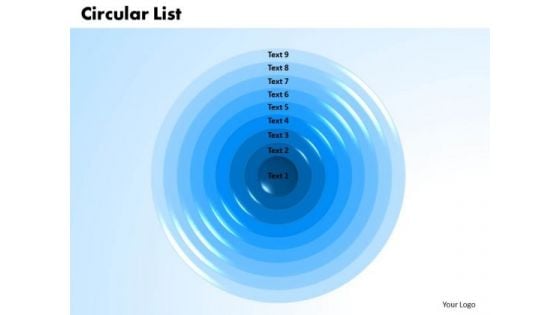
PowerPoint Slide Circular List Marketing Ppt Designs
PowerPoint Slide Circular List Marketing PPT Designs-Use to awesome List and text boxes powerpoint templates to create awesome marketing and sales priority lists or any other types of lists.-PowerPoint Slide Circular List Marketing PPT Designs-Account, Advertise, Analyze, Arrow, Brochure, Business, Catalog, Chart, Circular, Commercial, Competition, Concentric, Cyclic, Demonstration, Description, Diagram, Financial, Goals, Illustration, Information, Label, List, Management, Marketing, Note, Organization, Plan, Profit, Promote, Records, Recursive, Registry, Report, Research, Ring, Sale, Six, Spherical, Statement, Strategy, Structure, Success, Symbol Become a contributor with our PowerPoint Slide Circular List Marketing Ppt Designs. You will come out on top.
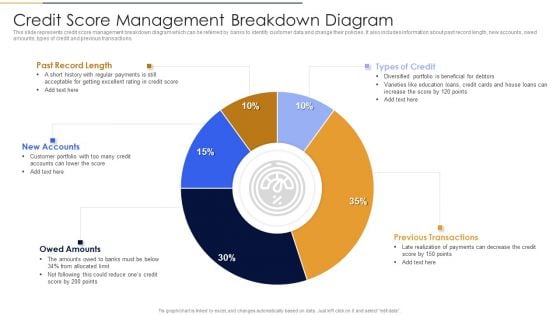
Credit Score Management Breakdown Diagram Brochure PDF
This slide represents credit score management breakdown diagram which can be referred by banks to identify customer data and change their policies. It also includes information about past record length, new accounts, owed amounts, types of credit and previous transactions. Showcasing this set of slides titled Credit Score Management Breakdown Diagram Brochure PDF. The topics addressed in these templates are Types Of Credit, Previous Transactions, Owed Amounts. All the content presented in this PPT design is completely editable. Download it and make adjustments in color, background, font etc. as per your unique business setting.
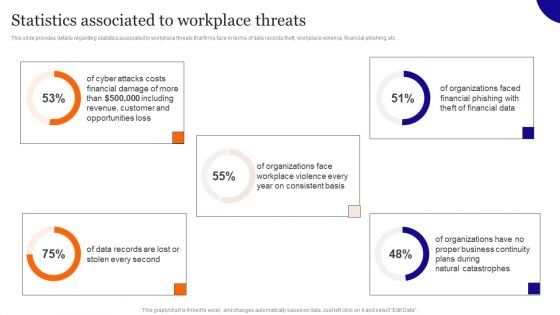
Statistics Associated To Workplace Threats Diagrams PDF
This slide provides details regarding statistics associated to workplace threats that firms face in terms of data records theft, workplace violence, financial phishing, etc. Get a simple yet stunning designed Statistics Associated To Workplace Threats Diagrams PDF. It is the best one to establish the tone in your meetings. It is an excellent way to make your presentations highly effective. So, download this PPT today from Slidegeeks and see the positive impacts. Our easy-to-edit Statistics Associated To Workplace Threats Diagrams PDF can be your go-to option for all upcoming conferences and meetings. So, what are you waiting for Grab this template today.
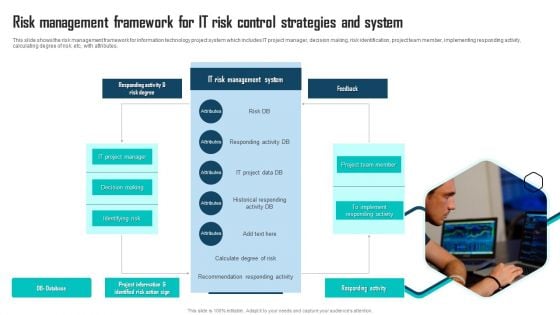
Risk Management Framework For IT Risk Control Strategies And System Ppt Slides Diagrams PDF
This slide shows the risk management framework for information technology project system which includes IT project manager, decision making, risk identification, project team member, implementing responding activity, calculating degree of risk, etc, with attributes. Persuade your audience using this Risk Management Framework For IT Risk Control Strategies And System Ppt Slides Diagrams PDF. This PPT design covers one stages, thus making it a great tool to use. It also caters to a variety of topics including IT Project Manager, Decision Making, Identifying Risk. Download this PPT design now to present a convincing pitch that not only emphasizes the topic but also showcases your presentation skills.
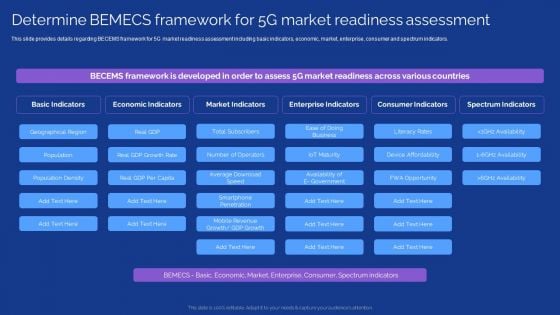
Development Guide For 5G World Determine Bemecs Framework For 5G Market Readiness Assessment Diagrams PDF
This slide provides details regarding BECEMS framework for 5G market readiness assessment including basic indicators, economic, market, enterprise, consumer and spectrum indicators. Take your projects to the next level with our ultimate collection of Development Guide For 5G World Determine Bemecs Framework For 5G Market Readiness Assessment Diagrams PDF. Slidegeeks has designed a range of layouts that are perfect for representing task or activity duration, keeping track of all your deadlines at a glance. Tailor these designs to your exact needs and give them a truly corporate look with your own brand colors they will make your projects stand out from the rest.
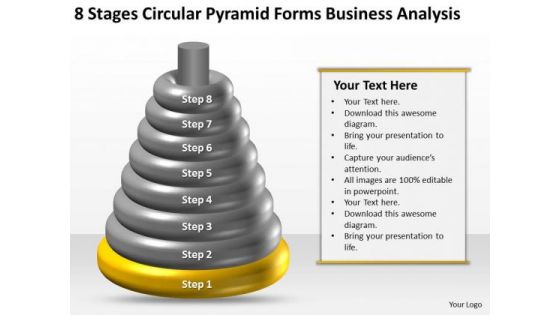
Business Diagram Chart 8 Stages Circular Pyramid Forms Analysis Ppt PowerPoint Templates
We present our business diagram chart 8 stages circular pyramid forms analysis ppt PowerPoint templates.Present our Marketing PowerPoint Templates because Our PowerPoint Templates and Slides are designed to help you succeed. They have all the ingredients you need. Present our Finance PowerPoint Templates because Our PowerPoint Templates and Slides will provide you the cutting edge. Slice through the doubts in the minds of your listeners. Download our Funnels PowerPoint Templates because Our PowerPoint Templates and Slides will fulfill your every need. Use them and effectively satisfy the desires of your audience. Download our Layers PowerPoint Templates because Our PowerPoint Templates and Slides will Activate the energies of your audience. Get their creative juices flowing with your words. Use our Business PowerPoint Templates because Our PowerPoint Templates and Slides offer you the widest possible range of options.Use these PowerPoint slides for presentations relating to Diagram, website, isolated, item, corporation, business, concept, sign, render, hierarchy, visual, presentation, internet, template, shadow, circle, graphic, element, simple, shape, graph, modern, illustration, www, circular, chart, number, round, web, design, growth, pyramid, set, information, conceptual, sliced, rainbow. The prominent colors used in the PowerPoint template are Yellow, Gray, Black. Be a change agent with our Business Diagram Chart 8 Stages Circular Pyramid Forms Analysis Ppt PowerPoint Templates. They will make you look good.
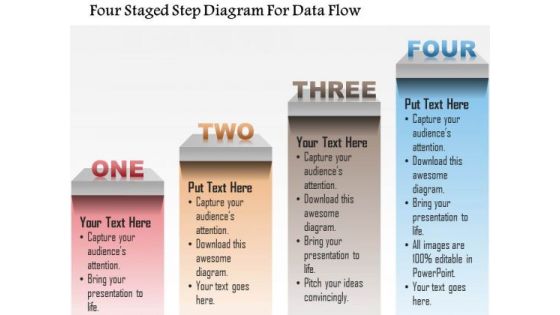
Busines Diagram Four Staged Step Diagram For Data Flow Presentation Template
This business diagram has been designed with graphic of four staged step diagram. Display the concept of data flow in any presentations by using this professional diagram.
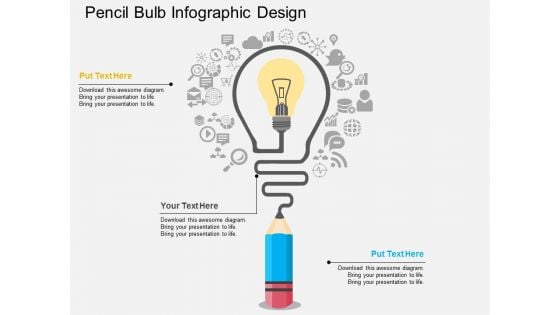
Pencil Bulb Infographic Design Powerpoint Template
Our professionally designed business diagram is as an effective tool for communicating business ideas and strategies for corporate planning. This PowerPoint template contains graphics of pencil bulb infographic template. Above slide is suitable to display business ideas.
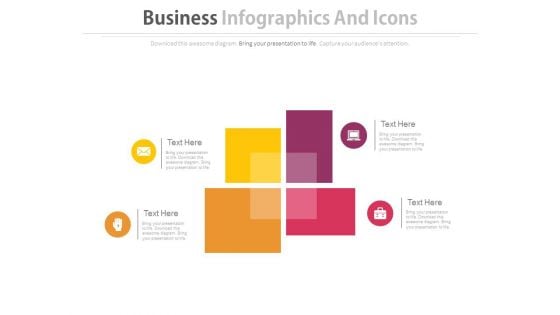
Four Blocks Infographics Design Powerpoint Template
This Business slide has design of infographic layout. You may use this PPT slide to define any business process. This business diagram helps to bullet point your thoughts and ideas.
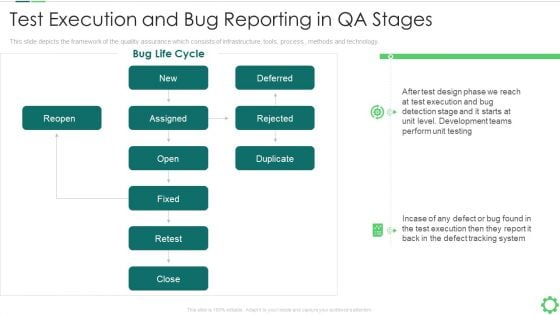
Agile Quality Control Framework IT Test Execution And Bug Reporting In QA Stages Diagrams PDF
This slide depicts the framework of the quality assurance which consists of infrastructure, tools, process , methods and technology. Deliver an awe inspiring pitch with this creative agile quality control framework it test execution and bug reporting in qa stages diagrams pdf bundle. Topics like perform, development, teams, design, execution can be discussed with this completely editable template. It is available for immediate download depending on the needs and requirements of the user.

Business Charts PowerPoint Templates Thinking Smiley Face Graphic
Business Charts PowerPoint templates thinking smiley face graphic-This PowerPoint Diagram shows you the Designs of Confused emoticons expressing their Situation. This Diagram signifies the concept of thinking, frustration, fuddle, mess up, mislead, mortify, muddle, mystify, obscure, perplex, perturb, puzzle, shame, stir up, trouble, unhinge, unsettle, upset, and worry.-Business Charts PowerPoint templates thinking smiley face graphic Achieve the fame you aspire to. Our Business Charts PowerPoint Templates Thinking Smiley Face Graphic will make it a certainty.
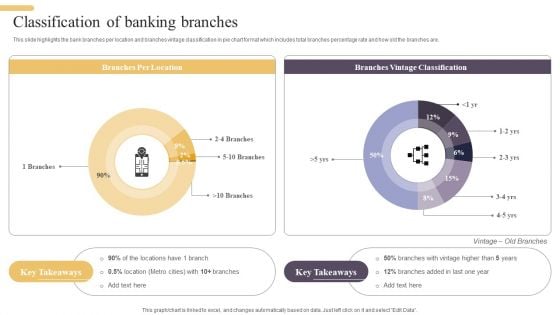
Improving Digital Banking Operations And Services Framework Classification Of Banking Branches Brochure PDF
This slide highlights the bank branches per location and branches vintage classification in pie chart format which includes total branches percentage rate and how old the branches are. Take your projects to the next level with our ultimate collection of Improving Digital Banking Operations And Services Framework Classification Of Banking Branches Brochure PDF. Slidegeeks has designed a range of layouts that are perfect for representing task or activity duration, keeping track of all your deadlines at a glance. Tailor these designs to your exact needs and give them a truly corporate look with your own brand colors they will make your projects stand out from the rest.
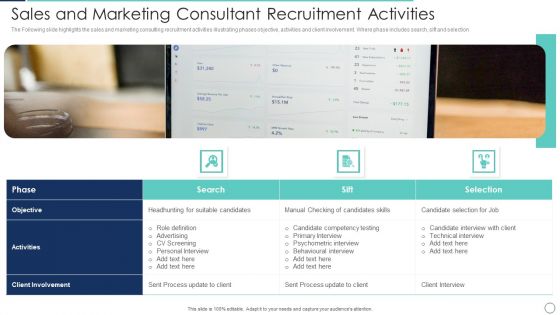
Sales And Marketing Consultant Recruitment Activities Diagrams PDF
The Following slide highlights the sales and marketing consulting recruitment activities illustrating phases objective, activities and client involvement. Where phase includes search, sift and selection.Showcasing this set of slides titled Sales And Marketing Consultant Recruitment Activities Diagrams PDF The topics addressed in these templates are Client Involvement, Personal Interview, Psychometric Interview All the content presented in this PPT design is completely editable. Download it and make adjustments in color, background, font etc. as per your unique business setting.
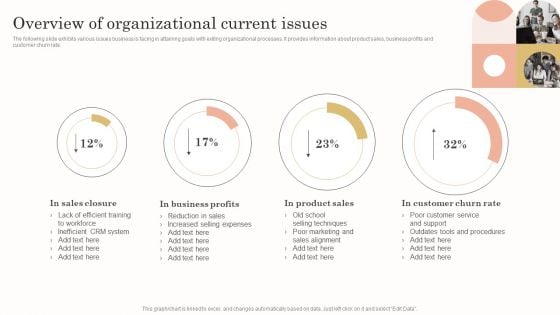
Overview Of Organizational Current Issues Diagrams PDF
The following slide exhibits various issues business is facing in attaining goals with exiting organizational processes. It provides information about product sales, business profits and customer churn rate. Coming up with a presentation necessitates that the majority of the effort goes into the content and the message you intend to convey. The visuals of a PowerPoint presentation can only be effective if it supplements and supports the story that is being told. Keeping this in mind our experts created Overview Of Organizational Current Issues Diagrams PDF to reduce the time that goes into designing the presentation. This way, you can concentrate on the message while our designers take care of providing you with the right template for the situation.
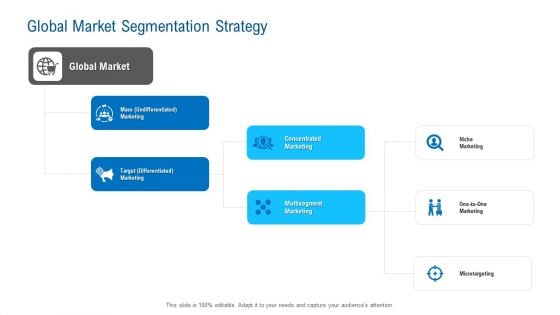
Merchandising Industry Analysis Global Market Segmentation Strategy Themes PDF
Presenting merchandising industry analysis global market segmentation strategy themes pdf to provide visual cues and insights. Share and navigate important information on three stages that need your due attention. This template can be used to pitch topics like global market, target marketing, multisegment marketing. In addtion, this PPT design contains high resolution images, graphics, etc, that are easily editable and available for immediate download.
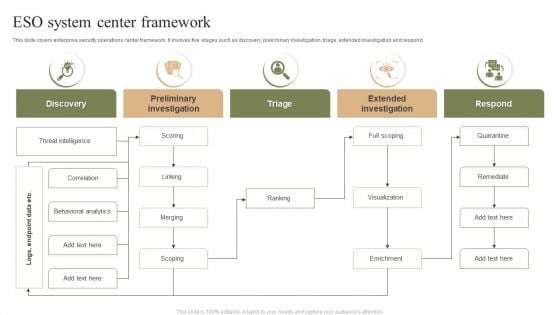
ESO System Center Framework Ppt PowerPoint Presentation Gallery Brochure PDF
This slide covers enterprise security operations center framework. It involves five stages such as discovery, preliminary investigation, triage, extended investigation and respond. Persuade your audience using this ESO System Center Framework Ppt PowerPoint Presentation Gallery Brochure PDF. This PPT design covers five stages, thus making it a great tool to use. It also caters to a variety of topics including Discovery, Preliminary Investigation, Triage, Extended Investigation. Download this PPT design now to present a convincing pitch that not only emphasizes the topic but also showcases your presentation skills.
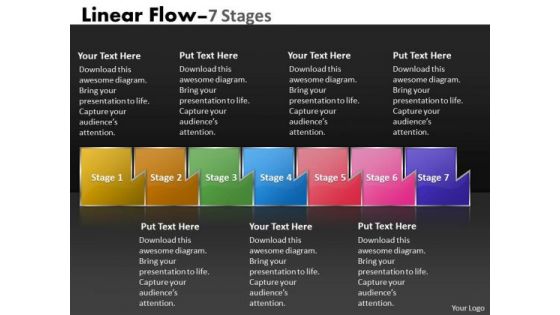
Ppt Background Multicolored Sequential Marketing Flow Corporate Plan PowerPoint 1 Design
We present our PPT Background multicolored Sequential marketing flow corporate plan PowerPoint 1 design. Use our Business PowerPoint Templates because, Puzzles or Jigsaw Template: - It is all there in bits and pieces. Use our Shapes PowerPoint Templates because, Our PowerPoint templates give this step by step process to achieve the aim. Use our Design PowerPoint Templates because, you have the people in place, selected the team leaders and all are raring to go. Use our Signs PowerPoint Templates because, Now you have to coordinate and motivate your team. Use our Process and Flows PowerPoint Templates because, the structure of our templates allows you to effectively highlight the key issues concerning the growth of your business. Use these PowerPoint slides for presentations relating to abstract, algorithm, arrow, business, chart, connection, design, development, diagram, direction, element, flow, graph, linear, linear diagram, management, organization, plan, process, section, segment, set, sign, solution, strategy, symbol, vector. The prominent colors used in the PowerPoint template are Green, Blue, and Red Complete your projects on time with our Ppt Background Multicolored Sequential Marketing Flow Corporate Plan PowerPoint 1 Design. Dont pass up this opportunity to shine.
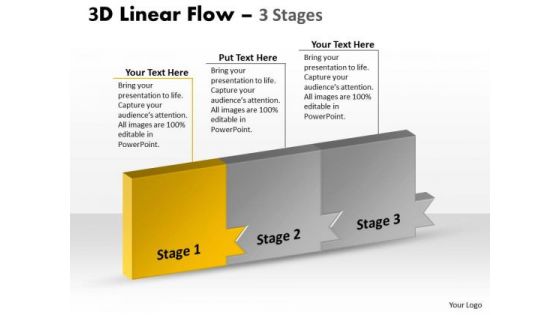
Ppt Continous Way To Show 3 Practice The PowerPoint Macro Steps Workflow 2 Design
We present our PPT continuous way to show 3 practices the PowerPoint macro steps workflow 2 designs. Use our Business PowerPoint Templates because; represent the progress in our lives. Use our Shapes PowerPoint Templates because, Probe the minds of your colleagues, see their faces light up as they assimilate and understand the value of your suggestions. Use our Design PowerPoint Templates because, Harness these opportunities, celebrate your performance till date and focus on greater growth and expansion in coming years. Use our Signs PowerPoint Templates because, A healthy is the essence of a sense of happiness. Use our Process and Flows PowerPoint Templates because, Knowledge is power goes the popular saying. Use these PowerPoint slides for presentations relating to abstract, algorithm, arrow, business, chart, connection, design, development, diagram, direction, element, flow, graph, linear, linear diagram, management, organization, plan, process, section, segment, set, sign, solution, strategy, symbol, vector. The prominent colors used in the PowerPoint template are Yellow, Gray, and Black Keep the camera trained on you with our Ppt Continous Way To Show 3 Practice The PowerPoint Macro Steps Workflow 2 Design. Just download, type and present.
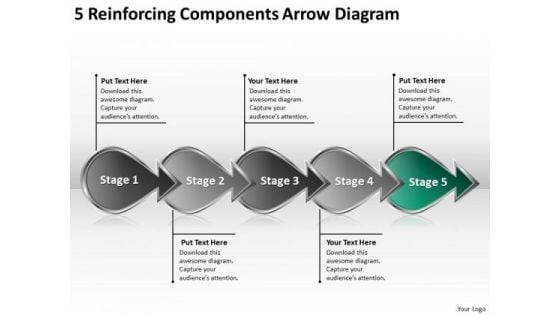
Reinforcing Components Arrow Diagram Ppt Business Process Flow Chart Examples PowerPoint Templates
We present our reinforcing components arrow diagram ppt business process flow chart examples PowerPoint templates.Present our Marketing PowerPoint Templates because with the help of our Slides you can Illustrate these thoughts with this slide. Download our Business PowerPoint Templates because it will demonstrate the strength of character under severe stress. Shine the torch ahead and bring the light to shine on all. Download our Arrows PowerPoint Templates because our PowerPoint templates give this step by step process to acheive the aim. Use our Shapes PowerPoint Templates because you are the Champion of your team shall anoint. Use our Process and Flow PowerPoint Templates because you have configured your targets, identified your goals as per priority and importance.Use these PowerPoint slides for presentations relating to Arrow, Arrows, Block, Business, Chart, Design, Development, Diagram, Direction, Element, Flow, Flowchart, Graph, Linear, Management, Organization, Process, Program, Section, Sign, Solution, Symbol. The prominent colors used in the PowerPoint template are Green , Black, Gray. PowerPoint presentation experts tell us our reinforcing components arrow diagram ppt business process flow chart examples PowerPoint templates are Luxurious. Customers tell us our Block PowerPoint templates and PPT Slides are specially created by a professional team with vast experience. They diligently strive to come up with the right vehicle for your brilliant Ideas. Use our reinforcing components arrow diagram ppt business process flow chart examples PowerPoint templates are Majestic. Use our Diagram PowerPoint templates and PPT Slides are Liberated. We assure you our reinforcing components arrow diagram ppt business process flow chart examples PowerPoint templates are Ritzy. People tell us our Development PowerPoint templates and PPT Slides will save the presenter time. Spread it out in equal doses. Get the portions right with our Reinforcing Components Arrow Diagram Ppt Business Process Flow Chart Examples PowerPoint Templates.
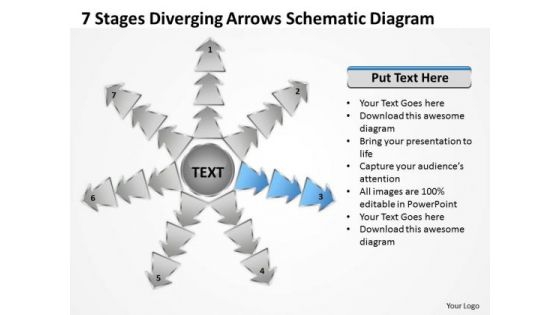
7 Stages Diverging Arrows Schematic Diagram Ppt Charts And Networks PowerPoint Slide
We present our 7 stages diverging arrows schematic diagram ppt Charts and Networks PowerPoint Slide.Use our Marketing PowerPoint Templates because you can Break it all down to Key Result Areas. Use our Shapes PowerPoint Templates because this diagram is designed to help your audience to develop their thoughts along the way. Use our Arrows PowerPoint Templates because this slide illuminates the spiritual brilliance of Jesus and showers the love for mankind he showed even while being crucified. Use our Business PowerPoint Templates because you can Lead your flock steadily to greater heights. Look around at the vast potential of achievement around you. Use our Process and Flows PowerPoint Templates because you can Highlight the key components of your entire manufacturing/ business process.Use these PowerPoint slides for presentations relating to Arrows, Business, Chart, Cyclic, Data, Diagram, Financial, Goal, Graph, Illustration, Info, Information, Marketing, Model, Option, Part, Pie, Presentation, Process, Result, Sphere, Statistics. The prominent colors used in the PowerPoint template are Blue, Gray, Black. The feedback we get is that our 7 stages diverging arrows schematic diagram ppt Charts and Networks PowerPoint Slide are Fashionable. People tell us our Data PowerPoint templates and PPT Slides are Perfect. Presenters tell us our 7 stages diverging arrows schematic diagram ppt Charts and Networks PowerPoint Slide will make the presenter successul in his career/life. Use our Goal PowerPoint templates and PPT Slides are Bold. Use our 7 stages diverging arrows schematic diagram ppt Charts and Networks PowerPoint Slide are Spiffy. Use our Financial PowerPoint templates and PPT Slides are Functional. Feather your nest with our 7 Stages Diverging Arrows Schematic Diagram Ppt Charts And Networks PowerPoint Slide. Your thoughts will evolve in a comfortable climate.
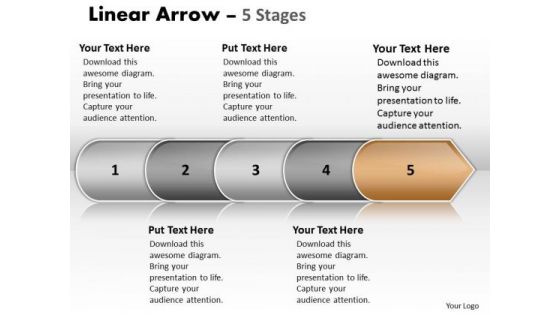
Strategy Ppt Theme Linear Arrow 5 State Diagram Business Plan PowerPoint 6 Graphic
We present our strategy PPT Theme linear arrow 5 state diagram business plan PowerPoint 6 Graphic. Use our Arrows PowerPoint Templates because, Corporate Ladder: -The graphic is a symbol of growth and success. Use our Layers PowerPoint Templates because, they are logical, accurate and to the point. Use our Shapes PowerPoint Templates because, Individual components well researched and understood in their place. Use our Business PowerPoint Templates because, to go for Gold and not just silver. Use our Process and Flows PowerPoint Templates because; Refine them all as you take them through the numerous filtering stages of the funnel of your quality control process. Use these PowerPoint slides for presentations relating to abstract, algorithm, arrow, block diagram, business, chart, color, connection, design, development, diagram, direction, element, flow, graph, linear, linear diagram, management, organization, plan, process, section, segment, set, sign, solution, strategy, symbol, technology, vector. The prominent colors used in the PowerPoint template are Brown, Gray, and White Juggle the ballpark figures on our Strategy Ppt Theme Linear Arrow 5 State Diagram Business Plan PowerPoint 6 Graphic. Your estimates will come out correct.
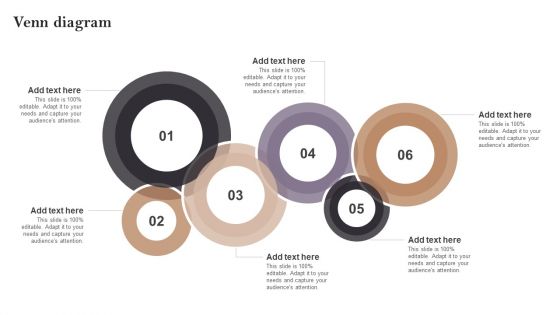
Venn Diagram Opening Retail Store In Untapped Industry For Sales Growth Infographics PDF
Do you know about Slidesgeeks Venn Diagram Opening Retail Store In Untapped Industry For Sales Growth Infographics PDF These are perfect for delivering any kind od presentation. Using it, create PowerPoint presentations that communicate your ideas and engage audiences. Save time and effort by using our pre-designed presentation templates that are perfect for a wide range of topic. Our vast selection of designs covers a range of styles, from creative to business, and are all highly customizable and easy to edit. Download as a PowerPoint template or use them as Google Slides themes.
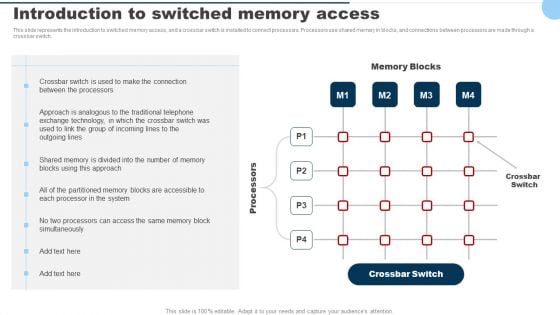
Introduction To Switched Memory Access Ppt PowerPoint Presentation Diagram Graph Charts PDF
This slide represents the introduction to switched memory access, and a crossbar switch is installed to connect processors. Processors use shared memory in blocks, and connections between processors are made through a crossbar switch. Coming up with a presentation necessitates that the majority of the effort goes into the content and the message you intend to convey. The visuals of a PowerPoint presentation can only be effective if it supplements and supports the story that is being told. Keeping this in mind our experts created Introduction To Switched Memory Access Ppt PowerPoint Presentation Diagram Graph Charts PDF to reduce the time that goes into designing the presentation. This way, you can concentrate on the message while our designers take care of providing you with the right template for the situation.

Platforms To Run Paid Search Engine Campaign Ppt PowerPoint Presentation Diagram Graph Charts PDF
This slide showcases various platforms that can be leveraged by marketers for running paid search engine campaigns. Three major platforms for paid search engine ads are - Google, Bing and Yahoo Welcome to our selection of the Platforms To Run Paid Search Engine Campaign Ppt PowerPoint Presentation Diagram Graph Charts PDF. These are designed to help you showcase your creativity and bring your sphere to life. Planning and Innovation are essential for any business that is just starting out. This collection contains the designs that you need for your everyday presentations. All of our PowerPoints are 100 percent editable, so you can customize them to suit your needs. This multi purpose template can be used in various situations. Grab these presentation templates today.
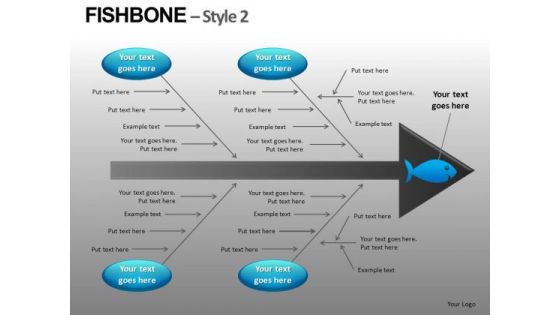
Fishbone Diagram Ppt Slides Download
Fishbone Diagram PPT Slides Download-These high quality powerpoint pre-designed slides and powerpoint templates have been carefully created by our professional team to help you impress your audience. All slides have been created and are 100% editable in powerpoint. Each and every property of any graphic - color, size, orientation, shading, outline etc. can be modified to help you build an effective powerpoint presentation. Any text can be entered at any point in the powerpoint template or slide. Simply DOWNLOAD, TYPE and PRESENT!These PowerPoint Presentation slides can be used for themes relating to--Arrow, cause, defect, deficiency, diagram, document, effect, envelope, environment, fishbone, flow, industry, kahashiwara, machine, manufacture, material, paper, pencil, safety, sketch Our Fishbone Diagram Ppt Slides Download team are great exponents of visual art. They have created some beauties for you.
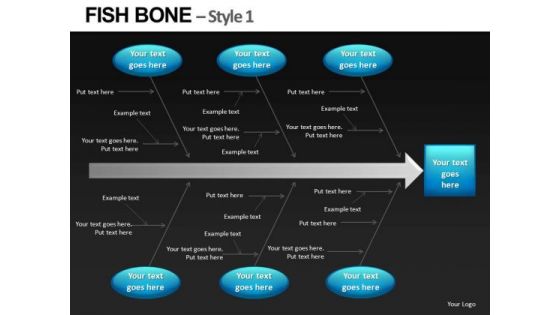
PowerPoint Slides Fishbone Diagrams Templates
PowerPoint Slides FishBone Diagrams templates-These high quality powerpoint pre-designed slides and powerpoint templates have been carefully created by our professional team to help you impress your audience. All slides have been created and are 100% editable in powerpoint. Each and every property of any graphic - color, size, orientation, shading, outline etc. can be modified to help you build an effective powerpoint presentation. Any text can be entered at any point in the powerpoint template or slide. Simply DOWNLOAD, TYPE and PRESENT!These PowerPoint Presentation slides can be used for themes relating to--Arrow, cause, defect, deficiency, diagram, document, effect, envelope, environment, fishbone, flow, industry, kahashiwara, machine, manufacture, material, paper, pencil, safety, sketch Make it clear your product is the best with our PowerPoint Slides Fishbone Diagrams Templates. Just download, type and present.
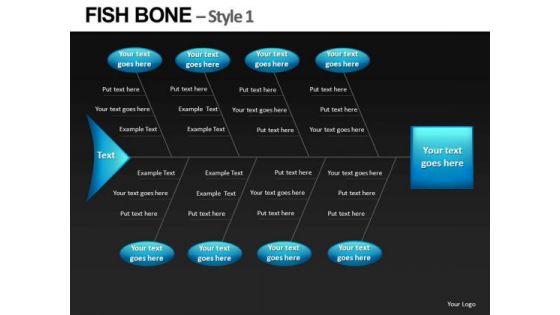
Ppt Slides Ishikawa Diagrams Fishbone
PPT Slides Ishikawa Diagrams Fishbone-These high quality powerpoint pre-designed slides and powerpoint templates have been carefully created by our professional team to help you impress your audience. All slides have been created and are 100% editable in powerpoint. Each and every property of any graphic - color, size, orientation, shading, outline etc. can be modified to help you build an effective powerpoint presentation. Any text can be entered at any point in the powerpoint template or slide. Simply DOWNLOAD, TYPE and PRESENT!These PowerPoint Presentation slides can be used for themes relating to--Arrow, cause, defect, deficiency, diagram, document, effect, envelope, environment, fishbone, flow, industry, kahashiwara, machine, manufacture, material, paper, pencil, safety, sketch Never fail to impress with our Ppt Slides Ishikawa Diagrams Fishbone. You will be at the top of your game.
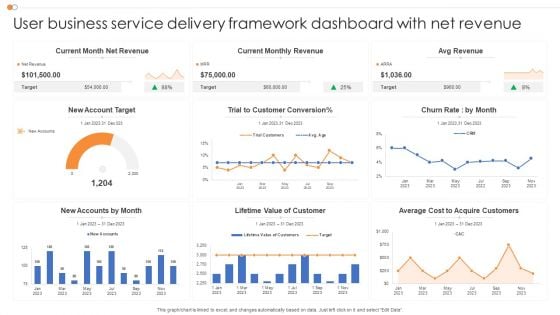
User Business Service Delivery Framework Dashboard With Net Revenue Microsoft PDF
Showcasing this set of slides titled User Business Service Delivery Framework Dashboard With Net Revenue Microsoft PDF. The topics addressed in these templates are Service Delivery, Framework Dashboard, Net Revenue. All the content presented in this PPT design is completely editable. Download it and make adjustments in color, background, font etc. as per your unique business setting.

Risk Due Diligence For M And A Ppt Diagram Graph Charts PDF
The following slide showcases the approach and execution of due diligence for mergers and acquisitions. It depicts M and A strategy, target screening, transaction execution, integration, divestiture and key insights. Showcasing this set of slides titled Risk Due Diligence For M And A Ppt Diagram Graph Charts PDF. The topics addressed in these templates are Approach Risk, Handoff Risk, Execution Risk, Transaction Curve. All the content presented in this PPT design is completely editable. Download it and make adjustments in color, background, font etc. as per your unique business setting.
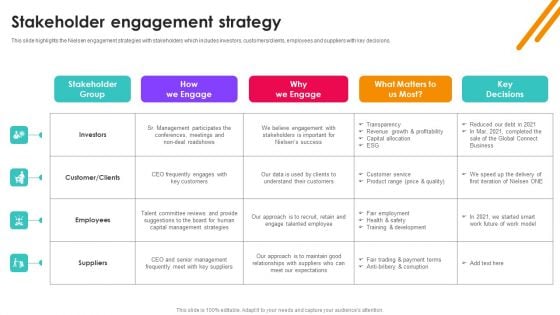
Nielsen Business Profile Stakeholder Engagement Strategy Ppt PowerPoint Presentation Diagram Graph Charts PDF
This slide highlights the Nielsen engagement strategies with stakeholders which includes investors, customers or clients, employees and suppliers with key decisions. The Nielsen Business Profile Stakeholder Engagement Strategy Ppt PowerPoint Presentation Diagram Graph Charts PDF is a compilation of the most recent design trends as a series of slides. It is suitable for any subject or industry presentation, containing attractive visuals and photo spots for businesses to clearly express their messages. This template contains a variety of slides for the user to input data, such as structures to contrast two elements, bullet points, and slides for written information. Slidegeeks is prepared to create an impression.
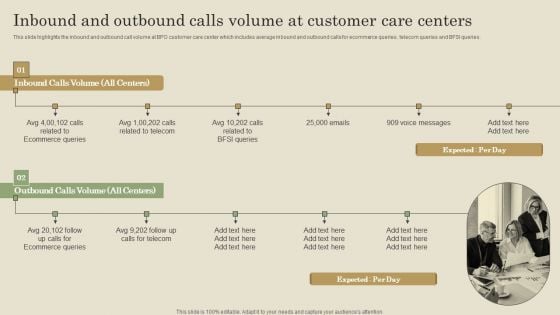
Inbound And Outbound Calls Volume At Customer Care Centers Ppt PowerPoint Presentation Diagram Graph Charts PDF
This slide highlights the inbound and outbound call volume at BPO customer care center which includes average inbound and outbound calls for ecommerce queries , telecom queries and BFSI queries. If your project calls for a presentation, then Slidegeeks is your go to partner because we have professionally designed, easy to edit templates that are perfect for any presentation. After downloading, you can easily edit Inbound And Outbound Calls Volume At Customer Care Centers Ppt PowerPoint Presentation Diagram Graph Charts PDF and make the changes accordingly. You can rearrange slides or fill them with different images. Check out all the handy templates
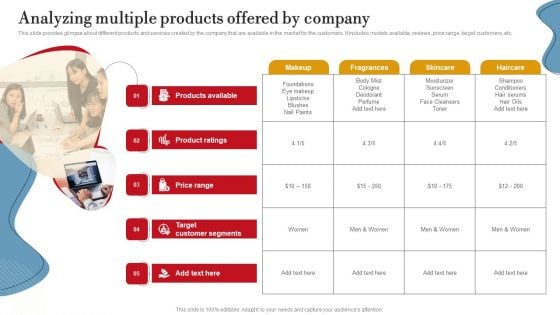
Analyzing Multiple Products Offered By Company Ppt PowerPoint Presentation Diagram Graph Charts PDF
This slide provides glimpse about different products and services created by the company that are available in the market for the customers. It includes models available, reviews, price range, target customers, etc. Find a pre designed and impeccable Analyzing Multiple Products Offered By Company Ppt PowerPoint Presentation Diagram Graph Charts PDF. The templates can ace your presentation without additional effort. You can download these easy to edit presentation templates to make your presentation stand out from others. So, what are you waiting for Download the template from Slidegeeks today and give a unique touch to your presentation.
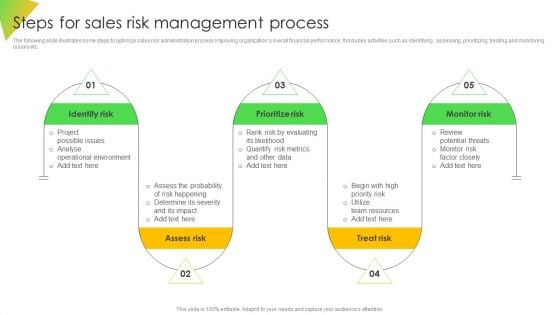
Steps For Sales Risk Management Process Ppt Diagram Graph Charts PDF
The following slide illustrates some steps to optimize sales risk administration process improving organizations overall financial performance. It includes activities such as identifying , assessing, prioritizing, treating and monitoring issues etc. The Steps For Sales Risk Management Process Ppt Diagram Graph Charts PDF is a compilation of the most recent design trends as a series of slides. It is suitable for any subject or industry presentation, containing attractive visuals and photo spots for businesses to clearly express their messages. This template contains a variety of slides for the user to input data, such as structures to contrast two elements, bullet points, and slides for written information. Slidegeeks is prepared to create an impression.
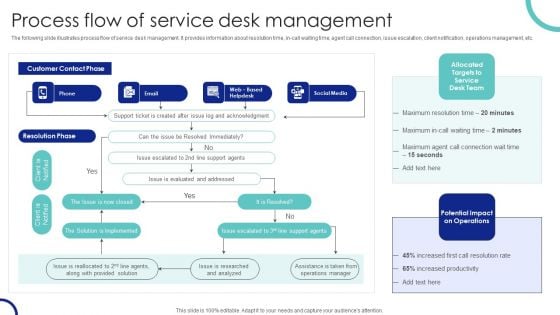
Process Flow Of Service Desk Management Ppt PowerPoint Presentation Diagram Graph Charts PDF
The following slide illustrates process flow of service desk management. It provides information about resolution time, in-call waiting time, agent call connection, issue escalation, client notification, operations management, etc. Explore a selection of the finest Process Flow Of Service Desk Management Ppt PowerPoint Presentation Diagram Graph Charts PDF here. With a plethora of professionally designed and pre made slide templates, you can quickly and easily find the right one for your upcoming presentation. You can use our Process Flow Of Service Desk Management Ppt PowerPoint Presentation Diagram Graph Charts PDF to effectively convey your message to a wider audience. Slidegeeks has done a lot of research before preparing these presentation templates. The content can be personalized and the slides are highly editable. Grab templates today from Slidegeeks.
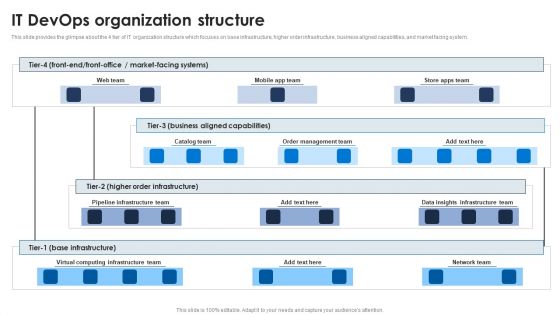
It Devops Organization Structure Ppt PowerPoint Presentation Diagram Graph Charts PDF
This slide provides the glimpse about the 4 tier of IT organization structure which focuses on base infrastructure, higher order infrastructure, business aligned capabilities, and market facing system. Do you have an important presentation coming up Are you looking for something that will make your presentation stand out from the rest Look no further than It Devops Organization Structure Ppt PowerPoint Presentation Diagram Graph Charts PDF. With our professional designs, you can trust that your presentation will pop and make delivering it a smooth process. And with Slidegeeks, you can trust that your presentation will be unique and memorable. So why wait Grab It Devops Organization Structure Ppt PowerPoint Presentation Diagram Graph Charts PDF today and make your presentation stand out from the rest.
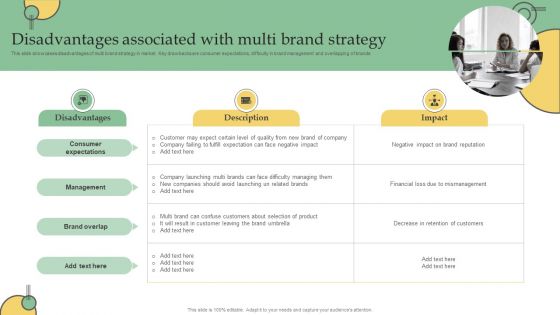
Disadvantages Associated With Multi Brand Strategy Ppt PowerPoint Presentation Diagram Graph Charts PDF
This slide showcases disadvantages of multi brand strategy in market. Key drawbacks are consumer expectations, difficulty in brand management and overlapping of brands. Explore a selection of the finest Disadvantages Associated With Multi Brand Strategy Ppt PowerPoint Presentation Diagram Graph Charts PDF here. With a plethora of professionally designed and pre made slide templates, you can quickly and easily find the right one for your upcoming presentation. You can use our Disadvantages Associated With Multi Brand Strategy Ppt PowerPoint Presentation Diagram Graph Charts PDF to effectively convey your message to a wider audience. Slidegeeks has done a lot of research before preparing these presentation templates. The content can be personalized and the slides are highly editable. Grab templates today from Slidegeeks.
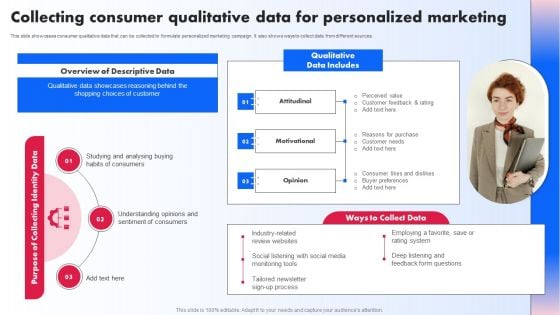
Collecting Consumer Qualitative Data For Personalized Marketing Ppt PowerPoint Presentation Diagram Graph Charts PDF
This slide showcases consumer qualitative data that can be collected to formulate personalized marketing campaign. It also shows ways to collect data from different sources Do you have an important presentation coming up Are you looking for something that will make your presentation stand out from the rest Look no further than Collecting Consumer Qualitative Data For Personalized Marketing Ppt PowerPoint Presentation Diagram Graph Charts PDF. With our professional designs, you can trust that your presentation will pop and make delivering it a smooth process. And with Slidegeeks, you can trust that your presentation will be unique and memorable. So why wait Grab Collecting Consumer Qualitative Data For Personalized Marketing Ppt PowerPoint Presentation Diagram Graph Charts PDF today and make your presentation stand out from the rest.
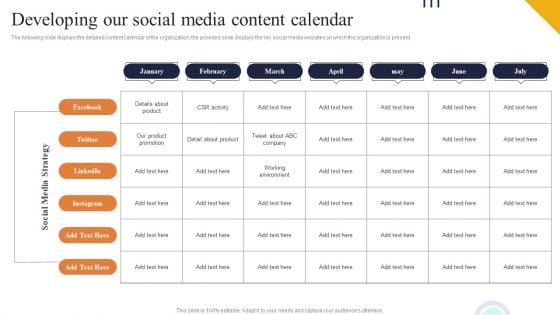
Developing Our Social Media Content Calendar Ppt PowerPoint Presentation Diagram Graph Charts PDF
The following slide displays the detailed content calendar of the organization, the provided slide displays the key social media websites on which the organization is present. Get a simple yet stunning designed Developing Our Social Media Content Calendar Ppt PowerPoint Presentation Diagram Graph Charts PDF. It is the best one to establish the tone in your meetings. It is an excellent way to make your presentations highly effective. So, download this PPT today from Slidegeeks and see the positive impacts. Our easy to edit Developing Our Social Media Content Calendar Ppt PowerPoint Presentation Diagram Graph Charts PDF can be your go to option for all upcoming conferences and meetings. So, what are you waiting for Grab this template today.
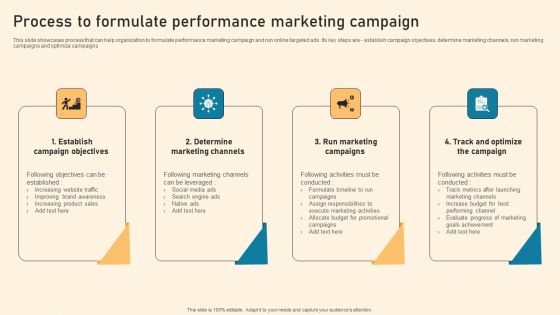
Process To Formulate Performance Marketing Campaign Ppt PowerPoint Presentation Diagram Graph Charts PDF
This slide showcases process that can help organization to formulate performance marketing campaign and run online targeted ads. Its key steps are - establish campaign objectives, determine marketing channels, run marketing campaigns and optimize campaigns Explore a selection of the finest Process To Formulate Performance Marketing Campaign Ppt PowerPoint Presentation Diagram Graph Charts PDF here. With a plethora of professionally designed and pre made slide templates, you can quickly and easily find the right one for your upcoming presentation. You can use our Process To Formulate Performance Marketing Campaign Ppt PowerPoint Presentation Diagram Graph Charts PDF to effectively convey your message to a wider audience. Slidegeeks has done a lot of research before preparing these presentation templates. The content can be personalized and the slides are highly editable. Grab templates today from Slidegeeks.

Various Billing Software Comparison Chart Ppt PowerPoint Presentation File Diagrams PDF
Following slide represents comparative analysis of various software for company billing system. It includes various parameters such as prices, installation, time tracking, individual invoices, expense tracking etc. Do you have an important presentation coming up Are you looking for something that will make your presentation stand out from the rest Look no further than Various Billing Software Comparison Chart Ppt PowerPoint Presentation File Diagrams PDF With our professional designs, you can trust that your presentation will pop and make delivering it a smooth process. And with Slidegeeks, you can trust that your presentation will be unique and memorable. So why wait Grab Various Billing Software Comparison Chart Ppt PowerPoint Presentation File Diagrams PDF today and make your presentation stand out from the rest.
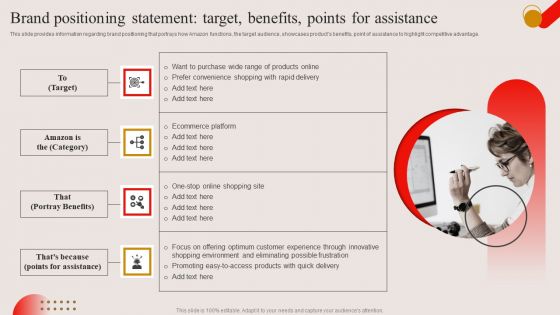
Brand Positioning Statement Target Benefits Points For Assistance Ppt PowerPoint Presentation Diagram Graph Charts PDF
This slide provides information regarding brand positioning that portrays how Amazon functions, the target audience, showcases products benefits, point of assistance to highlight competitive advantage. Get a simple yet stunning designed Brand Positioning Statement Target Benefits Points For Assistance Ppt PowerPoint Presentation Diagram Graph Charts PDF. It is the best one to establish the tone in your meetings. It is an excellent way to make your presentations highly effective. So, download this PPT today from Slidegeeks and see the positive impacts. Our easy to edit Brand Positioning Statement Target Benefits Points For Assistance Ppt PowerPoint Presentation Diagram Graph Charts PDF can be your go to option for all upcoming conferences and meetings. So, what are you waiting for Grab this template today.
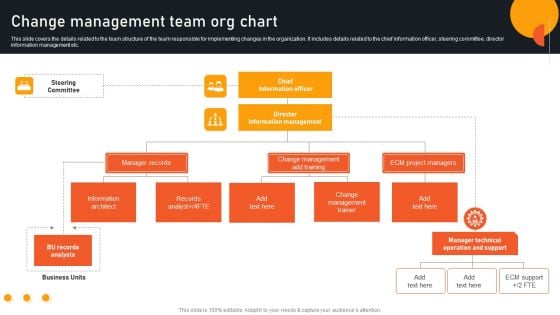
Transform Management Instruction Schedule Change Management Team Org Chart Diagrams PDF
This slide covers the details related to the team structure of the team responsible for implementing changes in the organization. It includes details related to the chief information officer, steering committee, director information management etc. Create an editable Transform Management Instruction Schedule Change Management Team Org Chart Diagrams PDF that communicates your idea and engages your audience. Whether youre presenting a business or an educational presentation, pre designed presentation templates help save time. Transform Management Instruction Schedule Change Management Team Org Chart Diagrams PDF is highly customizable and very easy to edit, covering many different styles from creative to business presentations. Slidegeeks has creative team members who have crafted amazing templates. So, go and get them without any delay.

Key Texting And SMS Marketing Statistics Ppt PowerPoint Presentation Diagram Graph Charts PDF
This slide represents the statistical data to help marketers analyze the benefits and importance of SMS marketing for business growth and development. It includes key SMS marketing statistics such as click through rates, opt-ins etc. Get a simple yet stunning designed Key Texting And SMS Marketing Statistics Ppt PowerPoint Presentation Diagram Graph Charts PDF. It is the best one to establish the tone in your meetings. It is an excellent way to make your presentations highly effective. So, download this PPT today from Slidegeeks and see the positive impacts. Our easy to edit Key Texting And SMS Marketing Statistics Ppt PowerPoint Presentation Diagram Graph Charts PDF can be your go to option for all upcoming conferences and meetings. So, what are you waiting for Grab this template today.
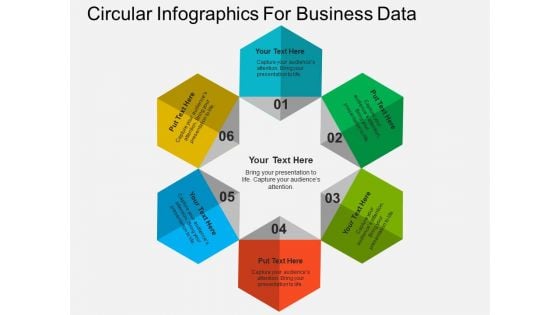
Circular Infographics For Business Data Powerpoint Templates
This PowerPoint diagram slide contains circular infographic. Download this diagram slide to display six steps of business process. You can edit text, color, shade and style of this diagram as per you need.
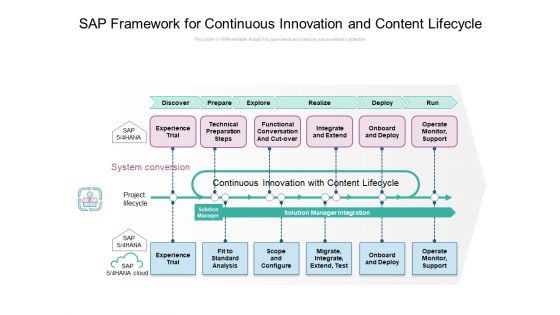
SAP Framework For Continuous Innovation And Content Lifecycle Ppt PowerPoint Presentation Pictures Design Inspiration PDF
Presenting sap framework for continuous innovation and content lifecycle ppt powerpoint presentation pictures design inspiration pdf to dispense important information. This template comprises twelve stages. It also presents valuable insights into the topics including experience trial, technical preparation steps, functional conversation and cut over, integrate and extend, onboard and deploy, operate monitor, support, experience trial, fit to standard analysis, scope and configure, migrate, integrate, extend, test, onboard and deploy, operate monitor, support. This is a completely customizable PowerPoint theme that can be put to use immediately. So, download it and address the topic impactfully.
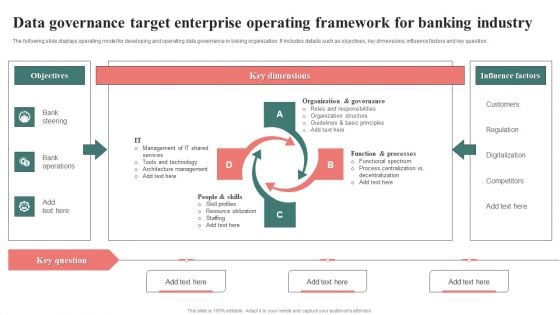
Data Governance Target Enterprise Operating Framework For Banking Industry Designs PDF
The following slide displays operating model for developing and operating data governance in baking organization. It includes details such as objectives, key dimensions, influence factors and key question. Presenting Data Governance Target Enterprise Operating Framework For Banking Industry Designs PDF to dispense important information. This template comprises four stages. It also presents valuable insights into the topics including Objectives, Key Dimensions, Influence Factors. This is a completely customizable PowerPoint theme that can be put to use immediately. So, download it and address the topic impactfully.
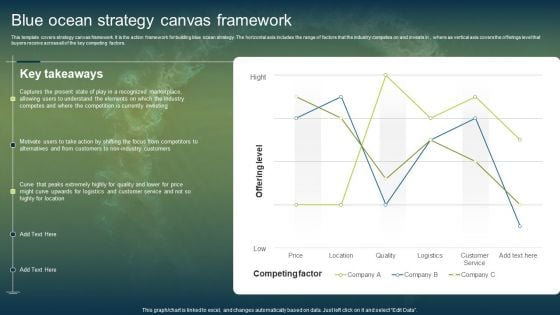
Unconstrained Market Growth Using Blue Ocean Strategies Blue Ocean Strategy Canvas Framework Ideas PDF
This template covers strategy canvas framework. It is the action framework for building blue ocean strategy. The horizontal axis includes the range of factors that the industry competes on and invests in , where as vertical axis covers the offerings level that buyers receive across all of the key competing factors. Formulating a presentation can take up a lot of effort and time, so the content and message should always be the primary focus. The visuals of the PowerPoint can enhance the presenters message, so our Unconstrained Market Growth Using Blue Ocean Strategies Blue Ocean Strategy Canvas Framework Ideas PDF was created to help save time. Instead of worrying about the design, the presenter can concentrate on the message while our designers work on creating the ideal templates for whatever situation is needed. Slidegeeks has experts for everything from amazing designs to valuable content, we have put everything into Unconstrained Market Growth Using Blue Ocean Strategies Blue Ocean Strategy Canvas Framework Ideas PDF

Business Process Diagram Chart 3d Family With Sweet Home PowerPoint Slides
We present our business process diagram chart 3d family with sweet home PowerPoint Slides.Use our Family PowerPoint Templates because Our PowerPoint Templates and Slides will bullet point your ideas. See them fall into place one by one. Present our Symbol PowerPoint Templates because You canTake a leap off the starting blocks with our PowerPoint Templates and Slides. They will put you ahead of the competition in quick time. Use our Shapes PowerPoint Templates because It will Give impetus to the hopes of your colleagues. Our PowerPoint Templates and Slides will aid you in winning their trust. Download our Lifestyle PowerPoint Templates because Our PowerPoint Templates and Slides help you pinpoint your timelines. Highlight the reasons for your deadlines with their use. Use our Curves and Lines PowerPoint Templates because Our PowerPoint Templates and Slides will let you Hit the target. Go the full distance with ease and elan.Use these PowerPoint slides for presentations relating to Boy, Brother, Care, Cartoon, Character, Child, Comfort, Concept, Dad, Digital, Enjoying, Family, Father, Female, Figure, Fun, Graphic, Green, Group, Guy, Happiness, Happy, Home, House, Household, Human, Kid, Life, Lifestyle, Love, Male, Man, Mom, Mother, Mum, Parent, People, Person, Rendered, Safety, Son, Sweet, Symbol, Together, Togetherness, Union, White, Woman, Young. The prominent colors used in the PowerPoint template are Green, Gray, Red. The feedback we get is that our business process diagram chart 3d family with sweet home PowerPoint Slides look good visually. Customers tell us our Dad PowerPoint templates and PPT Slides will help you be quick off the draw. Just enter your specific text and see your points hit home. The feedback we get is that our business process diagram chart 3d family with sweet home PowerPoint Slides are designed by professionals Professionals tell us our Dad PowerPoint templates and PPT Slides are designed by professionals Presenters tell us our business process diagram chart 3d family with sweet home PowerPoint Slides are topically designed to provide an attractive backdrop to any subject. You can be sure our Character PowerPoint templates and PPT Slides will make you look like a winner. Scale mountains with our Business Process Diagram Chart 3d Family With Sweet Home PowerPoint Slides. You will come out on top.
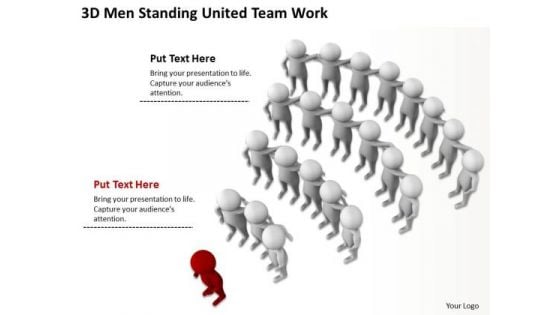
Business Process Diagram Chart 3d Men Standing United Team Work PowerPoint Templates
We present our business process diagram chart 3d men standing united team work PowerPoint templates.Download and present our Leadership PowerPoint Templates because It will Raise the bar of your Thoughts. They are programmed to take you to the next level. Download our Business PowerPoint Templates because You should Bet on your luck with our PowerPoint Templates and Slides. Be assured that you will hit the jackpot. Download and present our Shapes PowerPoint Templates because It will Give impetus to the hopes of your colleagues. Our PowerPoint Templates and Slides will aid you in winning their trust. Download and present our Success PowerPoint Templates because Our PowerPoint Templates and Slides will generate and maintain the level of interest you desire. They will create the impression you want to imprint on your audience. Download our People PowerPoint Templates because Our PowerPoint Templates and Slides offer you the widest possible range of options.Use these PowerPoint slides for presentations relating to 3d, Abstract, Accept, Achieve, Achievement, Agree, Approve, Attitude, Boss, Business, Cartoon, Character, Colleague, Cooperation, Design, Determination, Determined, Different, Employed, Goal, Gold, Grey, Group, Human, Illustration, Men, Ok, People, Position, Positive, Red, Standing, Success, Team, Teamwork, Together, Union, United, White, Work, Workforce, Yes. The prominent colors used in the PowerPoint template are Red, Gray, White. The feedback we get is that our business process diagram chart 3d men standing united team work PowerPoint templates are aesthetically designed to attract attention. We guarantee that they will grab all the eyeballs you need. Customers tell us our Accept PowerPoint templates and PPT Slides are designed by professionals The feedback we get is that our business process diagram chart 3d men standing united team work PowerPoint templates will help them to explain complicated concepts. Professionals tell us our Attitude PowerPoint templates and PPT Slides will get their audience's attention. Presenters tell us our business process diagram chart 3d men standing united team work PowerPoint templates have awesome images to get your point across. You can be sure our Achieve PowerPoint templates and PPT Slides are visually appealing. Exceed expectations with our Business Process Diagram Chart 3d Men Standing United Team Work PowerPoint Templates. You will come out on top.
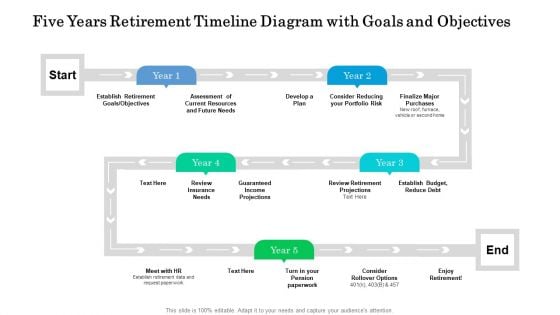
Five Years Retirement Timeline Diagram With Goals And Objectives Diagrams
Introducing our five years retirement timeline diagram with goals and objectives diagrams. This PPT presentation is Google Slides compatible, therefore, you can share it easily with the collaborators for measuring the progress. Also, the presentation is available in both standard screen and widescreen aspect ratios. So edit the template design by modifying the font size, font type, color, and shapes as per your requirements. As this PPT design is fully editable it can be presented in PDF, JPG and PNG formats.
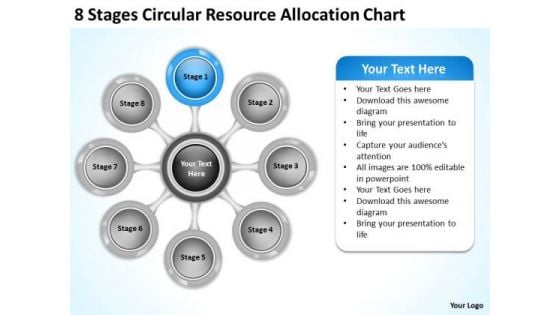
Business Strategy Implementation Resource Allocation Chart Internet
We present our business strategy implementation resource allocation chart internet.Use our Marketing PowerPoint Templates because You will get more than you ever bargained for. Use our Business PowerPoint Templates because Our PowerPoint Templates and Slides will let your words and thoughts hit bullseye everytime. Use our Circle Charts PowerPoint Templates because They will Put the wind in your sails. Skim smoothly over the choppy waters of the market. Download and present our Arrows PowerPoint Templates because Our PowerPoint Templates and Slides will bullet point your ideas. See them fall into place one by one. Present our Process and Flows PowerPoint Templates because Our PowerPoint Templates and Slides will definately Enhance the stature of your presentation. Adorn the beauty of your thoughts with their colourful backgrounds.Use these PowerPoint slides for presentations relating to 3d, Action, Analysis, Attitude, Brainstorming, Business, Chart, Classroom, Concept, Conceptual, Conference, Connection, Corporate, Design, Diagram, Direction, Element, Employee, Enhance, Financial, Formula, Future, Goal, Graphic, Guidelines, Idea, Link, Management, Market, Marketing, Mind, Mind Map, Organization, Organize, Plan, Process, Product, Relation, Render, Solutions, Strategy, Success, Successful, Tactic, Target, Text, Training, Unity. The prominent colors used in the PowerPoint template are Tan, Gray, Black. Color your presentation with success with our Business Strategy Implementation Resource Allocation Chart Internet. You will come out on top.


 Continue with Email

 Home
Home


