Architecture Icons
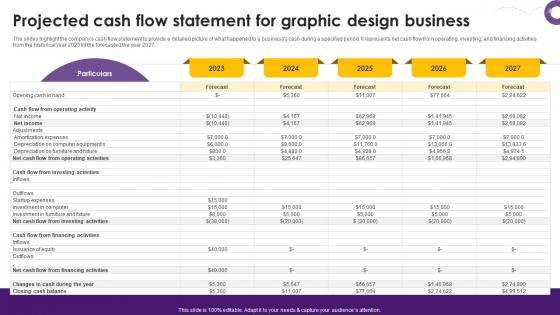
Creative Agency Business Plan Projected Cash Flow Statement For Graphic Design Business BP SS V
The slides highlight the companys cash flow statement to provide a detailed picture of what happened to a business cash during a specified period. It represents net cash flow from operating, investing, and financing activities from the historical year 2023 till the forecasted the year 2027. Slidegeeks has constructed Creative Agency Business Plan Projected Cash Flow Statement For Graphic Design Business BP SS V after conducting extensive research and examination. These presentation templates are constantly being generated and modified based on user preferences and critiques from editors. Here, you will find the most attractive templates for a range of purposes while taking into account ratings and remarks from users regarding the content. This is an excellent jumping-off point to explore our content and will give new users an insight into our top-notch PowerPoint Templates. The slides highlight the companys cash flow statement to provide a detailed picture of what happened to a business cash during a specified period. It represents net cash flow from operating, investing, and financing activities from the historical year 2023 till the forecasted the year 2027.
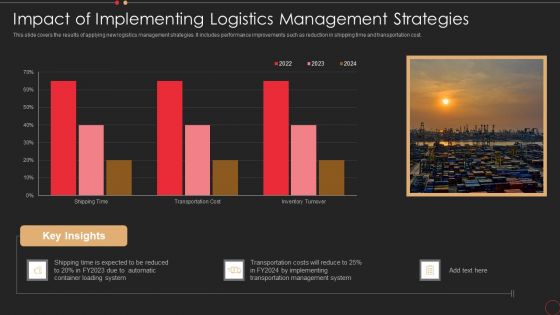
Impact Of Implementing Logistics Management Strategies Diagrams PDF
This slide covers the results of applying new logistics management strategies. It includes performance improvements such as reduction in shipping time and transportation cost. Showcasing this set of slides titled impact of implementing logistics management strategies diagrams pdf. The topics addressed in these templates are implementing, system, management. All the content presented in this PPT design is completely editable. Download it and make adjustments in color, background, font etc. as per your unique business setting.
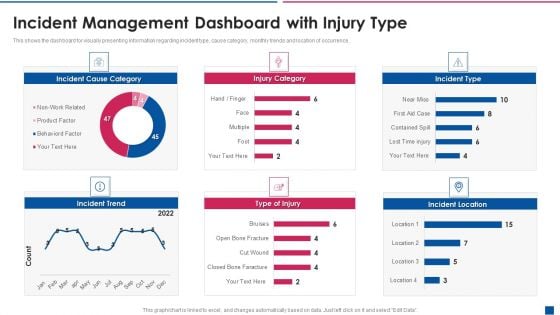
Incident Management Dashboard With Injury Type Diagrams PDF
This shows the dashboard for visually presenting information regarding incident type, cause category, monthly trends and location of occurrence. Showcasing this set of slides titled incident management dashboard with injury type diagrams pdf. The topics addressed in these templates are incident management dashboard with injury type. All the content presented in this PPT design is completely editable. Download it and make adjustments in color, background, font etc. as per your unique business setting.
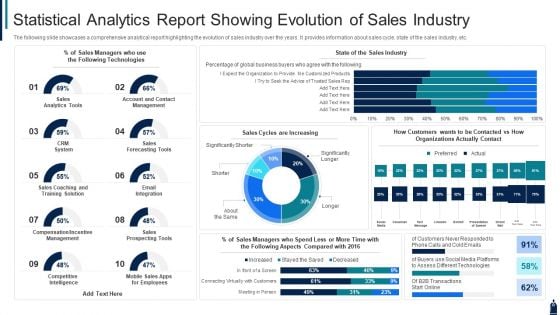
Statistical Analytics Report Showing Evolution Of Sales Industry Diagrams PDF
The following slide showcases a comprehensive analytical report highlighting the evolution of sales industry over the years. It provides information about sales cycle, state of the sales industry, etc. Showcasing this set of slides titled statistical analytics report showing evolution of sales industry diagrams pdf. The topics addressed in these templates are sales, technologies, system. All the content presented in this PPT design is completely editable. Download it and make adjustments in color, background, font etc. as per your unique business setting.
Professional Scrum Master Software Development Progress Tracking Dashboard Diagrams PDF
This slide portrays software development project management dashboard with KPIs namely status of planning, design, development, testing project launch date, project budget, overdue tasks, workload and upcoming deadlines. Deliver an awe inspiring pitch with this creative Professional Scrum Master Software Development Progress Tracking Dashboard Diagrams PDF bundle. Topics like Project Budget, Overdue Tasks, Upcoming Deadlines, Workload, Projected Launch Date, Planning can be discussed with this completely editable template. It is available for immediate download depending on the needs and requirements of the user.
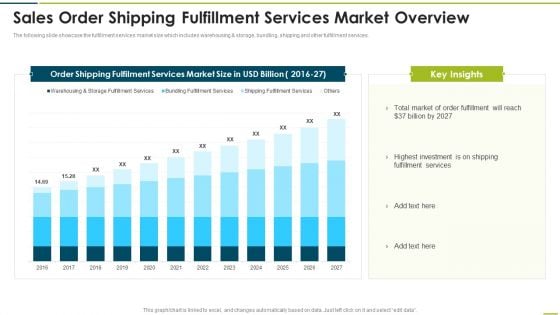
Sales Order Shipping Fulfillment Services Market Overview Diagrams PDF
The following slide showcase the fulfillment services market size which includes warehousing and storage, bundling, shipping and other fulfillment services.Pitch your topic with ease and precision using this Sales Order Shipping Fulfillment Services Market Overview Diagrams PDF This layout presents information on Order Shipping, Highest Investment, Fulfilment Services It is also available for immediate download and adjustment. So, changes can be made in the color, design, graphics or any other component to create a unique layout.
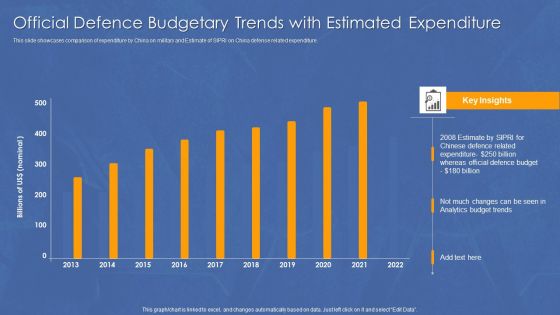
Official Defence Budgetary Trends With Estimated Expenditure Diagrams PDF
This slide showcases comparison of expenditure by China on military and Estimate of SIPRI on China defense related expenditure.Pitch your topic with ease and precision using this Official Defence Budgetary Trends With Estimated Expenditure Diagrams PDF. This layout presents information on Defence Related, Defence Budget, Expenditure. It is also available for immediate download and adjustment. So, changes can be made in the color, design, graphics or any other component to create a unique layout.

Commercial Marketing KPI With Return On Investment Diagrams PDF
This slide templates covers about trade marketing key performing indicators with website visitors, leads by channel, social media reach with yearly goal achievement.Pitch your topic with ease and precision using this Commercial Marketing KPI With Return On Investment Diagrams PDF. This layout presents information on Marketing Spend, Return Investment, Budget Remaining. It is also available for immediate download and adjustment. So, changes can be made in the color, design, graphics or any other component to create a unique layout.
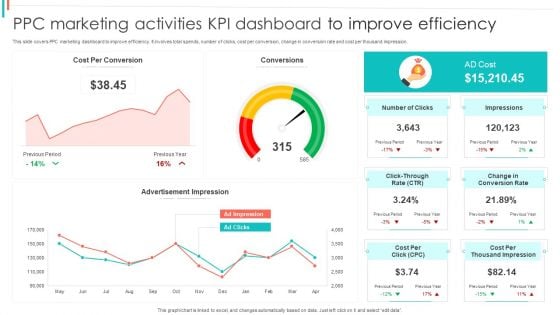
PPC Marketing Activities KPI Dashboard To Improve Efficiency Diagrams PDF
This slide covers PPC marketing dashboard to improve efficiency. It involves total spends, number of clicks, cost per conversion, change in conversion rate and cost per thousand impression.Showcasing this set of slides titled PPC Marketing Activities KPI Dashboard To Improve Efficiency Diagrams PDF. The topics addressed in these templates are Per Conversion, Advertisement Impression, Impressions. All the content presented in this PPT design is completely editable. Download it and make adjustments in color, background, font etc. as per your unique business setting.
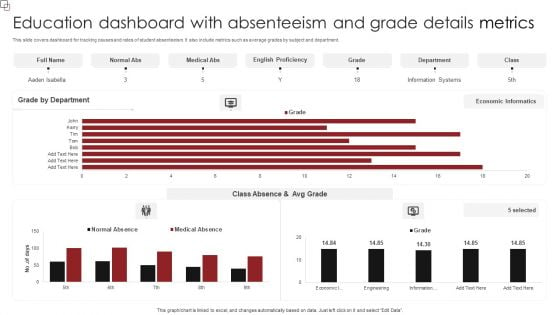
Education Dashboard With Absenteeism And Grade Details Metrics Diagrams PDF
This slide covers dashboard for tracking causes and rates of student absenteeism. It also include metrics such as average grades by subject and department. Pitch your topic with ease and precision using this Education Dashboard With Absenteeism And Grade Details Metrics Diagrams PDF. This layout presents information on Grade Department, English Proficiency, Medical Abs. It is also available for immediate download and adjustment. So, changes can be made in the color, design, graphics or any other component to create a unique layout.

Project Management Report Dashboard Exhibiting Task Progress Diagrams PDF
This slide showcase report dashboard of project management representing task progress status. It covers project name, status, tasks, priority, budget and pending items for the project. Showcasing this set of slides titled Project Management Report Dashboard Exhibiting Task Progress Diagrams PDF. The topics addressed in these templates are Company Website Development, Tasks Status, Budget. All the content presented in this PPT design is completely editable. Download it and make adjustments in color, background, font etc. as per your unique business setting.
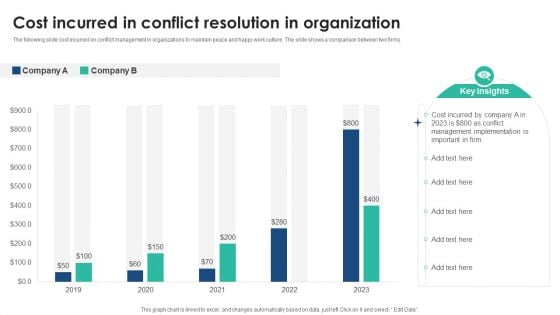
Cost Incurred In Conflict Resolution In Organization Diagrams PDF
The following slide cost incurred on conflict management in organizations to maintain peace and happy work culture. The slide shows a comparison between two firms. Showcasing this set of slides titled Cost Incurred In Conflict Resolution In Organization Diagrams PDF. The topics addressed in these templates are Cost Incurred, Conflict Resolution, Organization. All the content presented in this PPT design is completely editable. Download it and make adjustments in color, background, font etc. as per your unique business setting.
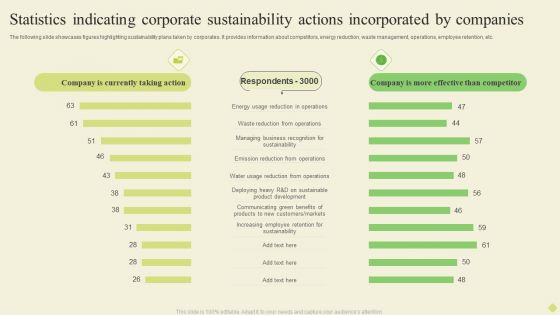
Statistics Indicating Corporate Sustainability Actions Incorporated By Companies Diagrams PDF
The following slide showcases figures highlighting sustainability plans taken by corporates. It provides information about competitors, energy reduction, waste management, operations, employee retention, etc.Pitch your topic with ease and precision using this Statistics Indicating Corporate Sustainability Actions Incorporated By Companies Diagrams PDF. This layout presents information on Energy Reduction, Emission Reduction, Increasing Employee. It is also available for immediate download and adjustment. So, changes can be made in the color, design, graphics or any other component to create a unique layout.
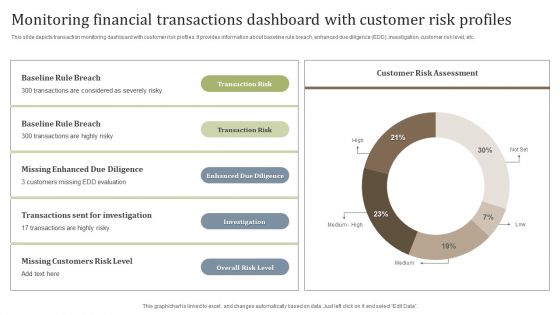
Monitoring Financial Transactions Dashboard With Customer Risk Profiles Diagrams PDF
This slide depicts transaction monitoring dashboard with customer risk profiles. It provides information about baseline rule breach, enhanced due diligence EDD, investigation, customer risk level, etc. Showcasing this set of slides titled Monitoring Financial Transactions Dashboard With Customer Risk Profiles Diagrams PDF. The topics addressed in these templates are Overall Risk Level, Investigation, Enhanced Due Diligence. All the content presented in this PPT design is completely editable. Download it and make adjustments in color, background, font etc. as per your unique business setting.

Project Risk KPI Dashboard With Impact Assessment Diagrams PDF
This slide depicts project risk impact assessment dashboard. It provides information about residual, inherent, enterprise and project risk assessment by status, etc. Showcasing this set of slides titled Project Risk KPI Dashboard With Impact Assessment Diagrams PDF. The topics addressed in these templates are Inherent Risk, Impact Of Risks On Project. All the content presented in this PPT design is completely editable. Download it and make adjustments in color, background, font etc. as per your unique business setting.
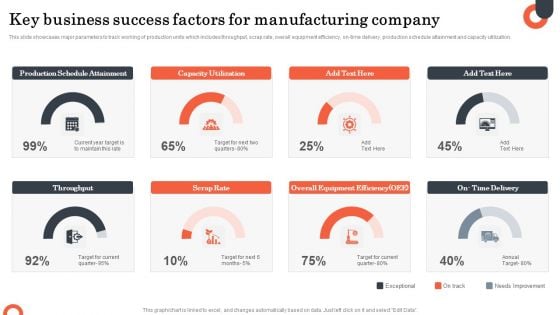
Key Business Success Factors For Manufacturing Company Diagrams PDF
This slide showcases major parameters to track working of production units which includes throughput, scrap rate, overall equipment efficiency, on-time delivery, production schedule attainment and capacity utilization. Showcasing this set of slides titled Key Business Success Factors For Manufacturing Company Diagrams PDF. The topics addressed in these templates are Production Schedule Attainment, Capacity Utilization, Scrap Rate. All the content presented in this PPT design is completely editable. Download it and make adjustments in color, background, font etc. as per your unique business setting.
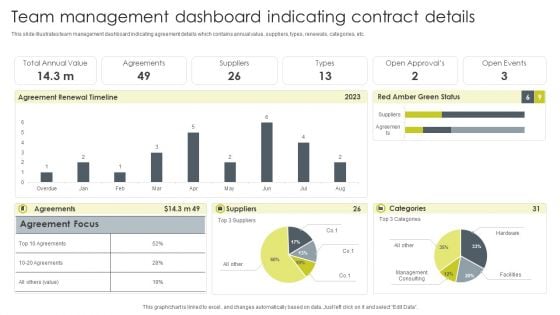
Team Management Dashboard Indicating Contract Details Diagrams PDF
This slide illustrates team management dashboard indicating agreement details which contains annual value, suppliers, types, renewals, categories, etc. Showcasing this set of slides titled Team Management Dashboard Indicating Contract Details Diagrams PDF. The topics addressed in these templates are Suppliers, Agreements, Total Annual Value. All the content presented in this PPT design is completely editable. Download it and make adjustments in color, background, font etc. as per your unique business setting.
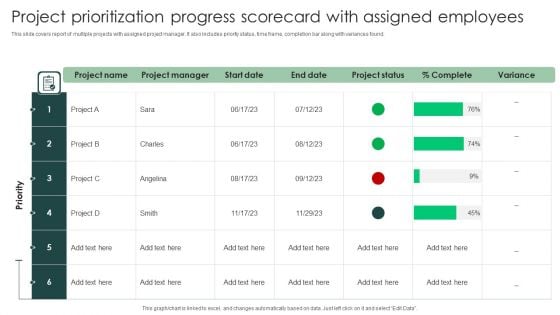
Project Prioritization Progress Scorecard With Assigned Employees Diagrams PDF
This slide covers report of multiple projects with assigned project manager. It also includes priority status, time frame, completion bar along with variances found. Pitch your topic with ease and precision using this Project Prioritization Progress Scorecard With Assigned Employees Diagrams PDF. This layout presents information on Project Prioritization, Progress Scorecard, Assigned Employees. It is also available for immediate download and adjustment. So, changes can be made in the color, design, graphics or any other component to create a unique layout.
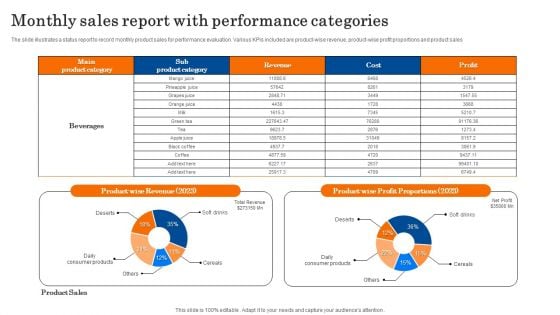
Monthly Sales Report With Performance Categories Diagrams PDF
The slide illustrates a status report to record monthly product sales for performance evaluation. Various KPIs included are product wise revenue, product-wise profit proportions and product sales. Showcasing this set of slides titled Monthly Sales Report With Performance Categories Diagrams PDF. The topics addressed in these templates are Revenue, Profit Proportions, Product Sales. All the content presented in this PPT design is completely editable. Download it and make adjustments in color, background, font etc. as per your unique business setting.
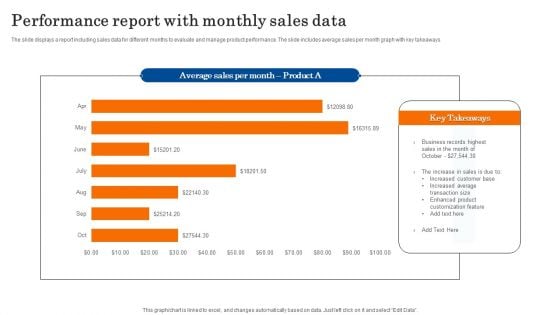
Performance Report With Monthly Sales Data Diagrams PDF
The slide displays a report including sales data for different months to evaluate and manage product performance. The slide includes average sales per month graph with key takeaways. Showcasing this set of slides titled Performance Report With Monthly Sales Data Diagrams PDF. The topics addressed in these templates are Business, Sales, Customization. All the content presented in this PPT design is completely editable. Download it and make adjustments in color, background, font etc. as per your unique business setting.
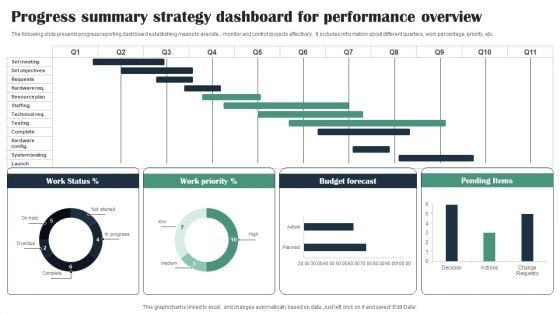
Progress Summary Strategy Dashboard For Performance Overview Diagrams PDF
The following slide presents progress reporting dashboard establishing means to execute , monitor and control projects effectively. It includes information about different quarters, work percentage, priority, etc. Showcasing this set of slides titled Progress Summary Strategy Dashboard For Performance Overview Diagrams PDF. The topics addressed in these templates are Work Status, Work Priority, Budget Forecast. All the content presented in this PPT design is completely editable. Download it and make adjustments in color, background, font etc. as per your unique business setting.
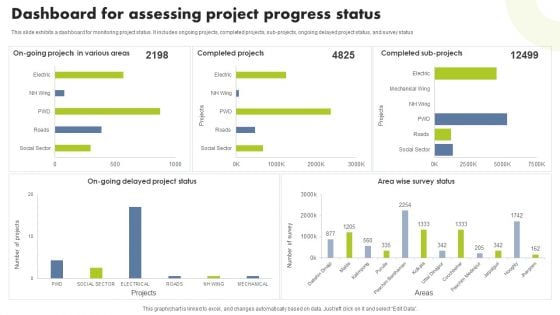
Dashboard For Assessing Project Progress Status Diagrams PDF
This slide exhibits a dashboard for monitoring project status. It includes ongoing projects, completed projects, sub-projects, ongoing delayed project status, and survey status. Showcasing this set of slides titled Dashboard For Assessing Project Progress Status Diagrams PDF. The topics addressed in these templates are Completed Projects, Completed Sub Projects, Area Wise Survey. All the content presented in this PPT design is completely editable. Download it and make adjustments in color, background, font etc. as per your unique business setting.
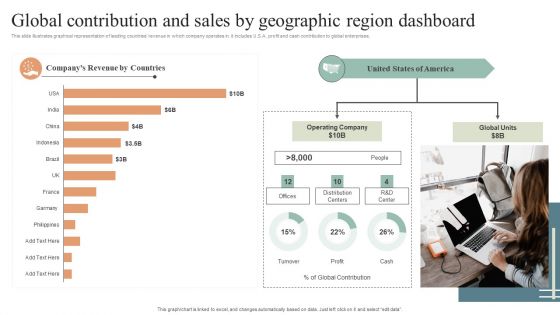
Global Contribution And Sales By Geographic Region Dashboard Diagrams PDF
This slide illustrates graphical representation of leading countries revenue in which company operates in. it includes U.S.A. profit and cash contribution to global enterprises. Pitch your topic with ease and precision using this Global Contribution And Sales By Geographic Region Dashboard Diagrams PDF. This layout presents information on Global Contribution, Sales By Geographic, Region Dashboard. It is also available for immediate download and adjustment. So, changes can be made in the color, design, graphics or any other component to create a unique layout.
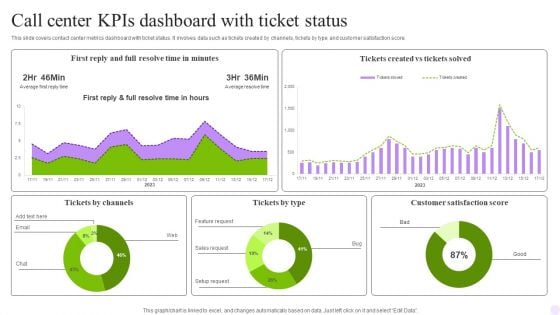
Call Center Kpis Dashboard With Ticket Status Diagrams PDF
This slide covers contact center metrics dashboard with ticket status. It involves data such as tickets created by channels, tickets by type and customer satisfaction score. Showcasing this set of slides titled Call Center Kpis Dashboard With Ticket Status Diagrams PDF. The topics addressed in these templates are Status, Minutes, Call. All the content presented in this PPT design is completely editable. Download it and make adjustments in color, background, font etc. as per your unique business setting.
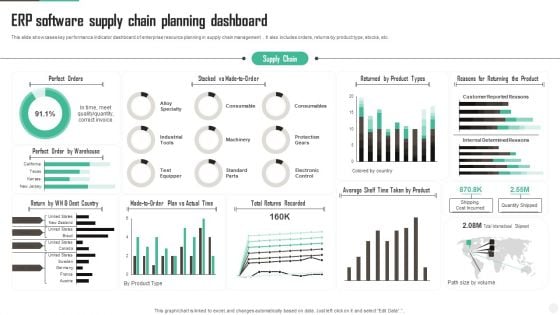
ERP Software Supply Chain Planning Dashboard Diagrams PDF
This slide showcases key performance indicator dashboard of enterprise resource planning in supply chain management . It also includes orders, returns by product type, stocks, etc. Showcasing this set of slides titled ERP Software Supply Chain Planning Dashboard Diagrams PDF Sample. The topics addressed in these templates are Perfect Orders, Dest Country, Actual Time. All the content presented in this PPT design is completely editable. Download it and make adjustments in color, background, font etc. as per your unique business setting.
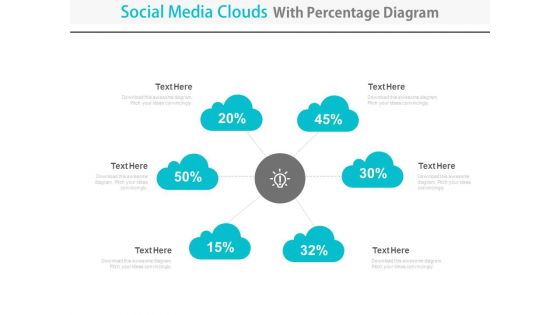
Cloud Network Diagram With Percentage Data Powerpoint Slides
This PowerPoint template contains graphics of cloud network diagram with percentage values. You may download this PPT slide design to display cloud network and financial strategy. You can easily customize this template to make it more unique as per your need.
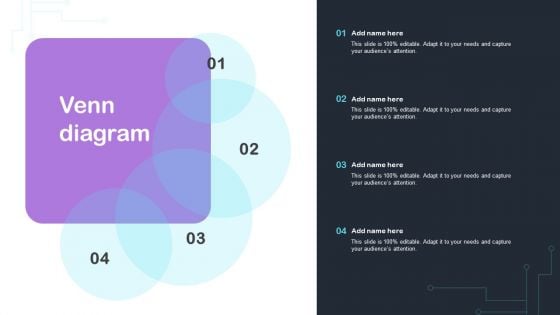
Cyber Risks And Incident Response Playbook Venn Diagram Demonstration PDF
Find a pre-designed and impeccable Cyber Risks And Incident Response Playbook Venn Diagram Demonstration PDF. The templates can ace your presentation without additional effort. You can download these easy-to-edit presentation templates to make your presentation stand out from others. So, what are you waiting for. Download the template from Slidegeeks today and give a unique touch to your presentation.
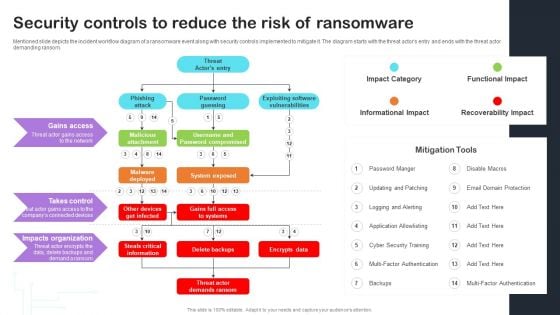
Cyber Risks And Incident Response Playbook Security Controls To Reduce The Risk Of Ransomware Themes PDF
Mentioned slide depicts the incident workflow diagram of a ransomware event along with security controls implemented to mitigate it. The diagram starts with the threat actors entry and ends with the threat actor demanding ransom. Take your projects to the next level with our ultimate collection of Cyber Risks And Incident Response Playbook Security Controls To Reduce The Risk Of Ransomware Themes PDF. Slidegeeks has designed a range of layouts that are perfect for representing task or activity duration, keeping track of all your deadlines at a glance. Tailor these designs to your exact needs and give them a truly corporate look with your own brand colors theyll make your projects stand out from the rest.
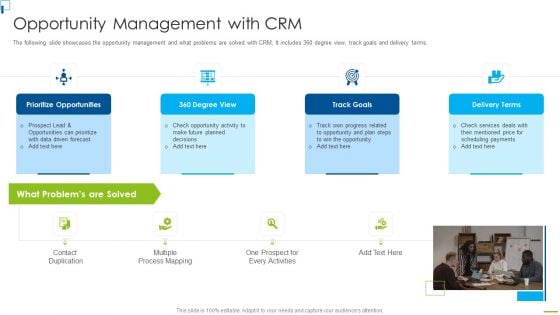
Designing And Deployment Opportunity Management With CRM Diagrams PDF
The following slide showcases the opportunity management and what problems are solved with CRM, It includes 360 degree view, track goals and delivery terms. This is a designing and deployment opportunity management with crm diagrams pdf template with various stages. Focus and dispense information on four stages using this creative set, that comes with editable features. It contains large content boxes to add your information on topics like prioritize opportunities, 360 degree view, track goals, delivery terms, problems. You can also showcase facts, figures, and other relevant content using this PPT layout. Grab it now.
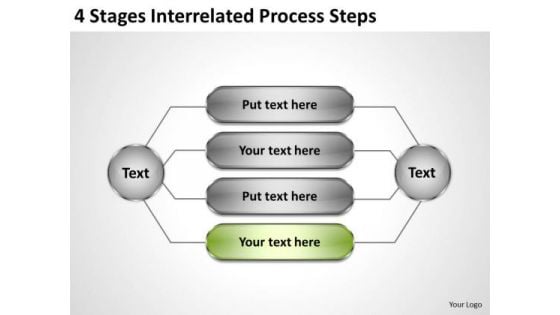
Business Process Flow Diagrams 4 Stages Interrelated Steps PowerPoint Templates
We present our business process flow diagrams 4 stages interrelated steps PowerPoint templates.Download and present our Finance PowerPoint Templates because Our PowerPoint Templates and Slides are conceived by a dedicated team. Use them and give form to your wondrous ideas. Download and present our Advertising PowerPoint Templates because You will get more than you ever bargained for. Download and present our Business PowerPoint Templates because You can Be the star of the show with our PowerPoint Templates and Slides. Rock the stage with your ideas. Present our Marketing PowerPoint Templates because Our PowerPoint Templates and Slides will help you be quick off the draw. Just enter your specific text and see your points hit home. Present our Process and Flows PowerPoint Templates because You can Channelise the thoughts of your team with our PowerPoint Templates and Slides. Urge them to focus on the goals you have set.Use these PowerPoint slides for presentations relating to Administration, business, chain, chart, concept, connection, corporate, data, design, diagram, financial, flow, flowchart, glass, global, glossy, graph, graphical, group, hierarchy, highlight, important, ladder, manager, office, officer, organization, plan, president, process, rectangle, relation, site-builder, site-map, sitemap, steps, structure, supervisor, teamwork, workgroups. The prominent colors used in the PowerPoint template are Green, White, Gray. Plan your victory with our Business Process Flow Diagrams 4 Stages Interrelated Steps PowerPoint Templates. You will come out on top.
Project Tracking Gantt Chart Summary PDF
The following slide showcases the progress status of project tracking activities to achieve deliverables. It constitutes of weekly progress status of each project to assess the pending tasks. Showcasing this set of slides titled Project Tracking Gantt Chart Summary PDF. The topics addressed in these templates are Determine, Project, Review Design. All the content presented in this PPT design is completely editable. Download it and make adjustments in color, background, font etc. as per your unique business setting.
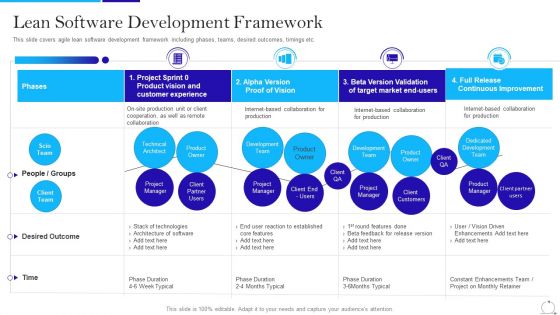
Agile Approach In IT Lean Software Development Framework Ppt Infographic Template Inspiration PDF
This slide covers agile lean software development framework including phases, teams, desired outcomes, timings etc. Deliver and pitch your topic in the best possible manner with this agile approach in it lean software development framework ppt infographic template inspiration pdf. Use them to share invaluable insights on project manager, technical architect, product owner, development team, client customers and impress your audience. This template can be altered and modified as per your expectations. So, grab it now.
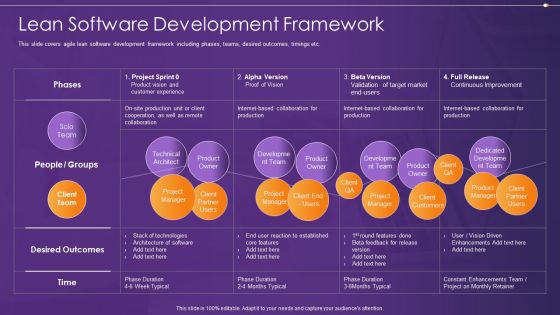
Agile Information Technology Project Administration Lean Software Development Framework Graphics PDF
This slide covers agile lean software development framework including phases, teams, desired outcomes, timings etc. Deliver and pitch your topic in the best possible manner with this agile information technology project administration lean software development framework graphics pdf. Use them to share invaluable insights on technologies, feedback, market, target and impress your audience. This template can be altered and modified as per your expectations. So, grab it now.
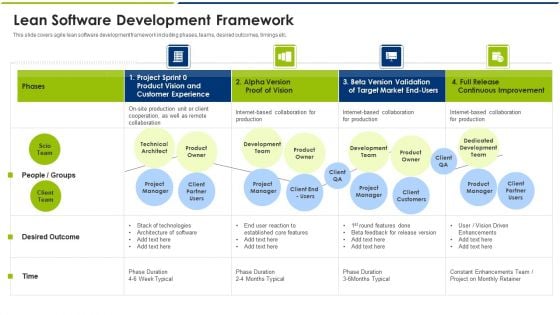
Agile Model Lean Software Development Framework Ppt Infographic Template Guide PDF
This slide covers agile lean software development framework including phases, teams, desired outcomes, timings etc. Deliver an awe inspiring pitch with this creative agile model lean software development framework ppt infographic template guide pdf bundle. Topics like product owner, technologies, team, customers can be discussed with this completely editable template. It is available for immediate download depending on the needs and requirements of the user.
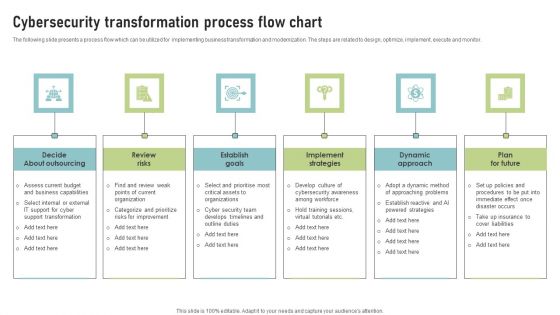
Cybersecurity Transformation Process Flow Chart Structure PDF
The following slide presents a process flow which can be utilized for implementing business transformation and modernization. The steps are related to design, optimize, implement, execute and monitor. Persuade your audience using this Cybersecurity Transformation Process Flow Chart Structure PDF. This PPT design covers Six stages, thus making it a great tool to use. It also caters to a variety of topics including Decide About Outsourcing, Review Risks, Establish Goals. Download this PPT design now to present a convincing pitch that not only emphasizes the topic but also showcases your presentation skills.
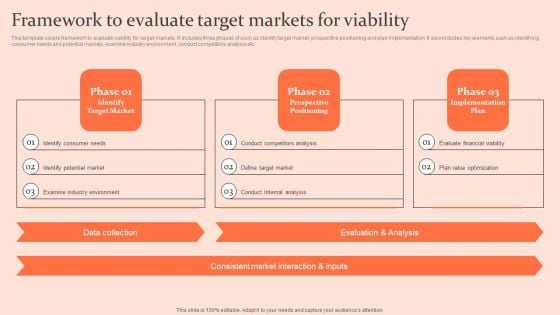
Customised Advertising Strategies Framework To Evaluate Target Markets For Viability Background PDF
This template covers framework to evaluate viability for target markets. It includes three phases of such as identify target market, prospective positioning and plan implementation. It also includes key elements such as identifying consumer needs and potential markets, examine industry environment, conduct competitors analysis etc. Are you searching for a Customised Advertising Strategies Framework To Evaluate Target Markets For Viability Background PDF that is uncluttered, straightforward, and original Its easy to edit, and you can change the colors to suit your personal or business branding. For a presentation that expresses how much effort you have put in, this template is ideal With all of its features, including tables, diagrams, statistics, and lists, its perfect for a business plan presentation. Make your ideas more appealing with these professional slides. Download Customised Advertising Strategies Framework To Evaluate Target Markets For Viability Background PDF from Slidegeeks today.
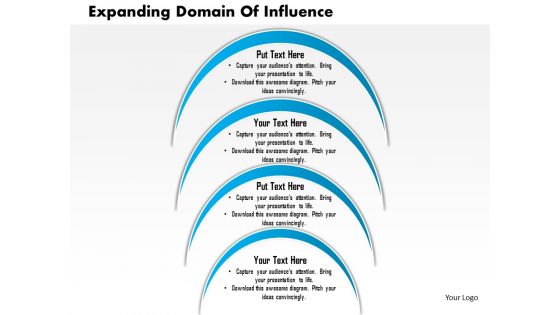
Business Framework Expanding Domain Of Influence PowerPoint Presentation
Presenting this set of slides with name business framework expanding domain of influence powerpoint presentation. This is a four stage process. The stages in this process are process, manager, chart, domain, expanding, influence. This is a completely editable PowerPoint presentation and is available for immediate download. Download now and impress your audience.

Swot Analysis Flower Petal Design Powerpoint Template
This PPT slide has been designed with graphics of flower petals diagram. Download this PowerPoint to depict SWOT analysis. Imprint your concepts with this professional slide in your presentations.?
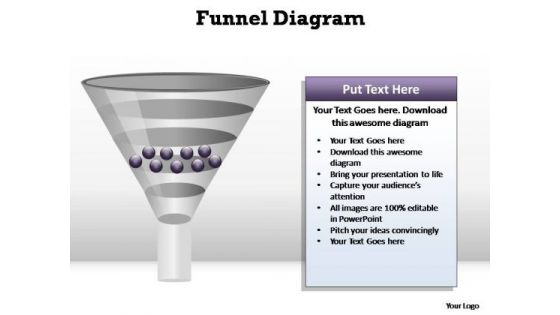
PowerPoint Slides Process Funnel Diagram Ppt Slide Designs
PowerPoint Slides Process Funnel Diagram PPT Slide Designs-These high quality powerpoint pre-designed slides and powerpoint templates have been carefully created by our professional team to help you impress your audience. All slides have been created and are 100% editable in powerpoint. Each and every property of any graphic - color, size, orientation, shading, outline etc. can be modified to help you build an effective powerpoint presentation. Any text can be entered at any point in the powerpoint template or slide. Simply DOWNLOAD, TYPE and PRESENT!-These amazing PowerPoint pre-designed slides and PowerPoint templates have been carefully created by our team of experts to help you impress your audience. Our stunning collection of Powerpoint slides are 100% editable and can easily fit in any PowerPoint presentations. By using these animations and graphics in PowerPoint and you can easily make professional presentations. Any text can be entered at any point in the PowerPoint template or slide. Just DOWNLOAD our awesome PowerPoint templates and you are ready to go. Convert customers with our PowerPoint Slides Process Funnel Diagram Ppt Slide Designs. Download without worries with our money back guaranteee.
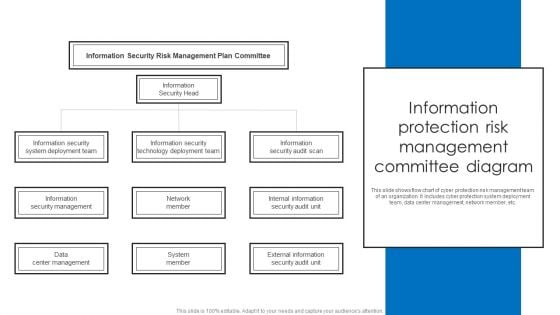
Information Protection Risk Management Committee Diagram Information PDF
This slide shows flow chart of cyber protection risk management team of an organization. It includes cyber protection system deployment team, data center management, network member, etc. Persuade your audience using this Information Protection Risk Management Committee Diagram Information PDF. This PPT design covers four stages, thus making it a great tool to use. It also caters to a variety of topics including Information Security Head, Information Security Audit Scan, Network Member. Download this PPT design now to present a convincing pitch that not only emphasizes the topic but also showcases your presentation skills.
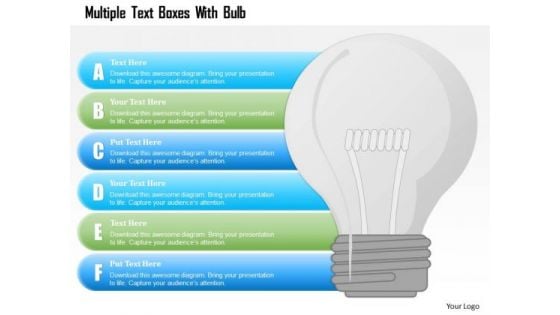
Busines Diagram Multiple Text Boxes With Bulb Presentation Template
This business diagram has been designed with graphic of multiple text boxes and bulb. This slide can be used for data representation and idea generation. Use this slide for your business and technology related presentations.
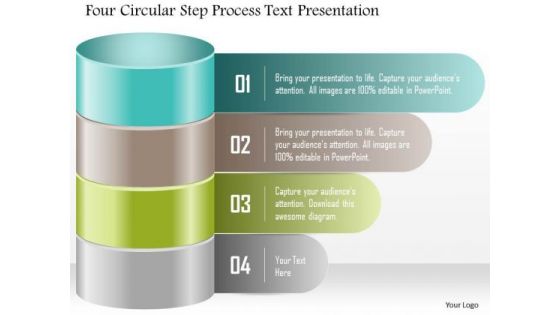
Business Diagram Four Circular Step Process Text Presentation PowerPoint Template
Four circular step process diagram has been used to designed this power point template. This PPT contains the concept of business process flow. Use this PPT for your business and marketing related presentations.
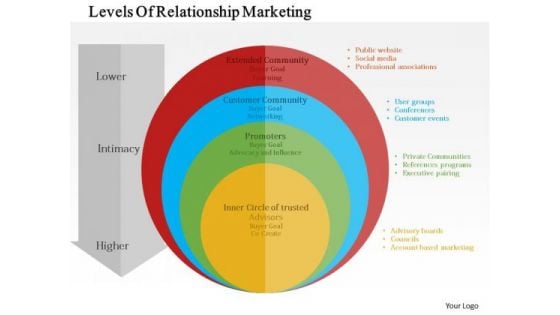
Business Diagram Levels Of Relationship Marketing Presentation Template
This slide has been designed with graphics of concentric circles. This diagram is suitable to present levels of relationship marketing. This professional slide helps in making an instant impact on viewers.

Circle Diagram For Comparison Of Performance Powerpoint Slides
This PowerPoint template has been designed with circle diagram and employees photos. You may download this PPT slide to depict comparison of performance. Add this slide to your presentation and impress your superiors.
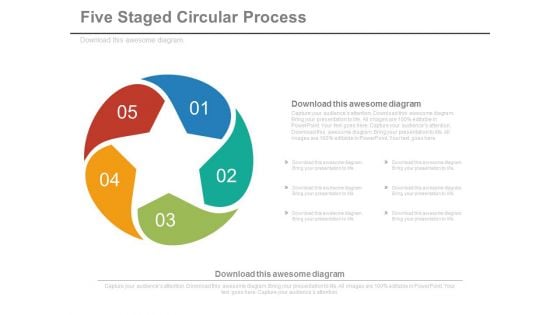
Five Circular Steps Process Flow Diagram Powerpoint Slides
This PowerPoint template has been designed with circular diagram. This PPT slide displays five business steps in circular flow. You may download this PPT slide to display business process and workflow.
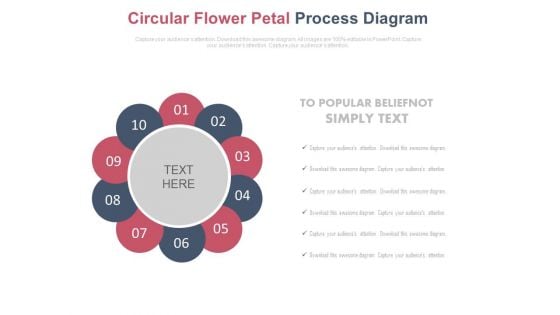
Ten Circular Petals Business Process Diagram Powerpoint Slides
This PowerPoint template has been designed with circular diagram. This PPT slide displays ten business steps in circular flow. You may download this PPT slide to display business process and workflow.
Circular Years Timeline Display 2 PowerPoint Slides And Ppt Diagram Templates
Our Circular Years Timeline Display 2 PowerPoint Slides And Ppt Diagram Templates are designed for authenticity. They do not encourage any farce.
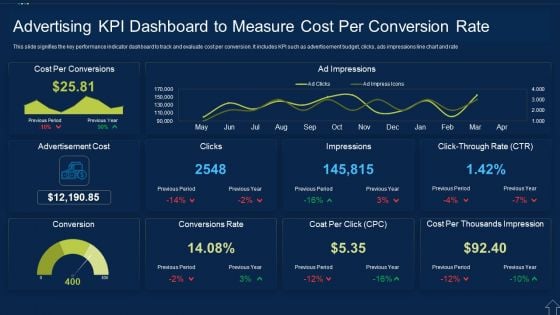
Advertising KPI Dashboard To Measure Cost Per Conversion Rate Themes PDF
This slide signifies the key performance indicator dashboard to track and evaluate cost per conversion. It includes KPI such as advertisement budget, clicks, ads impressions line chart and rate Showcasing this set of slides titled Advertising KPI Dashboard To Measure Cost Per Conversion Rate Themes PDF The topics addressed in these templates are Advertising Kpi Dashboard To Measure Cost Per Conversion Rate All the content presented in this PPT design is completely editable. Download it and make adjustments in color, background, font etc. as per your unique business setting.
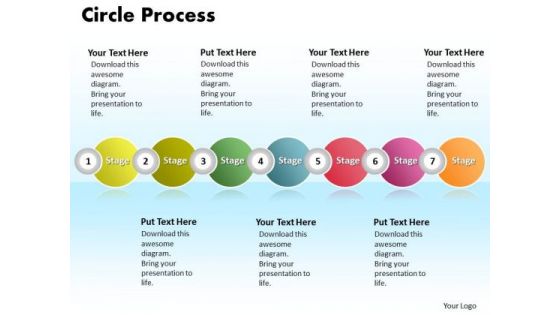
Ppt Half Circle PowerPoint 2010 Process 7 State Diagram Templates
PPT half circle powerpoint 2010 process 7 state diagram Templates-This continual illustration of procedure graphic is a visual representation of your information and ideas-PPT half circle powerpoint 2010 process 7 state diagram Templates-Abstract, Business, Chart, Circle, Company, Corporate, Design, Diagram, Different, Graph, Illustration, Information, Item, Junction, Management, Marketing, Menu, Modern, Network, Options, Parts, Pie, Plan, Presentation, Process, Report, Representational, Segments, Sphere, Statistics, Strategy, Structure, Wheel Our Ppt Half Circle PowerPoint 2010 Process 7 State Diagram Templates are exceptionally adaptive. They will blend in with any scenario.
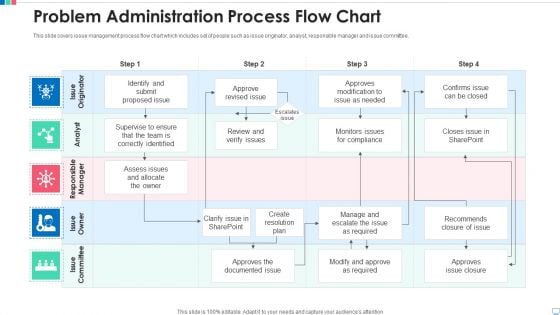
Problem Administration Process Flow Chart Pictures PDF
This slide covers issue management process flow chart which includes set of people such as issue originator, analyst, responsible manager and issue committee. Pitch your topic with ease and precision using this problem administration process flow chart pictures pdf. This layout presents information on problem administration process flow chart. It is also available for immediate download and adjustment. So, changes can be made in the color, design, graphics or any other component to create a unique layout.
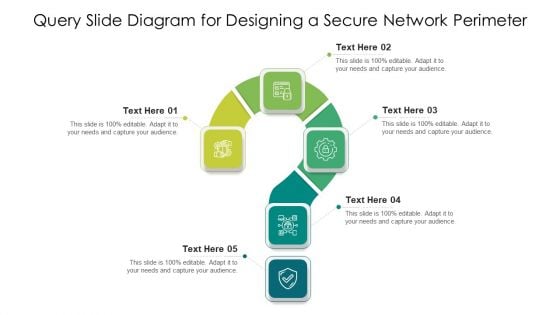
Query Slide Diagram For Designing A Secure Network Perimeter Diagrams PDF
Showcasing this set of slides titled query slide diagram for designing a secure network perimeter diagrams pdf. The topics addressed in these templates are query slide diagram for designing a secure network perimeter. All the content presented in this PPT design is completely editable. Download it and make adjustments in color, background, font etc. as per your unique business setting.
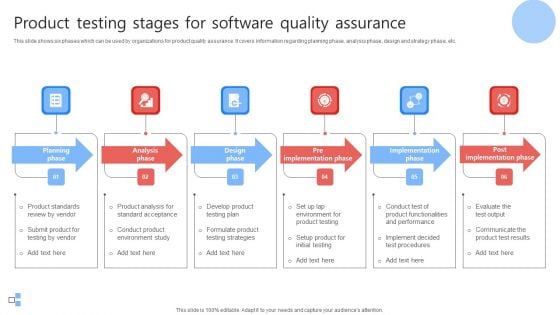
Product Testing Stages For Software Quality Assurance Rules PDF
This slide shows six phases which can be used by organizations for product quality assurance. It covers information regarding planning phase, analysis phase, design and strategy phase, etc. Presenting Product Testing Stages For Software Quality Assurance Rules PDF to dispense important information. This template comprises six stages. It also presents valuable insights into the topics including Planning Phase, Analysis Phase, Design Phase. This is a completely customizable PowerPoint theme that can be put to use immediately. So, download it and address the topic impactfully.
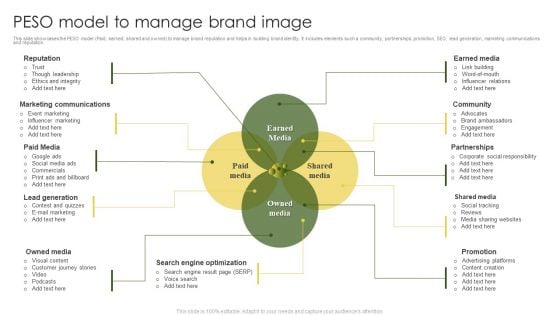
PESO Model To Manage Brand Image Diagrams PDF
This slide showcases the PESO model Paid, earned, shared and owned to manage brand reputation and helps in building brand identity. It includes elements such a community, partnerships, promotion, SEO, lead generation, marketing communications and reputation. Persuade your audience using this PESO Model To Manage Brand Image Diagrams PDF. This PPT design covers Four stages, thus making it a great tool to use. It also caters to a variety of topics including Marketing Communications, Lead Generation, Owned Media. Download this PPT design now to present a convincing pitch that not only emphasizes the topic but also showcases your presentation skills.
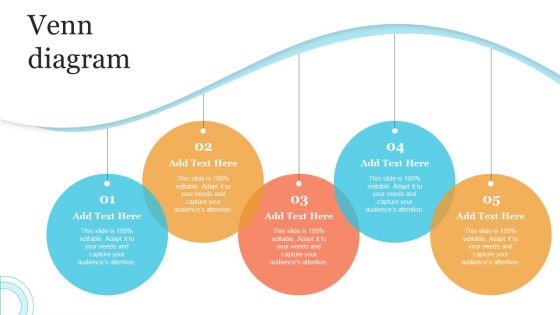
Corporate Product And Overall Venn Diagram Ppt Styles Slides PDF
Coming up with a presentation necessitates that the majority of the effort goes into the content and the message you intend to convey. The visuals of a PowerPoint presentation can only be effective if it supplements and supports the story that is being told. Keeping this in mind our experts created Corporate Product And Overall Venn Diagram Ppt Styles Slides PDF to reduce the time that goes into designing the presentation. This way, you can concentrate on the message while our designers take care of providing you with the right template for the situation.
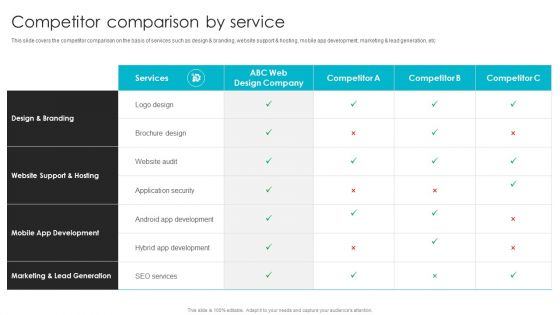
Web Design Company Overview Competitor Comparison By Service Diagrams PDF
This slide covers the competitor comparison on the basis of services such as design and branding, website support and hosting, mobile app development, marketing and lead generation, etc. Are you in need of a template that can accommodate all of your creative concepts This one is crafted professionally and can be altered to fit any style. Use it with Google Slides or PowerPoint. Include striking photographs, symbols, depictions, and other visuals. Fill, move around, or remove text boxes as desired. Test out color palettes and font mixtures. Edit and save your work, or work with colleagues. Download Web Design Company Overview Competitor Comparison By Service Diagrams PDF and observe how to make your presentation outstanding. Give an impeccable presentation to your group and make your presentation unforgettable.
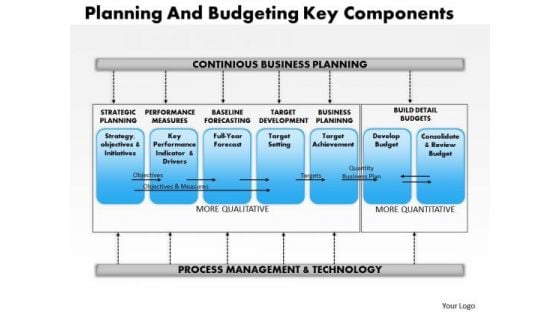
Business Framework Planning And Budgeting Key Component PowerPoint Presentation
This business framework image slide displays planning and budgeting key components diagram. Use this image slide to depict business planning and management in your presentations. Create wonderful presentations using this image slide.
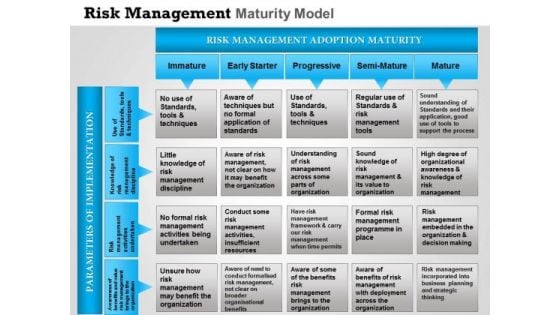
Business Framework Risk Management Maturity Model PowerPoint Presentation
The above slide has framework of risk management maturity model. Use this diagram for giving a clear message in a structured manner. This template helps you to grab the attention of your listener.

Business Framework Strategic Management Process Nf PowerPoint Presentation
Display strategic management process with understand strategy and performance. This diagram template contains the linear process flow. Use this business framework in your presentation and build creative presentation for viewers.
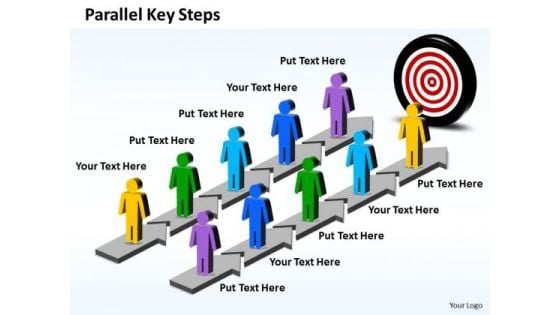
Business Charts PowerPoint Templates Parallel Key Steps Plan
Business Charts PowerPoint templates parallel key steps plan-This Business PowerPoint Diagram Shows the Parallel steps which consists of five stages to achieve the goal. Use this graphic design to represent a continuing sequence of stages, tasks, or events and emphasize the connection between all components.-Business Charts PowerPoint templates parallel key steps plan Get rid of banality with our Business Charts PowerPoint Templates Parallel Key Steps Plan. Take any boredom out of the equation.
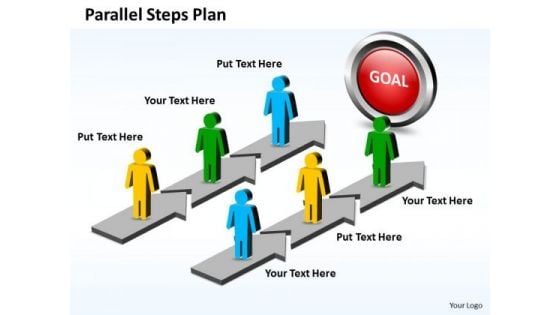
Business Charts PowerPoint Templates Parallel Steps Plan For Planning
Business Charts PowerPoint templates parallel steps plan for planning-This Business PowerPoint Diagram Shows the Parallel steps which individually consists of four stages to achieve the goal. Use this graphic design to represent a continuing sequence of stages, tasks, or events and emphasize the connection between all components.-Business Charts PowerPoint templates parallel steps plan for planning Have some fun with our Business Charts PowerPoint Templates Parallel Steps Plan For Planning. They make creating ideas enjoyable.


 Continue with Email

 Home
Home


