Architecture Icons
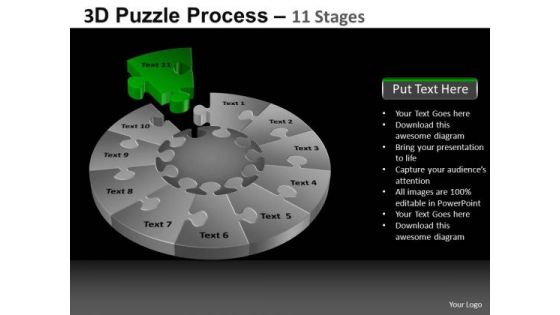
PowerPoint Slidelayout Leadership Pie Chart Puzzle Process Ppt Process
PowerPoint Slidelayout Leadership Pie chart Puzzle Process PPT Process-These high quality powerpoint pre-designed slides and powerpoint templates have been carefully created by our professional team to help you impress your audience. All slides have been created and are 100% editable in powerpoint. Each and every property of any graphic - color, size, orientation, shading, outline etc. can be modified to help you build an effective powerpoint presentation. Any text can be entered at any point in the powerpoint template or slide. Simply DOWNLOAD, TYPE and PRESENT! Coach your organization with our PowerPoint Slidelayout Leadership Pie Chart Puzzle Process Ppt Process. You will come out on top.
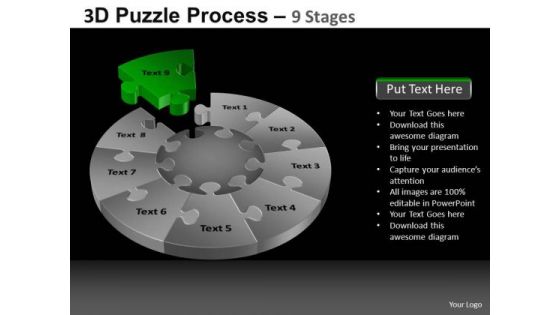
PowerPoint Slides Growth Pie Chart Puzzle Process Ppt Process
PowerPoint Slides Growth Pie chart Puzzle Process PPT Process-These high quality powerpoint pre-designed slides and powerpoint templates have been carefully created by our professional team to help you impress your audience. All slides have been created and are 100% editable in powerpoint. Each and every property of any graphic - color, size, orientation, shading, outline etc. can be modified to help you build an effective powerpoint presentation. Any text can be entered at any point in the powerpoint template or slide. Simply DOWNLOAD, TYPE and PRESENT! Figure on our PowerPoint Slides Growth Pie Chart Puzzle Process Ppt Process for their expertise. They will prove their fibre again and again.
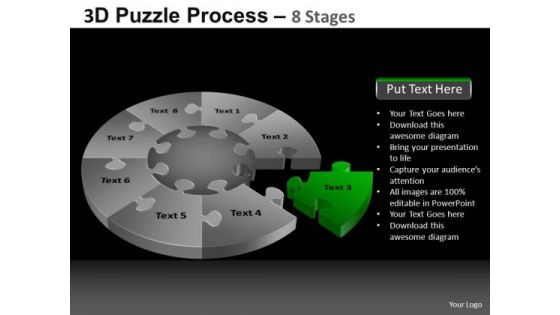
PowerPoint Slides Growth Pie Chart Puzzle Process Ppt Slidelayout
PowerPoint Slides Growth Pie chart Puzzle Process PPT Slidelayout-These high quality powerpoint pre-designed slides and powerpoint templates have been carefully created by our professional team to help you impress your audience. All slides have been created and are 100% editable in powerpoint. Each and every property of any graphic - color, size, orientation, shading, outline etc. can be modified to help you build an effective powerpoint presentation. Any text can be entered at any point in the powerpoint template or slide. Simply DOWNLOAD, TYPE and PRESENT! Don't let criticism concern you. Fend off all blows with our PowerPoint Slides Growth Pie Chart Puzzle Process Ppt Slidelayout.
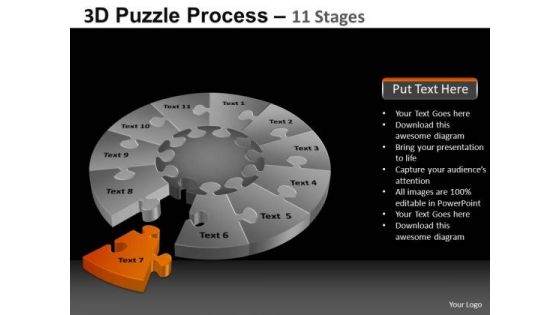
PowerPoint Slides Image Pie Chart Puzzle Process Ppt Layouts
PowerPoint Slides Image Pie chart Puzzle Process PPT Layouts-These high quality powerpoint pre-designed slides and powerpoint templates have been carefully created by our professional team to help you impress your audience. All slides have been created and are 100% editable in powerpoint. Each and every property of any graphic - color, size, orientation, shading, outline etc. can be modified to help you build an effective powerpoint presentation. Any text can be entered at any point in the powerpoint template or slide. Simply DOWNLOAD, TYPE and PRESENT! Deliver fascinating presentations with our PowerPoint Slides Image Pie Chart Puzzle Process Ppt Layouts. Dont waste time struggling with PowerPoint. Let us do it for you.
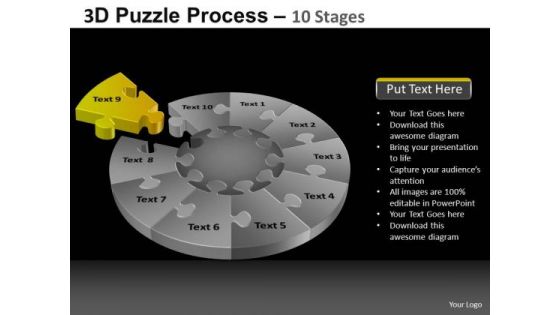
PowerPoint Slides Image Pie Chart Puzzle Process Ppt Slidelayout
PowerPoint Slides Image Pie chart Puzzle Process PPT Slidelayout-These high quality powerpoint pre-designed slides and powerpoint templates have been carefully created by our professional team to help you impress your audience. All slides have been created and are 100% editable in powerpoint. Each and every property of any graphic - color, size, orientation, shading, outline etc. can be modified to help you build an effective powerpoint presentation. Any text can be entered at any point in the powerpoint template or slide. Simply DOWNLOAD, TYPE and PRESENT! Ideas will flower and bloom with our PowerPoint Slides Image Pie Chart Puzzle Process Ppt Slidelayout. Your company will begin to flourish.
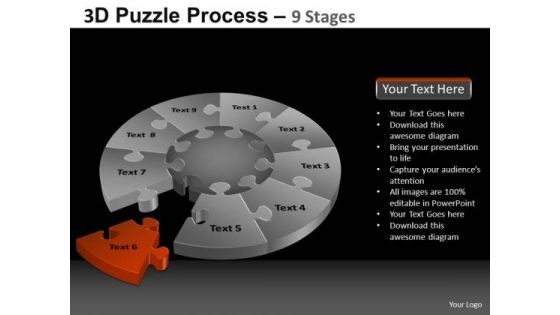
PowerPoint Slides Sales Pie Chart Puzzle Process Ppt Layout
PowerPoint Slides Sales Pie chart Puzzle Process PPT Layout-These high quality powerpoint pre-designed slides and powerpoint templates have been carefully created by our professional team to help you impress your audience. All slides have been created and are 100% editable in powerpoint. Each and every property of any graphic - color, size, orientation, shading, outline etc. can be modified to help you build an effective powerpoint presentation. Any text can be entered at any point in the powerpoint template or slide. Simply DOWNLOAD, TYPE and PRESENT! Drum up a fervour with our PowerPoint Slides Sales Pie Chart Puzzle Process Ppt Layout. You will come out on top.
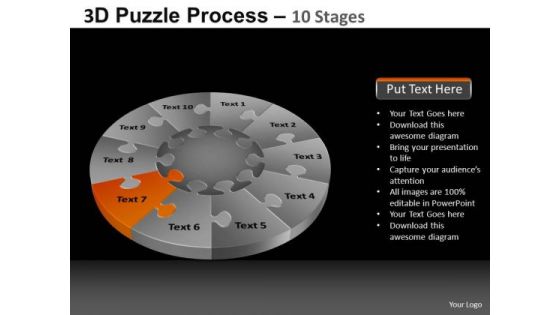
PowerPoint Template Business Pie Chart Puzzle Process Ppt Slides
PowerPoint Template Business Pie chart Puzzle Process PPT Slides-These high quality powerpoint pre-designed slides and powerpoint templates have been carefully created by our professional team to help you impress your audience. All slides have been created and are 100% editable in powerpoint. Each and every property of any graphic - color, size, orientation, shading, outline etc. can be modified to help you build an effective powerpoint presentation. Any text can be entered at any point in the powerpoint template or slide. Simply DOWNLOAD, TYPE and PRESENT! Nip any falsehood in the bud. Our PowerPoint Template Business Pie Chart Puzzle Process Ppt Slides will nourish the truth.
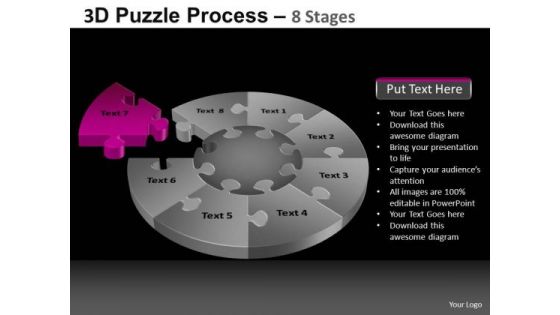
PowerPoint Template Leadership Pie Chart Puzzle Process Ppt Layouts
PowerPoint Template Leadership Pie chart Puzzle Process PPT Layouts-These high quality powerpoint pre-designed slides and powerpoint templates have been carefully created by our professional team to help you impress your audience. All slides have been created and are 100% editable in powerpoint. Each and every property of any graphic - color, size, orientation, shading, outline etc. can be modified to help you build an effective powerpoint presentation. Any text can be entered at any point in the powerpoint template or slide. Simply DOWNLOAD, TYPE and PRESENT! Examine all factors in detail. Give each one close attention with our PowerPoint Template Leadership Pie Chart Puzzle Process Ppt Layouts.
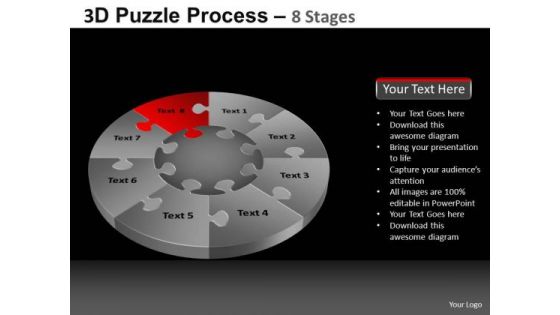
PowerPoint Templates Marketing Pie Chart Puzzle Process Ppt Layouts
PowerPoint Templates Marketing Pie chart Puzzle Process PPT Layouts-These high quality powerpoint pre-designed slides and powerpoint templates have been carefully created by our professional team to help you impress your audience. All slides have been created and are 100% editable in powerpoint. Each and every property of any graphic - color, size, orientation, shading, outline etc. can be modified to help you build an effective powerpoint presentation. Any text can be entered at any point in the powerpoint template or slide. Simply DOWNLOAD, TYPE and PRESENT! Brighten up the day with our PowerPoint Templates Marketing Pie Chart Puzzle Process Ppt Layouts. Dispal any darkness around.
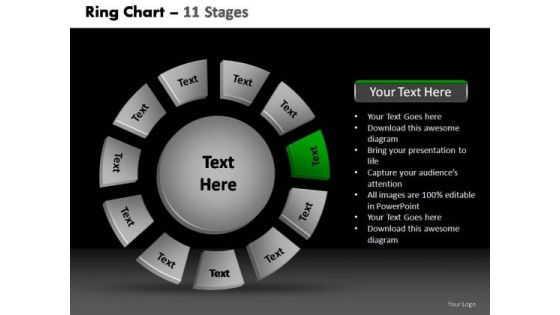
PowerPoint Process Chart Donut With Core Ppt Backgrounds
PowerPoint Process Chart Donut with Core PPT Backgrounds-These amazing PowerPoint pre-designed slides and PowerPoint templates have been carefully created by our team of experts to help you impress your audience. Our stunning collection of Powerpoint slides are 100% editable and can easily fit in any PowerPoint presentations. By using these animations and graphics in PowerPoint and you can easily make professional presentations. Any text can be entered at any point in the PowerPoint template or slide. Just DOWNLOAD our awesome PowerPoint templates and you are ready to go. The adaptability of our PowerPoint Process Chart Donut With Core Ppt Backgrounds is a fact. They will align with your bidding.
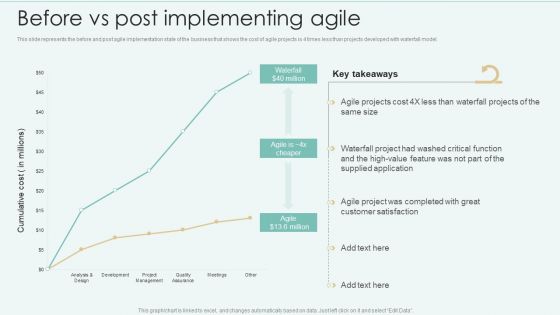
Strategies Of Agile Development To Enhance Processes Before Vs Post Implementing Agile Diagrams PDF
This slide represents the before and post agile implementation state of the business that shows the cost of agile projects is 4 times less than projects developed with waterfall model. Create an editable Strategies Of Agile Development To Enhance Processes Before Vs Post Implementing Agile Diagrams PDF that communicates your idea and engages your audience. Whether you are presenting a business or an educational presentation, pre designed presentation templates help save time. Strategies Of Agile Development To Enhance Processes Before Vs Post Implementing Agile Diagrams PDF is highly customizable and very easy to edit, covering many different styles from creative to business presentations. Slidegeeks has creative team members who have crafted amazing templates. So, go and get them without any delay.
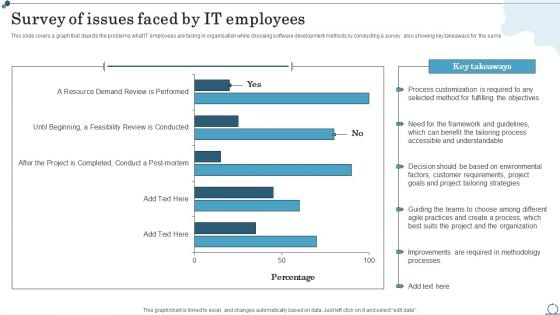
Survey Of Issues Faced By IT Employees Agile IT Methodology In Project Management Diagrams PDF
This slide covers a graph that depicts the problems what IT employees are facing in organisation while choosing software development methods by conducting a survey also showing key takeaways for the same.Get a simple yet stunning designed Survey Of Issues Faced By IT Employees Agile IT Methodology In Project Management Diagrams PDF. It is the best one to establish the tone in your meetings. It is an excellent way to make your presentations highly effective. So, download this PPT today from Slidegeeks and see the positive impacts. Our easy-to-edit Survey Of Issues Faced By IT Employees Agile IT Methodology In Project Management Diagrams PDF can be your go-to option for all upcoming conferences and meetings. So, what are you waiting for Grab this template today.
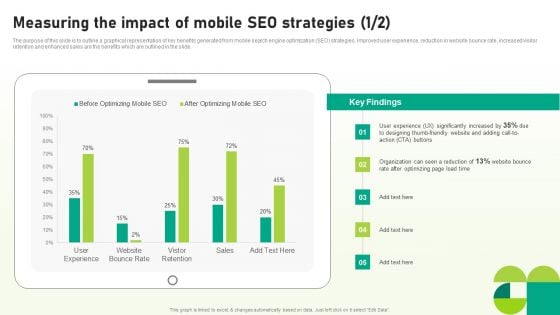
Utilizing SEO To Boost Customer Measuring The Impact Of Mobile SEO Strategies Diagrams PDF
The purpose of this slide is to outline a graphical representation of key benefits generated from mobile search engine optimization SEO strategies. Improved user experience, reduction in website bounce rate, increased visitor retention and enhanced sales are the benefits which are outlined in the slide. Explore a selection of the finest Utilizing SEO To Boost Customer Measuring The Impact Of Mobile SEO Strategies Diagrams PDF here. With a plethora of professionally designed and pre-made slide templates, you can quickly and easily find the right one for your upcoming presentation. You can use our Utilizing SEO To Boost Customer Measuring The Impact Of Mobile SEO Strategies Diagrams PDF to effectively convey your message to a wider audience. Slidegeeks has done a lot of research before preparing these presentation templates. The content can be personalized and the slides are highly editable. Grab templates today from Slidegeeks.
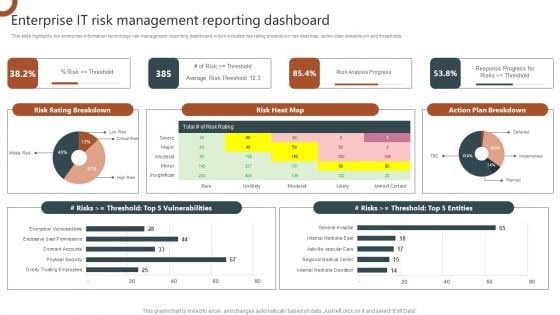
Organizations Risk Management And IT Security Enterprise IT Risk Management Reporting Dashboard Diagrams PDF
This slide highlights the enterprise information technology risk management reporting dashboard which includes risk rating breakdown risk heat map, action plan breakdown and thresholds. This Organizations Risk Management And IT Security Enterprise IT Risk Management Reporting Dashboard Diagrams PDF is perfect for any presentation, be it in front of clients or colleagues. It is a versatile and stylish solution for organizing your meetings. The Organizations Risk Management And IT Security Enterprise IT Risk Management Reporting Dashboard Diagrams PDF features a modern design for your presentation meetings. The adjustable and customizable slides provide unlimited possibilities for acing up your presentation. Slidegeeks has done all the homework before launching the product for you. So, do not wait, grab the presentation templates today.

Workplace Facility Management Services Company Facility Management Services Global Market Scenario Diagrams PDF
This slide highlights the facility management services market share and future growth rate in graphical format which showcases product life cycle of different countries and organized and unorganized sector future growth rate. Explore a selection of the finest Workplace Facility Management Services Company Facility Management Services Global Market Scenario Diagrams PDF here. With a plethora of professionally designed and pre made slide templates, you can quickly and easily find the right one for your upcoming presentation. You can use our Workplace Facility Management Services Company Facility Management Services Global Market Scenario Diagrams PDF to effectively convey your message to a wider audience. Slidegeeks has done a lot of research before preparing these presentation templates. The content can be personalized and the slides are highly editable. Grab templates today from Slidegeeks.
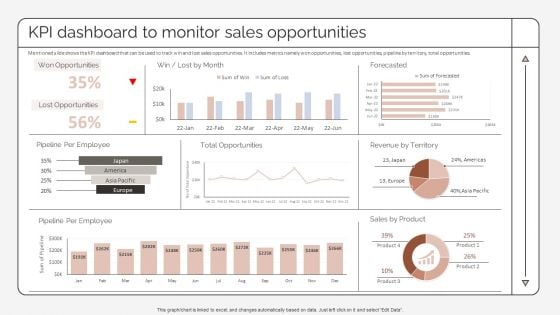
Kpi Dashboard To Monitor Sales Opportunities Strategic Promotion Plan To Improve Product Diagrams PDF
Mentioned slide shows the KPI dashboard that can be used to track win and lost sales opportunities. It includes metrics namely won opportunities, lost opportunities, pipeline by territory, total opportunities.Explore a selection of the finest Kpi Dashboard To Monitor Sales Opportunities Strategic Promotion Plan To Improve Product Diagrams PDF here. With a plethora of professionally designed and pre-made slide templates, you can quickly and easily find the right one for your upcoming presentation. You can use our Kpi Dashboard To Monitor Sales Opportunities Strategic Promotion Plan To Improve Product Diagrams PDF to effectively convey your message to a wider audience. Slidegeeks has done a lot of research before preparing these presentation templates. The content can be personalized and the slides are highly editable. Grab templates today from Slidegeeks.
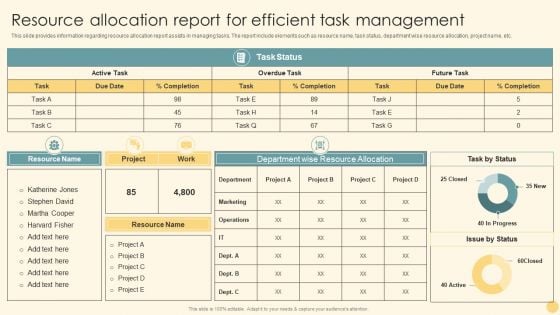
Resource Allocation Report For Efficient Task Management Ppt PowerPoint Presentation File Diagrams PDF
This slide provides information regarding resource allocation report assists in managing tasks. The report include elements such as resource name, task status, department wise resource allocation, project name, etc. Get a simple yet stunning designed Resource Allocation Report For Efficient Task Management Ppt PowerPoint Presentation File Diagrams PDF. It is the best one to establish the tone in your meetings. It is an excellent way to make your presentations highly effective. So, download this PPT today from Slidegeeks and see the positive impacts. Our easy to edit Resource Allocation Report For Efficient Task Management Ppt PowerPoint Presentation File Diagrams PDF can be your go to option for all upcoming conferences and meetings. So, what are you waiting for Grab this template today.
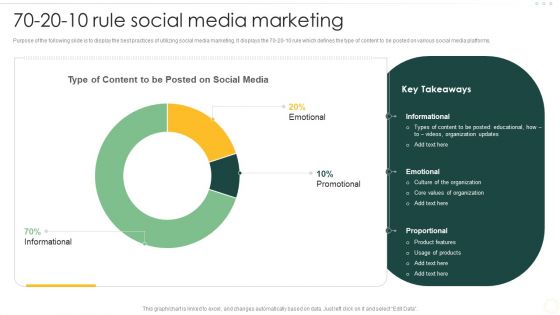
Effective Organizational B2B And B2C 70 20 10 Rule Social Media Marketing Diagrams PDF
Purpose of the following slide is to display the best practices of utilizing social media marketing. It displays the 70-20-10 rule which defines the type of content to be posted on various social media platforms. Do you have an important presentation coming up Are you looking for something that will make your presentation stand out from the rest Look no further than Effective Organizational B2B And B2C 70 20 10 Rule Social Media Marketing Diagrams PDF. With our professional designs, you can trust that your presentation will pop and make delivering it a smooth process. And with Slidegeeks, you can trust that your presentation will be unique and memorable. So why wait Grab Effective Organizational B2B And B2C 70 20 10 Rule Social Media Marketing Diagrams PDF today and make your presentation stand out from the rest.
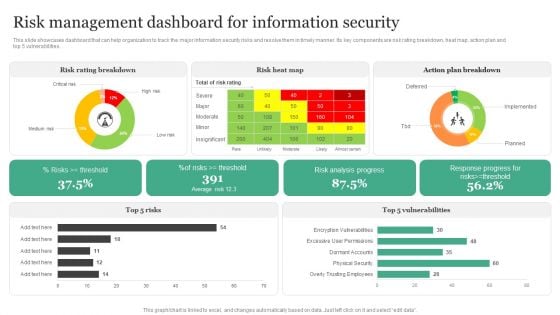
Risk Management Dashboard For Information Security Information Security Risk Administration Diagrams PDF
This slide showcases dashboard that can help organization to track the major information security risks and resolve them in timely manner. Its key components are risk rating breakdown, heat map, action plan and top 5 vulnerabilities.Create an editable Risk Management Dashboard For Information Security Information Security Risk Administration Diagrams PDF that communicates your idea and engages your audience. Whether you are presenting a business or an educational presentation, pre-designed presentation templates help save time. Risk Management Dashboard For Information Security Information Security Risk Administration Diagrams PDF is highly customizable and very easy to edit, covering many different styles from creative to business presentations. Slidegeeks has creative team members who have crafted amazing templates. So, go and get them without any delay.

Global Automotive Industry Research And Analysis Global Motor Vehicle Sales By Region Diagrams PDF
This slide covers a graphical representation of worldwide automobile sales for Europe, Asia, Africa, NAFTA, Central, and South America, etc. It also includes key insights about Chinese car sales expansion, USA sales, Indias sales, etc. Explore a selection of the finest Global Automotive Industry Research And Analysis Global Motor Vehicle Sales By Region Diagrams PDF here. With a plethora of professionally designed and pre made slide templates, you can quickly and easily find the right one for your upcoming presentation. You can use our Global Automotive Industry Research And Analysis Global Motor Vehicle Sales By Region Diagrams PDF to effectively convey your message to a wider audience. Slidegeeks has done a lot of research before preparing these presentation templates. The content can be personalized and the slides are highly editable. Grab templates today from Slidegeeks.

Customer Engagement Methods For Online Platforms Emerging Trends In Mobile Shopping Industry Diagrams PDF
This slide includes statistics related to mobile commerce market size, average time spend by consumers on phone and age based categorization of consumers who do research online before making a purchase. Do you have an important presentation coming up. Are you looking for something that will make your presentation stand out from the rest. Look no further than Customer Engagement Methods For Online Platforms Emerging Trends In Mobile Shopping Industry Diagrams PDF. With our professional designs, you can trust that your presentation will pop and make delivering it a smooth process. And with Slidegeeks, you can trust that your presentation will be unique and memorable. So why wait. Grab Customer Engagement Methods For Online Platforms Emerging Trends In Mobile Shopping Industry Diagrams PDF today and make your presentation stand out from the rest.
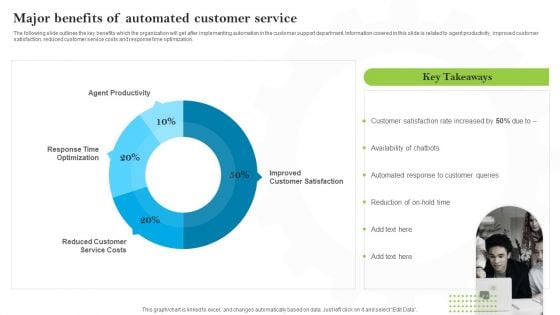
Introducing AI Tools Major Benefits Of Automated Customer Service Diagrams PDF
The following slide outlines the key benefits which the organization will get after implementing automation in the customer support department. Information covered in this slide is related to agent productivity, improved customer satisfaction, reduced customer service costs and response time optimization. Explore a selection of the finest Introducing AI Tools Major Benefits Of Automated Customer Service Diagrams PDF here. With a plethora of professionally designed and pre-made slide templates, you can quickly and easily find the right one for your upcoming presentation. You can use our Introducing AI Tools Major Benefits Of Automated Customer Service Diagrams PDF to effectively convey your message to a wider audience. Slidegeeks has done a lot of research before preparing these presentation templates. The content can be personalized and the slides are highly editable. Grab templates today from Slidegeeks.
Human Augmented Machine Learning IT Augmented Intelligence Information Tracking Dashboard Diagrams PDF
This slide depicts the information tracking dashboard by augmented intelligence model covering the data analysis. Data analysis includes image analysis, storage size, new users on the cloud platform, etc. Get a simple yet stunning designed Human Augmented Machine Learning IT Augmented Intelligence Information Tracking Dashboard Diagrams PDF. It is the best one to establish the tone in your meetings. It is an excellent way to make your presentations highly effective. So, download this PPT today from Slidegeeks and see the positive impacts. Our easy-to-edit Human Augmented Machine Learning IT Augmented Intelligence Information Tracking Dashboard Diagrams PDF can be your go-to option for all upcoming conferences and meetings. So, what are you waiting for. Grab this template today.
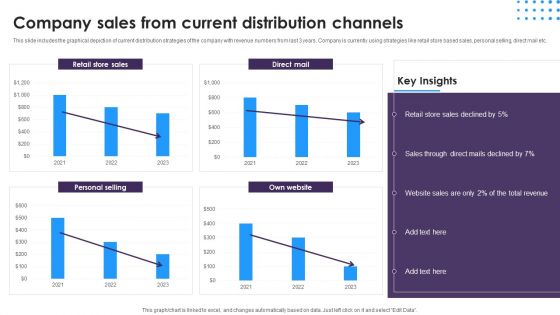
Omnichannel Distribution System To Satisfy Customer Needs Company Sales From Current Distribution Channels Diagrams PDF
This slide includes the graphical depiction of current distribution strategies of the company with revenue numbers from last 3 years. Company is currently using strategies like retail store based sales, personal selling, direct mail etc. Get a simple yet stunning designed Omnichannel Distribution System To Satisfy Customer Needs Company Sales From Current Distribution Channels Diagrams PDF. It is the best one to establish the tone in your meetings. It is an excellent way to make your presentations highly effective. So, download this PPT today from Slidegeeks and see the positive impacts. Our easy-to-edit Omnichannel Distribution System To Satisfy Customer Needs Company Sales From Current Distribution Channels Diagrams PDF can be your go-to option for all upcoming conferences and meetings. So, what are you waiting for Grab this template today.
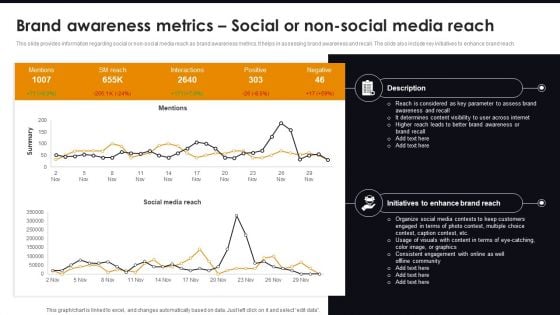
Brand Awareness Metrics Social Or Non-Social Media Reach Comprehensive Guide For Brand Recognition Diagrams PDF
This slide provides information regarding social or non-social media reach as brand awareness metrics. It helps in assessing brand awareness and recall. The slide also include key initiatives to enhance brand reach. Get a simple yet stunning designed Brand Awareness Metrics Social Or Non-Social Media Reach Comprehensive Guide For Brand Recognition Diagrams PDF. It is the best one to establish the tone in your meetings. It is an excellent way to make your presentations highly effective. So, download this PPT today from Slidegeeks and see the positive impacts. Our easy-to-edit Brand Awareness Metrics Social Or Non-Social Media Reach Comprehensive Guide For Brand Recognition Diagrams PDF can be your go-to option for all upcoming conferences and meetings. So, what are you waiting for Grab this template today.
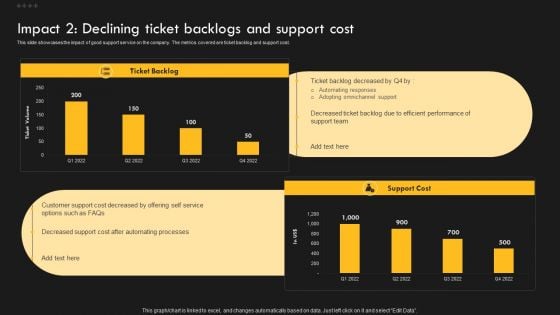
Service Improvement Techniques For Client Retention Impact 2 Declining Ticket Backlogs And Support Diagrams PDF
This slide showcases the impact of good support service on the company. The metrics covered are customer satisfaction and retention. Explore a selection of the finest Service Improvement Techniques For Client Retention Impact 2 Declining Ticket Backlogs And Support Diagrams PDF here. With a plethora of professionally designed and pre-made slide templates, you can quickly and easily find the right one for your upcoming presentation. You can use our Service Improvement Techniques For Client Retention Impact 2 Declining Ticket Backlogs And Support Diagrams PDF to effectively convey your message to a wider audience. Slidegeeks has done a lot of research before preparing these presentation templates. The content can be personalized and the slides are highly editable. Grab templates today from Slidegeeks.
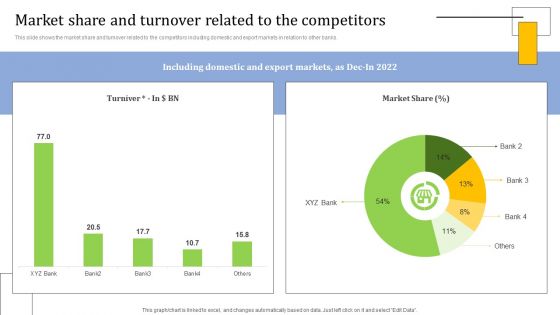
Strategies For Credit Risk Management Market Share And Turnover Related To The Diagrams PDF
This slide shows the market share and turnover related to the competitors including domestic and export markets in relation to other banks. Do you have an important presentation coming up Are you looking for something that will make your presentation stand out from the rest Look no further than Strategies For Credit Risk Management Market Share And Turnover Related To The Diagrams PDF. With our professional designs, you can trust that your presentation will pop and make delivering it a smooth process. And with Slidegeeks, you can trust that your presentation will be unique and memorable. So why wait Grab Strategies For Credit Risk Management Market Share And Turnover Related To The Diagrams PDF today and make your presentation stand out from the rest.
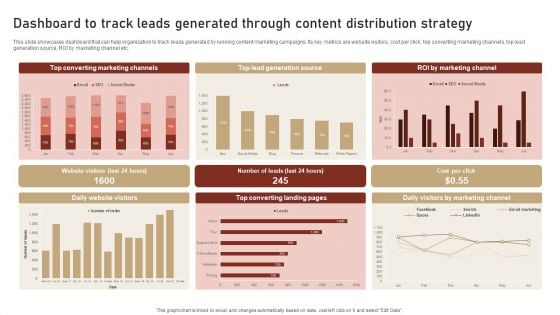
Content Delivery And Promotion Dashboard To Track Leads Generated Through Content Diagrams PDF
This slide showcases dashboard that can help organization to track leads generated by running content marketing campaigns. Its key metrics are website visitors, cost per click, top converting marketing channels, top lead generation source, ROI by marketing channel etc. Do you have an important presentation coming up Are you looking for something that will make your presentation stand out from the rest Look no further than Content Delivery And Promotion Dashboard To Track Leads Generated Through Content Diagrams PDF. With our professional designs, you can trust that your presentation will pop and make delivering it a smooth process. And with Slidegeeks, you can trust that your presentation will be unique and memorable. So why wait Grab Content Delivery And Promotion Dashboard To Track Leads Generated Through Content Diagrams PDF today and make your presentation stand out from the rest.
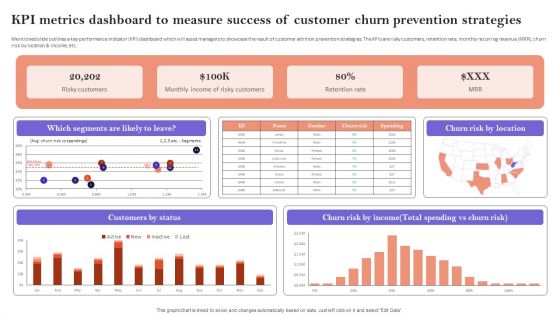
KPI Metrics Dashboard To Measure Success Of Customer Churn Prevention Strategies Diagrams PDF
Mentioned slide outlines a key performance indicator KPI dashboard which will assist managers to showcase the result of customer attrition prevention strategies. The KPIs are risky customers, retention rate, monthly recurring revenue MRR, churn risk by location and income, etc. This KPI Metrics Dashboard To Measure Success Of Customer Churn Prevention Strategies Diagrams PDF is perfect for any presentation, be it in front of clients or colleagues. It is a versatile and stylish solution for organizing your meetings. The KPI Metrics Dashboard To Measure Success Of Customer Churn Prevention Strategies Diagrams PDF features a modern design for your presentation meetings. The adjustable and customizable slides provide unlimited possibilities for acing up your presentation. Slidegeeks has done all the homework before launching the product for you. So, do not wait, grab the presentation templates today
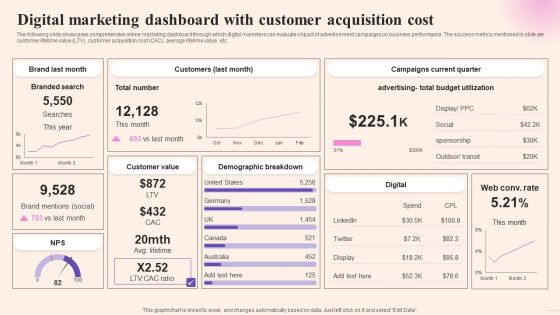
Comprehensive Guide To Build Marketing Digital Marketing Dashboard With Customer Acquisition Diagrams PDF
The following slide showcases comprehensive online marketing dashboard through which digital marketers can evaluate impact of advertisement campaigns on business performance. The success metrics mentioned in slide are customer lifetime value LTV, customer acquisition cost CAC, average lifetime value, etc. Do you have an important presentation coming up Are you looking for something that will make your presentation stand out from the rest Look no further than Comprehensive Guide To Build Marketing Digital Marketing Dashboard With Customer Acquisition Diagrams PDF. With our professional designs, you can trust that your presentation will pop and make delivering it a smooth process. And with Slidegeeks, you can trust that your presentation will be unique and memorable. So why wait Grab Comprehensive Guide To Build Marketing Digital Marketing Dashboard With Customer Acquisition Diagrams PDF today and make your presentation stand out from the rest.
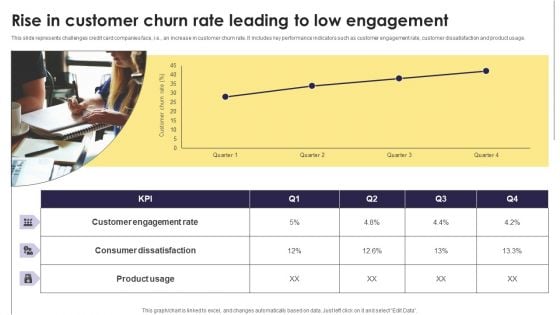
Implementation Of An Efficient Credit Card Promotion Plan Rise In Customer Churn Rate Leading Diagrams PDF
This slide represents challenges credit card companies face, i.e., an increase in customer churn rate. It includes key performance indicators such as customer engagement rate, customer dissatisfaction and product usage. Explore a selection of the finest Implementation Of An Efficient Credit Card Promotion Plan Rise In Customer Churn Rate Leading Diagrams PDF here. With a plethora of professionally designed and pre made slide templates, you can quickly and easily find the right one for your upcoming presentation. You can use our Implementation Of An Efficient Credit Card Promotion Plan Rise In Customer Churn Rate Leading Diagrams PDF to effectively convey your message to a wider audience. Slidegeeks has done a lot of research before preparing these presentation templates. The content can be personalized and the slides are highly editable. Grab templates today from Slidegeeks.
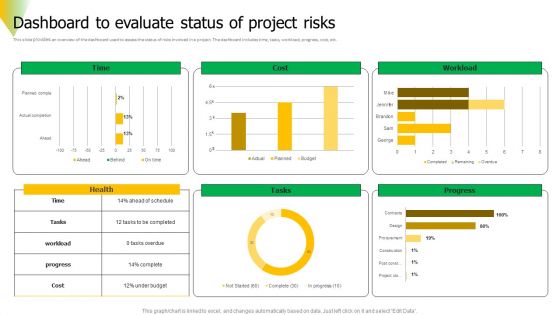
Risk Assessment Dashboard To Evaluate Status Of Project Risks Diagrams PDF
This slide provides an overview of the dashboard used to assess the status of risks involved in a project. The dashboard includes time, tasks, workload, progress, cost, etc. Get a simple yet stunning designed Risk Assessment Dashboard To Evaluate Status Of Project Risks Diagrams PDF. It is the best one to establish the tone in your meetings. It is an excellent way to make your presentations highly effective. So, download this PPT today from Slidegeeks and see the positive impacts. Our easy to edit Risk Assessment Dashboard To Evaluate Status Of Project Risks Diagrams PDF can be your go to option for all upcoming conferences and meetings. So, what are you waiting for Grab this template today.
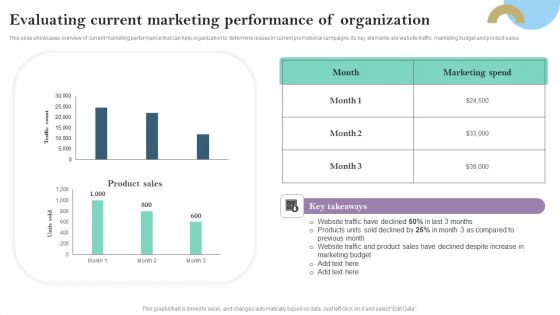
Evaluating Current Marketing Performance Of Organization Ppt PowerPoint Presentation Diagram Templates PDF
This slide showcases overview of current marketing performance that can help organization to determine issues in current promotional campaigns. Its key elements are website traffic, marketing budget and product sales Explore a selection of the finest Evaluating Current Marketing Performance Of Organization Ppt PowerPoint Presentation Diagram Templates PDF here. With a plethora of professionally designed and pre made slide templates, you can quickly and easily find the right one for your upcoming presentation. You can use our Evaluating Current Marketing Performance Of Organization Ppt PowerPoint Presentation Diagram Templates PDF to effectively convey your message to a wider audience. Slidegeeks has done a lot of research before preparing these presentation templates. The content can be personalized and the slides are highly editable. Grab templates today from Slidegeeks.
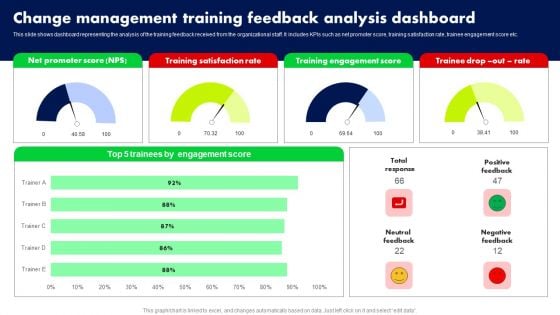
Change Management Training Feedback Analysis Dashboard Ppt PowerPoint Presentation File Diagrams PDF
This slide shows dashboard representing the analysis of the training feedback received from the organizational staff. It includes KPIs such as net promoter score, training satisfaction rate, trainee engagement score etc. Get a simple yet stunning designed Change Management Training Feedback Analysis Dashboard Ppt PowerPoint Presentation File Diagrams PDF. It is the best one to establish the tone in your meetings. It is an excellent way to make your presentations highly effective. So, download this PPT today from Slidegeeks and see the positive impacts. Our easy to edit Change Management Training Feedback Analysis Dashboard Ppt PowerPoint Presentation File Diagrams PDF can be your go to option for all upcoming conferences and meetings. So, what are you waiting for Grab this template today.
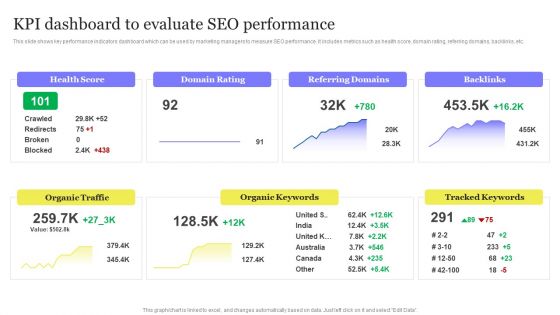
Enhancing Digital Visibility Using SEO Content Strategy KPI Dashboard To Evaluate SEO Performance Diagrams PDF
This slide shows key performance indicators dashboard which can be used by marketing managers to measure SEO performance. It includes metrics such as health score, domain rating, referring domains, backlinks, etc. This Enhancing Digital Visibility Using SEO Content Strategy KPI Dashboard To Evaluate SEO Performance Diagrams PDF is perfect for any presentation, be it in front of clients or colleagues. It is a versatile and stylish solution for organizing your meetings. The Enhancing Digital Visibility Using SEO Content Strategy KPI Dashboard To Evaluate SEO Performance Diagrams PDF features a modern design for your presentation meetings. The adjustable and customizable slides provide unlimited possibilities for acing up your presentation. Slidegeeks has done all the homework before launching the product for you. So, do not wait, grab the presentation templates today
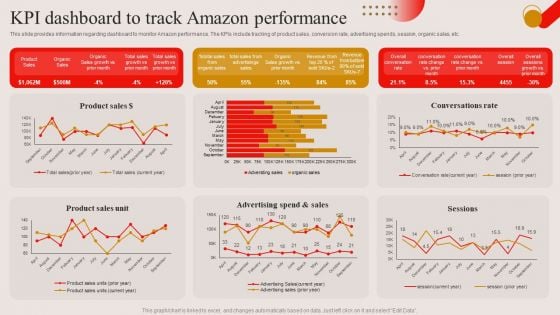
KPI Dashboard To Track Amazon Performance Ppt PowerPoint Presentation Diagram Lists PDF
This slide provides information regarding dashboard to monitor Amazon performance. The KPIs include tracking of product sales, conversion rate, advertising spends, session, organic sales, etc. Explore a selection of the finest KPI Dashboard To Track Amazon Performance Ppt PowerPoint Presentation Diagram Lists PDF here. With a plethora of professionally designed and pre made slide templates, you can quickly and easily find the right one for your upcoming presentation. You can use our KPI Dashboard To Track Amazon Performance Ppt PowerPoint Presentation Diagram Lists PDF to effectively convey your message to a wider audience. Slidegeeks has done a lot of research before preparing these presentation templates. The content can be personalized and the slides are highly editable. Grab templates today from Slidegeeks.
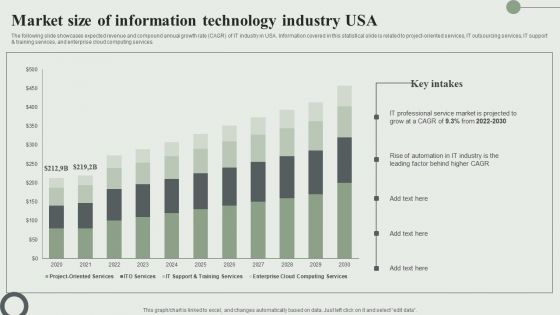
Market Size Of Information Technology Industry USA Ppt PowerPoint Presentation Diagram Lists PDF
The following slide showcases expected revenue and compound annual growth rate CAGR of IT industry in USA. Information covered in this statistical slide is related to project oriented services, IT outsourcing services, IT support and training services, and enterprise cloud computing services. Get a simple yet stunning designed Market Size Of Information Technology Industry USA Ppt PowerPoint Presentation Diagram Lists PDF. It is the best one to establish the tone in your meetings. It is an excellent way to make your presentations highly effective. So, download this PPT today from Slidegeeks and see the positive impacts. Our easy to edit Market Size Of Information Technology Industry USA Ppt PowerPoint Presentation Diagram Lists PDF can be your go to option for all upcoming conferences and meetings. So, what are you waiting for Grab this template today.
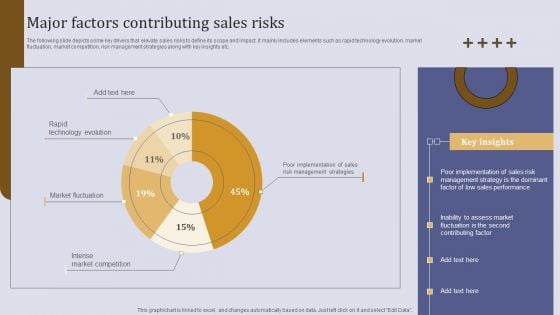
Executing Sales Risk Administration Procedure Major Factors Contributing Sales Risks Diagrams PDF
The following slide depicts some key drivers that elevate sales risks to define its scope and impact. It mainly includes elements such as rapid technology evolution, market fluctuation, market competition, risk management strategies along with key insights etc. Get a simple yet stunning designed Executing Sales Risk Administration Procedure Major Factors Contributing Sales Risks Diagrams PDF. It is the best one to establish the tone in your meetings. It is an excellent way to make your presentations highly effective. So, download this PPT today from Slidegeeks and see the positive impacts. Our easy to edit Executing Sales Risk Administration Procedure Major Factors Contributing Sales Risks Diagrams PDF can be your go to option for all upcoming conferences and meetings. So, what are you waiting for Grab this template today.
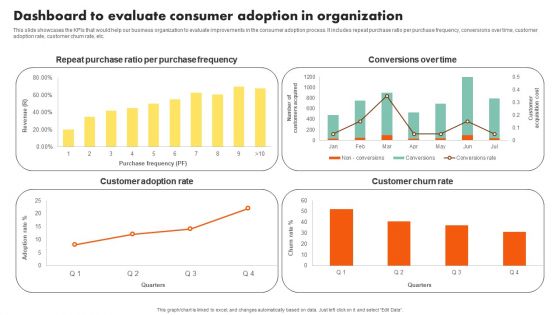
Examining Customer Experience Path To Enhance Adoption Rate Dashboard To Evaluate Consumer Adoption Diagrams PDF
This slide showcases the KPIs that would help our business organization to evaluate improvements in the consumer adoption process. It includes repeat purchase ratio per purchase frequency, conversions over time, customer adoption rate, customer churn rate, etc. Create an editable Examining Customer Experience Path To Enhance Adoption Rate Dashboard To Evaluate Consumer Adoption Diagrams PDF that communicates your idea and engages your audience. Whether youre presenting a business or an educational presentation, pre designed presentation templates help save time. Examining Customer Experience Path To Enhance Adoption Rate Dashboard To Evaluate Consumer Adoption Diagrams PDF is highly customizable and very easy to edit, covering many different styles from creative to business presentations. Slidegeeks has creative team members who have crafted amazing templates. So, go and get them without any delay.
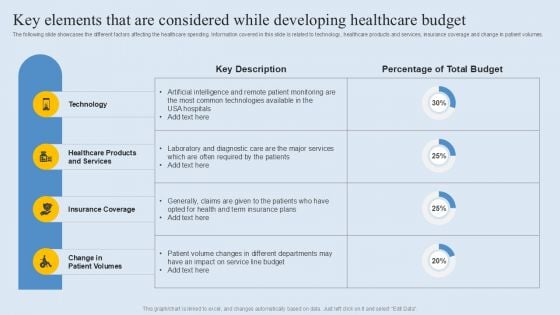
Key Elements That Are Considered While Developing Healthcare Budget Diagrams PDF
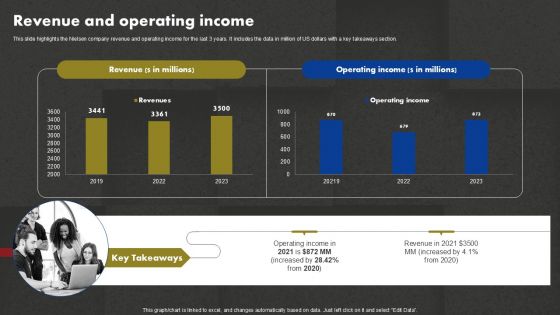
Data And Customer Analysis Company Outline Revenue And Operating Income Diagrams PDF
Enterprise SMS Marketing Subscribers Tracking Dashboard Ppt PowerPoint Presentation Diagram PDF
This slide represents the key metrics dashboard to monito and track the SMS marketing subscribers of the enterprise. It includes details related to KPIs such as total subscribers, new subscribers, total unsubscribes etc. Do you have an important presentation coming up Are you looking for something that will make your presentation stand out from the rest Look no further than Enterprise SMS Marketing Subscribers Tracking Dashboard Ppt PowerPoint Presentation Diagram PDF. With our professional designs, you can trust that your presentation will pop and make delivering it a smooth process. And with Slidegeeks, you can trust that your presentation will be unique and memorable. So why wait Grab Enterprise SMS Marketing Subscribers Tracking Dashboard Ppt PowerPoint Presentation Diagram PDF today and make your presentation stand out from the rest.
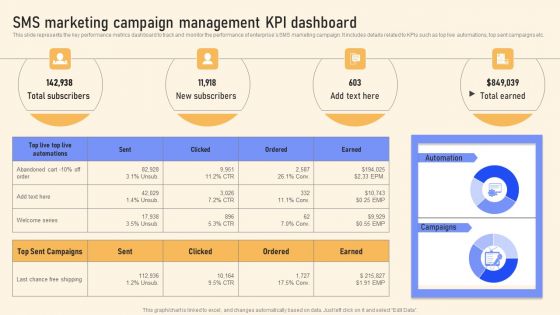
SMS Marketing Campaign Management KPI Dashboard Ppt PowerPoint Presentation Diagram Templates PDF
This slide represents the key performance metrics dashboard to track and monitor the performance of enterprises SMS marketing campaign. It includes details related to KPIs such as top live automations, top sent campaigns etc. Get a simple yet stunning designed SMS Marketing Campaign Management KPI Dashboard Ppt PowerPoint Presentation Diagram Templates PDF. It is the best one to establish the tone in your meetings. It is an excellent way to make your presentations highly effective. So, download this PPT today from Slidegeeks and see the positive impacts. Our easy to edit SMS Marketing Campaign Management KPI Dashboard Ppt PowerPoint Presentation Diagram Templates PDF can be your go to option for all upcoming conferences and meetings. So, what are you waiting for Grab this template today.
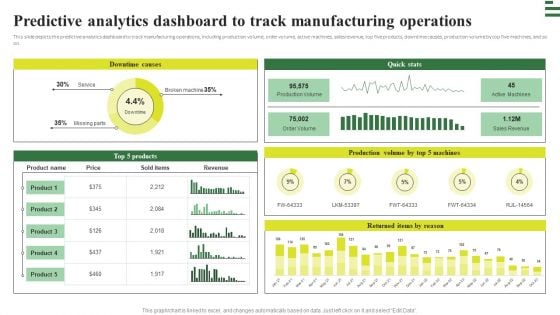
Transforming Manufacturing With Automation Predictive Analytics Dashboard To Track Diagrams PDF
This slide depicts the predictive analytics dashboard to track manufacturing operations, including production volume, order volume, active machines, sales revenue, top five products, downtime causes, production volume by top five machines, and so on. Get a simple yet stunning designed Transforming Manufacturing With Automation Predictive Analytics Dashboard To Track Diagrams PDF. It is the best one to establish the tone in your meetings. It is an excellent way to make your presentations highly effective. So, download this PPT today from Slidegeeks and see the positive impacts. Our easy to edit Transforming Manufacturing With Automation Predictive Analytics Dashboard To Track Diagrams PDF can be your go to option for all upcoming conferences and meetings. So, what are you waiting for Grab this template today.
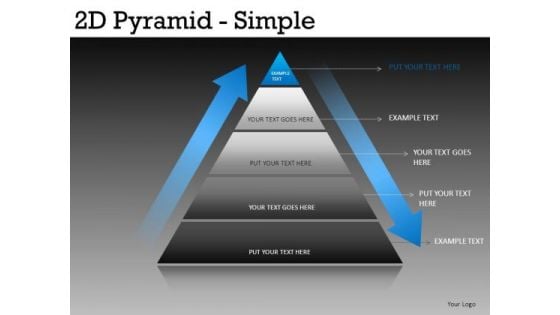
Pyramid Diagrams-pyramid PowerPoint Templates
Pyramid Diagrams-Pyramid PowerPoint Templates-These high quality powerpoint pre-designed slides and powerpoint templates have been carefully created by our professional team to help you impress your audience. All slides have been created and are 100% editable in powerpoint. Each and every property of any graphic - color, size, orientation, shading, outline etc. can be modified to help you build an effective powerpoint presentation. Any text can be entered at any point in the powerpoint template or slide. Simply DOWNLOAD, TYPE and PRESENT! Locate problems with our Pyramid Diagrams-pyramid PowerPoint Templates. Download without worries with our money back guaranteee.
Dashboard For Tracking Brand Awareness Advertisement Campaign Results Designs PDF
This slide showcases dashboard that can help organization to track results of online advertisement campaigns. Its key components ad impressions, click through rate, cost per conversion, revenue per click, impressions, new users and sessions.Are you in need of a template that can accommodate all of your creative concepts This one is crafted professionally and can be altered to fit any style. Use it with Google Slides or PowerPoint. Include striking photographs, symbols, depictions, and other visuals. Fill, move around, or remove text boxes as desired. Test out color palettes and font mixtures. Edit and save your work, or work with colleagues. Download Dashboard For Tracking Brand Awareness Advertisement Campaign Results Designs PDF and observe how to make your presentation outstanding. Give an impeccable presentation to your group and make your presentation unforgettable.
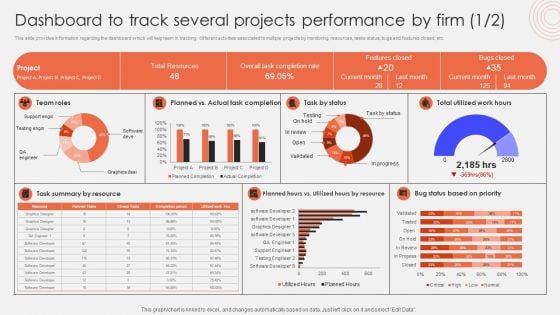
Dashboard To Track Several Projects Performance By Firm Designs PDF
This slide provides information regarding the dashboard which will help team in tracking different activities associated to multiple projects by monitoring resources, tasks status, bugs and features closed, etc. Are you in need of a template that can accommodate all of your creative concepts This one is crafted professionally and can be altered to fit any style. Use it with Google Slides or PowerPoint. Include striking photographs, symbols, depictions, and other visuals. Fill, move around, or remove text boxes as desired. Test out color palettes and font mixtures. Edit and save your work, or work with colleagues. Download Dashboard To Track Several Projects Performance By Firm Designs PDF and observe how to make your presentation outstanding. Give an impeccable presentation to your group and make your presentation unforgettable.
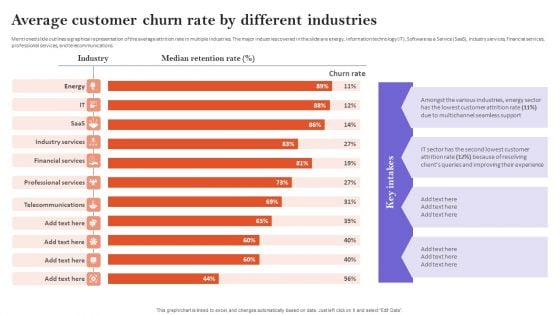
Average Customer Churn Rate By Different Industries Designs PDF
Mentioned slide outlines a graphical representation of the average attrition rate in multiple industries. The major industries covered in the slide are energy, information technology IT, Software as a Service SaaS, industry services, financial services, professional services, and telecommunications. Slidegeeks is one of the best resources for PowerPoint templates. You can download easily and regulate Average Customer Churn Rate By Different Industries Designs PDF for your personal presentations from our wonderful collection. A few clicks is all it takes to discover and get the most relevant and appropriate templates. Use our Templates to add a unique zing and appeal to your presentation and meetings. All the slides are easy to edit and you can use them even for advertisement purposes.
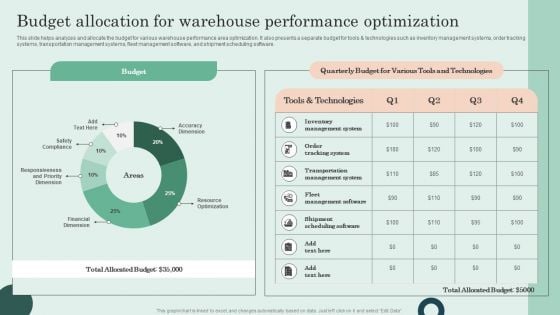
Budget Allocation For Warehouse Performance Optimization Designs PDF
This slide helps analyzes and allocate the budget for various warehouse performance area optimization. It also presents a separate budget for tools and technologies such as inventory management systems, order tracking systems, transportation management systems, fleet management software, and shipment scheduling software. Boost your pitch with our creative Budget Allocation For Warehouse Performance Optimization Designs PDF. Deliver an awe-inspiring pitch that will mesmerize everyone. Using these presentation templates you will surely catch everyones attention. You can browse the ppts collection on our website. We have researchers who are experts at creating the right content for the templates. So you do not have to invest time in any additional work. Just grab the template now and use them.
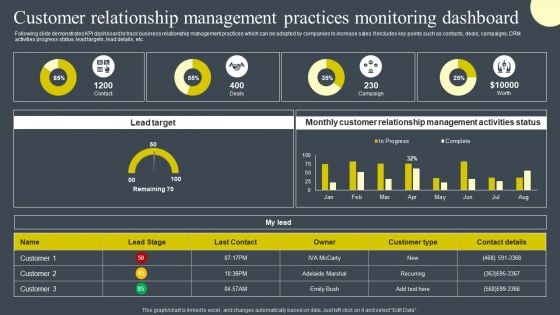
Customer Relationship Management Practices Monitoring Dashboard Designs PDF
Following slide demonstrates KPI dashboard to track business relationship management practices which can be adopted by companies to increase sales. It includes key points such as contacts, deals, campaigns, CRM activities progress status, lead targets, lead details, etc. Are you in need of a template that can accommodate all of your creative concepts This one is crafted professionally and can be altered to fit any style. Use it with Google Slides or PowerPoint. Include striking photographs, symbols, depictions, and other visuals. Fill, move around, or remove text boxes as desired. Test out color palettes and font mixtures. Edit and save your work, or work with colleagues. Download Customer Relationship Management Practices Monitoring Dashboard Designs PDF and observe how to make your presentation outstanding. Give an impeccable presentation to your group and make your presentation unforgettable.
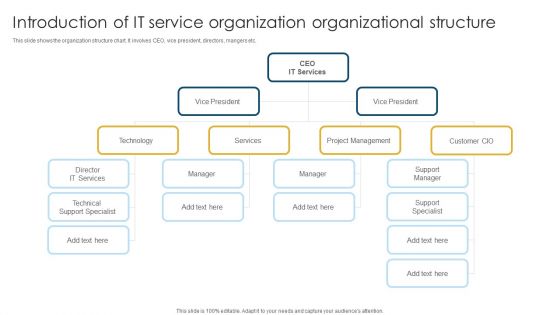
Introduction Of IT Service Organization Organizational Structure Designs PDF
This slide shows the organization structure chart. It involves CEO, vice president, directors, mangers etc. Persuade your audience using this Introduction Of IT Service Organization Organizational Structure Designs PDF. This PPT design covers two stages, thus making it a great tool to use. It also caters to a variety of topics including Vice President, Project Management, Technical Specialist. Download this PPT design now to present a convincing pitch that not only emphasizes the topic but also showcases your presentation skills.
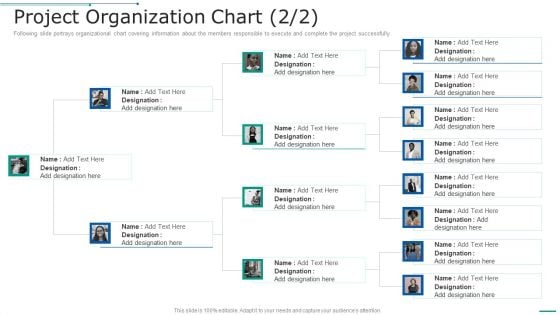
PMP Toolkit Project Organization Chart Project Ppt Pictures Tips PDF
This slide illustrates organizational chart covering information about the members responsible to execute and complete the project successfully. Presenting pmp toolkit project organization chart project ppt pictures tips pdf to provide visual cues and insights. Share and navigate important information on two stages that need your due attention. This template can be used to pitch topics like project organization chart. In addtion, this PPT design contains high resolution images, graphics, etc, that are easily editable and available for immediate download.

Implementing Strategies To Enhance Organizational Hierarchy Chart For Supermarket Chain
This slide covers hierarchy chart for supermarket or grocery store. It involves regional managers, merchandising, public relations and vice president distribution. Take your projects to the next level with our ultimate collection of Implementing Strategies To Enhance Organizational Hierarchy Chart For Supermarket Chain. Slidegeeks has designed a range of layouts that are perfect for representing task or activity duration, keeping track of all your deadlines at a glance. Tailor these designs to your exact needs and give them a truly corporate look with your own brand colors they will make your projects stand out from the rest This slide covers hierarchy chart for supermarket or grocery store. It involves regional managers, merchandising, public relations and vice president distribution.
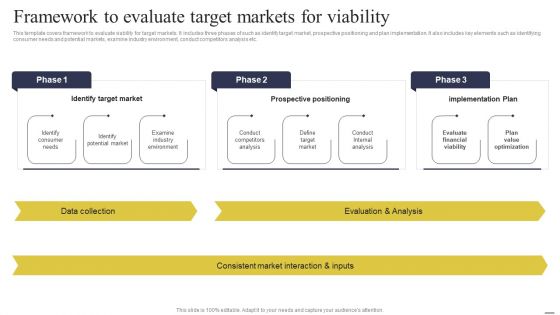
Defining Generic Target Marketing Techniques Framework To Evaluate Target Markets For Viability Clipart PDF
This template covers framework to evaluate viability for target markets. It includes three phases of such as identify target market, prospective positioning and plan implementation. It also includes key elements such as identifying consumer needs and potential markets, examine industry environment, conduct competitors analysis etc. Boost your pitch with our creative Defining Generic Target Marketing Techniques Framework To Evaluate Target Markets For Viability Clipart PDF. Deliver an awe inspiring pitch that will mesmerize everyone. Using these presentation templates you will surely catch everyones attention. You can browse the ppts collection on our website. We have researchers who are experts at creating the right content for the templates. So you do not have to invest time in any additional work. Just grab the template now and use them.
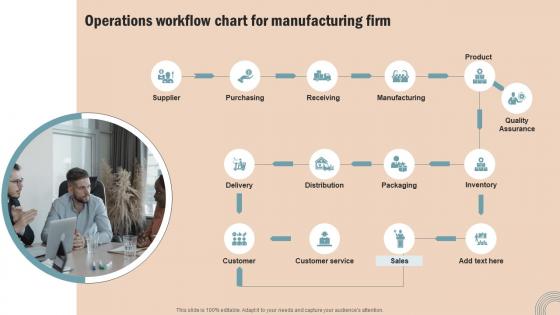
Operations Workflow Chart Operations Strategy Improve Business Productivity Slides Pdf
Presenting this PowerPoint presentation, titled Operations Workflow Chart Operations Strategy Improve Business Productivity Slides Pdf, with topics curated by our researchers after extensive research. This editable presentation is available for immediate download and provides attractive features when used. Download now and captivate your audience. Presenting this Operations Workflow Chart Operations Strategy Improve Business Productivity Slides Pdf. Our researchers have carefully researched and created these slides with all aspects taken into consideration. This is a completely customizable Operations Workflow Chart Operations Strategy Improve Business Productivity Slides Pdf that is available for immediate downloading. Download now and make an impact on your audience. Highlight the attractive features available with our PPTs. Our Operations Workflow Chart Operations Strategy Improve Business Productivity Slides Pdf are topically designed to provide an attractive backdrop to any subject. Use them to look like a presentation pro.
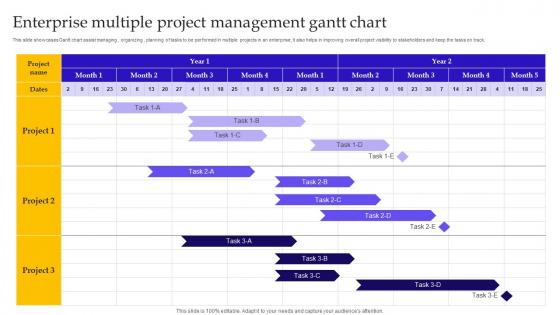
Enterprise Multiple Project Management Gantt Chart Elements Pdf
This slide showcases Gantt chart assist managing, organizing, planning of tasks to be performed in multiple projects in an enterprise, it also helps in improving overall project visibility to stakeholders and keep the tasks on track. Showcasing this set of slides titled Enterprise Multiple Project Management Gantt Chart Elements Pdf. The topics addressed in these templates are Enterprise Multiple Project, Management Gantt Chart, Planning Of Tasks. All the content presented in this PPT design is completely editable. Download it and make adjustments in color, background, font etc. as per your unique business setting. This slide showcases Gantt chart assist managing, organizing, planning of tasks to be performed in multiple projects in an enterprise, it also helps in improving overall project visibility to stakeholders and keep the tasks on track.
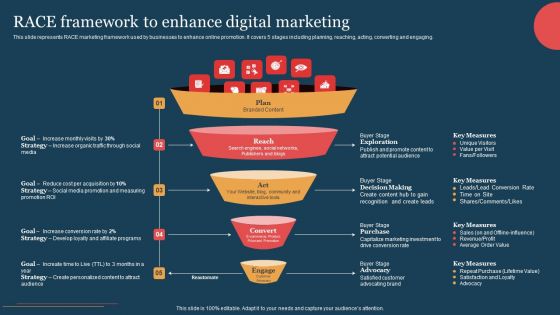
RACE Framework To Enhance Digital Marketing Portrait PDF
This slide represents RACE marketing framework used by businesses to enhance online promotion. It covers 5 stages including planning, reaching, acting, converting and engaging. Are you searching for a RACE Framework To Enhance Digital Marketing Portrait PDF that is uncluttered, straightforward, and original Its easy to edit, and you can change the colors to suit your personal or business branding. For a presentation that expresses how much effort you have put in, this template is ideal With all of its features, including tables, diagrams, statistics, and lists, its perfect for a business plan presentation. Make your ideas more appealing with these professional slides. Download RACE Framework To Enhance Digital Marketing Portrait PDF from Slidegeeks today.
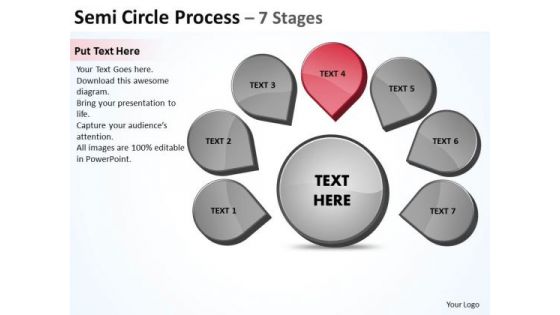
Seven Steps Business PowerPoint Templates Download Strategy Ppt Venn Diagram Slides
We present our seven steps business powerpoint templates download strategy ppt Venn Diagram Slides.Present our Process and Flows PowerPoint Templates because your listeners do not have to put on their thinking caps. Download our Finance PowerPoint Templates because you envisage some areas of difficulty in the near future. The overall financial situation could be a source of worry. Use our Circle Charts PowerPoint Templates because the Venn graphic comprising interlinking circles geometrically demonstate how various functions operating independantly, to a large extent, are essentially interdependant. Download and present our Shapes PowerPoint Templates because there are so many different pieces to the puzzle. Use our Marketing PowerPoint Templates because networking is an imperative in todays world. You need to access the views of others. Similarly you need to give access to them of your abilities.Use these PowerPoint slides for presentations relating to Business, chart, color, concept, connect, connection, corporate, data, design, diagram, financial, flow, flowchart, glassy, glossy, group, important, organize, plan, process, teamwork. The prominent colors used in the PowerPoint template are Pink, Gray, White. The feedback we get is that our seven steps business powerpoint templates download strategy ppt Venn Diagram Slides are Wistful. Customers tell us our connect PowerPoint templates and PPT Slides are designed by professionals Professionals tell us our seven steps business powerpoint templates download strategy ppt Venn Diagram Slides are Glamorous. Customers tell us our data PowerPoint templates and PPT Slides help you meet deadlines which are an element of today's workplace. Just browse and pick the slides that appeal to your intuitive senses. Use our seven steps business powerpoint templates download strategy ppt Venn Diagram Slides are the best it can get when it comes to presenting. Professionals tell us our design PowerPoint templates and PPT Slides are Fancy. Your thoughts will be engraved in the minds of your audience. Our Seven Steps Business PowerPoint Templates Download Strategy Ppt Venn Diagram Slides will etch them in.
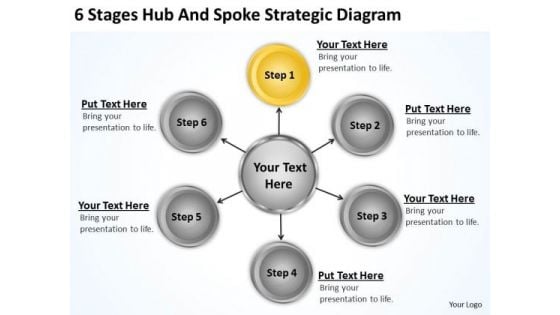
PowerPoint Graphics Business 6 Stages Hub And Spoke Strategic Diagram Ppt Templates
We present our Powerpoint Graphics Business 6 Stages Hub And Spoke Strategic Diagram Ppt Templates.Download our Arrows PowerPoint Templates because It will get your audience in sync. Present our Business PowerPoint Templates because You can Stir your ideas in the cauldron of our PowerPoint Templates and Slides. Cast a magic spell on your audience. Download and present our Circle Charts PowerPoint Templates because You have the co-ordinates for your destination of success. Let our PowerPoint Templates and Slides map out your journey. Present our Shapes PowerPoint Templates because You can Inspire your team with our PowerPoint Templates and Slides. Let the force of your ideas flow into their minds. Use our Process and Flows PowerPoint Templates because It is Aesthetically crafted by artistic young minds. Our PowerPoint Templates and Slides are designed to display your dexterity.Use these PowerPoint slides for presentations relating to 3d, Act, Arrow, Blue, Business, Chart, Circle, Concept, Control, Cycle, Design, Development, Diagram, Evaluate, Flow, Flow-Chart, Flowchart, Fresh, Graphic, Green, Idea, Management, Method, Model, Orange, Process, Purple, Quality, Rainbow, Red, Research, Schema, Spiral, Step, Strategy, Success, System, Vector, White, Work, Workflow, Yellow. The prominent colors used in the PowerPoint template are Gray, Black, White. Give a good account with our PowerPoint Graphics Business 6 Stages Hub And Spoke Strategic Diagram Ppt Templates. Put your views across with clarity.
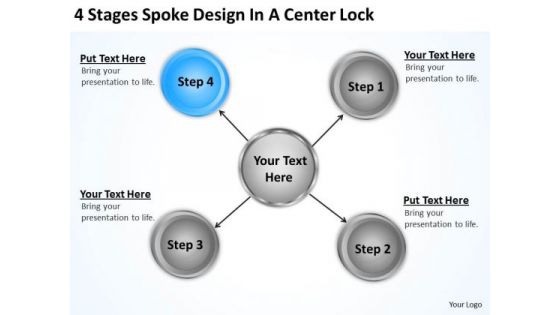
Work Flow Business Process Diagram Lock Ppt PowerPoint Templates Backgrounds For Slides
We present our Work Flow Business Process Diagram Lock Ppt Powerpoint Templates Backgrounds For Slides.Download our Arrows PowerPoint Templates because You can Double your output with our PowerPoint Templates and Slides. They make beating deadlines a piece of cake. Use our Business PowerPoint Templates because Our PowerPoint Templates and Slides are designed to help you succeed. They have all the ingredients you need. Use our Circle Charts PowerPoint Templates because Our PowerPoint Templates and Slides are the chords of your song. String them along and provide the lilt to your views. Download our Shapes PowerPoint Templates because You can Bait your audience with our PowerPoint Templates and Slides. They will bite the hook of your ideas in large numbers. Present our Process and Flows PowerPoint Templates because Our PowerPoint Templates and Slides will let Your superior ideas hit the target always and everytime.Use these PowerPoint slides for presentations relating to 3d, Act, Arrow, Blue, Business, Chart, Circle, Concept, Control, Cycle, Design, Development, Diagram, Evaluate, Flow, Flow-Chart, Flowchart, Fresh, Graphic, Green, Idea, Management, Method, Model, Orange, Process, Purple, Quality, Rainbow, Red, Research, Schema, Spiral, Step, Strategy, Success, System, Vector, White, Work, Workflow, Yellow. The prominent colors used in the PowerPoint template are Blue, Gray, Black. Meet your targets with our Work Flow Business Process Diagram Lock Ppt PowerPoint Templates Backgrounds For Slides. You will come out on top.


 Continue with Email

 Home
Home


